Sample Category Title
USD/JPY Outlook: Bears Hold Grip and Crack Pivotal Support Zone
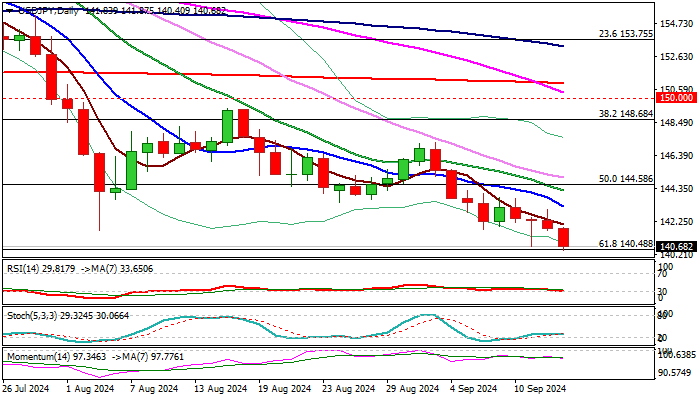
USDJPY remains firmly in red and cracked pivotal Fibo level at 140.48 (61.8% retracement of 127.22/161.95), the upper boundary of 140.48/00 key support zone, after renewed weakness in past two days fully offset positive signal from Wednesday’s long-tailed daily candlestick.
The pair is on track for another weekly loss, with long upper shadow on weekly candlestick, pointing to strong offers and adding to downside prospects.
Technical picture on daily chart is firmly bearish (strong negative momentum / price weighed by descending daily Ichimoku cloud / MA’s in bearish setup with formation of 55/200DMA death-cross, reinforcing negative outlook).
Firm break of 140.48/40 pivots will be increasingly bearish and risk extension towards 137.23 trough (July 2023 low).
Falling 10DMA (143.22) should cap extended upticks and keep larger bears intact.
Res: 141.68; 142.08; 143.04; 143.22.
Sup: 140.25; 140.00; 138.60; 137.23.
Euro Rises After ECB Cuts Interest Rates
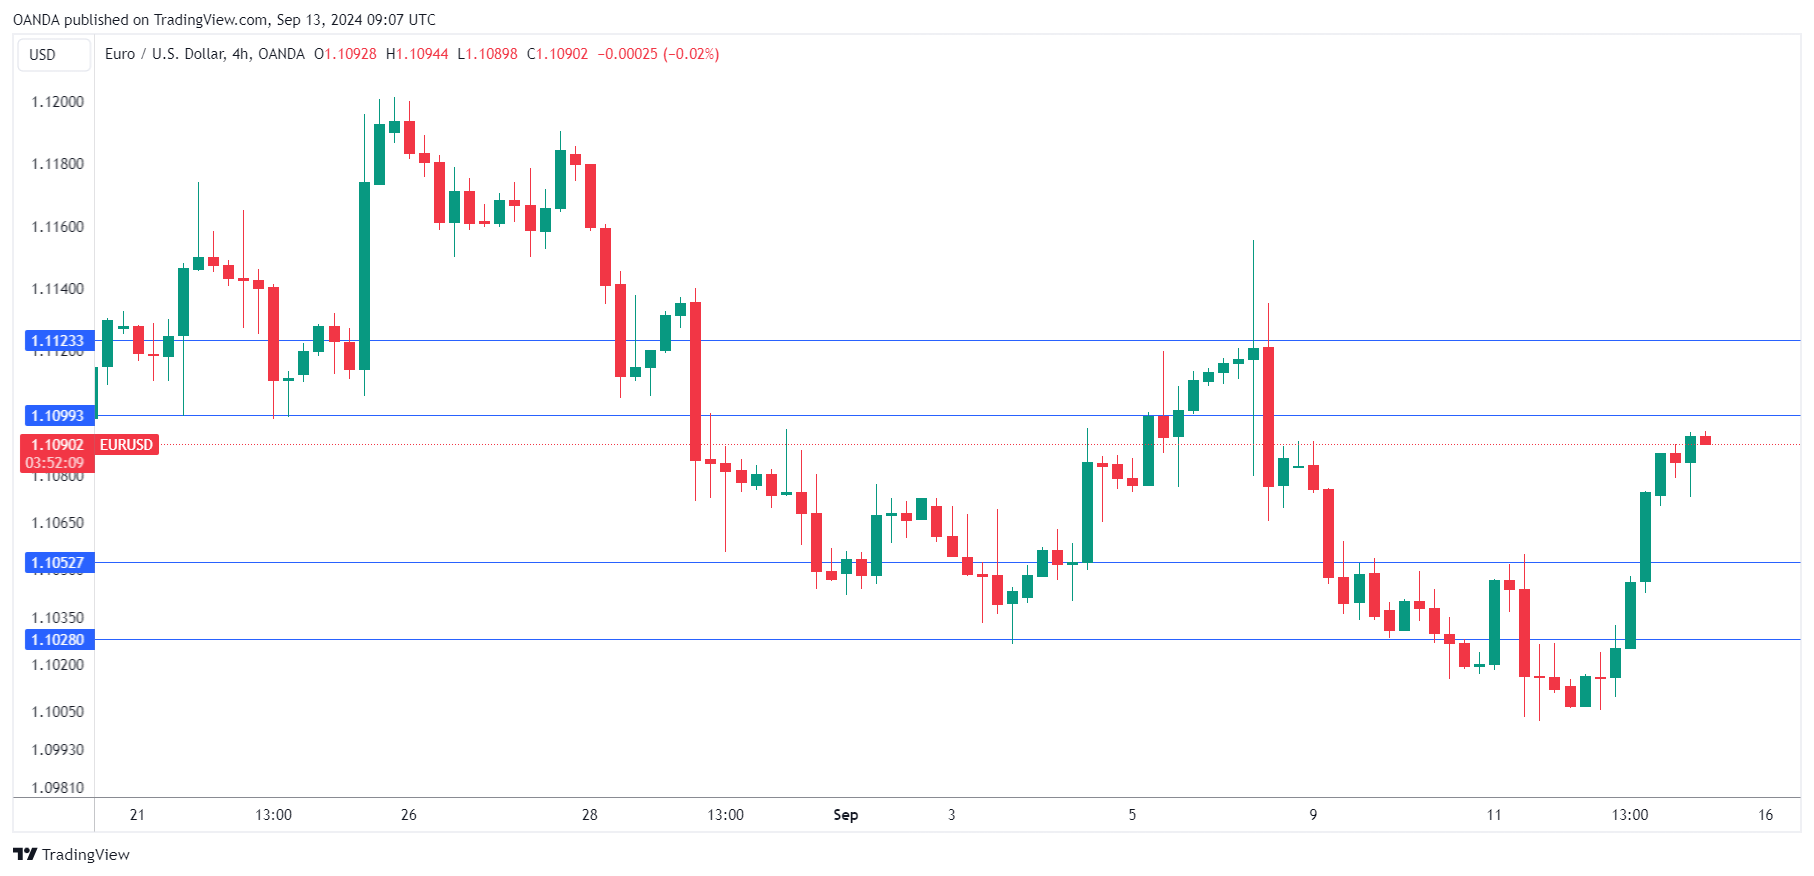
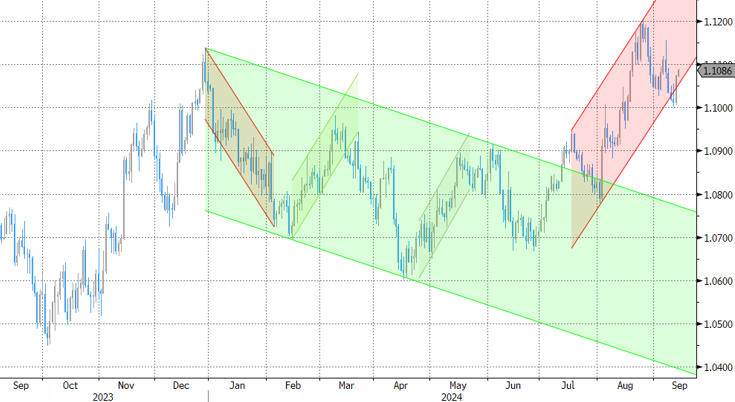
The euro has extended its gains on Friday. EUR/USD is trading at 1.1091 in the European session at the time of writing, up 0.13% today. The euro has climbed 0.7% since the ECB’s rate cut on Thursday.
ECB lowers rates to 3.5%
The European Central Bank delivered as expected on Thursday, trimming the key interest rate by 25 basis points to 3.5%. This was the second rate cut in the current rate-lowering cycle, as the ECB responded to falling inflation and a deteriorating eurozone economy.
The war against inflation is largely won, which enabled the ECB to deliver the rate cut. Inflation in the eurozone has dropped to 2.2%, close to the target of 2%. The ECB updated inflation forecast was unchanged from June, with inflation expected to average 2.5% in 2024 and 2.2% in 2025
At a press conference, ECB President Lagarde reiterated that rate decisions would be made “meeting by meeting” based on economic data, essentially ditching forward guidance. Lagarde sounded somewhat hawkish, noting that wage growth remains high and the labor market is still resilient. The ECB is being cautious and has signaled it will take a slow approach to further cuts and the markets are looking at a cut in December. If economic conditions suddenly worsen, the central bank would have to consider a rate cut next month.
The Federal Reserve meets next week and rate cut odds continue to swing wildly. The US producer price index eased to 1.7% y/y in August, down from a downwardly revised 2.1% in July and below the market estimate of 1.8%. This sent the odds of a half-point cut soaring to 41%, up from just 13% yesterday, according the CME’s FedWatch. The Fed meeting is live, with plenty of uncertainty as whether the Fed will cut by 25 or 50 basis points.
EUR/USD Technical
- EUR/USD faces resistance at 1.1099 and 1.1123
- There is support at 1.1052 and 1.1028
Gold: Fifth Wave in Progress
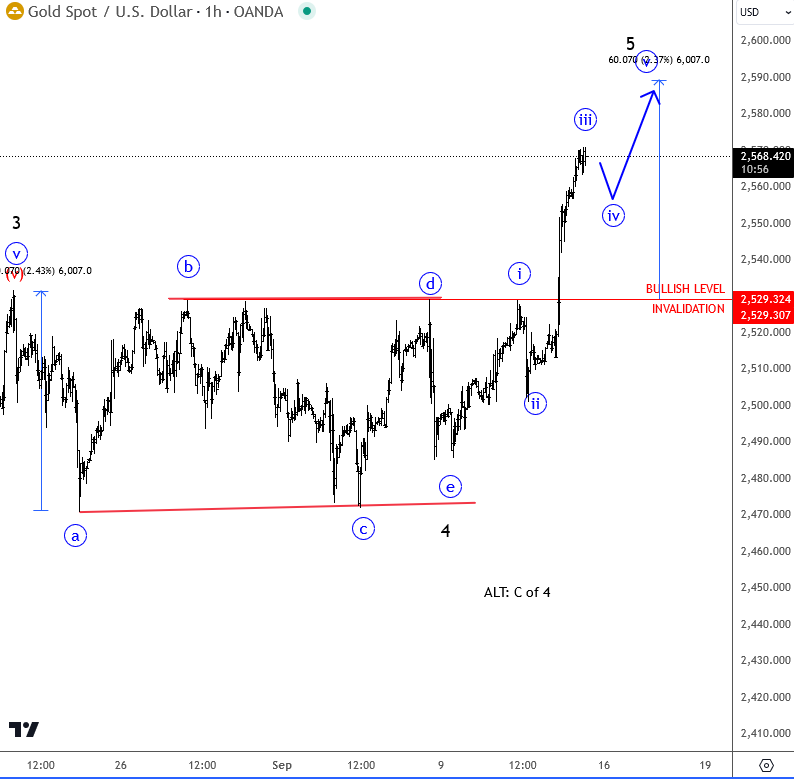
Gold finally broke to the upside yesterday, moving sharply through the 2529 level and out of the consolidation we've been tracking in wave four for the last two weeks. So far, we’re seeing a nice extension to the upside, which suggests that wave five is in progress. However, it should be subdivided into five sub-waves before we can call an end to the uptrend. Ideally, we’ll see another leg higher after the next fourth- subwave retracement, with 2590 to 2600 as the next upside projection and potentially strong resistance for the entire fifth wave.
If you're looking to join the trend here, keep in mind that it might be a bit late, especially since moves out of a triangle are final in a higher degree sequnce, and that market is ready to turn, when least expected.
Drop back below 2529 will signal for a top.
GBPJPY Makes a Backflip, But Patience Needed
- GBPJPY resumes negative momentum, but hopes for a pivot remain
- Sellers need a close below 185.65 to take full control
GBPJPY came under renewed downside pressure after closing Thursday’s session with mild gains around 186.00.
The pair shifted from a recent low of 183.70 earlier this week, forming a hammer candlestick and giving hope for a potential upward reversal. If the bears manage to close below 185.00-185.65 today, the candlestick pattern may not be a reliable signal despite the RSI and stochastic oscillator being near oversold levels.
A continuation lower could retest August’s base of 183.00, while slightly beneath that, the price could meet the support trendline, which joins the lows from 2022 and 2024 at 182.00. Breaking that floor too, the sell-off could pick up steam towards the 180 psychological level or closer to the extension of the ascending trendline last seen in Q1 2023 at 179.00.
To improve the short-term outlook above September’s high of 193.46, the bulls will have to put in a lot of effort. The 20-day exponential moving average (EMA) could be the first obstacle near 188.20. Then, some congestion might occur around 189.84, where the 61.8% Fibonacci retracement of the 2024 uptrend is placed. Further up, the door will open for the 50- and 200-day EMAs currently seen around 191.64.
Overall, GBPJPY has not escaped downside risks, though it could postpone any further selling if it manages to close above 185.00-185.65 once again.

Gold Price Hits New Record
As shown by the XAU/USD chart:
→ Gold has reached a new all-time high;
→ This morning, gold is trading around $2,567 per ounce.
Bullish sentiment is being driven by expectations of a Federal Reserve rate cut next week. According to MoneyControl, the International Monetary Fund stated on Thursday that it would be "appropriate" for the Fed to start its long-awaited monetary easing cycle at its meeting next week, as inflation risks have eased.
On 6 September, we analysed the gold price chart and identified:
→ an ascending channel (shown in blue);
→ two resistance lines forming a “bullish flag” pattern.
Gold’s surge to a new all-time high has broken through the “bullish flag,” suggesting a potential resumption of the rally. How successful could this be?
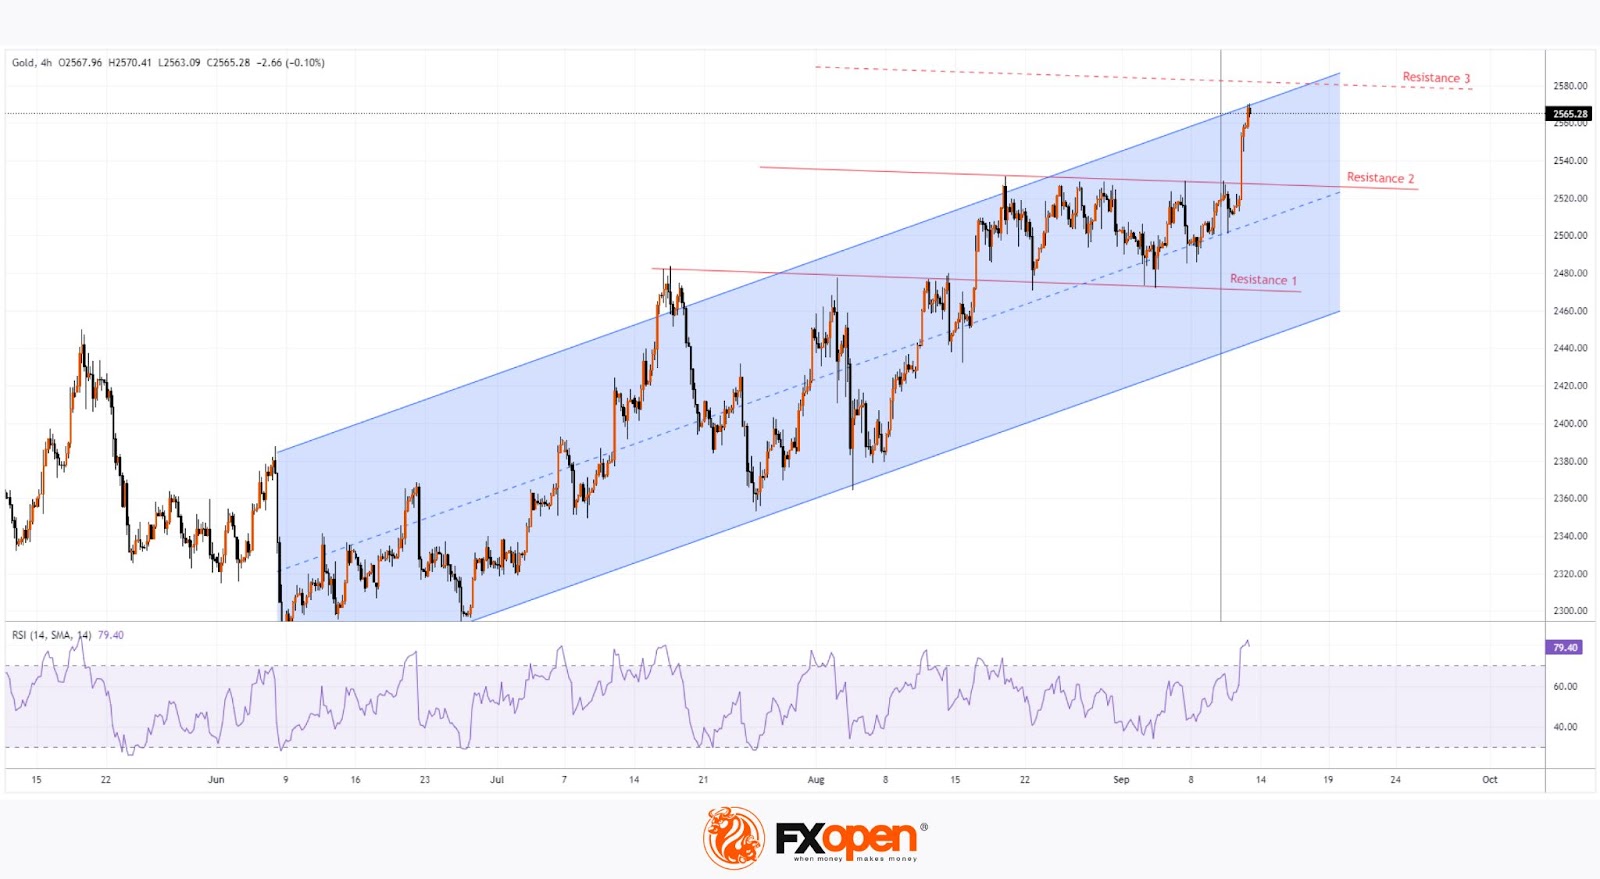
Technical analysis of the XAU/USD chart today shows that the price is approaching resistance levels formed by:
→ the upper boundary of the blue channel;
→ Resistance line 3, which can be viewed as the target following the breakout of resistances 1 and 2, according to technical analysis principles.
Therefore, gold has limited potential for further growth due to the proximity of these resistance levels. It's worth noting that the RSI is in the overbought zone, which could encourage bulls to take profits at this historic peak.
Given these factors, the market may be vulnerable to a correction. However, the key influence will be the actual decision from the Fed, which will be announced next Wednesday.
Start trading commodity CFDs with tight spreads. Open your trading account now or learn more about trading commodity CFDs with FXOpen.
This article represents the opinion of the Companies operating under the FXOpen brand only. It is not to be construed as an offer, solicitation, or recommendation with respect to products and services provided by the Companies operating under the FXOpen brand, nor is it to be considered financial advice.
DAX 40 Reacts Positively to ECB’s Rate Cut Decision
Yesterday, the European Central Bank’s Governing Council cut the refinancing rate, as expected, from 4.25% to 3.65%.
The ECB also stated that monetary policy would remain sufficiently restrictive "for as long as necessary" to ensure inflation returns to its medium-term target of 2%.
Financial markets responded with:
→ A strengthening of the euro. EUR/USD rose by more than 0.5% after the rate cut announcement.
→ A rise in European stock market indices.
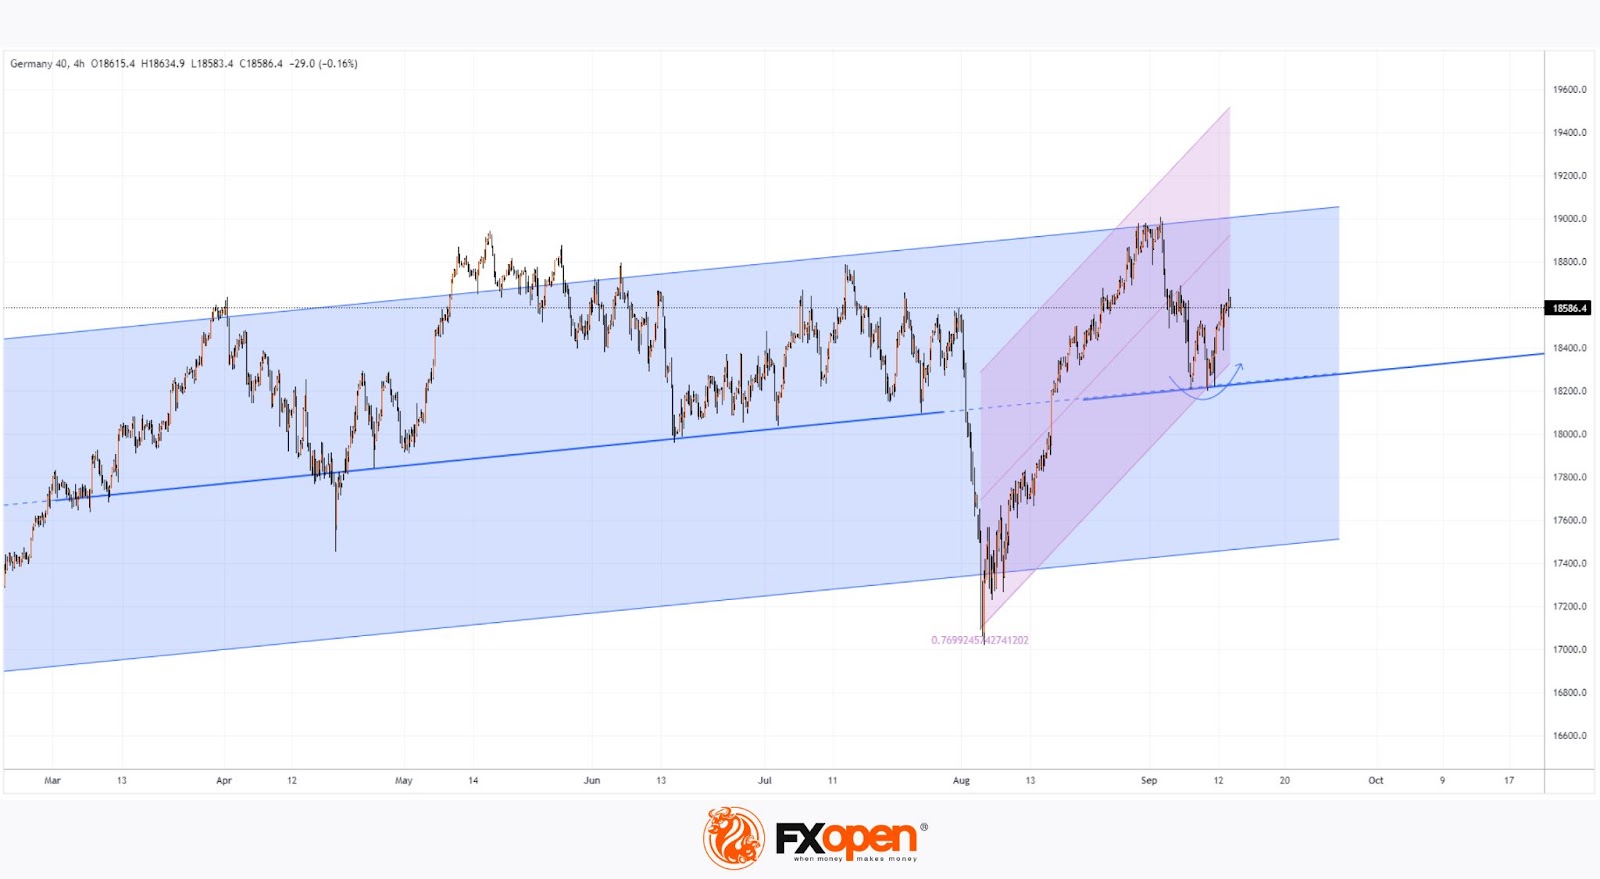
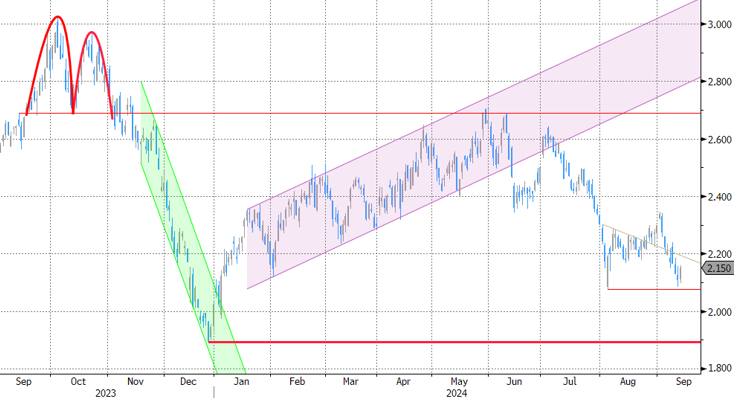
For example, Germany's DAX 40 index (Germany 40 mini on FXOpen) received a bullish boost, which supports more optimistic conclusions in today's technical analysis:
→ Price movement fits within the ascending channel shown in blue.
→ The thickened line highlights that the median of the channel repeatedly acted as support before early August. As indicated by the arrow, it regained this role after the sharp decline on 5 August.
→ The linear regression channel (shown in purple) points to upward momentum.
Investors may feel optimistic, expecting that this autumn demand forces could lift the DAX 40 (Germany 40 mini on FXOpen) towards the upper boundary of the channel.
Trade global index CFDs with zero commission and tight spreads. Open your FXOpen account now or learn more about trading index CFDs with FXOpen.
This article represents the opinion of the Companies operating under the FXOpen brand only. It is not to be construed as an offer, solicitation, or recommendation with respect to products and services provided by the Companies operating under the FXOpen brand, nor is it to be considered financial advice.
Eurozone industrial production falls -0.3% mom in Jul, weighed down by capital and durable consumer goods
Eurozone industrial production fell by -0.3% mom in July, missing expectations of 0.2% mom rise. The decline was driven by significant drops in production across key sectors: intermediate goods fell by -1.3%, capital goods by -1.6%, and durable consumer goods by -2.8%. On the positive side, energy production saw a slight increase of 0.3%, while non-durable consumer goods rose by 1.8%.
In the broader EU, industrial production slipped by -0.1% momh. Notably, Malta (-5.5%), Estonia (-4.8%), and Romania (-3.4%) reported the largest production declines. Conversely, Ireland led gains with a robust +9.2% increase, followed by Croatia at +8.0% and Belgium at +7.3%.
ECB officials stress data-driven approach as inflation and growth weigh on policy
ECB officials shared varied perspectives on the economic outlook and monetary policy today, following yesterday’s 25bps rate cut. This move was largely anticipated as ECB continues its cautious approach to address both inflation and slowing growth.
ECB Deputy Governor Olli Rehn highlighted the "good reasons" behind the rate cut, amid declining inflation. He also stressed that "current uncertainties further emphasize the dependence on fresh data and analysis" to guide policy decisions.
Bundesbank President Joachim Nagel, another member of the Governing Council, struck a positive tone, stating, "We assume that core inflation will improve, especially with the declining wage trend in the eurozone." He added that in Germany, "things are moving in the right direction."
Meanwhile, Bank of France President François Villeroy de Galhau acknowledged the challenges posed by weaker-than-expected activity data, particularly in France. However, he maintained a cautious outlook, noting the potential for "a very gradual recovery" beyond the short-term boost from the Olympics. He emphasized that the pace of monetary easing "has to be highly pragmatic" and that ECB "keeps full optionality" for future meetings.
Bank of Slovenia President Bostjan Vasle reiterated ECB's data-dependent approach, adding that "we are not committed to any predetermined rate path," with inflation still largely driven by core components and services.
Bank of Estonia Governor Madis Muller, echoing these views, expressed concerns over services inflation but noted growing confidence in the broader inflation outlook, despite expectations of a temporary acceleration.
USDCAD Flirts With 200-Day SMA Again
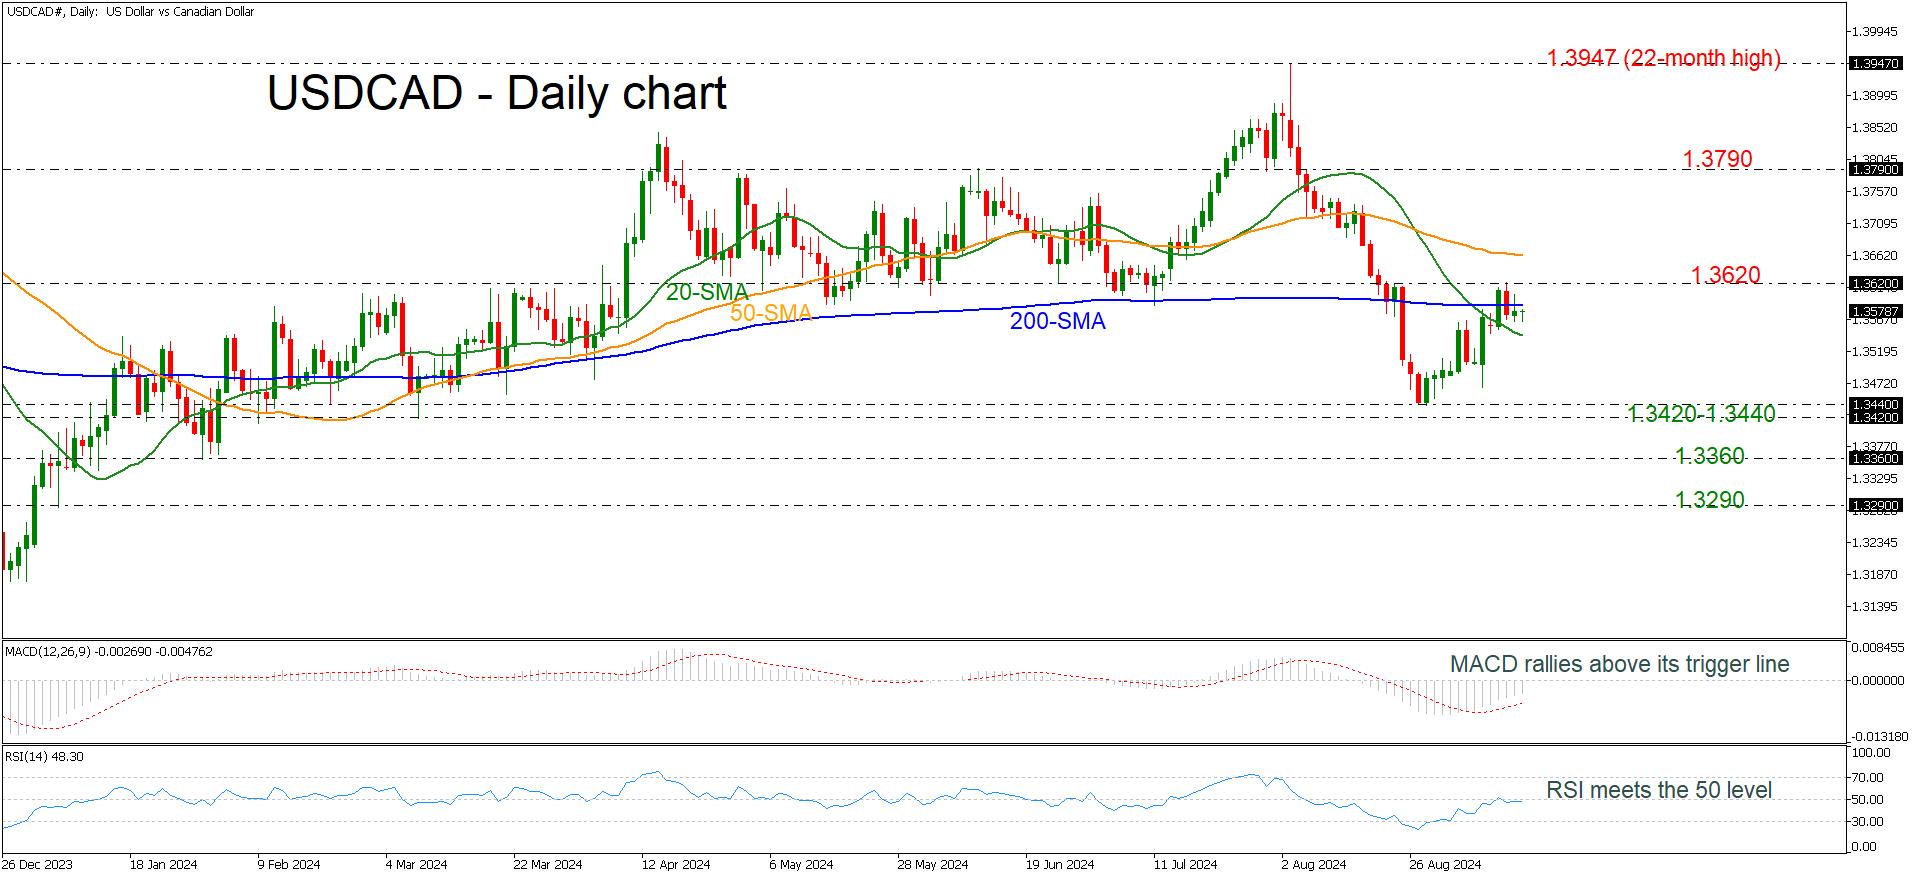
- USDCAD remains below 1.3600
- MACD and RSI indicate upside recovery
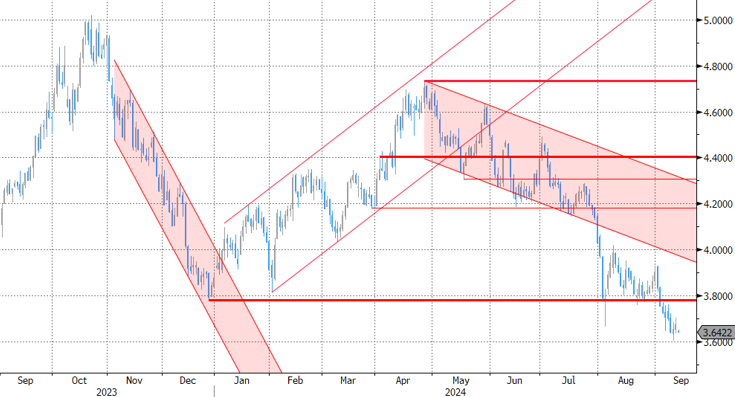
USDCAD is moving back and forth of the 200-day simple moving average, which is standing marginally beneath the 1.3600 round number. Earlier in the week, the market successfully travelled towards the 1.3620 bar, adding optimism for more bullish actions.
The technical oscillators are confirming an upside recovery after prices bounced off the 1.3440 support level. The MACD is holding above its trigger line in the negative region, while the RSI is trying to cross above the neutral threshold of 50.
If the pair maintains the buying interest, it may re-challenge the 1.3620 resistance level before touching the 50-day simple moving average (SMA) at 1.3660. Traders may also hit the 1.3790 resistance, taken from the inside swing low on July 31.
On the other hand, a dive beneath the 20-day SMA, which is currently near 1.3545, could send the bears towards the 1.3420-1.3440 support region. More downside pressure could endorse the bearish tendency, flirting with 1.3360.
All in all, USDCAD has been in a negative trend in the short term since the beginning of August, particularly after it printed a new low at 1.3420.
US Treasuries Rally Overnight With Front End of the Curve Outperforming.
Markets
The ECB cut its deposit rate by 25 bps to 3.5% while narrowing the gap between the deposit rate and the main refinancing rate from 50 bps to 15 bps as flagged in March. New growth and inflation forecasts barely changed from June. The ECB plots the same 2.5%-2.2%-1.9% average inflation path for the 2024-2026 period while marginally downwardly revising the now 0.8%-1.3%-1.5% growth trajectory for the same period. ECB Lagarde offered no guidance for the remaining two policy meetings, but a simple copy-paste from Q3 suggests skipping the October meeting to reduce key rates by 25 bps again when new growth/inflation forecasts are available. The short, 5-week, intermeeting period to October 17 provides the ECB with only one additional PMI survey and CPI report. The ECB president also acknowledged that inflation dynamics would accelerate going into year-end because of energy-related base effects (huge drops in energy prices in Q4 2023). EMU money markets currently attach a 50 bps probability to an October rate cut which we don’t expect to unfold. German Bunds underperformed US Treasuries yesterday as the ECB stuck to its very gradual approach. German yields rose by 3 bps (30-yr) to 7.3 bps (2-yr) while US yield changes ranged between -0.1 bp (2-yr) and +2.3 bps (30-yr). Relative short term interest rate dynamics lifted EUR/USD away from the psychologic 1.10 barrier to a close at 1.1075.
US Treasuries rally overnight with the front end of the curve outperforming. Placed (?) articles on the FT (“Fed wrestles with how aggressively to cut interest rates”) and the WSJ (“The Fed’s rate-cut dilemma: start big or small?”) reignite the debate which seemed to have been settled in favour of a 25 bps rate cut after this week’s upward core CPI surprise. US money markets are again completely split between 25 bps and 50 bps with US yields slipping 2.5 bps (30-yr) to 6.1 bps (2-yr) this morning. While the content of the articles shows arguments for both cases, it’s the timing that matters (in blackout period with markets positioned at 25 bps). We still favour a 50-50-50 scenario for the September-November-December meetings. USD loses more ground this morning with the trade-weighted dollar at risk of slipping below 101 and testing important support around 100.50.
News & Views
The UK’s Office for Budget Responsibility (OBR) yesterday issued its annually updated Fiscal Risks and Sustainability Report. It painted a dire long-term future for the country’s public finances, warning that debt will nearly triple from below 100% (relative to GDP) this year to over 270% in 50 years in a situation of no policy changes. The OBR said that higher spending on healthcare, pensions, the climate transition and interest costs combined with falling revenue from fuel duties will drive borrowing substantially higher. In the first decades of the 50 year forecasts, its especially the ageing population that drives up spending, with spiraling costs causing a snowball effect on debt interest. The fiscal watchdog estimates that this would result in a 19 ppt increase in the budget deficit between 2028-29 and 2073-74, with some 8.5 ppts of that rise attributed to higher interest costs. Health and pensioner spending add another 9.9 ppts. The gloomy report also dived into the matter of productivity growth. The OBR admitted in November last year that it has consistently been overoptimistic on potential productivity, producing economic and fiscal forecast errors. The baseline scenario assumes 1.5% productivity growth in the long term. But in an alternative scenario debt to GDP could rise to +/- 650% if productivity would only rise by 0.5%, slightly below the post-GFC 2010-2019 average.
The Indian central bank governor Shaktikanta Das signaled he’s in no rush to lower interest rates even as inflation has re-entered the 2-6% target range since September of last year. Das this morning said while that is the case, their target is 4%. Inflation over the past two months have dipped below that figure. August CPI released yesterday came in at 3.65% but that was largely due to statistical reasons. Das said that the central bank should not get carried away by these dips in inflation and warned against premature cuts given worries over food costs, even as last quarter’s growth dip to 6.7% raised the pressure somewhat. The RBI has been keeping rates steady for more than 18 months straight now. The weak Indian rupee is another reason to be cautious with the easing cycle. While strengthening a tad against the USD (USD/INR 83.93) this morning, the currency still trades just inches away from the record lows.
Graphs
GE 10y yield
The ECB cut policy rates by 25 bps in June and in September. Stubborn inflation (core, services) make follow-up moves less evident. We expect the central bank to stick with the quarterly reduction pace. Disappointing US and unconvincing EMU activity data dragged the long end of the curve down. The move accelerated during the early August market meltdown.
US 10y yield
The Fed in its July meeting paved the way for a first cut in September. It turned attentive to risks to the both sides of its dual mandate as the economy is moving to a better in to balance. The pivot weakened the technical picture in US yields. A string of weak eco data and a risk-off market climate pushed and kept the 10-yr sub 4%. We think we could be up to three 50 bps rate cuts this year.
EUR/USD
EUR/USD moved above the 1.09 resistance area as the dollar lost interest rate support at stealth pace. US recession risks and bets on fast and large rate cuts trumped traditional safe haven flows into USD. EUR/USD 1.1276 (2023 top) serves as next technical references.
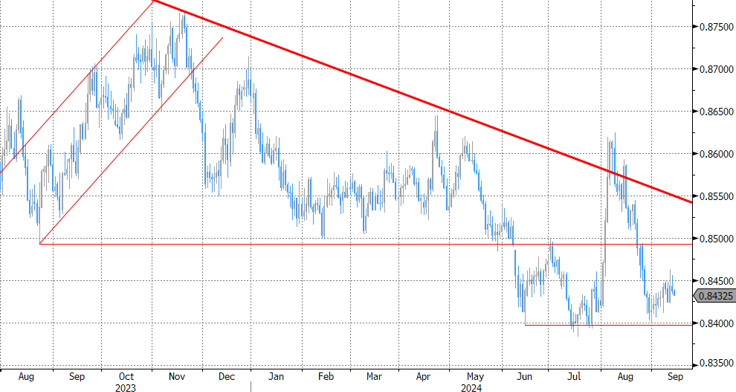
EUR/GBP
The BoE delivered a hawkish cut in August. Policy restrictiveness will be further unwound gradually on a pace determined by a broad range of data. The strategy similar to the ECB’s balances out EUR/GBP in a monetary perspective. Recent better UK activity data and a cautious assessment of BoE’s Bailey at Jackson Hole are pushing EUR/GBP lower in the 0.84/0.086 range.