Sample Category Title
AUD/USD Daily Report
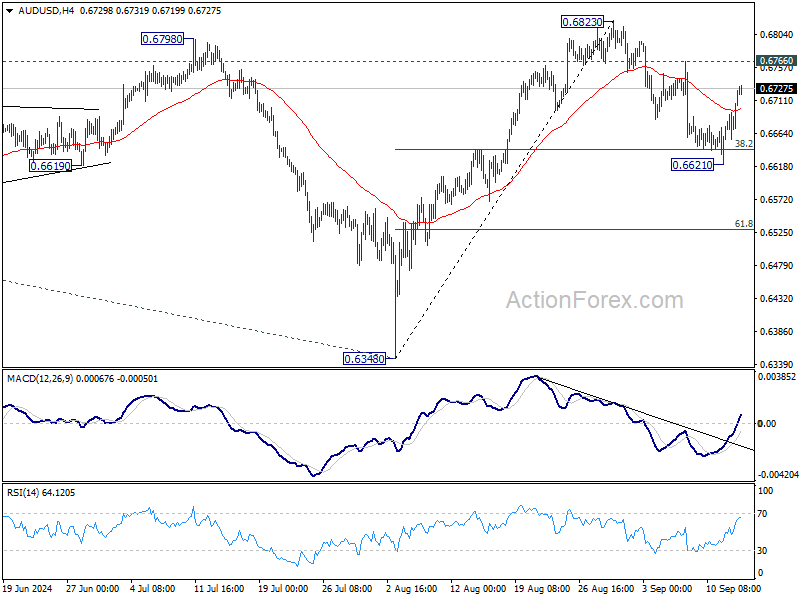
Daily Pivots: (S1) 0.6678; (P) 0.6702; (R1) 0.6747; More...
Intraday bias in AUD/USD remains neutral for the moment. Some more consolidations could still be seen. On the upside, break of 0.6766 resistance will suggest that pull back from 0.6823 has completed. Intraday bias will be back on the upside for 0.6823 and above. However, break of 0.6621 and sustained trading below 38.2% retracement of 0.6348 to 0.6823 at 0.6642 will target 61.8% retracement at 0.6529.
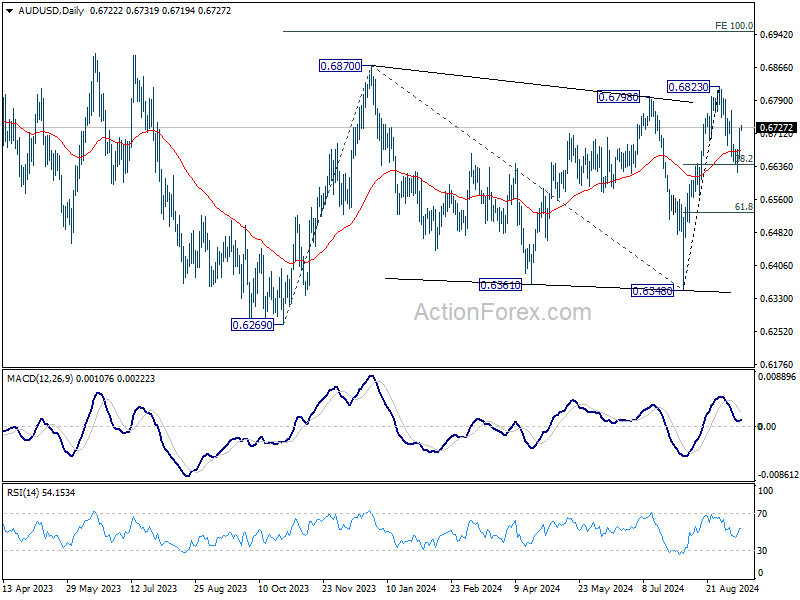
In the bigger picture, overall, price actions from 0.6169 (2022 low) are seen as a medium term corrective pattern, with rise from 0.6269 as the third leg. Firm break of 0.6798/6870 resistance zone will target 0.7156 resistance. In case of another fall, strong support should be seen from 0.6169/6361 to bring rebound.
EUR/USD Daily Outlook
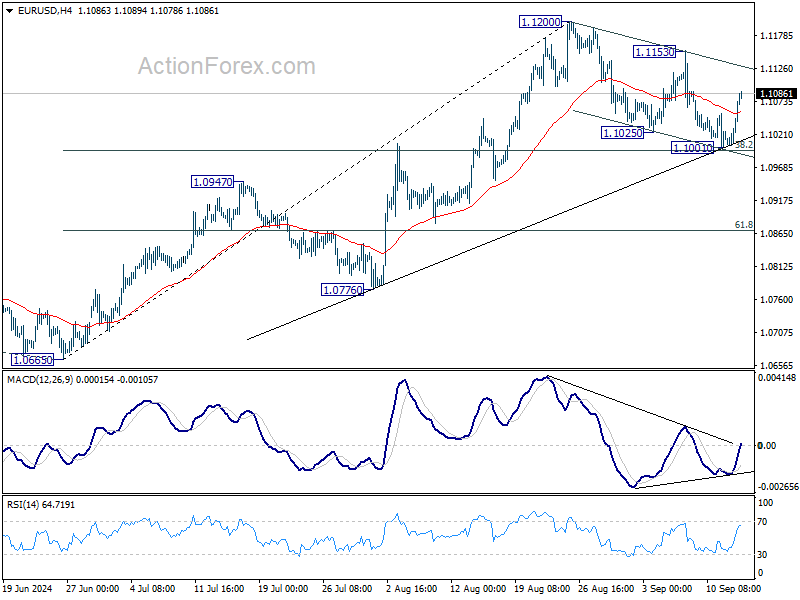
Daily Pivots: (S1) 1.1028; (P) 1.1052; (R1) 1.1099; More....
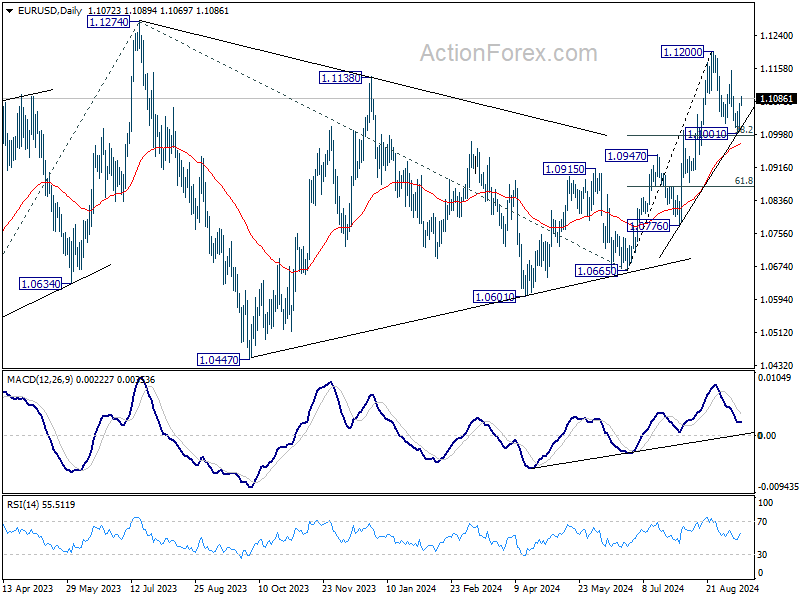
EUR/USD rebounded strongly ahead of 38.2% retracement of 1.0665 to 1.1200 at 1.0996 but stays below 1.1153 resistance. Intraday bias remains neutral first. Outlook stays bullish with 1.0996 intact. Break of 1.153 will suggest that larger rally is resuming through 1.1200 to 1.1274 key resistance. Nevertheless, sustained break of 1.0996 will indicate reversal and turn bias to the downside for 1.0947 resistance turned support next.
In the bigger picture, prior break of 1.1138 resistance indicates that corrective pattern from 1.1274 might have completed at 1.0665 already. Decisive break of 1.1274 (2023 high) will confirm whole up trend from 0.9534 (2022 low). Next target will be 61.8% projection of 0.9534 to 1.1274 from 1.0665 at 1.1740. This will now be the favored case as long as 1.0947 resistance turned support holds.
GBP/USD Daily Outlook
Daily Pivots: (S1) 1.3063; (P) 1.3095; (R1) 1.3159; More...
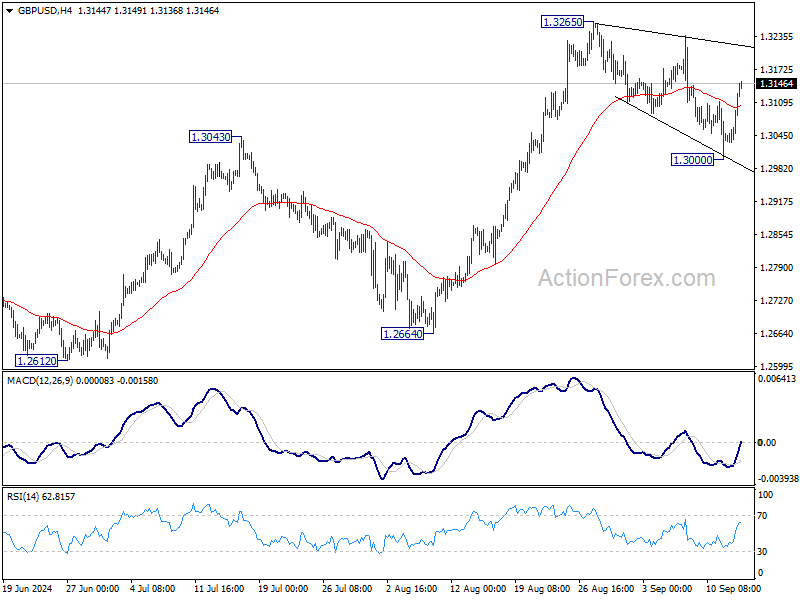
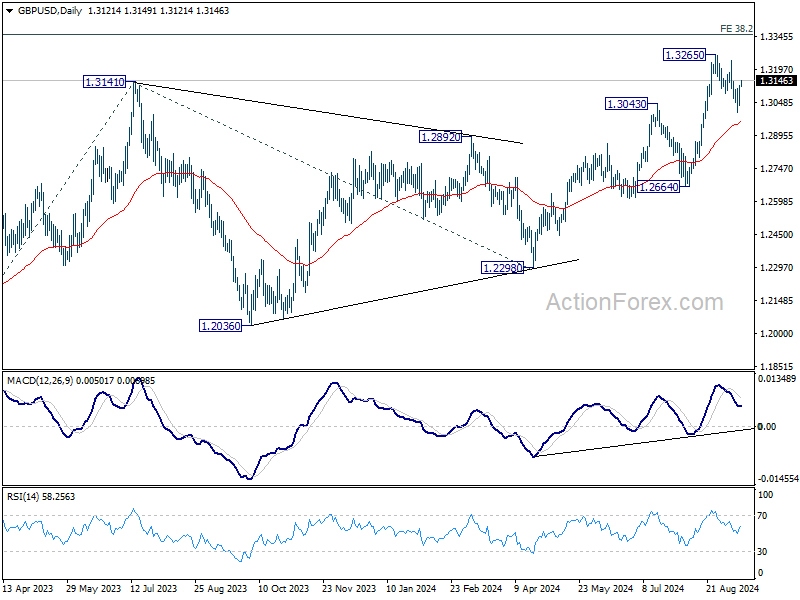
Intraday bias in GBP/USD is turned neutral first with current recovery. On the upside, firm break of 1.3265 resistance will resume larger rally to 1.3364 projection next. Nevertheless, break of 1.3000 will extend the correction from 1.3265 to 55 D EMA (now at 1.2962) and possibly below.
In the bigger picture, up trend from 1.0351 (2022 low) is in progress. Next target is 38.2% projection of 1.0351 to 1.3141 from 1.2298 at 1.3364. For now, outlook will stay bullish as long as 1.2664 support holds, even in case of deep pullback.
USD/CHF Daily Outlook
Daily Pivots: (S1) 0.8495; (P) 0.8523; (R1) 0.8539; More…
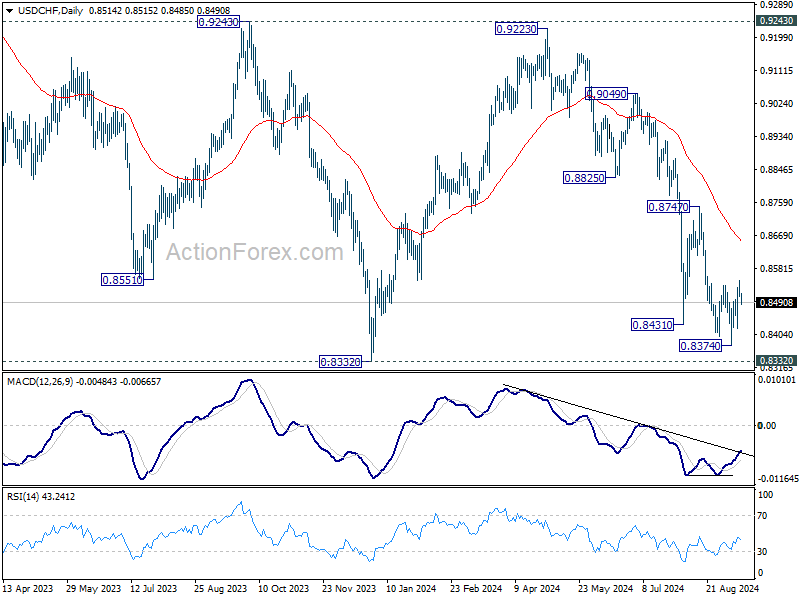
No change in USD/CHF's outlook with focus on 0.8536 resistance. Rejection by this resistance will retain near term bearishness. Break of 0.8374 will resume the fall from 0.9223 to retest 0.8332 low. Decisive break there will indicate larger down trend resumption. However, considering bullish convergence condition in 4H MACD, break of 0.8536 resistance will now confirm short term bottoming, and turn bias back to the upside for 0.8747 resistance.
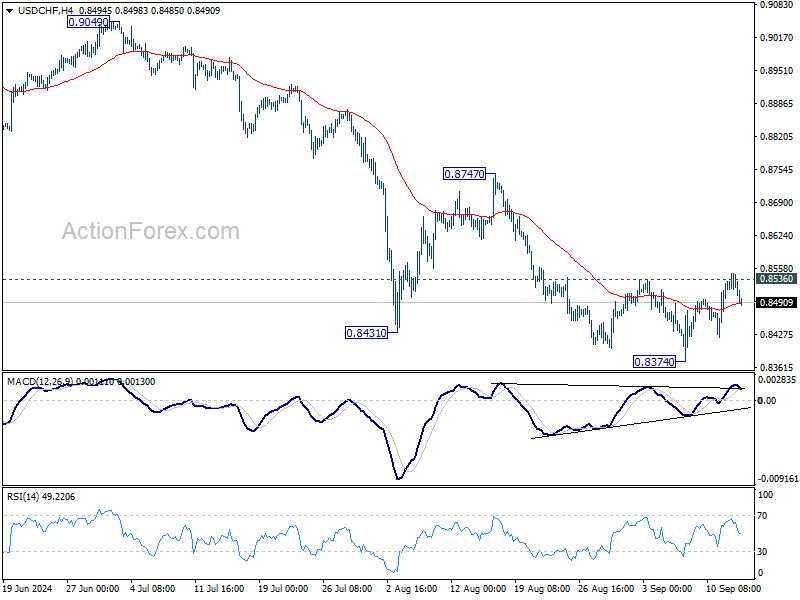
In the bigger picture, price actions from 0.8332 (2023 low) are currently seen as a medium term corrective pattern, with fall from 0.9223 as the second leg. Strong support could be seen from 0.8332 to bring rebound. Yet, overall outlook will continue to stay bearish as long as 0.9243 resistance holds. Firm break of 0.8332, however, will resume larger down trend from 1.0146 (2022 high).
Cliff Notes: Nerves Show on the Outlook
Key insights from the week that was.
The September Westpac-MI Consumer Sentiment survey once again emphasised the deep pessimism entrenched among Australian households, with the headline index ticking down –0.5% to 84.6. Concerns over the economic outlook are starting to have more of an impact on consumers’ attitudes, the sub-indexes tracking views on the economy down –2.6% and –1.0% respectively for the ‘one year ahead’ and ‘five years ahead’ measures.
Cost-of-living pressures are not as intense at the margin as they once were; however, ‘family finances vs a year ago’ and ‘family finances next 12 months’ remain 16.4pts and 9.7pts below their respective long-run averages.
Increasingly we are seeing a spillover of consumer weakness into the business sector. This was evident in the Q2 national accounts and is echoed by the latest NAB business survey. The business conditions index fell –3pts to +3, leaving the index in a clear downtrend from post-reopening highs. Highlighting the persistence of this trend, August was the 11th consecutive negative reading for forward orders; the employment index is at its lowest level since January 2022. It is not surprising then that business confidence slid from broadly neutral to pessimistic, down 5pts to –4.
Chief Economist Luci Ellis’ essay this week focuses on the implications of these developments for the growth outlook.
Offshore, there was plenty of data to guide views on the monetary policy outlook, particularly in the US ahead of next week’s FOMC meeting.
The US CPI rose 0.2% in August as expected, and 2.5% over the year. Core inflation was a touch stronger in the month at 0.3%, but in line with expectations for the year at 3.2%yr. Strength in the shelter component again accounted for the marginal upside surprise in core prices; however, market indicators of rents continue to point to a marked deceleration in shelter inflation over the coming year. Car prices were also less weak than in recent months, but goods prices continued to contract overall.
We continue to see CPI ex-shelter as the best gauge of underlying inflation, and consequently the outlook for policy. At August, annual CPI ex-shelter inflation was just 1.2%yr, having held either side of the 2.0%yr target since May 2023. The overall trend in prices should see the FOMC comfortable in reducing rates by 25bps at next week’s meeting, then following up with 25bp cuts at the next four meetings (to March 2025). Thereafter, we expect the pace of easing to slow to once per quarter and the fed funds rate to settle at 3.375% at end-2025. For our full analysis of the US and global economic outlook, see September Market Outlook.
The European Central Bank cut rates by another 25bps at their September meeting, as widely expected. Data was characterised as coming in as expected, limiting the need for revisions to their forecasts. Projections for headline inflation remain at 2.5% in 2024, 2.2% in 2025 and 1.9% in 2026. Core inflation was nudged up slightly in 2024 and 2025, reflecting the effect of persistent wage pressures on services inflation; though these pressures are expected to dissipate as labour demand moderates. Projections for activity growth were revised down by 0.1ppt to 0.8%yr in 2024, 1.3%yr in 2025 and 1.5%yr in 2026. In the statement and press conference, President Lagarde affirmed that the ECB was not on a predetermined path. Still, policy remains quite restrictive, and the ECB are confident they will achieve their mandate. We therefore expect another cut by year end and further modest easing in 2025.
In the UK, there were three crucial pieces of data ahead of the Bank of England's meeting next week. First, average weekly earnings decelerated to 5.1%yr in July, from 5.4%yr in June, reflecting easing labour market conditions. Further easing in wages will be welcomed, relieving concerns over a potential structural uplift in wage growth and services inflation, as expressed by BoE Committee member Catherine Mann. Immediate progress continues to be made with services inflation too, now 5.2%yr as of July. In considering the near term policy outlook, while services inflation remains elevated and the headline CPI rose in July, it was on to 2.2%yr, just above the BoE’s medium-term target. GDP meanwhile came in flat in July, and the industrial production detail released the same day also disappointed. Overall, the data flow appears to be moving in line with the BoE's views, setting the stage for another cut.
Finally, in China consumer prices lifted by 0.1ppt to 0.6%yr in August. The sub-1%yr reading continues to reflect entrenched weakness in consumer demand and also the impact of China’s continuing capacity expansion. Also highlighting the impact of capacity, as well as the recent deterioration in commodity prices, producer prices fell 1.8%yr in August compared to -0.8%yr in July. These price trends will persist as long as Chinese authorities and businesses seek to expand supply ahead of demand, potentially for some years yet.
USD/JPY Struggles To Rebound: What’s Holding It Back?
Key Highlights
- USD/JPY extended losses and tested the 140.70 level.
- A connecting bearish trend line is forming with resistance at 143.10 on the 4-hour chart.
- Gold surged above the $2,530 and $2,550 resistance levels.
- Oil might aim for a recovery wave toward the $70.00 level.
USD/JPY Technical Analysis
The US Dollar remained in a bearish zone below 145.00 against the Japanese Yen. USD/JPY extended losses below the 143.20 and 142.50 support levels.
Looking at the 4-hour chart, the pair tested the 140.70 level and settled well below the 100 simple moving average (red, 4-hour) and the 200 simple moving average (green, 4-hour). A low was formed at 140.70 and the pair is now consolidating losses.
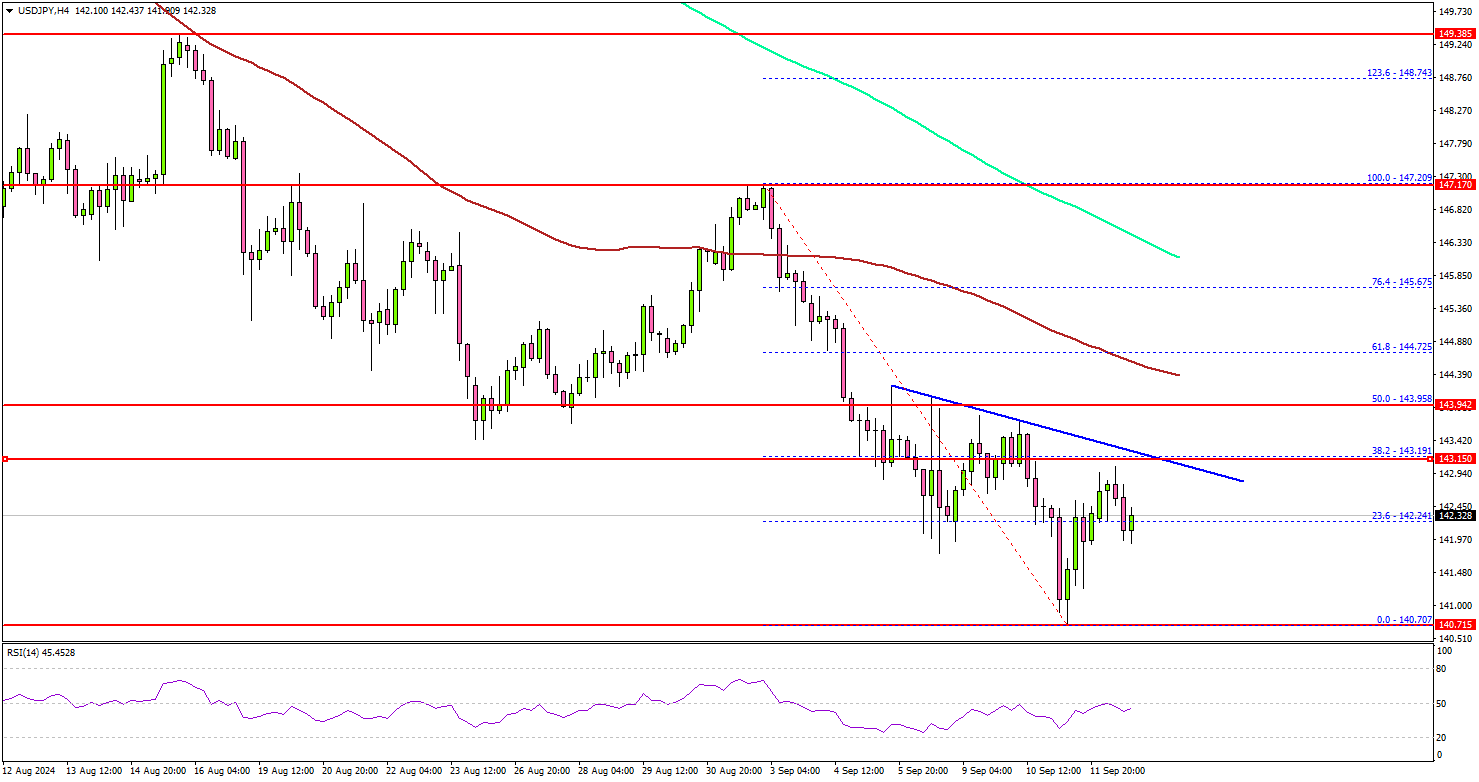
There was a minor increase above the 142.00 resistance. The pair climbed above the 23.6% Fib retracement level of the downward move from the 147.20 swing high to the 140.70 low.
On the upside, the pair could face resistance near the 143.00 level. There is also a connecting bearish trend line forming with resistance at 143.10 on the same chart. The next key resistance sits near the 144.00 zone or the 50% Fib retracement level of the downward move from the 147.20 swing high to the 140.70 low.
A clear move above the 144.00 level could set the pace for a move toward the 100 simple moving average (red, 4-hour). Any more gains might call for a test of the 145.50 zone.
On the downside, immediate support sits near the 141.20 level. The next key support sits near the 140.70 level. A downside break below the 140.70 level could set the pace for a larger decline. The next major support is near the 140.00 level.
Looking at Gold, the bulls took control and were able to push the price to a new all-time high above $2,568 on TitanFX.
Upcoming Economic Events:
- US Import Price Index for August 2024 (MoM) – Forecast -0.2%, versus +0.1% previous.
- US Export Price Index for August 2024 (MoM) – Forecast -0.1%, versus +0.7% previous.
USD/JPY Daily Outlook
Daily Pivots: (S1) 141.35; (P) 142.20; (R1) 142.66; More...
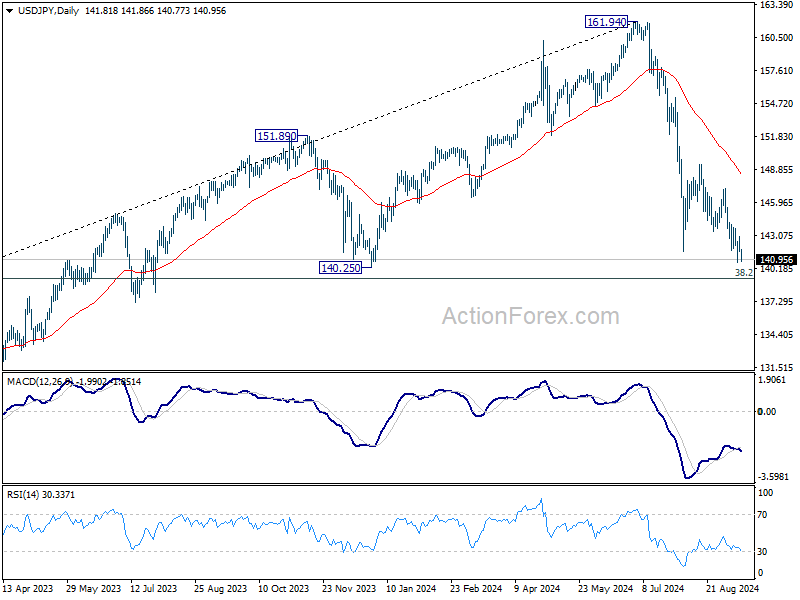
USD/JPY is staying above 140.70 temporary low despite current dip, and intraday bias stays neutral first. Outlook remains bearish as long as 147.20 resistance holds. On the downside, break of 140.70 will resume the fall from 161.94 to 140.25 support, and possibly to 139.26 fibonacci level too.
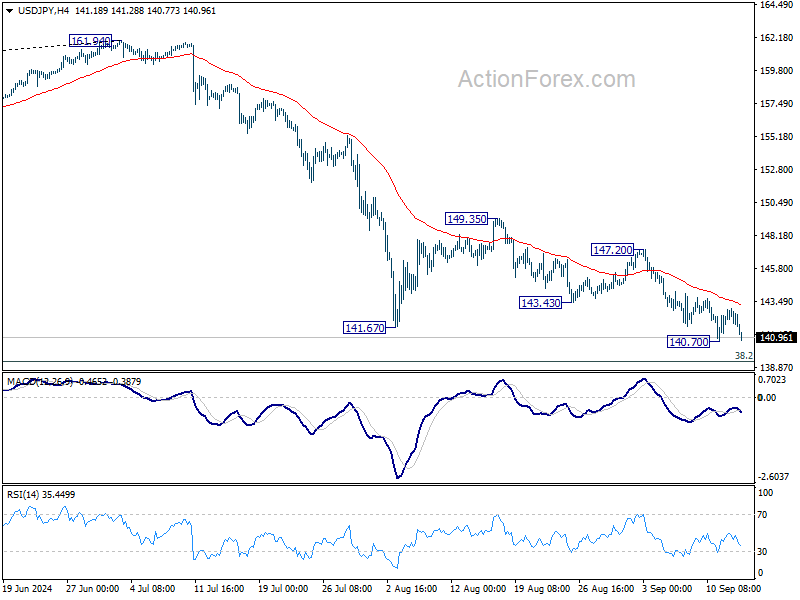
In the bigger picture, fall from 161.94 medium term top is seen as correcting whole up trend from 102.58 (2021 low). Deeper decline could be seen to 38.2% retracement of 102.58 to 161.94 at 139.26, which is close to 140.25 support. Strong support could be seen there to bring rebound. But in any case, risk will stay on the downside as long as 55 W EMA (now at 148.93) holds. Sustained break of 139.26 would open up deeper medium term decline to 61.8% retracement at 125.25.
Fed’s Rate-Cut Debate Intensifies, Dollar Tumbles Amid Renewed 50bps Speculation
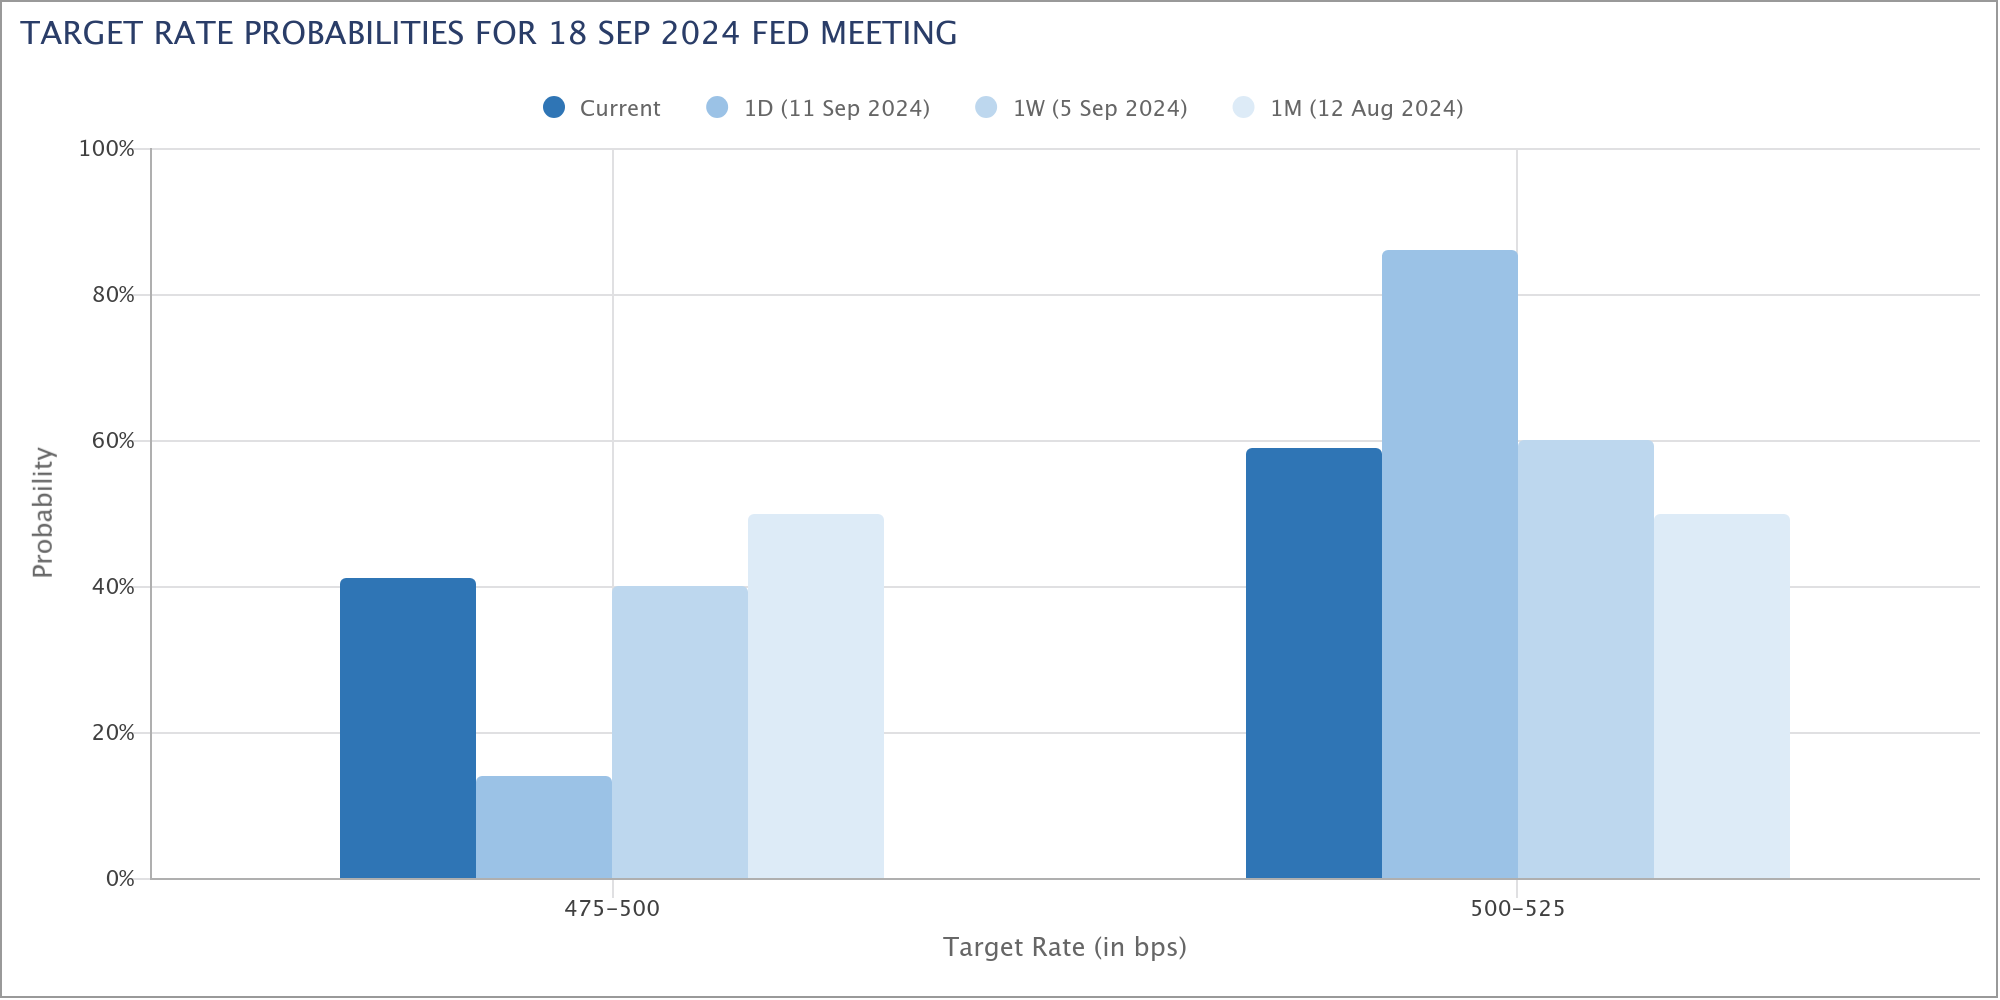
Dollar fell sharply overnight as the probability of a 50bps rate cut by Fed next week increased significantly. According to fed fund futures, the odds of a half-point cut now sit at around 40%, a notable jump from just 14% the day before. Market participants had widely assumed that Fed was firmly on track for a smaller 25bps cut. However, recent developments have brought a more aggressive rate reduction back into consideration.
After last week's solid non-farm payrolls report and the higher-than-expected core inflation data earlier this week, most market participants had ruled out the likelihood of a 50bps cut. However, fresh commentary from key financial outlets, such as the Wall Street Journal and Financial Times, has flipped the narrative.
WSJ's Nick Timiraos, often referred to as the "Fed Whisperer," wrote that Fed now faces a "rate-cut dilemma" — whether to "start big or small." He highlighted the Fed's nervousness about keeping rates elevated for too long, particularly as evidence mounts that higher borrowing costs are indeed cooling the economy as intended.
An article in FT echoed this sentiment, highlighting the argument that a larger 50bps cut might minimize risks to the Fed's goal of a soft landing. A more aggressive cut would allow borrowing costs to normalize faster, which could relieve economic strain and protect the labor market from further deterioration.
However, not all are in agreement. Fitch raised concerns, noting that the challenges posed by inflation over the past few years might make Fed officials more cautious. It took longer than expected to control inflation, revealing gaps in the central bank's understanding of inflation drivers, which could make policymakers wary of moving too quickly.
In the forex markets this week so far, Yen remains the strongest performer, followed by Aussie and Sterling. On the other end, Swiss Franc is the weakest, followed by the Loonie and Dollar. Euro and Kiwi are positioned in the middle
Technically, EUR/USD rebounded after receiving notable support from 38.2% retracement of 1.0665 to 1.1200 at 1.0996. Focus is now on whether this rebound could extend through 1.1153 resistance. That would mark the completion of correction from 1.1200, and that larger rally should then be ready to resume towards 1.1274 key resistance next (2023 high).

In Asia, at the time of writing, Nikkei is down -0.89%. Hong Kong HSI is up 1.20%. China Shanghai SSE is down -0.09%. Singapore Strait Times is up 0.21%. Japan 10-year JGB yield is down -0.024 at 0.842. Overnight, DOW rose 0.58%. S&P 500 rose 0.75%. NASDAQ rose 1.00%. 10-year yield rose 0.0270 to 3.680.
Momentum builds in Gold's record run, will it push past 2600 barrier?
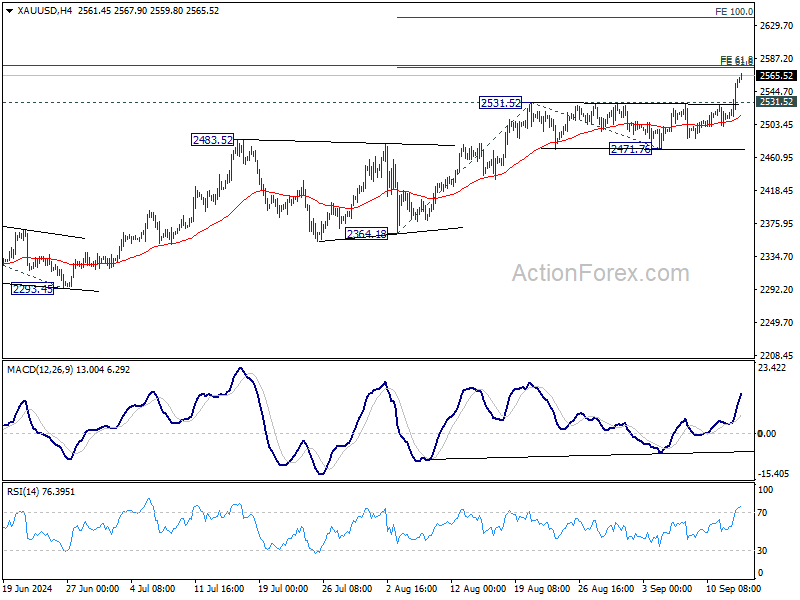
Gold's rally accelerated after clearing 2531 resistance earlier in the week, and was further aided by the broad-based selloff in Dollar overnight. With price now nearing a critical resistance zone just below 2600 mark, focused is on whether Gold can sustain this momentum. Decisive break above this level could lead to upside acceleration, and extend the record run towards 2750 region.
Technically, near term outlook will stay bullish as long as 2531.52 resistance turned support holds. Next target is 61.8% projection of 2364.18 to 2531.52 from 2471.76 at 2575.17. Decisive break there will target 100% projection at 2639.10.
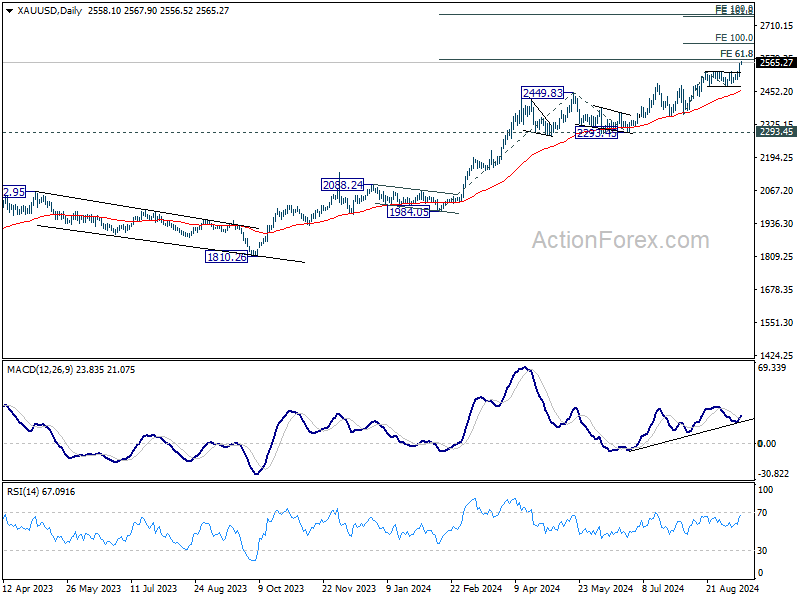
From a medium term perspective, outlook is staying bullish with continuous strong support from rising 55 D EMA. Key focus is on 61.8% projection of 1984.05 to 2449.83 from 2293.45 at 2581.30, which is close to above mentioned 2575.17 projection level. Sustained break of this cluster projections level could prompt further upside acceleration to 100% projection at 2742.51.
NZ BNZ manufacturing rises to 45.8, 18th month of contraction
BNZ Performance of Manufacturing Index for New Zealand edged higher in August, rising from 44.4 to 45.8. Despite the improvement, the sector remains in deep contraction, well below its long-term average of 52.6, marking the 18th consecutive month of declining activity.
A closer look at the data reveals that production increased from 44.2 to 46.3, while employment also saw a slight rise, moving from 43.5 to 46.6. New orders climbed from 43.3 to 46.8, signaling some improvement in demand. However, finished stocks dipped slightly from 46.3 to 46.2, while deliveries improved marginally from 44.7 to 45.6.
BusinessNZ's Director of Advocacy, Catherine Beard, commented on the situation, noting that while the PMI is "heading back in the right direction," the sector's return to expansion is still distant after 18 months in contraction.
The ongoing challenges in the manufacturing sector were reflected in the proportion of negative comments, which, although improved, remained high at 64.2% in August, down from 71.1% in July and 76.3% in June. These negative sentiments were largely driven by concerns over the broader economic recession, with manufacturers citing weak demand and rising living costs as significant hurdles to recovery.
Looking ahead
Eurozone industrial production will be released in European session. Later in the day, Canada will publish wholesale sales. US will release import prices and U of Michigan consumer sentiment,
USD/JPY Daily Outlook
Daily Pivots: (S1) 141.35; (P) 142.20; (R1) 142.66; More...
USD/JPY is staying above 140.70 temporary low despite current dip, and intraday bias stays neutral first. Outlook remains bearish as long as 147.20 resistance holds. On the downside, break of 140.70 will resume the fall from 161.94 to 140.25 support, and possibly to 139.26 fibonacci level too.
In the bigger picture, fall from 161.94 medium term top is seen as correcting whole up trend from 102.58 (2021 low). Deeper decline could be seen to 38.2% retracement of 102.58 to 161.94 at 139.26, which is close to 140.25 support. Strong support could be seen there to bring rebound. But in any case, risk will stay on the downside as long as 55 W EMA (now at 148.93) holds. Sustained break of 139.26 would open up deeper medium term decline to 61.8% retracement at 125.25.
Economic Indicators Update
| GMT | CCY | EVENTS | ACT | F/C | PP | REV |
|---|---|---|---|---|---|---|
| 22:30 | NZD | Business NZ PMI Aug | 45.8 | 44 | ||
| 04:30 | JPY | Industrial Production M/M Jul F | 2.80% | 2.80% | ||
| 09:00 | EUR | Eurozone Industrial Production M/M Jul | 0.20% | -0.10% | ||
| 12:30 | CAD | Capacity Utilization Q2 | 78.40% | 78.50% | ||
| 12:30 | CAD | Wholesale Sales M/M Jul | -1.10% | -0.60% | ||
| 12:30 | USD | Import Price Index M/M Aug | -0.20% | 0.10% | ||
| 14:00 | USD | Michigan Consumer Sentiment Index Sep P | 68 | 67.9 |
Momentum builds in Gold’s record run, will it push past 2600 barrier?
Gold's rally accelerated after clearing 2531 resistance earlier in the week, and was further aided by the broad-based selloff in Dollar overnight. With price now nearing a critical resistance zone just below 2600 mark, focused is on whether Gold can sustain this momentum. Decisive break above this level could lead to upside acceleration, and extend the record run towards 2750 region.
Technically, near term outlook will stay bullish as long as 2531.52 resistance turned support holds. Next target is 61.8% projection of 2364.18 to 2531.52 from 2471.76 at 2575.17. Decisive break there will target 100% projection at 2639.10.
From a medium term perspective, outlook is staying bullish with continuous strong support from rising 55 D EMA. Key focus is on 61.8% projection of 1984.05 to 2449.83 from 2293.45 at 2581.30, which is close to above mentioned 2575.17 projection level. Sustained break of this cluster projections level could prompt further upside acceleration to 100% projection at 2742.51.
NZ BNZ manufacturing rises to 45.8, 18th month of contraction
BNZ Performance of Manufacturing Index for New Zealand edged higher in August, rising from 44.4 to 45.8. Despite the improvement, the sector remains in deep contraction, well below its long-term average of 52.6, marking the 18th consecutive month of declining activity.
A closer look at the data reveals that production increased from 44.2 to 46.3, while employment also saw a slight rise, moving from 43.5 to 46.6. New orders climbed from 43.3 to 46.8, signaling some improvement in demand. However, finished stocks dipped slightly from 46.3 to 46.2, while deliveries improved marginally from 44.7 to 45.6.
BusinessNZ’s Director of Advocacy, Catherine Beard, commented on the situation, noting that while the PMI is "heading back in the right direction," the sector's return to expansion is still distant after 18 months in contraction.
The ongoing challenges in the manufacturing sector were reflected in the proportion of negative comments, which, although improved, remained high at 64.2% in August, down from 71.1% in July and 76.3% in June. These negative sentiments were largely driven by concerns over the broader economic recession, with manufacturers citing weak demand and rising living costs as significant hurdles to recovery.