Sample Category Title
GBP/USD Outlook: Cable Cracks Psychological 1.30 Support After US Inflation Data
GBPUSD accelerated lower after US inflation data on Wednesday and hit the lowest in three weeks, pressuring psychological 1.30 support.
US inflation data were mainly in line with expectations, but core CPI showed signs of stickiness, cooling bets for 50 basis points rate cut by Fed and inflating the US dollar.
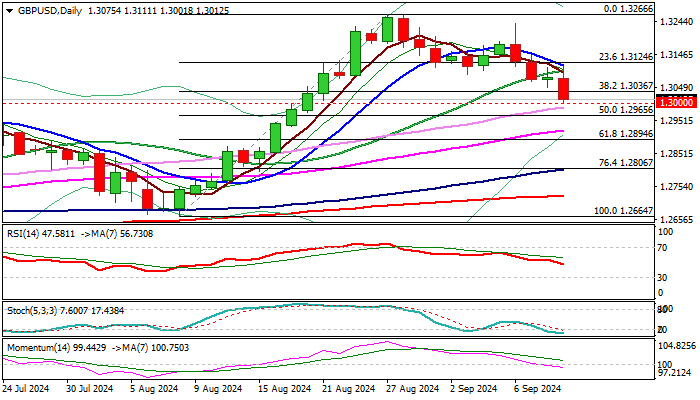
Technical picture on daily chart is weakening, as 14-d momentum slid into negative territory and the price dipped below converging 10/230 DMA’s which are about to form a bear-cross.
Completion of bearish failure swing pattern on daily chart also contributes to negative signals, with firm break of 1.30 pivot to generate fresh bearish signal and open way towards targets at 1.2965 )50% retracement of 1.2664/1.3266) and 1.2922/1.2894 (55DMA / Fibo 61.8%.
Near-term action is expected to remain biased lower while the price stays below 1.3100 zone (20DMA / today’s high).
Res: 1.3049; 1.3094; 1.3111; 1.3124
Sup: 1.3000; 1.2965; 1.2922; 1.2894
August CPI: Probably a 25 bps Rate Cut Next Week
Summary
August's inflation data probably cement a 25 bps, rather than a 50 bps, reduction in the federal funds rate at next week's FOMC meeting in our view. The 0.2% increase in headline CPI was in line with expectations, while the 0.3% increase in core CPI was slightly higher than consensus forecasts.
Another month of tepid food inflation and falling energy prices kept headline inflation in check. Excluding food and energy, the deflation in core goods remained in effect, led by a 1.0% drop in prices for used autos. A larger-than-expected drop in prices for core goods was more than offset by faster-than-expected services inflation. A bounce back in travel-services prices such as lodging away from home and airfares ended a run of unusually soft readings for these categories. Primary shelter inflation also came in high relative to our expectations and at odds with leading indicators from private sector data sources. Overall, we see the lingering split between goods and services inflation as a sign that the unwinding of pandemic-era effects on prices is taking somewhat longer, rather than as an indication disinflation is running out of steam.
On balance, today's data suggest that a 25 bps rate cut is more likely than 50 bps next week, but we would not be completely shocked if the FOMC elected to move by 50 bps. Furthermore, starting with a 25 bps move does not rule out a pickup in the pace of policy easing at future meetings. The ongoing deterioration in the labor market has become an increasing focus for the FOMC, and inflation is slowly but surely returning to 2% on trend. The core CPI has increased at a 2.1% annualized pace over the past three months, a slow enough pace that 50 bps rate cuts at future meetings remain squarely on the table if the labor market data spur faster action. Regardless, all signs point to additional rate cuts beyond next week in our view.
Split Between Goods and Services Inflation Was Amplified in August
Inflation in August came in roughly in line with expectations, rising 0.2% in the month and 2.5% over the past year according to the Consumer Price Index. A relatively small 0.8% decline in energy prices in the month helped keep headline inflation in check, led lower by a 0.6% dip in gasoline prices and a 1.9% drop in utility gas service. Based on the limited data available for September and the recent trend in oil prices, another decline in energy prices appears likely to come in next month's CPI release. Food inflation also continued its run of relatively benign gains, rising 0.1% in August. Price growth for food consumed away from home (0.3% month-over-month and 4.0% year-over-year) once again outpaced inflation at the grocery store (prices unchanged over the month and up 0.9% compared to one year ago).
Monetary policymakers like those at the Federal Reserve tend to focus on inflation excluding food and energy given that these two components are quite volatile and their prices are often determined by factors other than the stance of monetary policy. That said, headline inflation better reflects the price growth that consumers experience in their daily lives. Much slower food and energy inflation over the past year has brought good news for households on the inflation front. The 2.5% increase in the headline CPI over the past 12 months is more or less in line with where this indicator was on the eve of the pandemic (2.3% in February 2020).
Core inflation picked up in August, rising 0.3% after a 0.2% gain in July. The slower pace of disinflation when excluding food and energy comes amid what is still rather sticky services inflation. Core services prices advanced 0.4% in August, the largest increase since April. The moderation in shelter inflation remains painfully slow. Despite the notably lower pace of rental inflation signaled by private sector measures, primary shelter (the weighted average of rent of primary residences and owners' equivalent rent) rose 0.5% in August. We have not given up the view that shelter inflation should slow more materially ahead, with the BLS's All Tenant Rent Index having fallen sharply. That said, the stubbornly high pace of official shelter inflation raises some doubts about the extent to which it may ultimately ease further this cycle.
Core services ex-shelter also got a boost in August from higher travel-related prices (lodging away from home +1.8%, airfares +3.9%). Given that these categories are some of the more volatile components of core services, we are less concerned about their monthly rise in the context of further services disinflation ahead. Meanwhile, outright deflation in the goods sector continues. Core goods fell 0.2%, led by a drop in used autos (-1.0%). While auction prices point to a rebound in used vehicle prices over the next month or two, outside the auto space, goods prices also declined in August, signaling the benefits of smoother supply chains and cooler demand have yet to run their course.
While core prices rose more in August relative to the prior three-month average pace of monthly gains (0.13%), the early summer pace likely understated the trend in inflation just as the first quarter's average gain of 0.37% seemed to overstate it. August's figures likely give a somewhat cleaner read, in our view. The three-month annualized rate of core CPI inflation was just 2.1% in August, below the year-over-year pace of 3.2%. With food and energy related commodity prices having retreated of late and ongoing cooling in the labor market, we expect inflation to remain in check in the months to come.
The combination of today's CPI report, last Friday's employment report and recent communication from key Fed officials leads us to believe that the FOMC will reduce the federal funds rate by 25 bps at its meeting next week. That said, we would not be completely shocked if the FOMC opted for a 50 bps rate cut instead. Nonfarm payroll growth has slowed significantly in recent months, and the upward trend in the unemployment and under-employment rates is concerning. The pickup in core CPI inflation from July to August is unwelcome news for those hoping for a larger cut next week, but the underlying trend in price growth remains down in our view.
Sunset Market Commentary
Markets
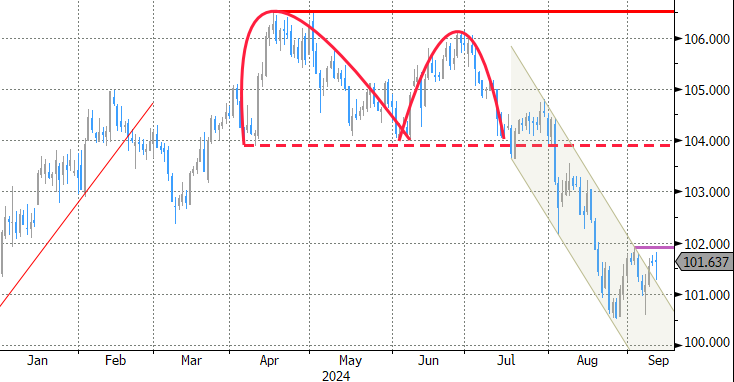
US August inflation is another piece for the Fed’s puzzle next week. Headline CPI rose again and as expected by 0.2% M/M with the Y/Y-figure slowing as anticipated from 2.9% to 2.5%. Core CPI accelerated from 0.2% M/M in July to 0.3% while consensus was looking for a 0.2% pace as well. Core CPI stabilized nevertheless as hoped at 3.2% Y/Y. Details showed energy (-0.8% M/M) and energy services (-0.9%) as key downward influences. Food prices rose by 0.1% M/M and services excluding energy by 0.4% M/M (4.9% Y/Y). Shelter costs accelerated to 0.5% M/M (5.2% Y/Y) and was the main (upside) factor in today’s inflation print. The so-called supercore services inflation gauge accelerated from +0.21% M/M to +0.33% M/M (4.46% Y/Y, flat). Rates markets were initially wrongfooted by the small upside core CPI release with headlines screaming that it takes the case of a 50 bps rate cut by the Fed off the table next week. Others argue “more noise than news” or “hardly a game-changer” and that’s also how we’ll likely interpret today’s market action by the end of the trading day. The jury is still out for the outcome of next week’s FOMC meeting. The US 2-yr yield initially spiked by around 10 bps, reversing yesterday’s decline, but as we close our report there’s only half of the gain left. Increases at longer tenors stretch from 1 bp (30-yr) to 3.5 bps (5-yr). German yields are flat on the day going into tomorrow’s ECB meeting where we expect Lagarde and co to cut the deposit rate a second time by 25 bps but refrain from committing to more action in October. EUR/USD dipped from 1.1050 to currently 1.1015. The trade-weighted dollar is unchanged for the day at 101.65. For now, first resistance at 101.92/102 stays out of reach. USD/JPY this morning briefly touched its lowest level YTD on hawkish comments by BoJ Nakagawa (140.71) before returning to opening levels around 142.12. Key US stock market open with losses of up to 0.9% for the Dow Jones. Oil prices try to regain the $70/b barrier (Brent) after their non-stop slide this month from levels just above $80/b.
News & Views
In comments during a four-day trip in China, Spanish Prime Minister Pedro Sanchez indicated that his country is considering a change in its position on imposing additional tariffs on the import of electric vehicles produced in China. “We have need to reconsider – all of us, not only the members states but also the Commission – our positions towards this movement”. The comments are a sign of growing division among European members states as the European Commission prepares to add additional levy’s by the end of October. Tariffs in the commission’s proposal might be raised by up to 37.6%. The measures are a response against Chinese car makers benefiting from unfair state subsidies and the country flooding the EU with its excess car production. In response, China also started anti-dumping investigations, amongst others, into EMU dairy and pork exports. Spain is an important exporter of pork to China. A qualified majority of member states is necessary to block a decision of the commission on tariffs.
In a speech earlier today, assistant governor Sara Hunter of the Reserve Bank of Australia assessed that labor market conditions, while easing, remain relatively close to full employment. In particular, she saw strength in hours worked, underemployment and participation somewhat surprising. The unemployment rate has gradually increased to 4.2% from a cycle low of 3.5% last year. From the current point in the economic cycle, the RBA expects employment to continue to increase, but a slower pace than population growth. This might further ease labour market conditions. An ongoing strong labour market was one of the reason for the RBA to keep policy restriction at its current level (policy rate at 4.35%). The RBA has its next policy meeting on September 24 and is not expected to already join the global easing cycle of other centrale bankers. Markets attach a 75% probability to a first rate cut at the December meeting.
Graphs
US 2-yr yield: dead cat bounce?
Trade-weighted dollar (DXY): still no real test of first resistance at 101.92/102
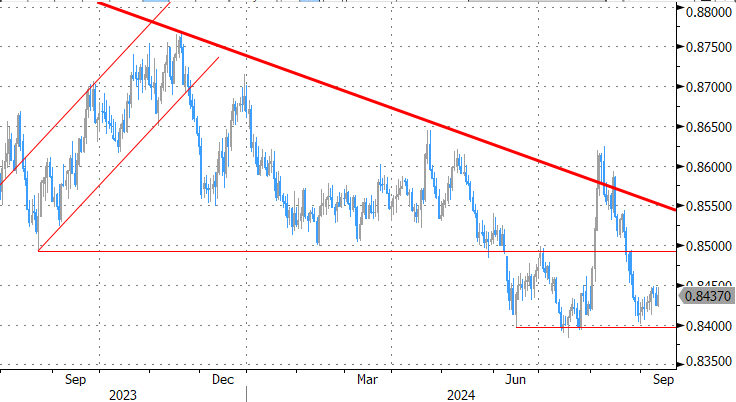
EUR/GBP: unmoved by UK eco data for second straight session
US 10-yr real yield: accumulating bets on less restrictive policy
EURCAD Two-Year Bullish Sequence extends from the Blue Box
Hello traders, welcome to another trade review blog post where we discuss setups from the blue box. In this one, we will look at a recent setup on the EURCAD. We shared this setup with members of Elliottwave-Forecast.
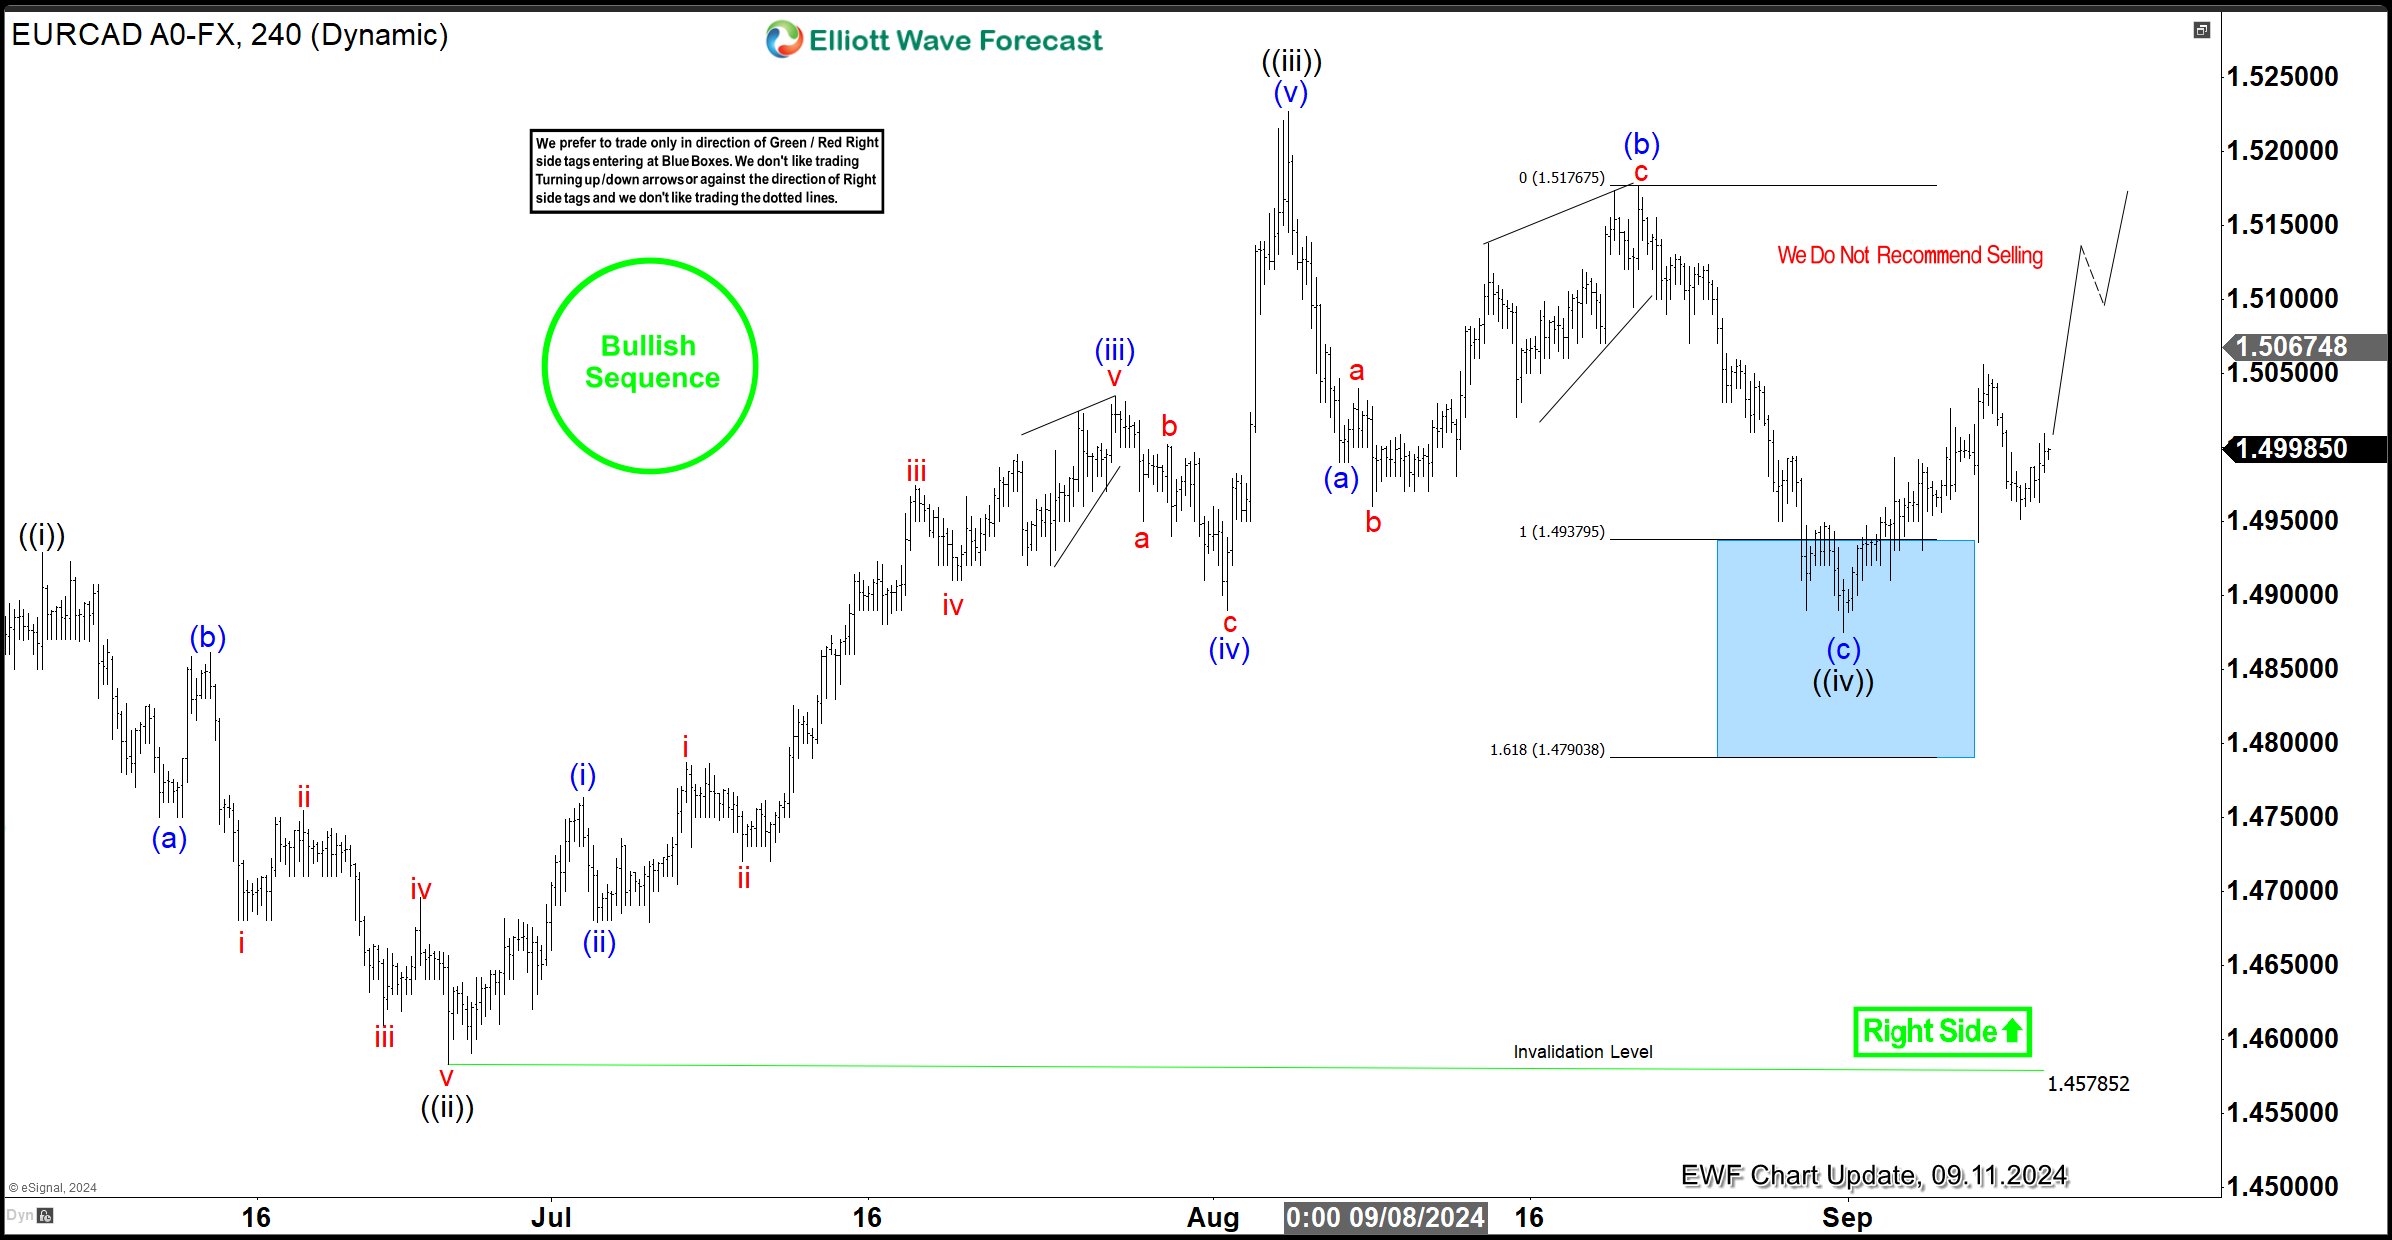
EURCAD has maintained a bullish sequence from the low in August 2022. From that low, the bullish sequence could either complete a 3-wave or a 5-wave structure. Based on the path of least resistance, the price should complete at least a 3-swing sequence. On the weekly chart, we identified the first swing from the August 2022 low to the April 2023 high as wave ((A)). Afterward, a pullback occurred and completed in September 2023, as wave ((B)).
Since September 2023 low, the pair has started the third swing, which we identify as wave ((C)). Wave ((C)) could extend as high as 1.58, which is 805 pips above the current price of 1.4995. With this in mind, we plan to buy pullbacks in 3, 7, or 11 swings along the path of wave ((C)). However, before last week’s rally, we had already shared a trade setup with our members.
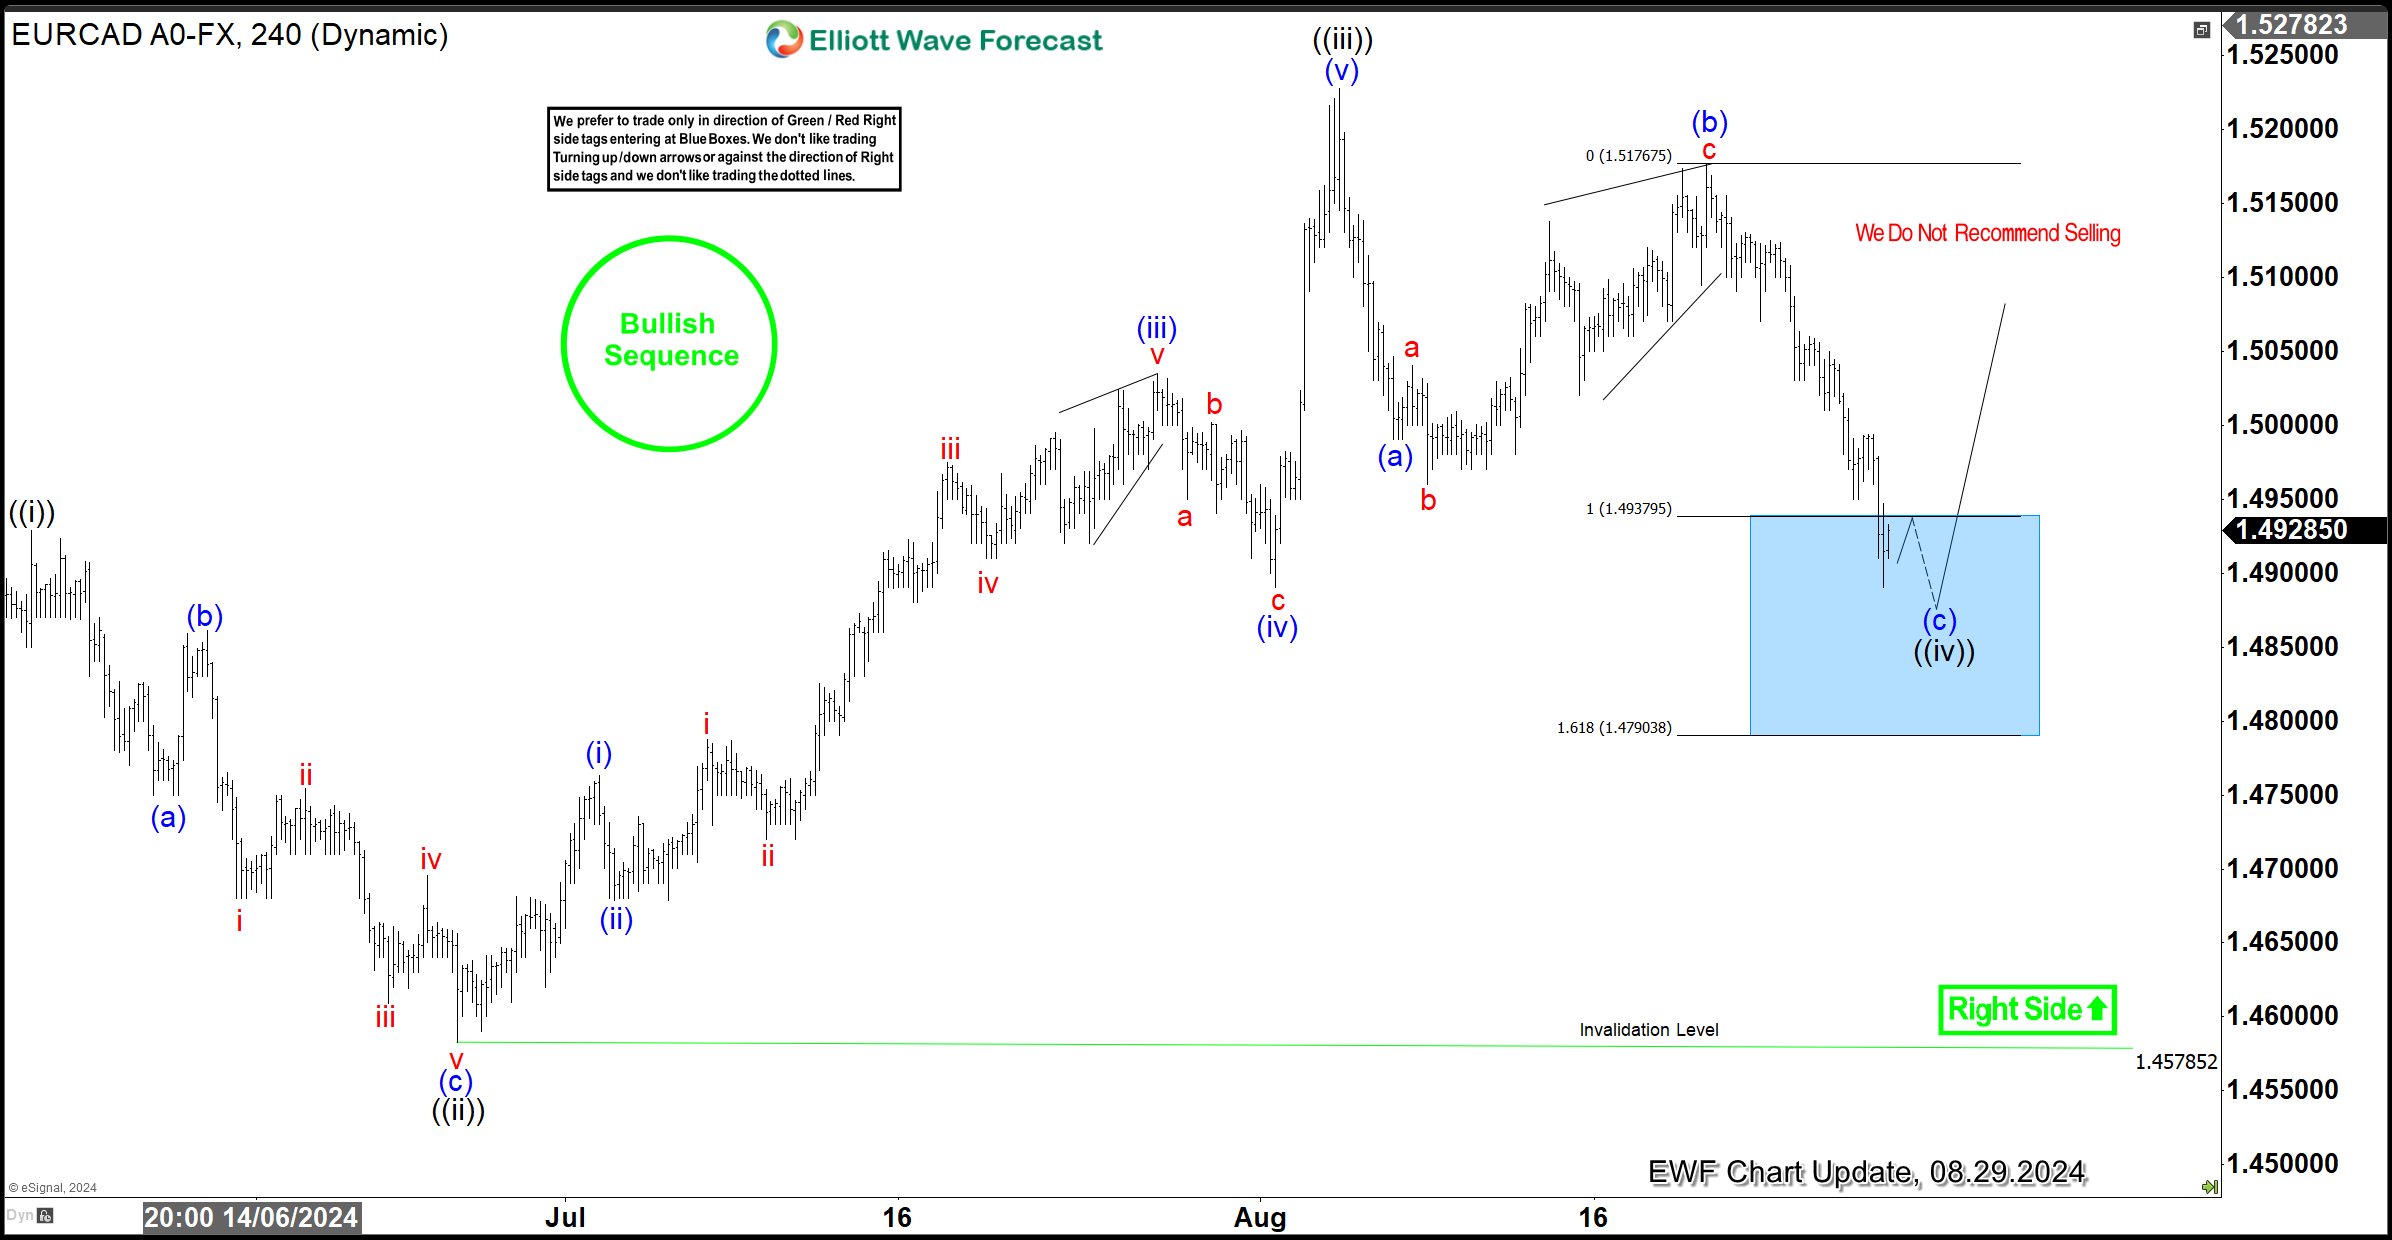
EURCAD H4 Analysis, 08.29.2024
After the price broke above the top of wave ((A)) on both the weekly and daily charts, we informed our members in live analyses and trading rooms that the stage was set to buy the next pullback. The pullback matured about a month later. On August 29, 2024, we shared the H4 chart with members, expecting to go LONG from the blue box. The price reached the blue box, and the LONG trade was triggered with the parameters we provided in the trading journal. Our stop loss was set below the blue box. Additionally, as usual, we planned to take partial profit at 50% of wave (c) of ((iv)).
EURCAD H4 Analysis, 09.11.2024
The chart above shows how EURCAD bounced from the blue box and reached 50% of wave (c). As a result, members who went LONG have already closed half of their position in profit, with the remaining half adjusted to the low of wave (c). This is now a risk-free trade, allowing traders to allocate risk elsewhere. Moving forward, we expect the bullish sequence to extend as an impulse wave ((v)) above the August 5 high. Therefore, as long as the bullish sequence remains intact, we are looking to buy from the dips.
USD/JPY Mid-Day Outlook
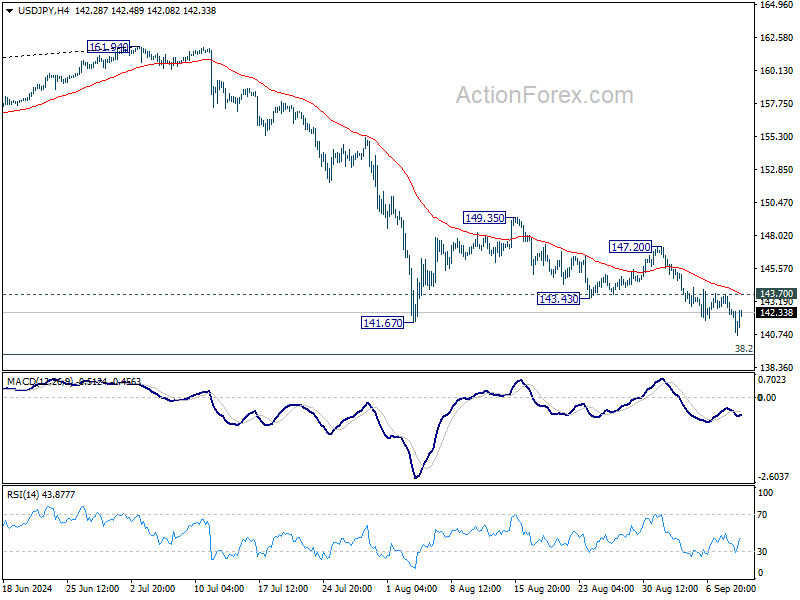
Daily Pivots: (S1) 141.86; (P) 142.79; (R1) 143.37; More...
Intraday bias in USD/JPY stays on the downside for the moment. Deeper decline would be seen to 140.25 support, and possibly further to 139.26 fibonacci level too. On the upside, above 143.70 minor resistance will turn intraday bias neutral first. But outlook will stay bearish as long as 147.20 resistance holds, in case of recovery.
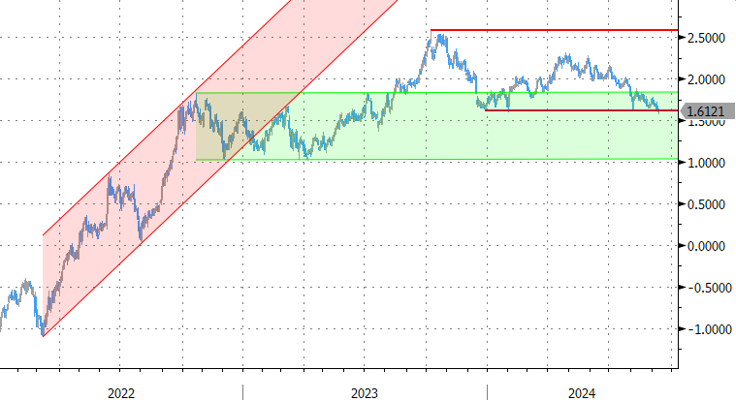
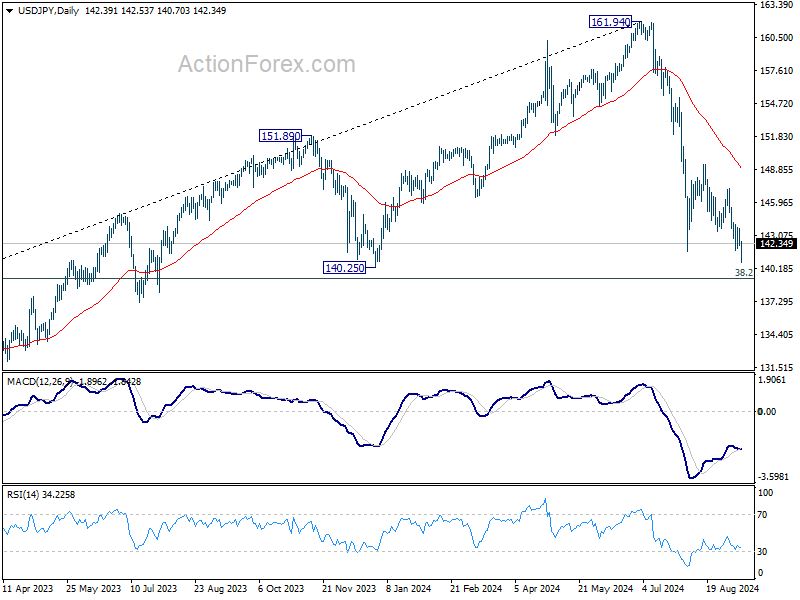
In the bigger picture, fall from 161.94 medium term top is seen as correcting whole up trend from 102.58 (2021 low). Deeper decline could be seen to 38.2% retracement of 102.58 to 161.94 at 139.26, which is close to 140.25 support. Strong support could be seen there to bring rebound. But in any case, risk will stay on the downside as long as 55 W EMA (now at 148.93) holds. Sustained break of 139.26 would open up deeper medium term decline to 61.8% retracement at 125.25.
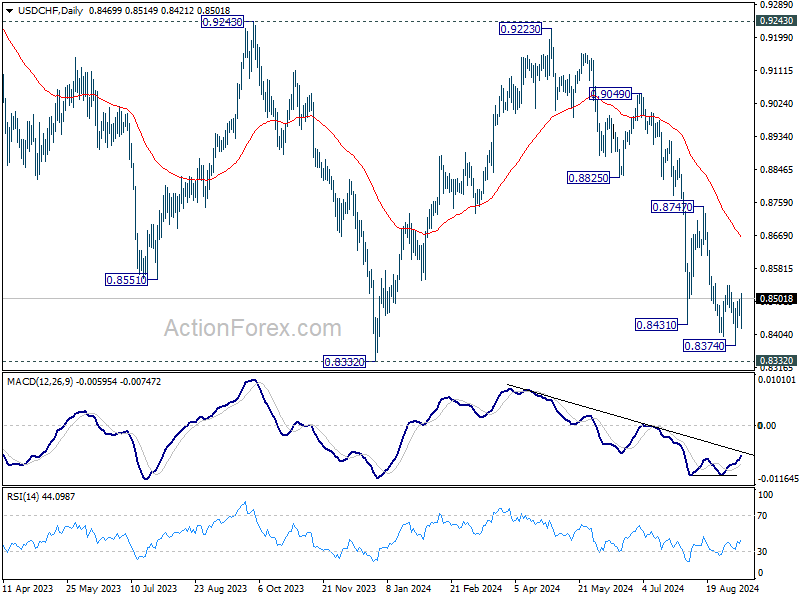
USD/CHF Mid-Day Outlook
Daily Pivots: (S1) 0.8450; (P) 0.8476; (R1) 0.8495; More…
Intraday bias in USD/CHF remains neutral with focus on 0.8536. Rejection by this resistance will retain near term bearishness. Break of 0.8374 will resume the fall from 0.9223 to retest 0.8332 low. Decisive break there will indicate larger down trend resumption. However, considering bullish convergence condition in 4H MACD, break of 0.8536 resistance will now confirm short term bottoming, and turn bias back to the upside for 0.8747 resistance.
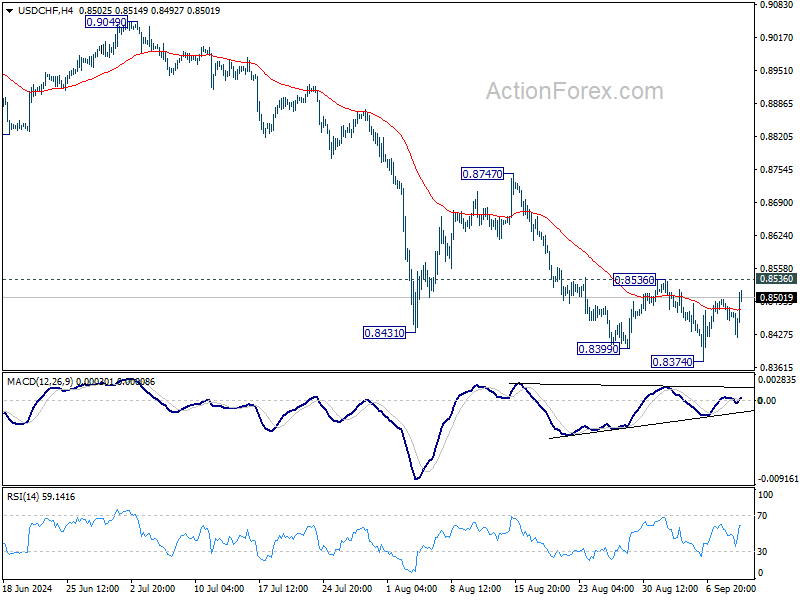
In the bigger picture, price actions from 0.8332 (2023 low) are currently seen as a medium term corrective pattern, with fall from 0.9223 as the second leg. Strong support could be seen from 0.8332 to bring rebound. Yet, overall outlook will continue to stay bearish as long as 0.9243 resistance holds. Firm break of 0.8332, however, will resume larger down trend from 1.0146 (2022 high).
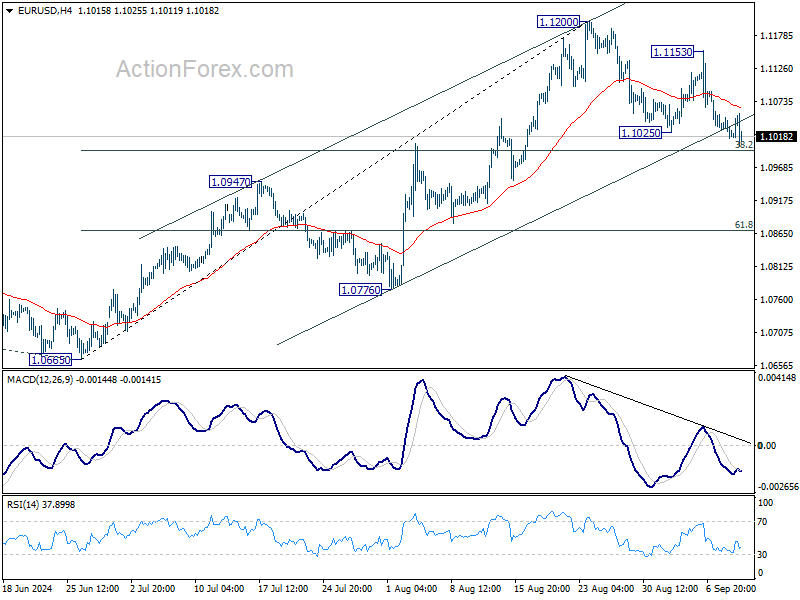
EUR/USD Mid-Day Outlook
Daily Pivots: (S1) 1.1006; (P) 1.1028; (R1) 1.1041; More....
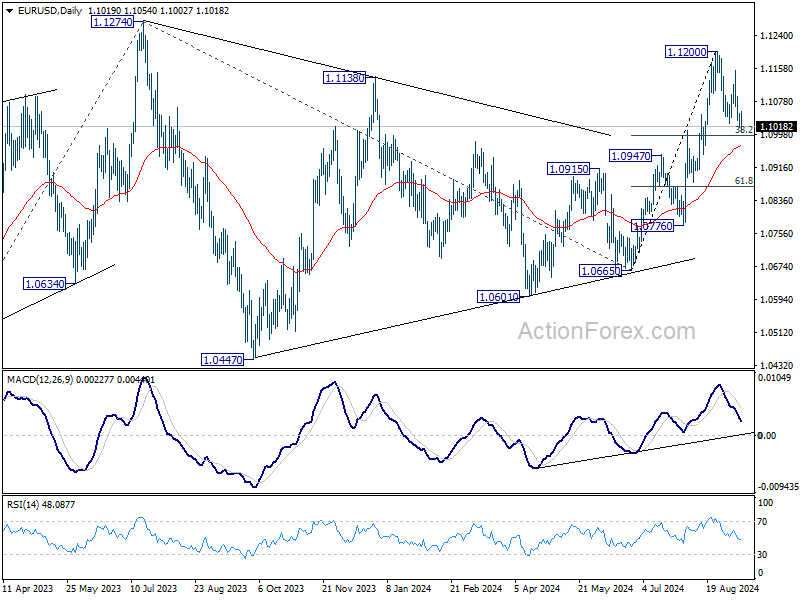
Intraday bias in EUR/USD stays neutral with focus on 38.2% retracement of 1.0665 to 1.1200 at 1.0996. Strong rebound from there will retain near term bullishness. Break of 1.1153 will indicate that larger rally is resuming through 1.1200 resistance to 1.1274 high. However, sustained break of 1.0996 will indicate reversal and turn bias to the downside for 1.0947 resistance turned support next.
In the bigger picture, prior break of 1.1138 resistance indicates that corrective pattern from 1.1274 might have completed at 1.0665 already. Decisive break of 1.1274 (2023 high) will confirm whole up trend from 0.9534 (2022 low). Next target will be 61.8% projection of 0.9534 to 1.1274 from 1.0665 at 1.1740. This will now be the favored case as long as 1.0947 resistance turned support holds.
US: Higher Shelter Costs Drive Unexpected Gain in Core Inflation in August
The Consumer Price Index (CPI) rose 0.2% month-on-month (m/m) in August, bang-on the consensus forecast. On a twelve-month basis, CPI fell to 2.5% (from 2.9% in July).
- Energy prices (-0.8% m/m) were a drag on headline inflation, with both energy commodities and energy services lower on month. Food prices remained largely subdued, rising 0.1% m/m and are up 2.1% year-over-year (y/y).
Excluding food and energy, core prices rose 0.3% m/m, following a gain of 0.2% m/m in July. This came in above the consensus forecast, which called for a more modest gain of 0.2% m/m. The twelve-month change on core held steady at 3.2%, while the three-month annualized ticked up to 2.1% (from 1.6% in July).
Price growth on core services rose 0.4% m/m, a slight acceleration from the 0.3% m/m gain recorded the month prior.
- Shelter costs unexpectedly rose by 0.5% m/m, higher than the 0.4% m/m gain recorded in July. The uptick was largely driven by a further gain in Owners' Equivalent Rent (OER), which rose 0.5% m/m, or a tick above the monthly gain averaged over the twelve-months prior – suggesting some mean reversion in the months ahead.
- Non-housing services inflation (aka 'supercore') also accelerated last month, rising by 0.4% m/m. The gain was largely driven by a further increase in motor vehicle insurance (+0.6% m/m) and travel related costs including airfares (+3.9% m/m) and lodging away from home (+1.8% m/m). However, the three-and-six-month annualized rates of change remain relatively subdued at 1.4% and 2.9%, respectively.
Core goods prices declined by 0.2% on the month, largely due to a further decline in in used vehicle prices (-1.0% m/m), medical & education commodities (-0.4% m/m) and home furnishings (-0.3% m/m). Goods prices have been flat or have registered a decline in each of the last 15 months.
Key Implications
This morning’s inflation report was another reminder that there’s going to be bumps in the road in returning inflation back to the Fed’s 2% target. That said, the uptick in core was largely driven by an unexpected gain in shelter costs (mainly related to OER), which is unlikely to persist. Encouragingly, core goods prices remain in deflation, while overall price pressures on non-housing services remain relatively subdued.
In our view, the August readings of employment and inflation have done little to strengthen the case for a larger 50 basis point (bps) rate cut next week. Instead, the Fed is likely to play it cool and cut rates by just 25 bps, but also signal more easing in the months ahead. We suspect that the FOMC's revised "dot plot" included in the Summary of Economic Projections (released simultaneously with the September 18th interest rate announcement) is likely to show a total of 75 bps of easing (previously 25 bps) by year-end.
GBP/USD Mid-Day Outlook
Daily Pivots: (S1) 1.3051; (P) 1.3079; (R1) 1.3109; More...
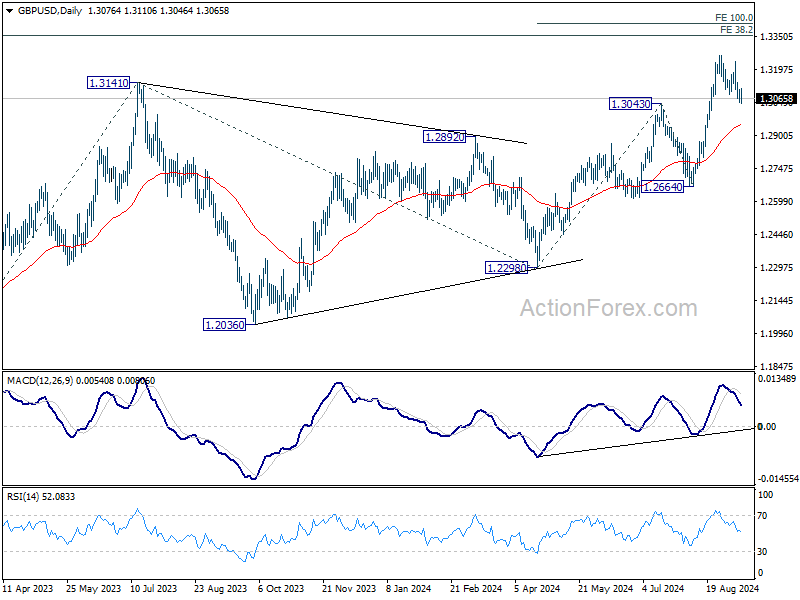
Intraday bias in GBP/USD stays neutral first with focus on 1.3043 resistance turned support. Strong rebound will maintain near term bullishness. Further break of 1.3265 will extend recent up trend to 100% projection of 1.2298 to 1.3043 from 1.2664 at 1.3409. However, firm break of 1.3043 will turn bias back to the downside for deeper pullback, to 55 D EMA (now at 1.2949) and possibly below.
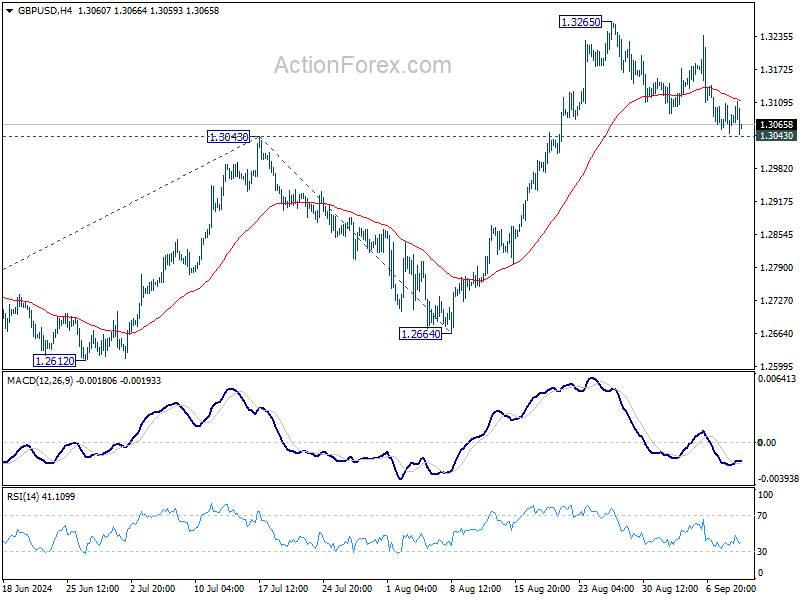
In the bigger picture, up trend from 1.0351 (2022 low) is in progress. Next target is 38.2% projection of 1.0351 to 1.3141 from 1.2298 at 1.3364. For now, outlook will stay bullish as long as 1.2664 support holds, even in case of deep pullback.