
Sample Category Title
US: Higher Shelter Costs Drive Unexpected Gain in Core Inflation in August
The Consumer Price Index (CPI) rose 0.2% month-on-month (m/m) in August, bang-on the consensus forecast. On a twelve-month basis, CPI fell to 2.5% (from 2.9% in July).
- Energy prices (-0.8% m/m) were a drag on headline inflation, with both energy commodities and energy services lower on month. Food prices remained largely subdued, rising 0.1% m/m and are up 2.1% year-over-year (y/y).
Excluding food and energy, core prices rose 0.3% m/m, following a gain of 0.2% m/m in July. This came in above the consensus forecast, which called for a more modest gain of 0.2% m/m. The twelve-month change on core held steady at 3.2%, while the three-month annualized ticked up to 2.1% (from 1.6% in July).
Price growth on core services rose 0.4% m/m, a slight acceleration from the 0.3% m/m gain recorded the month prior.
- Shelter costs unexpectedly rose by 0.5% m/m, higher than the 0.4% m/m gain recorded in July. The uptick was largely driven by a further gain in Owners' Equivalent Rent (OER), which rose 0.5% m/m, or a tick above the monthly gain averaged over the twelve-months prior – suggesting some mean reversion in the months ahead.
- Non-housing services inflation (aka 'supercore') also accelerated last month, rising by 0.4% m/m. The gain was largely driven by a further increase in motor vehicle insurance (+0.6% m/m) and travel related costs including airfares (+3.9% m/m) and lodging away from home (+1.8% m/m). However, the three-and-six-month annualized rates of change remain relatively subdued at 1.4% and 2.9%, respectively.
Core goods prices declined by 0.2% on the month, largely due to a further decline in in used vehicle prices (-1.0% m/m), medical & education commodities (-0.4% m/m) and home furnishings (-0.3% m/m). Goods prices have been flat or have registered a decline in each of the last 15 months.
Key Implications
This morning’s inflation report was another reminder that there’s going to be bumps in the road in returning inflation back to the Fed’s 2% target. That said, the uptick in core was largely driven by an unexpected gain in shelter costs (mainly related to OER), which is unlikely to persist. Encouragingly, core goods prices remain in deflation, while overall price pressures on non-housing services remain relatively subdued.
In our view, the August readings of employment and inflation have done little to strengthen the case for a larger 50 basis point (bps) rate cut next week. Instead, the Fed is likely to play it cool and cut rates by just 25 bps, but also signal more easing in the months ahead. We suspect that the FOMC's revised "dot plot" included in the Summary of Economic Projections (released simultaneously with the September 18th interest rate announcement) is likely to show a total of 75 bps of easing (previously 25 bps) by year-end.
GBP/USD Mid-Day Outlook
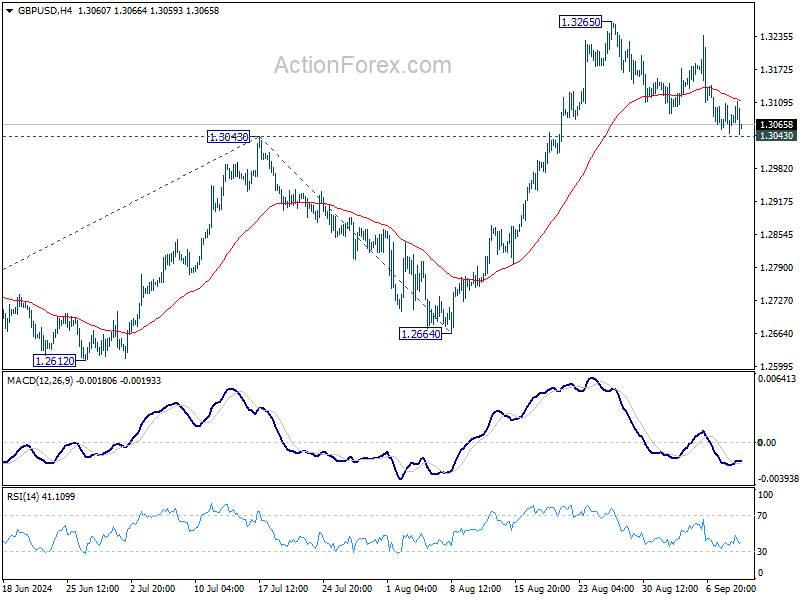
Daily Pivots: (S1) 1.3051; (P) 1.3079; (R1) 1.3109; More...
Intraday bias in GBP/USD stays neutral first with focus on 1.3043 resistance turned support. Strong rebound will maintain near term bullishness. Further break of 1.3265 will extend recent up trend to 100% projection of 1.2298 to 1.3043 from 1.2664 at 1.3409. However, firm break of 1.3043 will turn bias back to the downside for deeper pullback, to 55 D EMA (now at 1.2949) and possibly below.
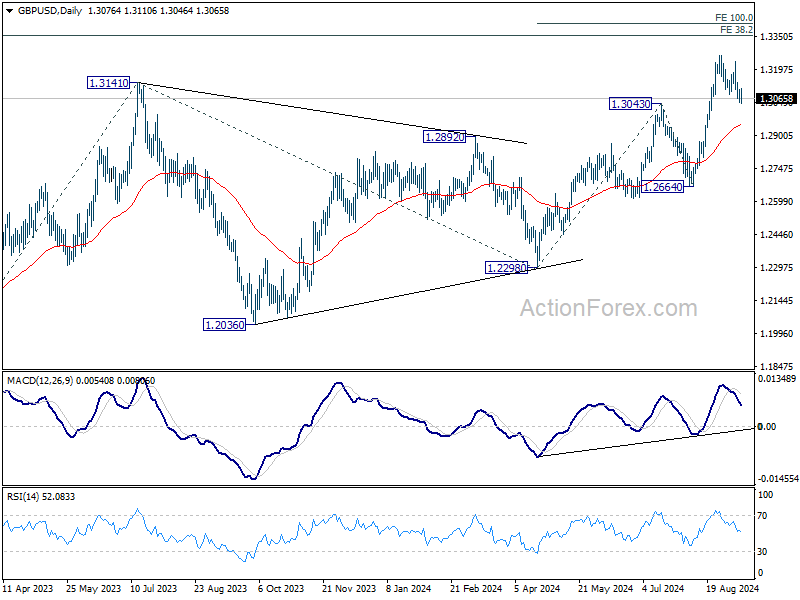
In the bigger picture, up trend from 1.0351 (2022 low) is in progress. Next target is 38.2% projection of 1.0351 to 1.3141 from 1.2298 at 1.3364. For now, outlook will stay bullish as long as 1.2664 support holds, even in case of deep pullback.
Dollar Rallies as Core CPI Data Dims Hopes for Larger Fed Rate Cut
Dollar rises slightly across the board during early US session following release of key inflation data, which largely ruled out the possibility of 50bps rate cut at the upcoming FOMC meeting next week. While headline inflation in the US saw sharper-than-expected decline, falling to 2.6% year-on-year, core CPI remained stuck at 3.2%, signaling that disinflation efforts are stalling. The month-on-month rise in core CPI of 0.3%, coupled with 0.5% rise in shelter costs, is likely to keep Fed policymakers cautious as they assess the need for more aggressive easing.
The market's reaction to the CPI report was immediate. US stock futures dropped notably, pointing to a lower market open, while the 10-year Treasury yield rebounded after dipping to a near 30-month low in the previous session. Investors seem to be digesting the likelihood that while inflation is cooling, the pace remains uneven, leaving the Fed with little room to justify a larger rate cut at this stage.
In the forex markets, Canadian Dollar is leading the charge, followed closely by Yen, though Dollar's momentum suggests it may soon overtake both. On the opposite end, Swiss Franc is the worst performer of the day, followed by New Zealand Dollar. Sterling, meanwhile, is feeling the strain after disappointing UK GDP data, with Euro and Australian Dollar positioned in the middle of the pack.
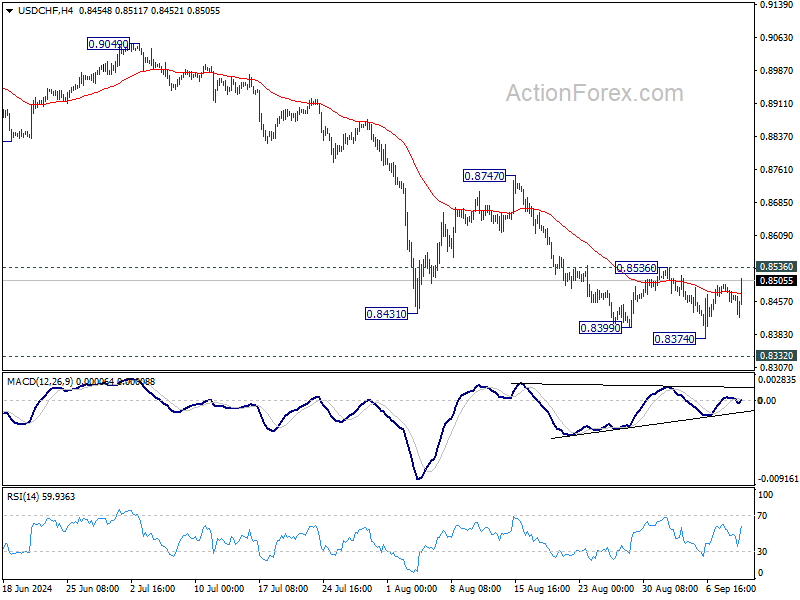
Technically, USD/CHF is heading back to 0.8536 resistance as rebound from 0.8374 extends. Considering bullish convergence condition in 4H MACD, decisive break of 0.8536 should confirm short term bottoming, after defending 0.8332 key support (2023 low). In this case, stronger rise should be seen back to 0.8747 resistance to determine whether the pair is already in bullish reversal.
In Europe at the time of writing, FTSE is up 0.04%. DAX is up 0.41%. CAC is up 0.17%. UK 10-year yield is down -0.0156 at 3.802. Germany 10-year yield is up 0.013 at 2.143. Earlier in Asia, Nikkei fell -1.49%. Hong Kong HSI fell -0.73%. China Shanghai SSE fell -0.82%. Singapore Strait Times rose 0.53%. Japan 10-year JGB yield fell -0.0412 to 0.853.
US CPI slows to 2.5% yoy, core CPI unchanged at 3.2% yoy
US CPI rose 0.2% mom in August, matched expectations. However, core CPI rose 0.3% mom, above expectation of 0.2% mom. Shelter costs jumped 0.5% mom and was the main factor in the all items increase. Food index rose 0.1% mom while energy index fell -0.8% mom.
Over the 12-month period, CPI slowed from 2.9% yoy to 2.5% yoy, below expectation of 2.6% yoy. That's also the lowest annual increase since February 2021. But core CPI was unchanged at 3.2% yoy, matched expectations. Energy index fell -4.0% yoy while food prices rose 2.1% yoy.
UK GDP stagnates in Jul with sharp production contraction
The UK economy showed no growth in July, marking a disappointing performance after also stagnating in June. The flat 0.0% mom reading fell short of expectations for 0.2% increase.
Breaking down the numbers, services sector—typically a key driver of UK growth—rose just 0.1% mom in July. Meanwhile, production sector saw a sharp contraction, declining by -0.8% mom. Construction activity also fell by -0.4% mom.
In the three months to July, UK GDP managed to post 0.5% growth compared to the previous three-month period ending in April, largely supported by the services sector, which grew by 0.6%. Construction performed relatively well, with a 1.2% expansion, marking its first positive three-month growth since September 2023. However, production remained weak, contracting by -0.1% over the same period.
NIESR expects 0.2% UK GDP growth in Q3, despite July stagnation
The National Institute of Economic and Social Research (NIESR) forecasts 0.2% GDP growth for the UK in Q3, driven by resilience in the services and construction sectors. This comes despite today's data showing no growth in July, marking a weaker-than-expected start to the quarter.
Hailey Low, Associate Economist at NIESR, commented on the latest GDP figures, stating, "While today's figures came in slightly weaker compared to the upbeat performance we have seen over the first half of the year, the strong start to 2024 will likely extend into the second half of the year."
However, NIESR has noted signs of a slowdown in the final months of 2024. "High-frequency indicators are signaling a relative slowdown in momentum for the remainder of the year," Low added. Attention is now focused on the government's upcoming Autumn Statement, where policies aimed at sustaining long-term growth will be highly anticipated.
RBA's Hunter anticipates slow cooling of Australia's labor market
In a speech today, RBA Assistant Governor Sarah Hunter highlighted that while conditions in the Australian labor market have eased since late 2022, the market remains "tight relative to full employment."
Looking ahead, Hunter expects labor demand to slow in comparison to labor supply, which should bring the market "into better balance" over the coming quarters. She noted that part of this adjustment is likely to come through a "decline in average hours" worked rather than sharp cuts to overall employment.
Employment growth is expected to persist but at a slower pace, lagging behind population growth. As a result, underutilization measures, including the unemployment rate, are projected to "continue rising gradually." This rise is expected to stabilize once GDP growth returns to a level more consistent with Australia's underlying economic trend.
Hunter's comments underscore RBA's outlook on the labor market, and the hawkish stance that it's not nearing the start of rates reduction cycle yet.
BoJ's Nakagawa signals more rate hikes if economic outlook met
In a speech today, BoJ board member Junko Nakagawa indicated that the central bank will raise interest rates further if the economic outlook aligns with their forecasts. Nevertheless, she also emphasized the need to carefully consider how such moves might impact the broader economy and price stability.
"Given real interest rates are currently very low, we will adjust the degree of monetary support, from the standpoint of sustainably and stably achieving our 2% inflation target, if our economic and price forecasts are met," she noted.
Nakagawa acknowledged Japan's tight labor market and rising import prices as upside risks to the inflation outlook. While affirming that Japan's economic fundamentals remain strong, she highlighted the importance to "look back upon market developments" following July's rate hike before making any further rate adjustments.
GBP/USD Mid-Day Outlook
Daily Pivots: (S1) 1.3051; (P) 1.3079; (R1) 1.3109; More...
Intraday bias in GBP/USD stays neutral first with focus on 1.3043 resistance turned support. Strong rebound will maintain near term bullishness. Further break of 1.3265 will extend recent up trend to 100% projection of 1.2298 to 1.3043 from 1.2664 at 1.3409. However, firm break of 1.3043 will turn bias back to the downside for deeper pullback, to 55 D EMA (now at 1.2949) and possibly below.
In the bigger picture, up trend from 1.0351 (2022 low) is in progress. Next target is 38.2% projection of 1.0351 to 1.3141 from 1.2298 at 1.3364. For now, outlook will stay bullish as long as 1.2664 support holds, even in case of deep pullback.
Economic Indicators Update
| GMT | CCY | EVENTS | ACT | F/C | PP | REV |
|---|---|---|---|---|---|---|
| 06:00 | GBP | GDP M/M Jul | 0.00% | 0.20% | 0.00% | |
| 06:00 | GBP | Industrial Production M/M Jul | -0.80% | 0.30% | 0.80% | |
| 06:00 | GBP | Industrial Production Y/Y Jul | -1.20% | -0.20% | -1.40% | |
| 06:00 | GBP | Manufacturing Production M/M Jul | -1.00% | 0.20% | 1.10% | |
| 06:00 | GBP | Manufacturing Production Y/Y Jul | -1.30% | -0.10% | -1.50% | |
| 06:00 | GBP | Goods Trade Balance (GBP) Jul | -20.0B | -18.0B | -18.9B | |
| 12:30 | USD | CPI M/M Aug | 0.20% | 0.20% | 0.20% | |
| 12:30 | USD | CPI Y/Y Aug | 2.50% | 2.60% | 2.90% | |
| 12:30 | USD | CPI Core M/M Aug | 0.30% | 0.20% | 0.20% | |
| 12:30 | USD | CPI Core Y/Y Aug | 3.20% | 3.20% | 3.20% | |
| 14:30 | USD | Crude Oil Inventories | 0.9M | -6.9M |
US CPI slows to 2.5% yoy, core CPI unchanged at 3.2% yoy
US CPI rose 0.2% mom in August, matched expectations. However, core CPI rose 0.3% mom, above expectation of 0.2% mom. Shelter costs jumped 0.5% mom and was the main factor in the all items increase. Food index rose 0.1% mom while energy index fell -0.8% mom.
Over the 12-month period, CPI slowed from 2.9% yoy to 2.5% yoy, below expectation of 2.6% yoy. That's also the lowest annual increase since February 2021. But core CPI was unchanged at 3.2% yoy, matched expectations. Energy index fell -4.0% yoy while food prices rose 2.1% yoy.
EUR/USD Halted Its Decline: The Market Awaits US Inflation Data
EUR/USD halted its decline near a four-week low at 1.1034 on Wednesday. The information flow currently appears congested. The market is awaiting today’s US inflation release for August and is keeping an eye on the upcoming political debates between the main US presidential nominees. In addition, yesterday, the Fed outlined a plan to increase the capital of large banks by 9%. The banking sector was disappointed by this, with the proposal immediately gaining many critics.
Despite the abundance of news and events ahead, none of them is likely to influence the Fed’s upcoming interest rate decision. The meeting is scheduled for next week. The main scenario suggests a 25-basis-point reduction in borrowing costs, with the likelihood of the scenario estimated at 67%.
As for inflation expectations, CPI could have decreased to 2.6% y/y in August from the previous 2.9%. The indicator is projected to increase by 0.2% month-over-month as in July. Core inflation could have remained at 3.2% y/y. This data appears rather moderate largely due to core prices remaining unchanged. This may mean that the trend towards easing inflationary pressures is not as strong as wished to be.
EUR/USD technical analysis
On the EUR/USD H4 chart, the market is forming a downward wave structure, aiming for 1.0985. The price could reach this target level today. Subsequently, a consolidation range is expected to develop, extending up to 1.1026 and down to 1.0960. A breakout below the 1.0960 level may be considered a signal for a continuation of the trend to 1.0818. This scenario is technically supported by the MACD indicator, with its signal line below the zero level and pointing sharply downwards.
On the EUR/USD H1 chart, the market has completed a downward wave, reaching 1.1015, and today corrected towards 1.1049. The price is expected to decline to 1.0985. Subsequently, a consolidation range might form above this level, with the price expected to break below it. The third downward wave is forming, targeting 1.0818. This scenario is also technically supported by the Stochastic oscillator, whose signal line is above 80 and poised for a decline to 20.
NIESR expects 0.2% UK GDP growth in Q3, despite July stagnation
The National Institute of Economic and Social Research (NIESR) forecasts 0.2% GDP growth for the UK in Q3, driven by resilience in the services and construction sectors. This comes despite today’s data showing no growth in July, marking a weaker-than-expected start to the quarter.
Hailey Low, Associate Economist at NIESR, commented on the latest GDP figures, stating, “While today’s figures came in slightly weaker compared to the upbeat performance we have seen over the first half of the year, the strong start to 2024 will likely extend into the second half of the year.”
However, NIESR has noted signs of a slowdown in the final months of 2024. "High-frequency indicators are signaling a relative slowdown in momentum for the remainder of the year," Low added. Attention is now focused on the government's upcoming Autumn Statement, where policies aimed at sustaining long-term growth will be highly anticipated.
Gold Technical: Poised for a Potential Bullish Breakout as US CPI Looms
- In the past four weeks, Gold (XAU/USD) has traded in a tight range environment below US$2,532 key intermediate range resistance.
- Positive momentum reading and a major bearish breakdown seen in the 10-year US Treasury real yield may trigger a bullish breakout in Gold (XAU/USD).
- Watch the key medium-term support at US$2,435 for Gold (XAU/USD).
Since our last publication, the price actions of Gold (XAU/USD) have managed to stage a rebound above the US$2,353 bullish reversal level and resumed its impulsive upmove sequence to print a recent fresh all-time level of US$2,352 on 20 August.
Considering the upcoming key US inflation data release later today, where the core inflation rate for August is expected to show signs of a deceleration trend continuation of the inflationary conditions in the US, coming in at 3.2% y/y, a similar pace to 3.2% recorded in July, which was a three-month low.
Through the lens of technical analysis, several positive elements have emerged that may support a potential bullish breakout for Gold (XAU/USD) after four weeks of tight-range trading.
10-year US Treasury real yield has staged a major bearish breakdown
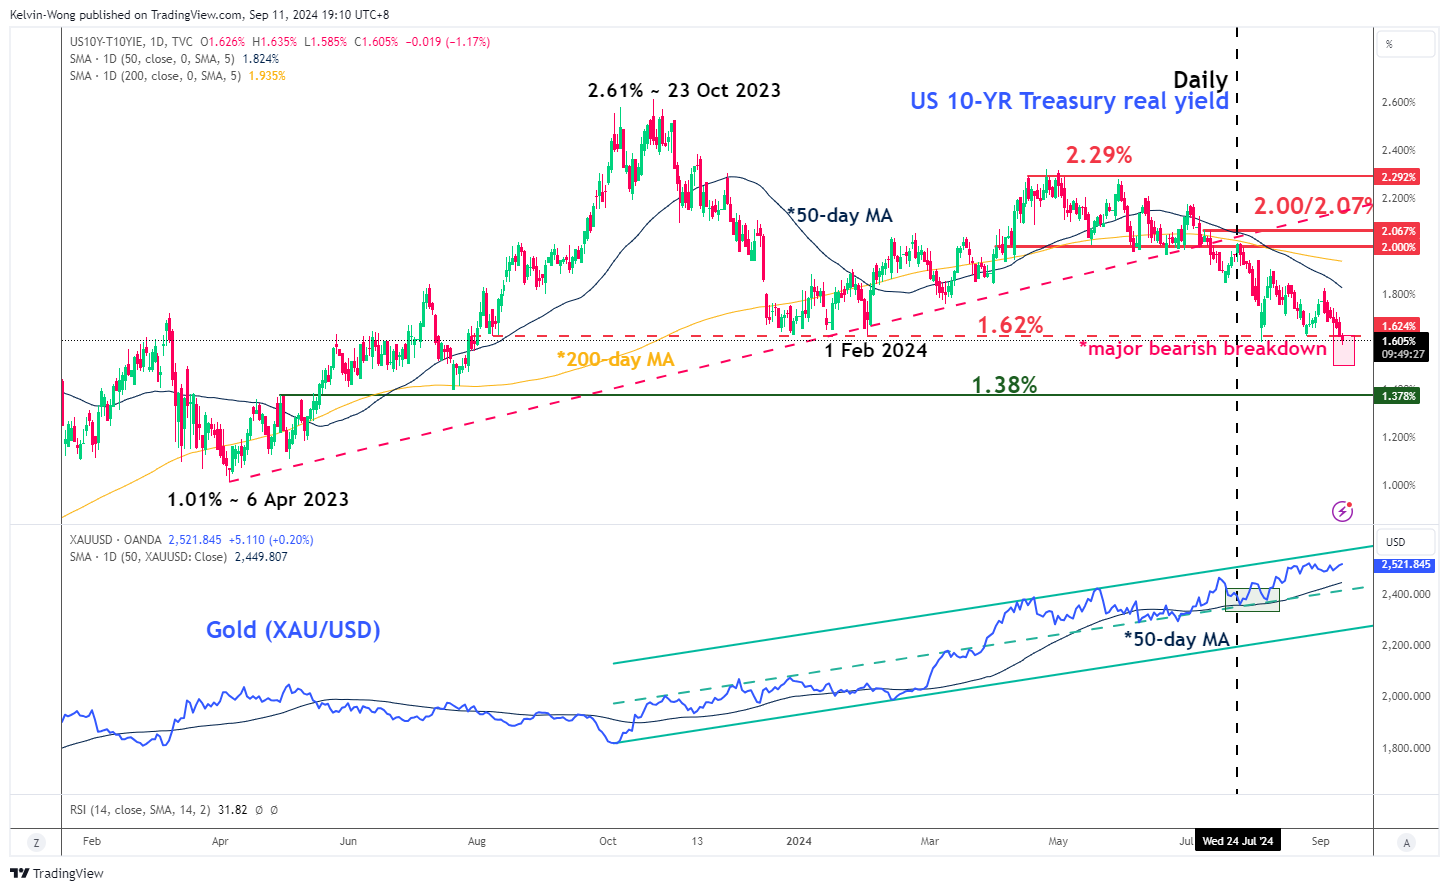
Fig 1: US 10-YR Treasury real yield major & medium-term trends as of 11 Sep 2024 (Source: TradingView, click to enlarge chart)
The 10-year US Treasury real yield is measured by subtracting the 10-year breakeven inflation rate derived from 10-year US Treasury Inflation-Protected Securities (TIPS) from the nominal 10-year US Treasury yield.
If the 10-year US Treasury real yield is trending downwards, it implies that the long-term real opportunity cost of holding Gold (XAU/USD) is reduced as Gold is a non-income bearing asset, and vice versa when the 10-year US Treasury real yield trends upwards (see Fig 1).
Right now, the 10-year US Treasury real yield has just breached below major support at 1.62% (in place since late December 2023) which suggests that Gold (XAU/USD) has become more valuable as its associated long-term opportunity costs may be further reduced given the next medium-term support of the 10-year US Treasury real yield rests at 1.38%.
Hence, it may propel more demand for Gold (XAU/USD) which in turn is likely to drive up its price.
Medium-term momentum remains positive for Gold
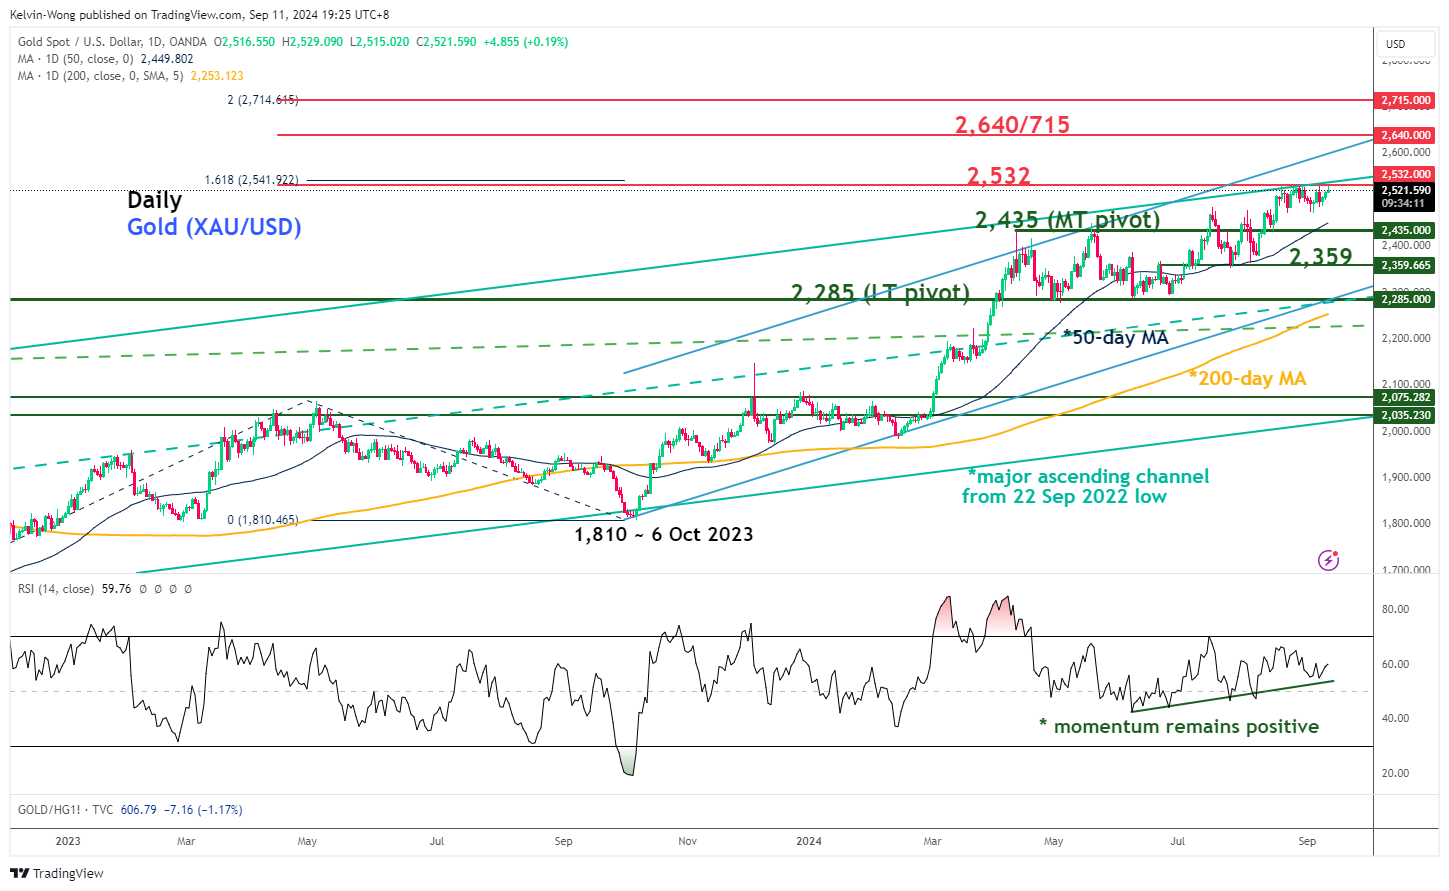
Fig 2: Gold (XAU/USD) major & medium-term trends as of 11 Sep 2024 (Source: TradingView, click to enlarge chart)
The price actions of Gold (XAU/USD) have continued to oscillate within its medium-term ascending channel in place since the 6 October 2023 low of US$1,810 and are supported by a rising 50-day moving average that is also confluences closely with its key medium-term pivotal support at US$2,435.
In addition, the daily RSI momentum indicator has continued to display a series of “higher lows” above its 50 level and has not reached an overbought condition.
These positive technical elements suggest that upside momentum may be building up for a potential bullish breakout for Gold XAU/USD, a clearance above US$2,532 may see the next medium-term resistance zone coming in at US2,640/715 in the first step (see Fig 2).
On the other hand, a break below US$2,435 negates the bullish scenario to kick start a potential multi-week corrective decline sequence within its medium-term and major uptrend phases to expose the next support at US$2,359, and below it sees an increased risk for an extension of the corrective decline towards the US$2,285 long-term pivotal support (also close to the 200-day moving average).
USD/JPY Outlook: Key Supports Under Pressure
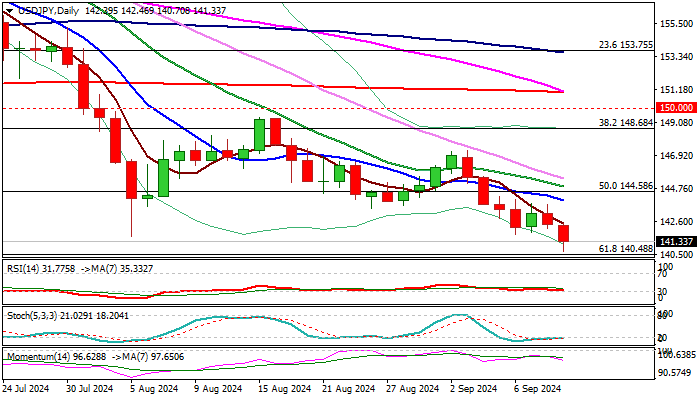
USDJPY fell to the lowest in 8 ½ months on Wednesday (140.70) following probe through pivotal support at 141.68 (Aug 5 spike low).
Subsequent bounce came from oversold conditions on daily chart, with partial profit taking to lift the price and position for fresh push lower.
Close below 141.68 is needed to confirm bearish continuation signal and open way for attack at next key levels: 140.48 (Fibo 61.8% of 127.22/161.95), 140.25 (Dec 28 low) and 140.00 (psychological), loss of which to risk deeper fall.
Upticks should be ideally capped under 142.50/143.00 zone to keep larger bears intact and provide better levels to re-enter larger downtrend.
Falling 10DMA (143.98) and broken Fibo 50% (144.58) mark upper pivots, violation of which would sideline bears.
Daily studies maintain strong negative momentum, with MA’s in full bearish configuration and converged 55/200DMA’s about to for a Death-cross and reinforce bearish signal.
Res: 141.55; 141.76; 142.50; 143.90.
Sup: 140.48; 140.25; 140.00; 138.60.
Elliott Wave Update: USD/JPY Moving into 138.00-140.00 Zone
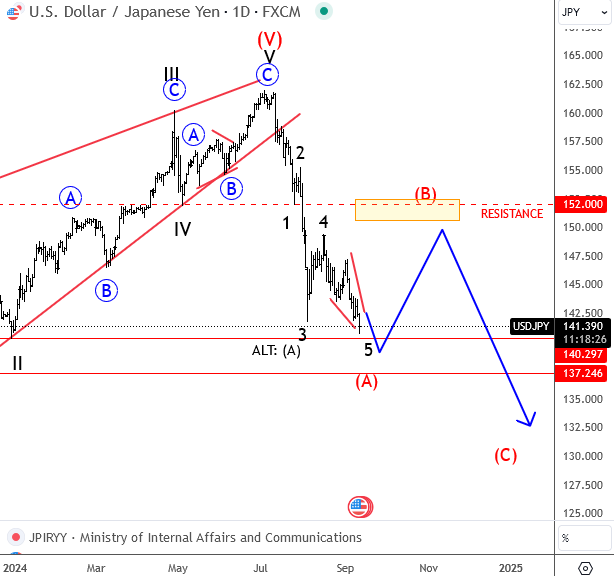
USD/JPY is finally topping out this year at our 162-164 resistance area, where we called the end of a big ending diagonal on the daily chart. Notice that the price is now falling sharply and impulsively through the lower trendline support and straight, all the way down to the starting point of the wedge pattern, which we see it as ongoing first leg (A) of a minimum larger three-wave A-B-C reversal down.
What's even more important is that we can see an impulsive decline in progress, with pair now trading at new lows,so it s sfifht wave, ideally an ending diagonal that can be slowly coming to an end; ideally, this moth we will see a bottom in 138-140 area.
Market Analysis: AUD/USD and NZD/USD Trim Gains, Are Bears Back?
AUD/USD declined below the 0.6720 and 0.6700 support levels. NZD/USD is also moving lower and might struggle to recover above 0.6200.
Important Takeaways for AUD/USD and NZD/USD Analysis Today
- The Aussie Dollar started a fresh decline from well above the 0.6700 level against the US Dollar.
- There is a connecting bearish trend line forming with resistance at 0.6660 on the hourly chart of AUD/USD at FXOpen.
- NZD/USD declined steadily from the 0.6255 resistance zone.
- There is a key bearish trend line forming with resistance at 0.6155 on the hourly chart of NZD/USD at FXOpen.
AUD/USD Technical Analysis
On the hourly chart of AUD/USD at FXOpen, the pair struggled to clear the 0.6765 zone. The Aussie Dollar started a fresh decline below the 0.6720 support against the US Dollar.
The pair even settled below 0.6700 and the 50-hour simple moving average. There was a clear move below 0.6670. A low was formed at 0.6640 and the pair is now consolidating losses. On the upside, an immediate resistance is near the 0.6660 level.
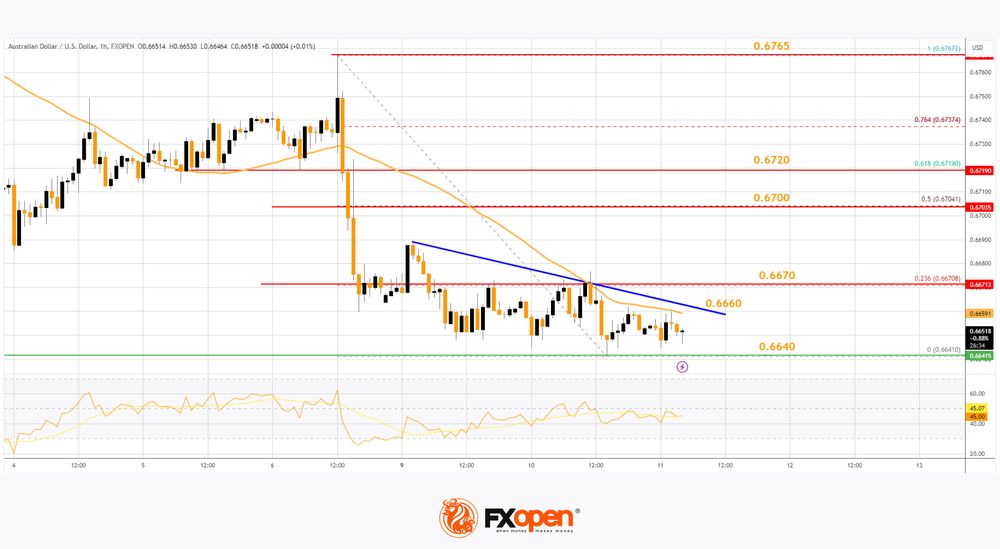
There is also a connecting bearish trend line with resistance at 0.6660. The next major resistance is near the 23.6% Fib retracement level of the downward move from the 0.6767 swing high to the 0.6641 low at 0.6670, above which the price could rise toward 0.6700.
Any more gains might send the pair toward the 61.8% Fib retracement level of the downward move from the 0.6767 swing high to the 0.6641 low at 0.6720. A close above the 0.6720 level could start another steady increase in the near term.
The next major resistance on the AUD/USD chart could be 0.6765. On the downside, initial support is near the 0.6640 zone. The next support sits at 0.6620. If there is a downside break below 0.6620, the pair could extend its decline. The next support could be 0.6550. Any more losses might send the pair toward the 0.6500 support.
NZD/USD Technical Analysis
On the hourly chart of NZD/USD on FXOpen, the pair also followed a similar pattern and declined from the 0.6255 zone. The New Zealand Dollar gained bearish momentum and traded below 0.6205 against the US Dollar.
The pair settled below the 0.6190 level and the 50-hour simple moving average. Finally, it tested the 0.6125 zone and is currently attempting a minor recovery wave. There was a move above the 23.6% Fib retracement level of the downward move from the 0.6254 swing high to the 0.6124 low.
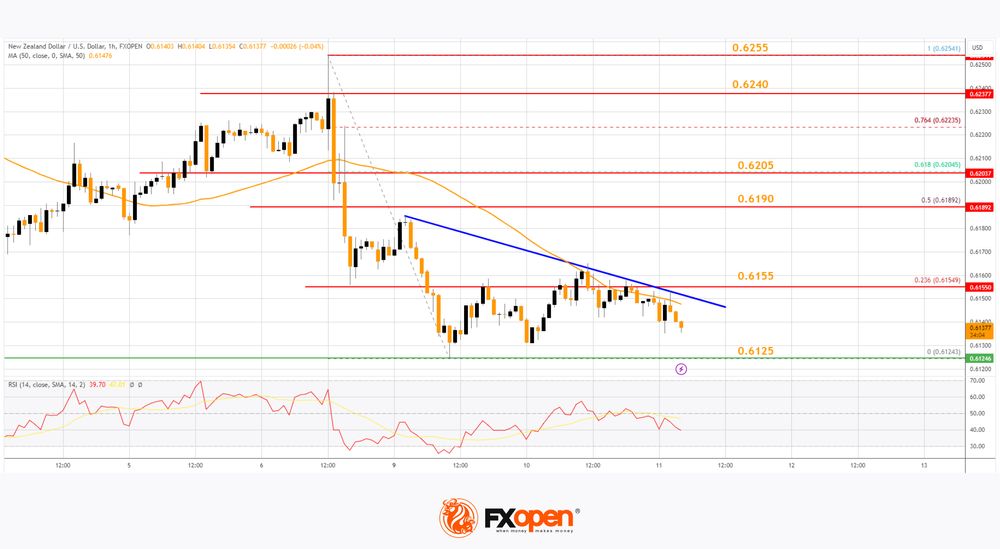
Immediate resistance on the upside is near 0.6150. There is also a key bearish trend line forming with resistance at 0.6155 and the 23.6% Fib retracement level of the downward move from the 0.6254 swing high to the 0.6124 low.
The next resistance is the 50% Fib retracement level of the downward move from the 0.6254 swing high to the 0.6124 low at 0.6190. If there is a move above 0.6190, the pair could rise toward 0.6240.
Any more gains might open the doors for a move toward the 0.6280 resistance zone in the coming days. On the downside, immediate support on the NZD/USD chart is near the 0.6125 level.
The next major support is near the 0.6080 zone. If there is a downside break below 0.6080, the pair could extend its decline toward the 0.6050 level. The next key support is near 0.6000.
Trade over 50 forex markets 24 hours a day with FXOpen. Take advantage of low commissions, deep liquidity, and spreads from 0.0 pips. Open your FXOpen account now or learn more about trading forex with FXOpen.
This article represents the opinion of the Companies operating under the FXOpen brand only. It is not to be construed as an offer, solicitation, or recommendation with respect to products and services provided by the Companies operating under the FXOpen brand, nor is it to be considered financial advice.