Sample Category Title
USD/JPY Analysis: Rate Drops to New Yearly Low
The USD/JPY chart shows the rate has fallen below its 5 August low.
This decline was influenced by comments from Bank of Japan representative Junko Nakagawa, who stated that the bank would continue raising interest rates if inflation keeps decreasing.
“Given that real interest rates are currently very low, we will adjust the level of monetary support to ensure the sustainable and stable achievement of our 2% inflation target,” she said.
Technical analysis of the USD/JPY chart shows:
→ Since early August, the price movement has fit within a descending channel (shown in red).
The price has fallen to the median of this channel, which continues to show signs of support (indicated by arrows).
Bearish dominance is evident as:
→ The 143.7 level has shifted from support to resistance, as previously happened with the 149 level.
→ The price is below the Resistance 1 trendline.
It’s worth noting that at 15:30 today, the US Consumer Price Index will be released, which is likely to cause increased market volatility.
As a result, bears may attempt to push the rate down to the psychological level of 140 yen per dollar as early as today.
Trade over 50 forex markets 24 hours a day with FXOpen. Take advantage of low commissions, deep liquidity, and spreads from 0.0 pips. Open your FXOpen account now or learn more about trading forex with FXOpen.
This article represents the opinion of the Companies operating under the FXOpen brand only. It is not to be construed as an offer, solicitation, or recommendation with respect to products and services provided by the Companies operating under the FXOpen brand, nor is it to be considered financial advice.
Crypto: Selling on Growth Continues
Market picture
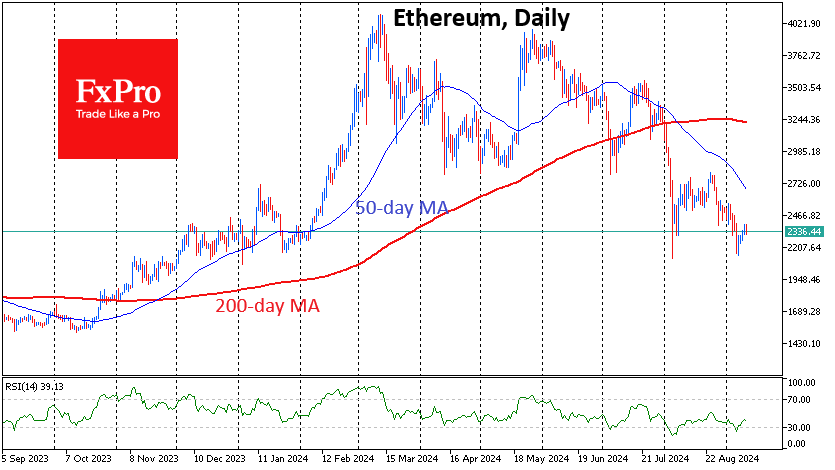
The cryptocurrency market lost 0.5% in the last 24 hours, falling to $1.99 trillion. As expected, the market failed to consolidate above the $2 trillion level due to the indecisiveness of major players ahead of the US inflation data. Selling has been prevalent since the start of the day, confirming the tactic of quick profit-taking.
Bitcoin is trading around $56.5K, having failed to break through the $58K mark twice since the start of the day on Tuesday. Bitcoin is densely populated by institutional investors, for whom macroeconomics and sentiment in traditional financial markets are the main short-term drivers.
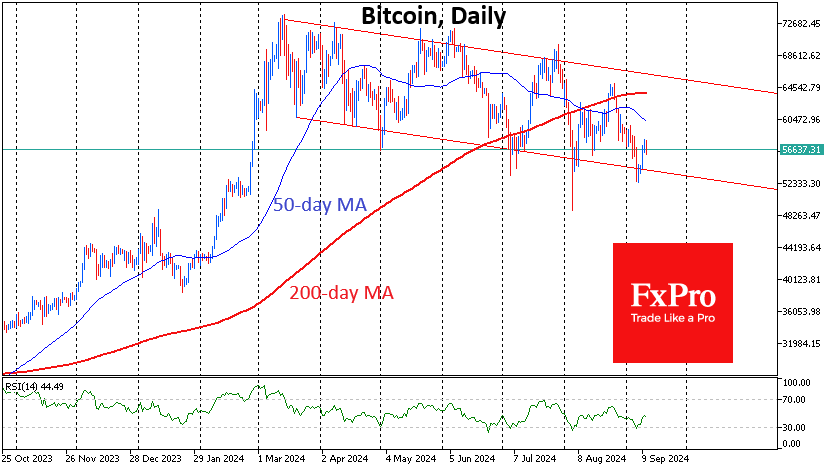
Interestingly, the introduction of ETFs has not yet had a positive impact on momentum. BTCUSD has been in a downtrend since March, while ETHUSD has been actively sold since the end of May. This is more a result of profit-taking by long-term investors after reaching an important milestone in the global adoption of cryptocurrencies rather than a negative effect of the presence of funds and corporates among the buyers. This process will not crash the market, but it has already broken the trend of 4-year cycles of strong growth during bitcoin’s halving years.
News background
According to QCP Capital, implied volatility in bitcoin options remains elevated due to the Trump-Harris debate and US consumer inflation data. Options market participants tend to be predominantly bearish into October.
Since August, USDT volume on cryptocurrency exchanges has been growing rapidly, which could potentially boost cryptocurrency prices, CryptoQuant noted. Previously, from March to July, the dynamics did not show significant fluctuations in turbulence.
According to journalist Colin Wu, total trading volume on the largest centralised exchanges increased by 30% in August. Turnover on the largest cryptocurrency platforms increased by 32%.
SEC recoveries in cryptocurrency-related enforcement actions increased 30-fold to a record $4.7 billion in 2024, largely due to a $4.47 billion settlement with Terraform Labs.
Japan-based Metaplanet announced the purchase of an additional 38,464 BTC ($2 million) at an average price of $54.786. Metaplanet’s reserves approached 400 BTC, with an average coin purchase price of around $66K over the period.
DOGS held the largest Meme Token Issue and Distribution (TGE) in the history of the crypto industry, leading to a surge in activity on the TON network. The DOGS meme token has 4.5 million unique holders.
Total commissions on the Solana network fell to a six-month low due to Pump. fun’s declining popularity.
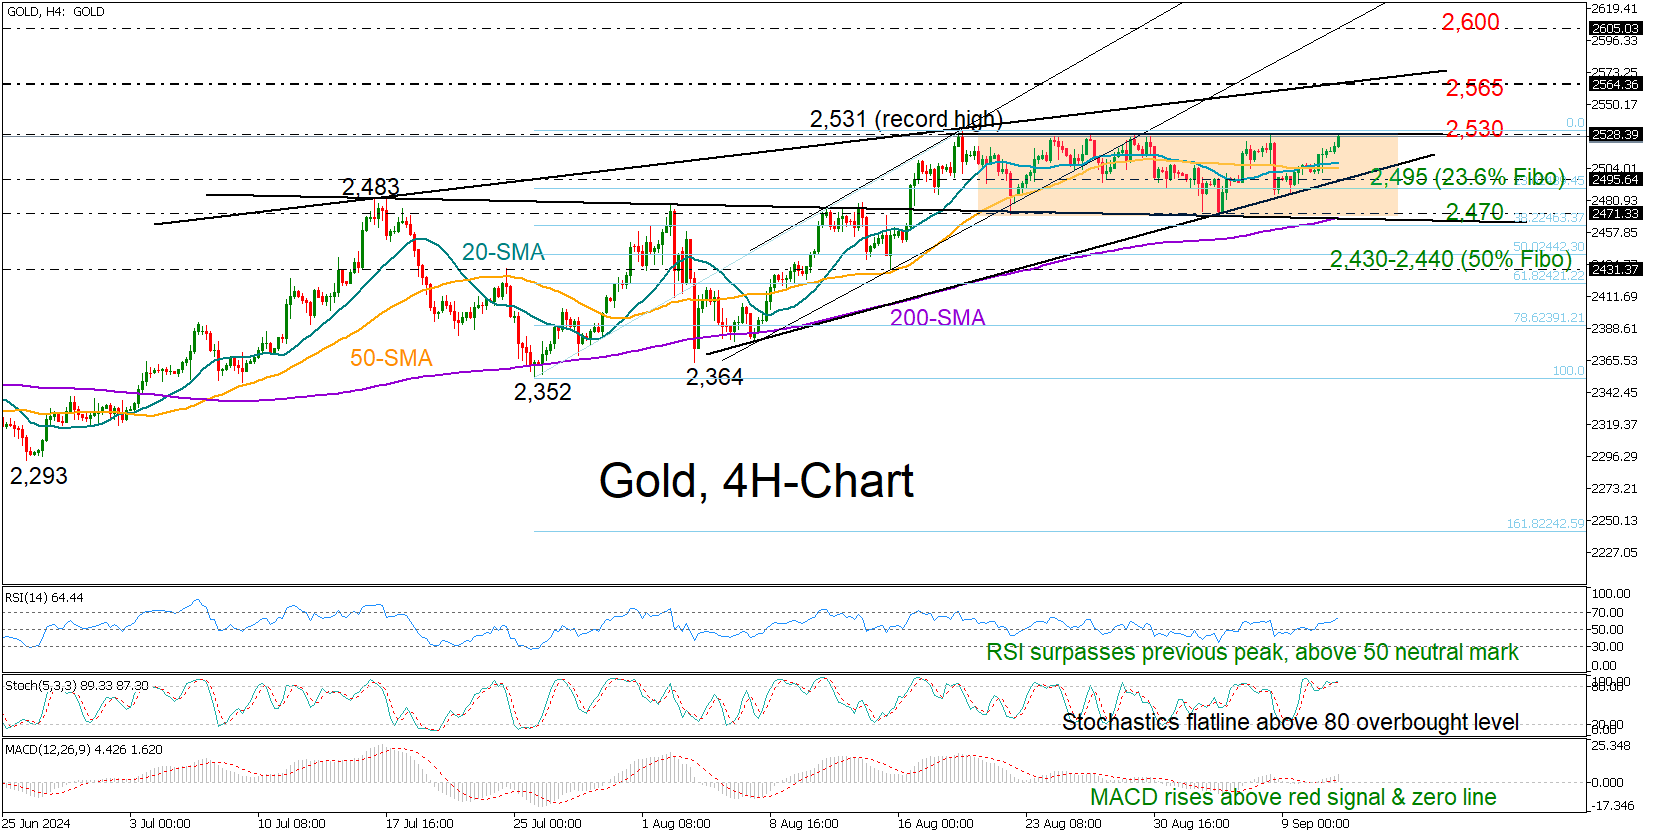
Gold Shifts Attention to Uncharted Territory
- Gold looks for a bullish breakout above rectangle
- Bullish sentiment dominates; stability cannot be ruled out
- US CPI inflation figures due for release at 12:30 GMT
Gold rapidly approached the upper band of its three-week-old tight range at 2,530, increasing the possibility of entering unexplored territory.
The ball is still on the bulls’ court according to the technical indicators in the four-hour chart. The RSI is making a new higher high above its 50 neutral mark and the MACD is progressing within the positive area, though its near its previous peak, and the stochastic oscillator is fluctuating within the overbought region, keeping some skepticism in place.
Should the long-term uptrend resume above 2,530, the precious metal could ascend towards the resistance line at 2,565. Then, a decisive move higher could face a psychological test near the 2,600 level, a break of which could bring the 2,650 zone next into view.
In the event of a downside reversal, the 2,495 region, which encapsulates the 23.6% Fibonacci retracement of the July-August upleg, could act as support, preventing a drop towards the 200-day SMA and the lower band of the rectangle pattern at 2,470. The 38.2% Fibonacci mark is within this neighborhood. Therefore, a clear violation of this base might upset traders, forcing a rapid correction towards the 50% Fibonacci of 2,440 and the August 15 low of 2,332.
Overall, gold is trying once again to break free from its short-term horizontal path and reach new record highs, with the technical signals backing the current bullish attempt.
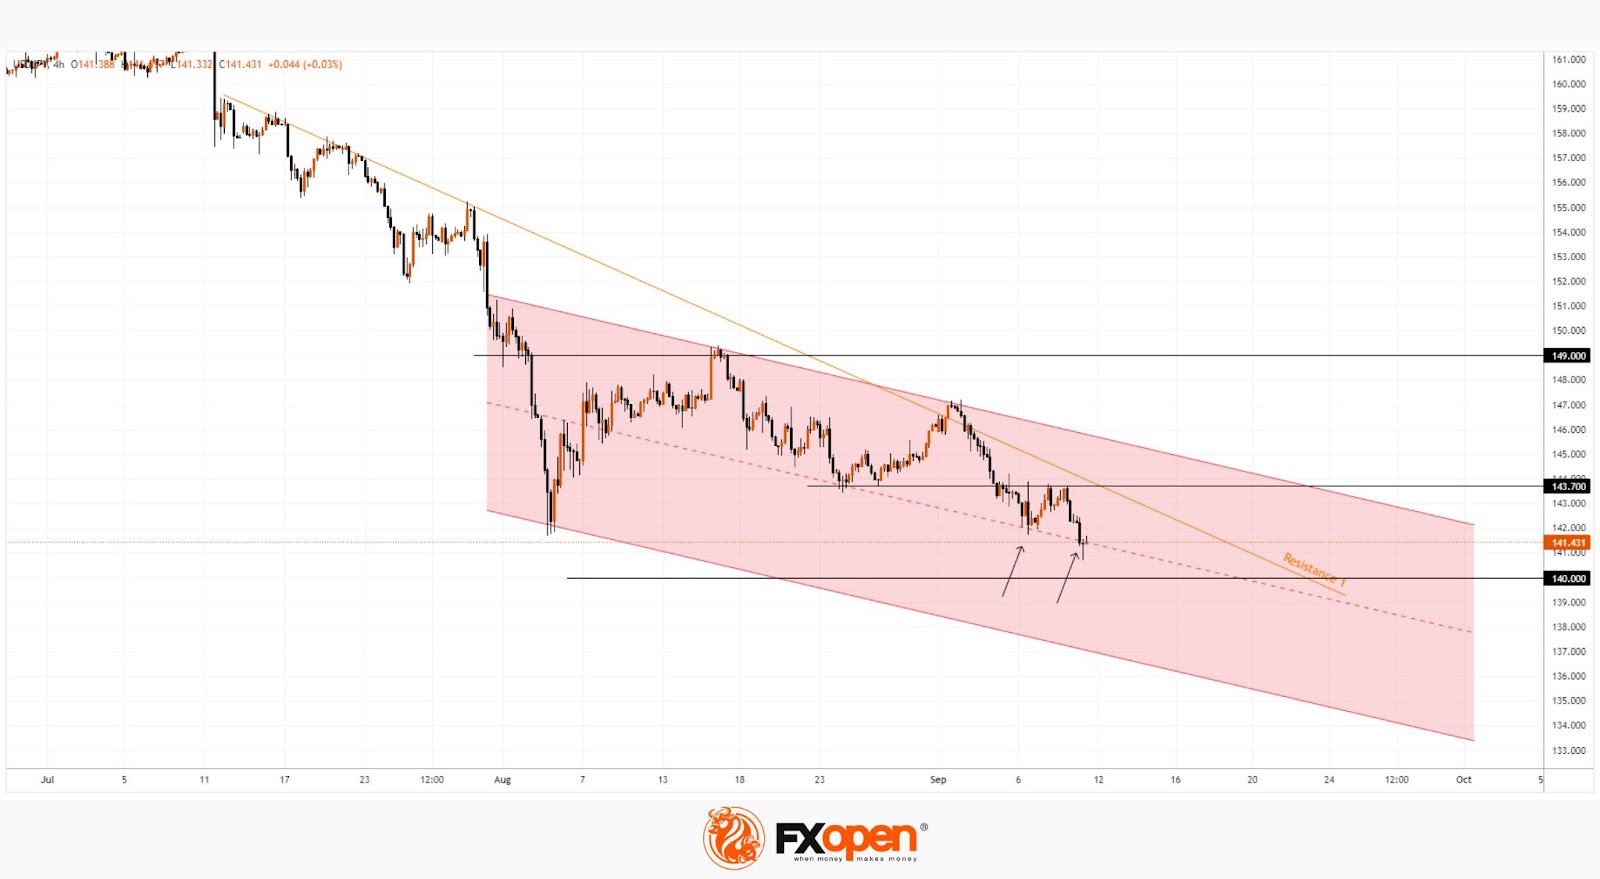
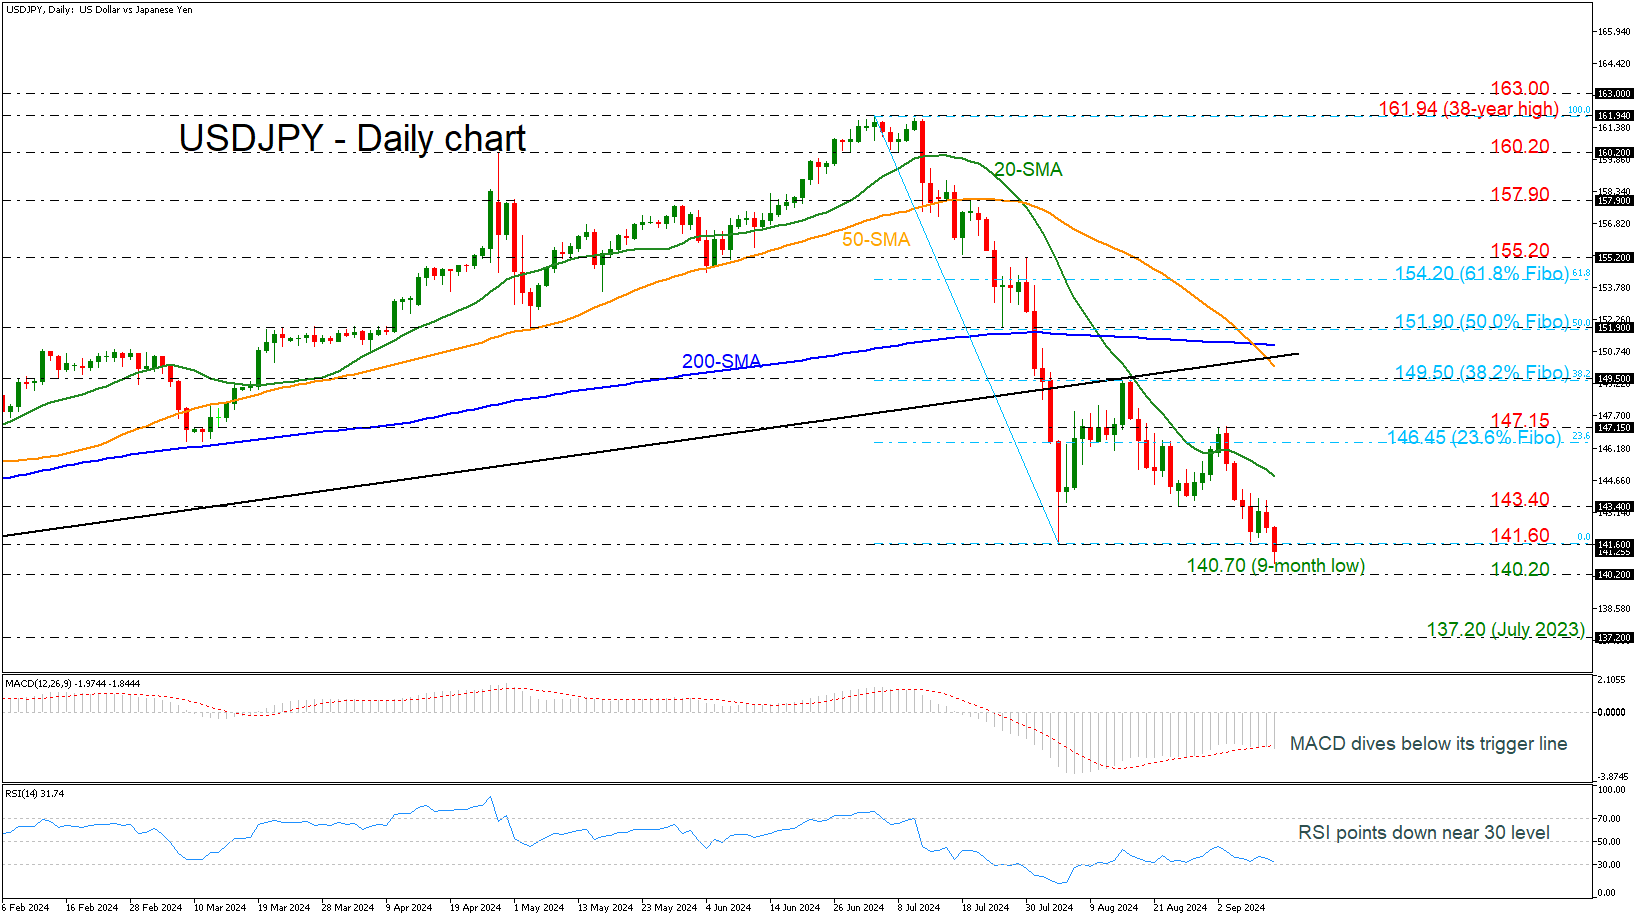
USDJPY Plummets to New 9-month Low
- USDJPY confirms the bearish structure
- Next support at 140.20
- Momentum oscillators keep moving negative
USDJPY tumbled to a fresh nine-month low of 140.70 earlier today, boosting the bearish structure that started at the beginning of July. If the market ends the day below the 141.60 strong barrier, then the focus will shift to the 140.20 support, taken from the lows in December 2023. Steeper declines could pave the way for a test of the July 2023 trough at 137.20.
On the other hand, a rebound from 141.60 could add some optimism about an upside correction, hitting the 143.40 resistance ahead of the 20-day SMA at 144.80. Rising further, the area within 146.45-147.15, which encapsulates the 23.6% Fibonacci retracement level of the downward wave from 161.94 to 141.60, may pause the upside move.
Technically, the MACD oscillator dives beneath its trigger line in the negative territory, while the RSI points down, approaching the oversold zone.
In summary, USDJPY plunged to a lower low today, indicating a bearish scenario. Only a decisive jump above the 200-day SMA at 151.00 may switch the outlook to neutral.
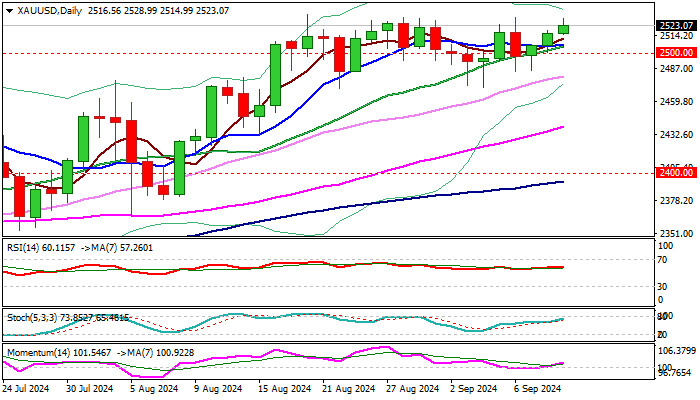
XAU/USD Outlook: Gold Price Nears Record High ahead of US Inflation Data
Gold price rose for the third consecutive day and came ticks ahead of new all-time high in early Wednesday’s trading.
Markets await the release of US August CPI report to complete the picture ahead of Fed policy meeting next week.
If Aug numbers come in line with expectations or better, it will signal that inflation remains in a downward trajectory and heading towards Fed’s 2% target, implying that 25 basis points cut will be likely scenario.
Markets widely expect the Fed to opt for three 0.25% rate cuts by the end of the year, though more aggressive action cannot be completely ruled out, amid recent weaker than expected US economic data which sparked fresh recession fears.
Overall, the yellow metal is expected to remain well supported by expected policy easing, as well as rising geopolitical tensions, which continue to fuel safe-haven demand.
Investors were not impressed by the US Presidential debate and prefer to stick to economic data rather than political promises.
Firmly bullish technical studies on daily chart are expected to contribute to positive outlook.
Although bulls will likely face increased headwinds at record high zone, eventual break above the top of multi-week consolidation range is seen as likely scenario.
Violation of $2431 peak will expose targets at $2554 and $2568 (Fibo projections) and round-figure barrier at $2600, which many analysts see as target for this year.
Near-term action is expected to remain biased higher while the price stays above psychological $2500 support, also the mid-point of the recent $2531/$2470 range.
Res: 2531; 2554; 2568; 2600.
Sup: 2514; 2507; 2500; 2480.
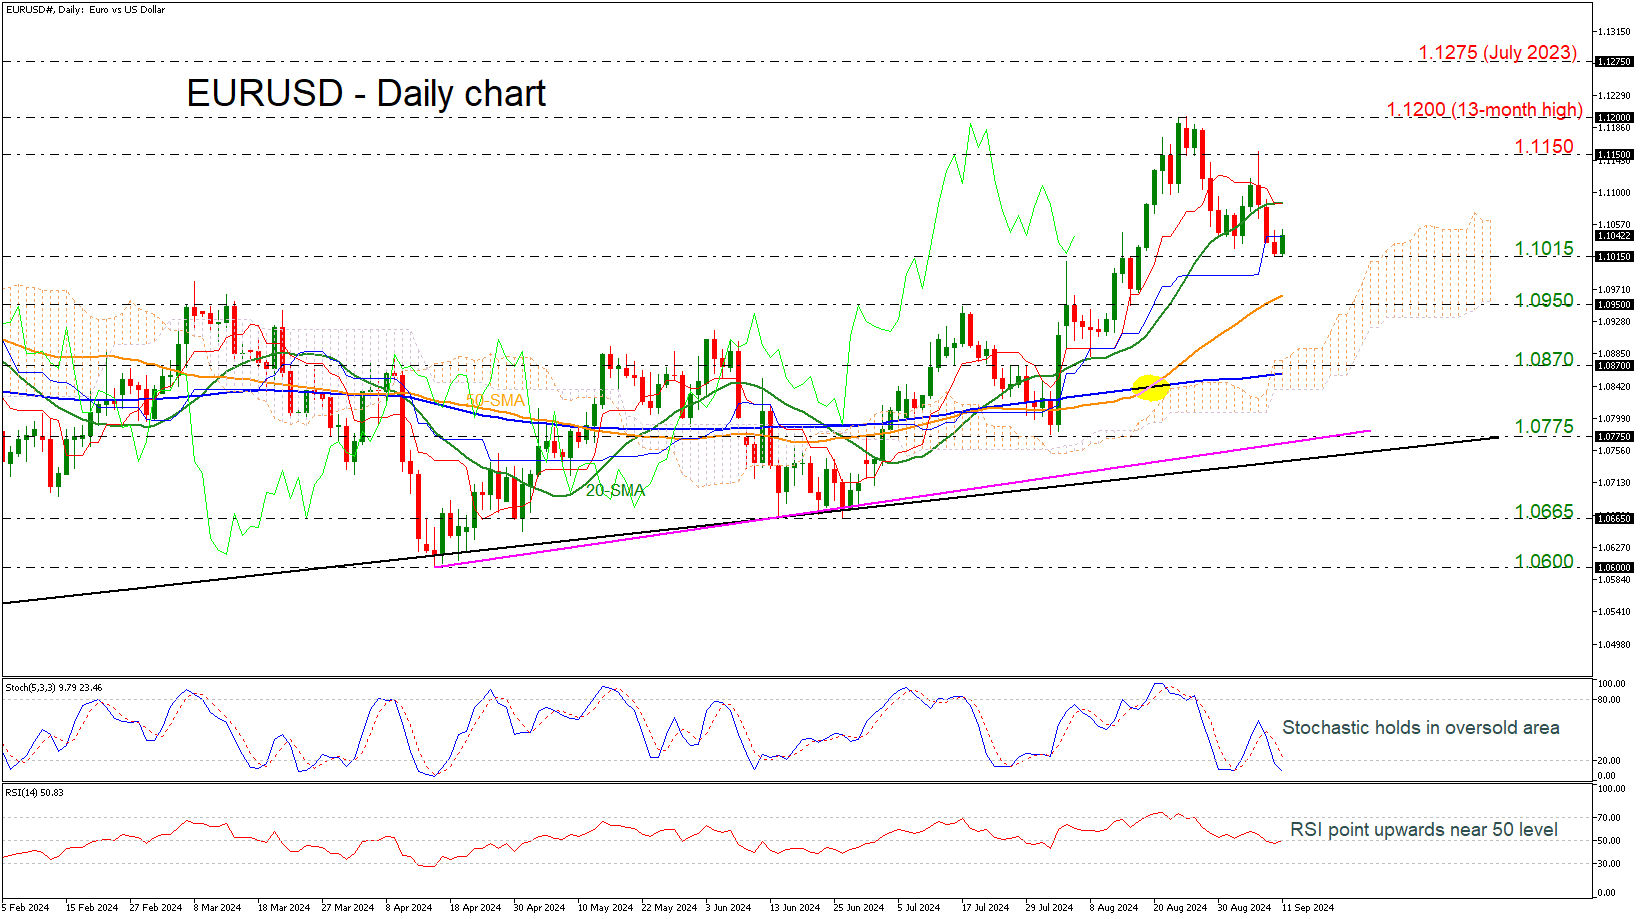
EURUSD Seems to Gave Found a Floor Above 1.1000
- EURUSD is higher again today
- Momentum indicators confirm an upside recovery
EURUSD found some footing around the 1.1015 support level and returned to the upside thereafter. The price failed to penetrate the 1.1000 psychological level where any rally higher may prove valuable to the market. The red Tenkan-sen however remains flat above the blue Kijun-sen and the RSI is currently flirting with the 50 level. Moreover, the stochastic oscillator is trying to tick up in the oversold territory, indicating the end of the bearish correction.
The pair could improve above the 20-day simple moving average (SMA) of 1.1085 to challenge a strong resistance around 1.1150. The 1.1200 area, however, which strictly capped bullish action last month, remains the big highlight.
A pull back may meet immediate support around the 1.1015 barrier, while slightly lower bears could try to overcome the 50-day SMA currently near 1.0965 and the 1.0950 level. Should the price retreat under these areas too, the 1.0870 bar and the 200-day SMA at 1.0860 could come under speculation.
In brief, EURUSD is facing upside pressure above 1.1000, with buyers waiting for a decisive close above 1.1200 to restore optimism over an up-trending market in the medium-term timeframe.
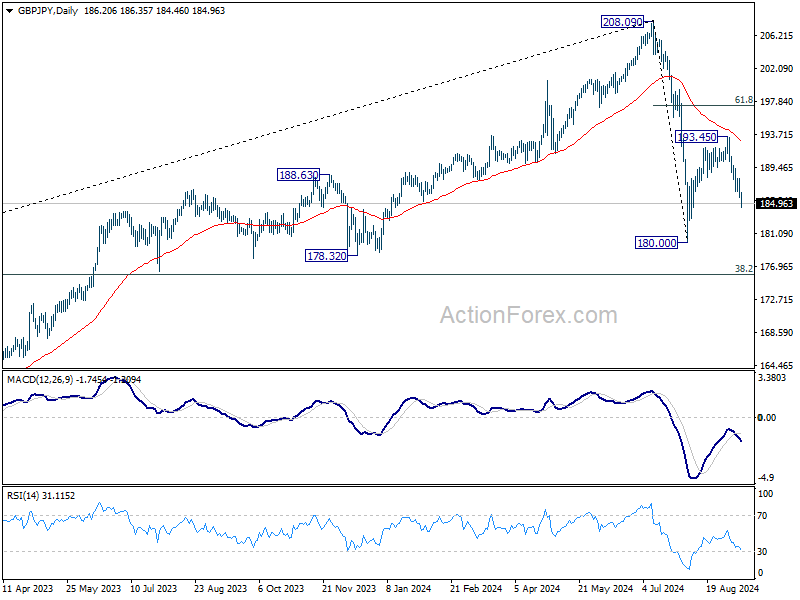
GBP/JPY Daily Outlook
Daily Pivots: (S1) 185.34; (P) 186.72; (R1) 187.71; More...
GBP/JPY's fall from 193.45 extends lower today and intraday bias stays on the downside for retesting 180.00 low. Break there will resume whole fall from 208.09. On the upside, above 188.08 minor resistance will turn intraday bias neutral.
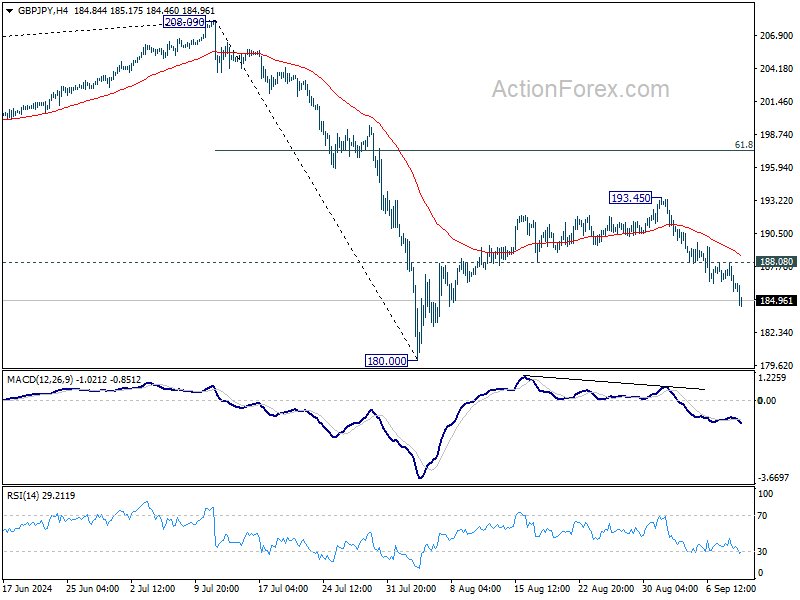
In the bigger picture, price actions from 208.09 are seen as a correction to whole rally from 123.94 (2020 low). The range of consolidation should be set between 38.2% retracement of 123.94 to 208.09 at 175.94 and 208.09. However, decisive break of 175.94 will argue that deeper correction is underway.
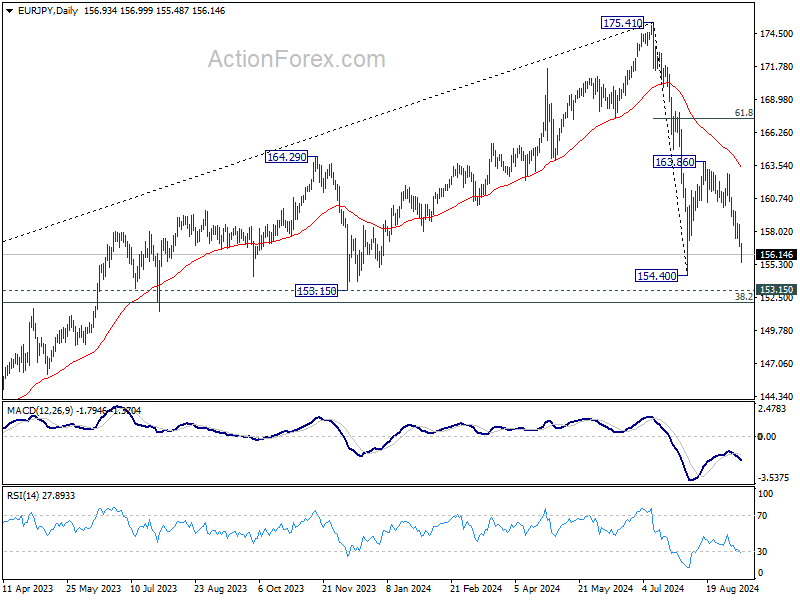
EUR/JPY Daily Outlook
Daily Pivots: (S1) 156.31; (P) 157.47; (R1) 158.15; More....
Intraday bias in EUR/JPY remains on the downside as fall from 163.86 is extending lower. Retest of 154.40 low should be seen first. Firm break there will resume whole decline from 175.41 to 153.15 support. On the upside, above 158.62 minor resistance will turn intraday bias neutral first.
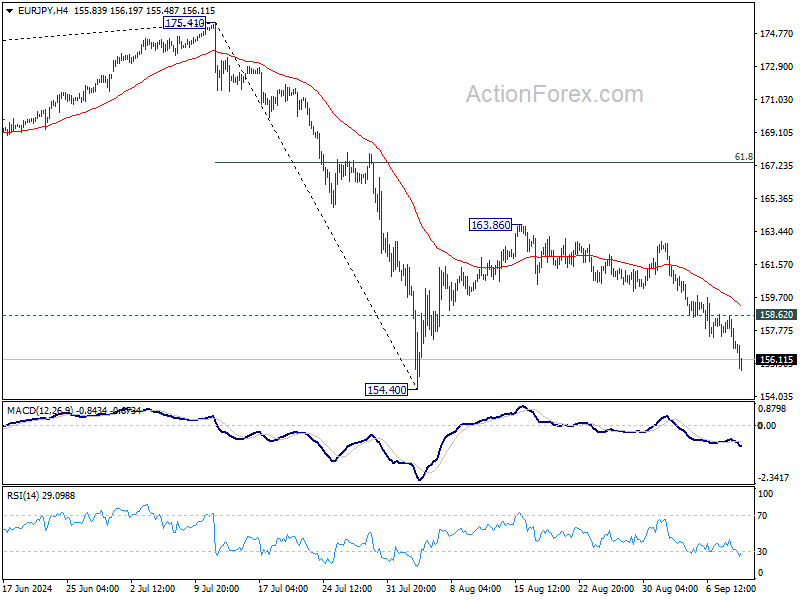
In the bigger picture, price actions from 175.41 are seen as correction to rally from 114.42 (2020 low). The range of consolidation should have been set between 38.2% retracement of 114.42 to 175.41 at 152.11 and 175.41 high. However, decisive break of 152.11 would argue that deeper correction is underway.
EUR/GBP Daily Outlook
Daily Pivots: (S1) 0.8417; (P) 0.8432; (R1) 0.8441; More...
No change in EUR/GBP's outlook as consolidation from 0.8399 is still in progress. Intraday bias stays neutral. Further decline is expected with 0.8466 resistance intact. On the downside, below 0.8399 will resume the fall from 0.8624 and target 0.8382 support. Firm break there will resume larger down trend.
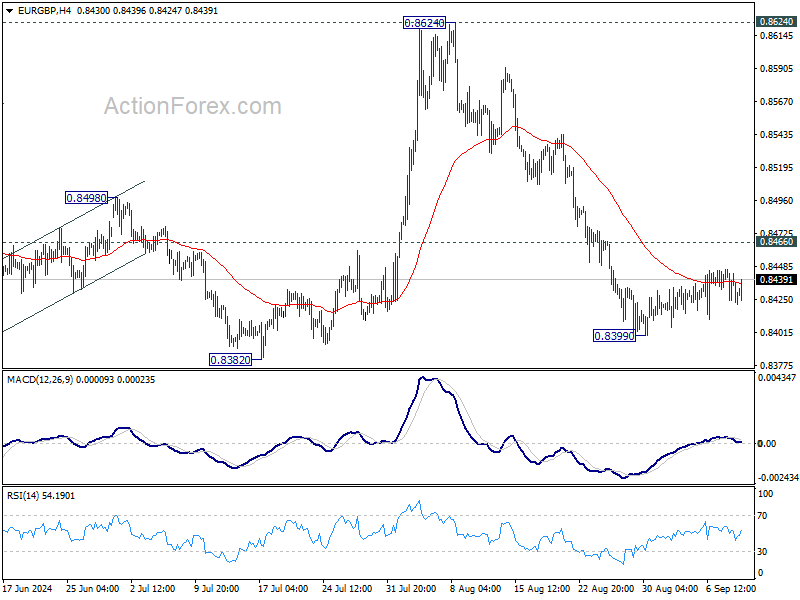
In the bigger picture, as long as 0.8624 resistance holds, down trend from 0.9267 is expected to continue. Firm break of 0.8382 will target 0.8201 (2022 low). However, decisive break of 0.8624 will indicate that such down trend has completed, and turn outlook bullish for 0.8764 resistance next.
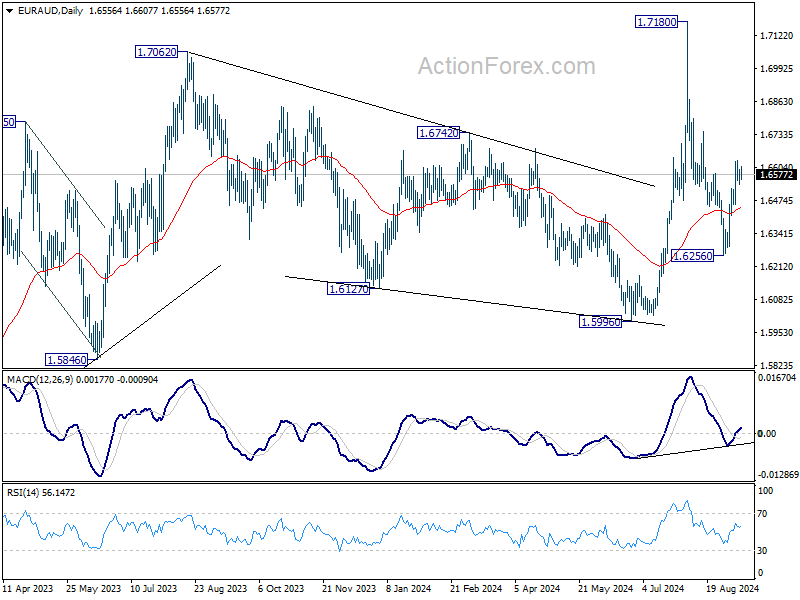
EUR/AUD Daily Outlook
Daily Pivots: (S1) 1.6536; (P) 1.6568; (R1) 1.6596; More...
Further rally is expected in EUR/AUD with 1.6457 support intact, despite loss of momentum. Rebound from 1.6256 is expected to continue to retest 17180 high. On the downside, however, break of 1.6457 support will turn bias back to the downside for 1.6256 again.
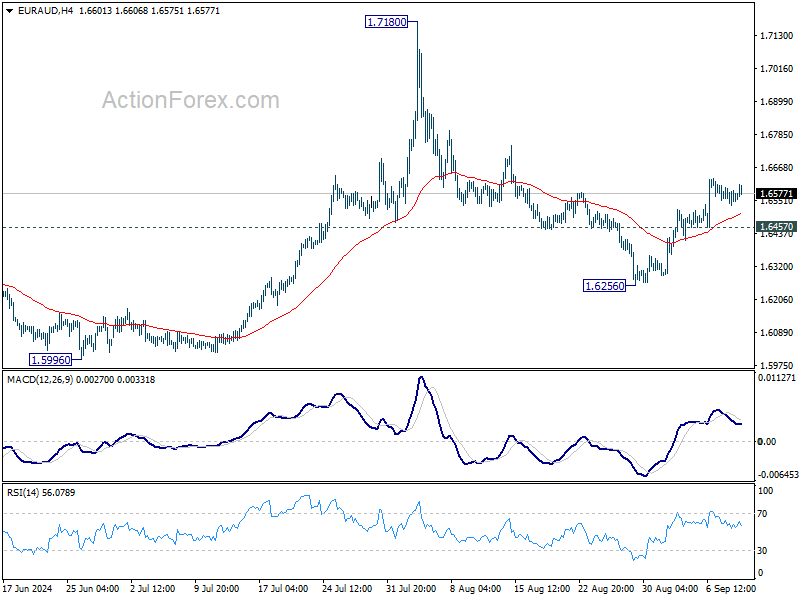
In the bigger picture, outlook is mixed up by the deeper than expected fall from 1.7180. Yet as long as 1.5996 support holds, up trend from 1.4281 (2022 low) is still expected to resume at a later stage. Firm break of 1.7180 will pave the way to 61.8% projection of 1.4281 to 1.7062 from 1.5996 at 1.7715.