Sample Category Title
USD/JPY Daily Outlook
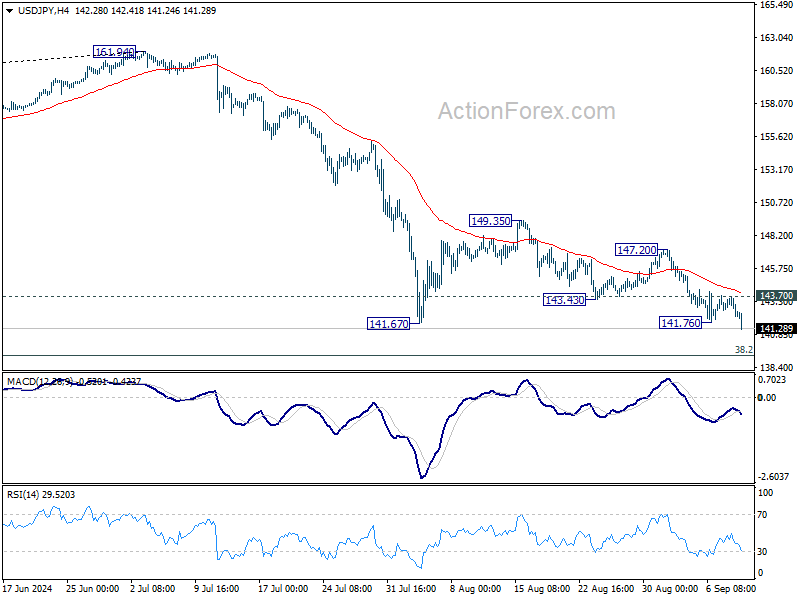
Daily Pivots: (S1) 141.86; (P) 142.79; (R1) 143.37; More...
USD's fall from 161.94 resumed by breaking through 141.76 temporary low. Intraday bias is back on the downside for 140.25 support, and possibly further to 139.26 fibonacci level too. On the upside, above 143.70 minor resistance will turn intraday bias neutral first. But outlook will stay bearish as long as 147.20 resistance holds, in case of recovery.
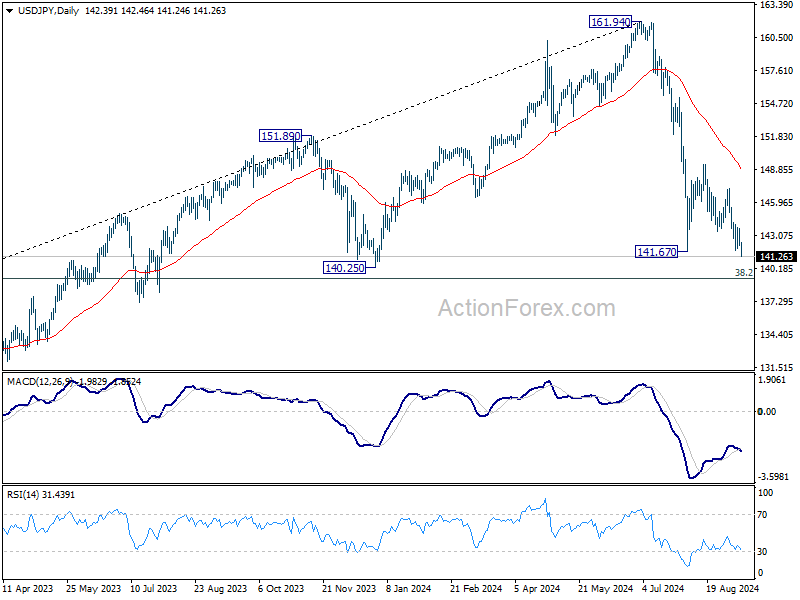
In the bigger picture, fall from 161.94 medium term top is seen as correcting whole up trend from 102.58 (2021 low). Deeper decline could be seen to 38.2% retracement of 102.58 to 161.94 at 139.26, which is close to 140.25 support. Strong support could be seen there to bring rebound. But in any case, risk will stay on the downside as long as 55 W EMA (now at 148.93) holds. Sustained break of 139.26 would open up deeper medium term decline to 61.8% retracement at 125.25.
Dollar Weakens as Treasury Yields Slip, Market Awaits US CPI for Clarity on Fed’s Next Move
Dollar softened across the board in today's Asian session, dragged down by extended in US Treasury yields. Investors appear to be setting aside the first presidential debate between Kamala Harris and Donald Trump, focusing instead on the highly anticipated US CPI report, which might hopefully provide clearer direction on Fed's upcoming interest rate cut.
Market expectations suggest that headline CPI will ease from 2.9% to 2.6% in August. However, core CPI, which excludes volatile food and energy prices, is forecast to remain unchanged at 3.2%. This would indicate that disinflationary momentum may be losing steam again, with services and shelter costs keeping core inflation elevated.
A downside surprise in today's report could shift the odds toward a larger 50bps rate cut by the Fed at next week's meeting. But the market reaction could be complicated: a significant undershoot in inflation could, at the same time, signal weakening demand, raising concerns about a broader economic slowdown.
As of now, futures markets are pricing in a 33% chance of a 50bps rate cut, with the majority (67%) betting on a smaller 25bps cut. Looking further ahead, markets are already pricing in a total of 75bps in cuts by year-end, with 90% chance of 100bps in reductions and 53% chance of 125bps.
In terms of market performance, Yen is the standout performer so far this week, buoyed by the drop in Treasury yields. Dollar and Swiss Franc follow closely behind. Euro is the weakest, with New Zealand Dollar and British Pound also underperforming, while Australian and Canadian Dollars are trading in the middle of the pack.
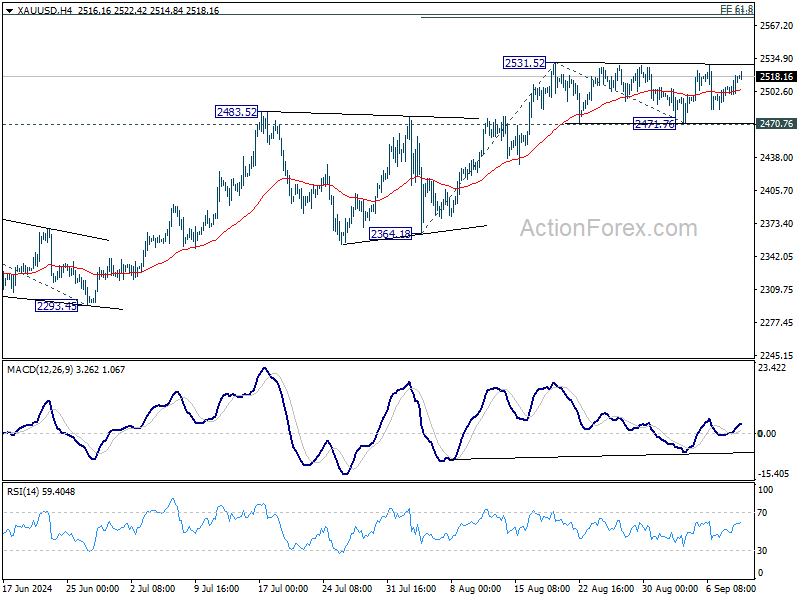
Technically, Gold will be monitored for confirming Dollar's next move in reaction to US CPI release. Consolidation from 2531.52 is still extending for now, but outlook remains bullish as long as 2470.76 support holds. Decisive break of 2531.52 will confirm larger up trend resumption. Next target will be 61.8% projection of 2364.18 to 2531.52 from 2471.76 at 2575.17.
In Asia, at the time of writing, Nikkei is down -0.81%. Hong Kong HSI is down -1.41%. China Shanghai SSE is down -0.86%. Singapore Strait Times is up 0.44%. Japan 10-year JGB yield is down -0.030 at 0.865. Overnight, DOW fell -0.23%. S&P 500 rose 0.45%. NASDAQ rose 0.84%. 10-year yield fell -0.51 to 3.646.
RBA's Hunter anticipates slow cooling of Australia's labor market
In a speech today, RBA Assistant Governor Sarah Hunter highlighted that while conditions in the Australian labor market have eased since late 2022, the market remains "tight relative to full employment."
Looking ahead, Hunter expects labor demand to slow in comparison to labor supply, which should bring the market "into better balance" over the coming quarters. She noted that part of this adjustment is likely to come through a "decline in average hours" worked rather than sharp cuts to overall employment.
Employment growth is expected to persist but at a slower pace, lagging behind population growth. As a result, underutilization measures, including the unemployment rate, are projected to "continue rising gradually." This rise is expected to stabilize once GDP growth returns to a level more consistent with Australia's underlying economic trend.
Hunter's comments underscore RBA's outlook on the labor market, and the hawkish stance that it's not nearing the start of rates reduction cycle yet.
BoJ's Nakagawa signals more rate hikes if economic outlook met
In a speech today, BoJ board member Junko Nakagawa indicated that the central bank will raise interest rates further if the economic outlook aligns with their forecasts. Nevertheless, she also emphasized the need to carefully consider how such moves might impact the broader economy and price stability.
"Given real interest rates are currently very low, we will adjust the degree of monetary support, from the standpoint of sustainably and stably achieving our 2% inflation target, if our economic and price forecasts are met," she noted.
Nakagawa acknowledged Japan's tight labor market and rising import prices as upside risks to the inflation outlook. While affirming that Japan's economic fundamentals remain strong, she highlighted the importance to "look back upon market developments" following July's rate hike before making any further rate adjustments.
Looking ahead
UK GDP and production are the main highlight in European session. Later in the day, US CPI will be the main event.
USD/JPY Daily Outlook
Daily Pivots: (S1) 141.86; (P) 142.79; (R1) 143.37; More...
USD's fall from 161.94 resumed by breaking through 141.76 temporary low. Intraday bias is back on the downside for 140.25 support, and possibly further to 139.26 fibonacci level too. On the upside, above 143.70 minor resistance will turn intraday bias neutral first. But outlook will stay bearish as long as 147.20 resistance holds, in case of recovery.
In the bigger picture, fall from 161.94 medium term top is seen as correcting whole up trend from 102.58 (2021 low). Deeper decline could be seen to 38.2% retracement of 102.58 to 161.94 at 139.26, which is close to 140.25 support. Strong support could be seen there to bring rebound. But in any case, risk will stay on the downside as long as 55 W EMA (now at 148.93) holds. Sustained break of 139.26 would open up deeper medium term decline to 61.8% retracement at 125.25.
Economic Indicators Update
| GMT | Ccy | Events | Actual | Forecast | Previous | Revised |
|---|---|---|---|---|---|---|
| 06:00 | GBP | GDP M/M Jul | 0.20% | 0.00% | ||
| 06:00 | GBP | Industrial Production M/M Jul | 0.30% | 0.80% | ||
| 06:00 | GBP | Industrial Production Y/Y Jul | -0.20% | -1.40% | ||
| 06:00 | GBP | Manufacturing Production M/M Jul | 0.20% | 1.10% | ||
| 06:00 | GBP | Manufacturing Production Y/Y Jul | -0.10% | -1.50% | ||
| 06:00 | GBP | Goods Trade Balance (GBP) Jul | -18.0B | -18.9B | ||
| 12:30 | USD | CPI M/M Aug | 0.20% | 0.20% | ||
| 12:30 | USD | CPI Y/Y Aug | 2.60% | 2.90% | ||
| 12:30 | USD | CPI Core M/M Aug | 0.20% | 0.20% | ||
| 12:30 | USD | CPI Core Y/Y Aug | 3.20% | 3.20% | ||
| 14:30 | USD | Crude Oil Inventories | 0.9M | -6.9M |
Gold Awaits US CPI Report, $2,530 Presents Resistance
Key Highlights
- Gold is consolidating gains below the $2,530 resistance.
- A key contracting triangle is forming with support at $2,495 on the 4-hour chart.
- Oil prices might extend losses and revisit the $65.00 support.
- The US Consumer Price Index might increase by 2.6% in August 2024 (YoY), down from 2.9%.
Gold Price Technical Analysis
Gold prices started a consolidation phase below $2,530 against the US Dollar. The price stayed above the $2,480 zone but struggled to start a fresh increase.
The 4-hour chart of XAU/USD indicates that the price remained stable above the 100 Simple Moving Average (red, 4 hours) and the 200 Simple Moving Average (green, 4 hours). Recently, there was an upward move within a range and the price climbed above $2,500.
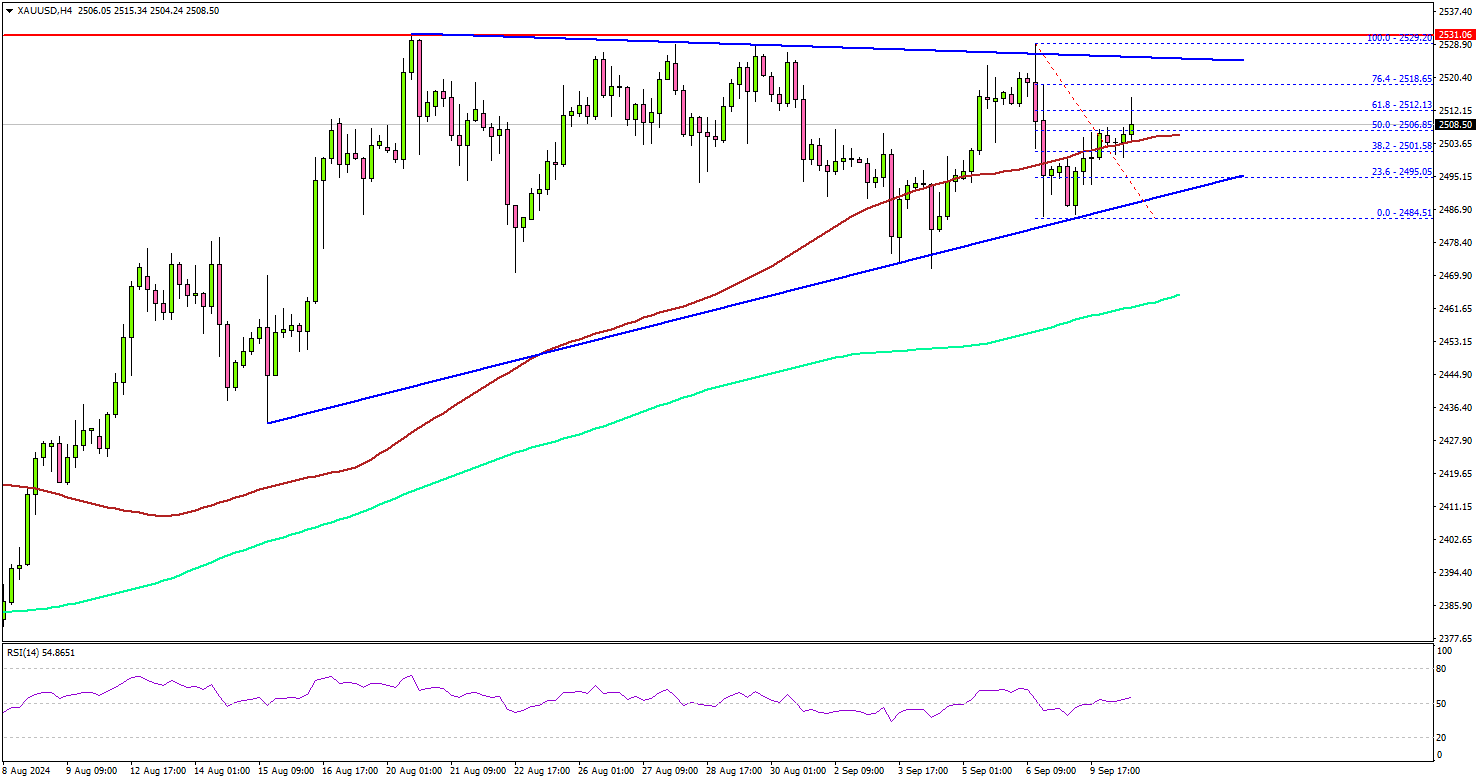
However, the bears remained active below the $2,520 and $2,530 resistance levels. There is also a key contracting triangle forming with support at $2,495 on the same chart.
The main support is now near $2,480. A downside break below the $2,480 support might call for more downsides. The next major support is near the $2,465 level and the 200 Simple Moving Average (green, 4 hours).
Any more losses might send gold prices toward $2,420. On the upside, immediate resistance is near the $2,520 level. The first major resistance sits near the $2,530 level.
A clear move above the $2,530 resistance could open the doors for more upsides. The next major resistance could be near $2,550, above which the price could rally toward the $2,565 level. Any more gains might send Gold toward the $2,580 resistance.
Looking at Oil, the price extended losses below the $68.50 level and there are chances of more downsides in the near term.
Economic Releases to Watch Today
- US Consumer Price Index for August 2024 (MoM) – Forecast +0.2%, versus +0.2% previous.
- US Consumer Price Index for August 2024 (YoY) – Forecast +2.6%, versus +2.9% previous.
- US CPI Ex Food & Energy for August 2024 (YoY) – Forecast +3.2%, versus +3.2% previous.
BoJ’s Nakagawa signals more rate hikes if economic outlook met
In a speech today, BoJ board member Junko Nakagawa indicated that the central bank will raise interest rates further if the economic outlook aligns with their forecasts. Nevertheless, she also emphasized the need to carefully consider how such moves might impact the broader economy and price stability.
"Given real interest rates are currently very low, we will adjust the degree of monetary support, from the standpoint of sustainably and stably achieving our 2% inflation target, if our economic and price forecasts are met," she noted.
Nakagawa acknowledged Japan's tight labor market and rising import prices as upside risks to the inflation outlook. While affirming that Japan’s economic fundamentals remain strong, she highlighted the importance to "look back upon market developments"" following July's rate hike before making any further rate adjustments.
RBA’s Hunter anticipates slow cooling of Australia’s labor market
In a speech today, RBA Assistant Governor Sarah Hunter highlighted that while conditions in the Australian labor market have eased since late 2022, the market remains "tight relative to full employment."
Looking ahead, Hunter expects labor demand to slow in comparison to labor supply, which should bring the market "into better balance" over the coming quarters. She noted that part of this adjustment is likely to come through a "decline in average hours" worked rather than sharp cuts to overall employment.
Employment growth is expected to persist but at a slower pace, lagging behind population growth. As a result, underutilization measures, including the unemployment rate, are projected to "continue rising gradually." This rise is expected to stabilize once GDP growth returns to a level more consistent with Australia's underlying economic trend.
Hunter's comments underscore RBA's outlook on the labor market, and the hawkish stance that it's not nearing the start of rates reduction cycle yet.
US Treasury Yields Decline Boosts Gold Prices
Gold prices went up by 0.30% on Tuesday as US Treasury yields dropped and the US dollar weakened, with traders waiting for important US inflation data. This data, along with the first presidential debate between Kamala Harris and Donald Trump, may influence the market's mood. Gold (XAUUSD) is currently trading at $2,514, recovering from a low of $2,500. The chances of a Federal Reserve interest rate cut are high, with a 67% likelihood of a 25 basis point reduction and a 33% chance for a 50 basis point cut. Recent US job data showed fewer new jobs than expected, but the unemployment rate fell slightly, offering some relief to the Fed.
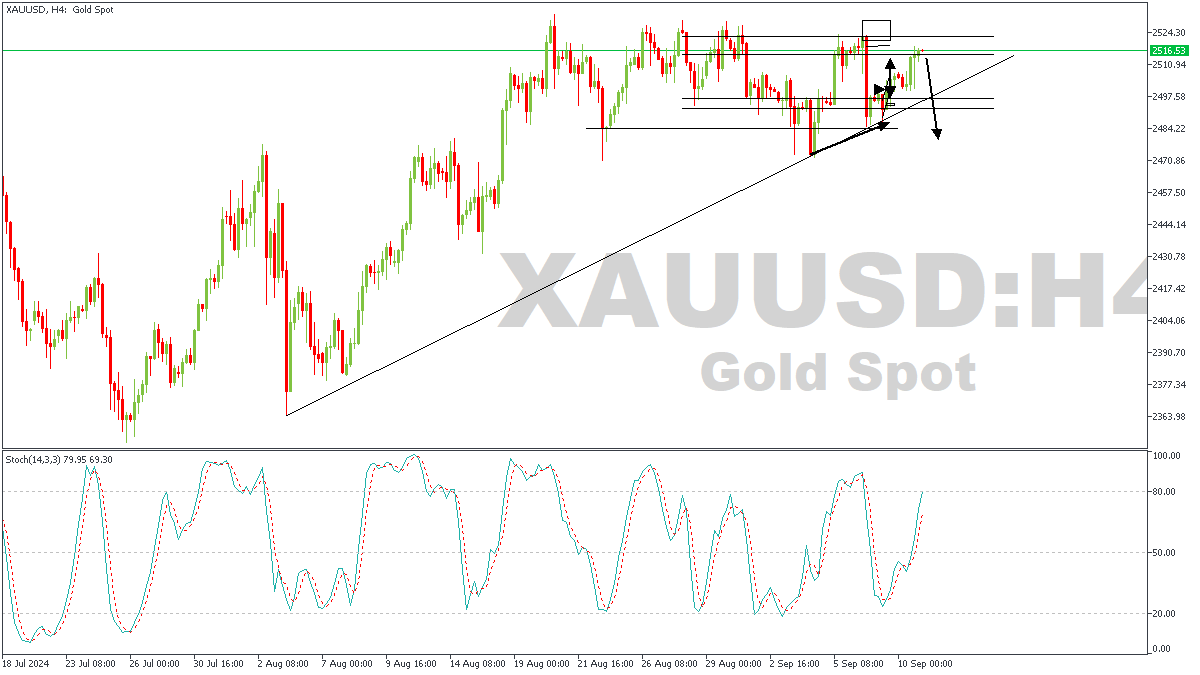
XAUUSD – H4 Timeframe
Gold did a bounce from the trendline support earlier, due to the confluence of the daily timeframe pivot and the hidden divergence on the stochastic indicator. However, the current price action is now resting within the region of another daily timeframe pivot, with the likelihood of a reversal soon. I expect this to provide an opportunity for bears to infiltrate the markets, albeit, my secondary choice of an entry would be from the break-and-retest of the trendline support.
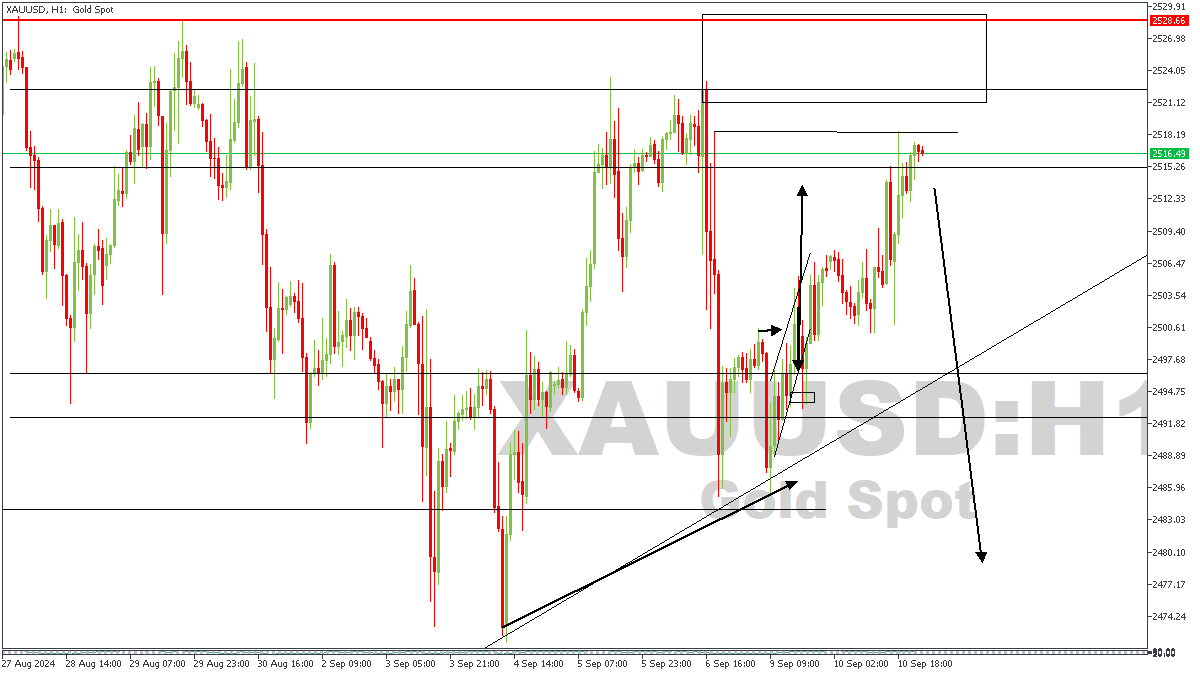
XAUUSD – H1 Timeframe
As for the price action on the 1-hour timeframe, price seems to be plotting a SBR pattern, which I hope to confirm after the rejection from the supply zone above inducement. Altogether, my sentiment remains bearish.
Analyst’s Expectations:
- Direction: Bearish
- Target: $2,495.75
- Invalidation: $2,530.15
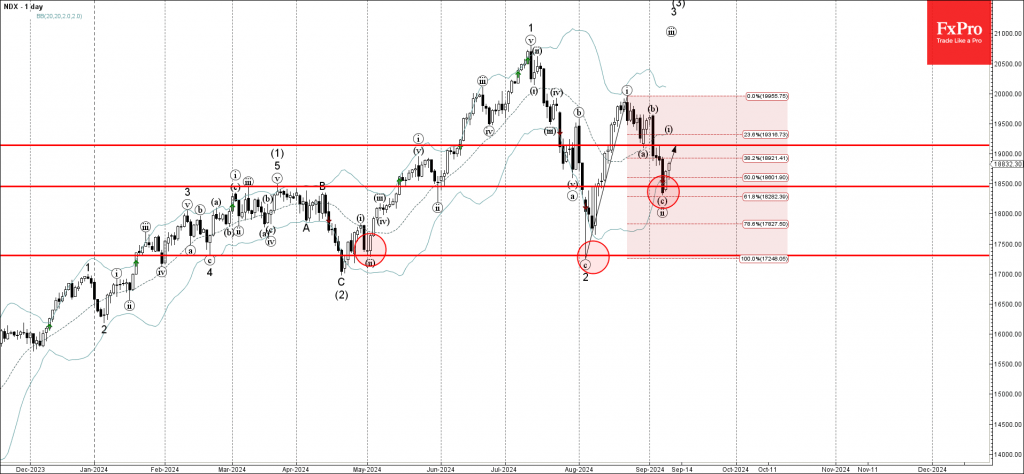
Nasdaq Wave Analysis
- Nasdaq reversed from support zone
- Likely to rise to resistance level 19135.00
Nasdaq index recently reversed up from the support zone located between the key support level 18500.00, lower daily Bollinger Band and the 61.8% Fibonacci correction of the upward impulse from August.
The upward reversal from this support zone created the daily Japanese candlesticks reversal pattern Piercing Line – which started the active impulse wave iii.
Given the overriding daily uptrend, Nasdaq index can be expected to rise further to the next resistance level 19135.00, former minor support from the end of August.
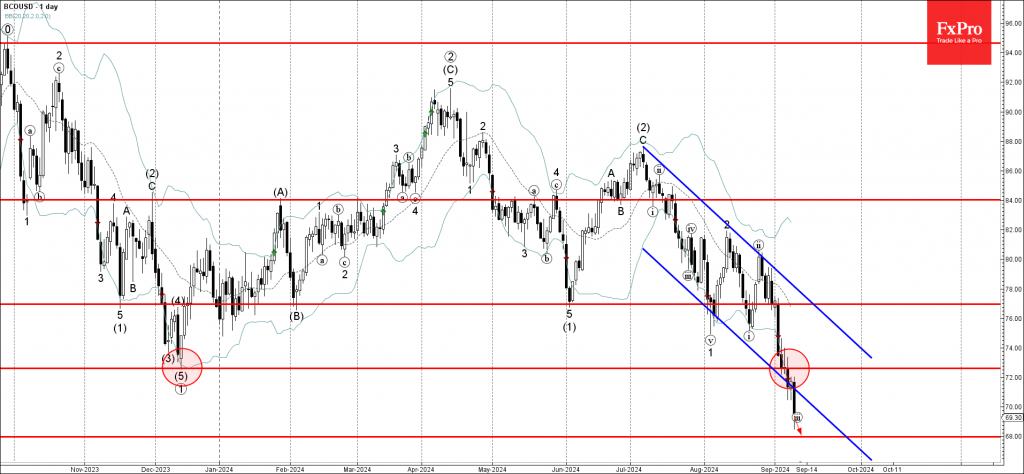
Brent Crude oil Wave Analysis
- Brent Crude oil broke key support level 72.60
- Likely to fall to support level 68.00
Brent Crude oil recently broke the support zone located between the key support level 72.60 (former multi-month support from December) and the support trendline of the daily down channel from July.
The breakout of the support level 72.60 accelerated the active impulse waves iii, 3 and (3).
Given the clear downtrend, Brent Crude oil can be expected to fall further to the next support level 68.00, target price for the completion of the active impulse wave iii.
Brent Remains Under Pressure: China and Rapid Growth in OPEC+ Production to Blame
The oil market remains under pressure. A barrel of Brent oil declined to 71.80 USD by Tuesday. The commodity erased all early-week gains as fears of slowing demand in China outweighed the risk of energy shortages due to the storm in the Persian Gulf.
In recent weeks, market participants have been paying close attention and analysing the whole range of news related to China. The sluggish economic growth rate combined with the global strategy of transition to low-carbon raw materials is reducing China’s need for oil. This negatively impacts Chinese oil imports and naturally affects market prices as China is considered the world’s largest raw material consumer.
Investors are also confident that oil consumption in Europe and the US will reduce following the active driving season. Additionally, some oil refineries are going into maintenance mode, meaning they will not need as many raw materials as before. OPEC+ had previously postponed the planned increase in oil output for a couple of months. Yes, the market now has a respite but the likelihood of an imminent commodity oversupply is still looming over prices.
Storm Francine is expected to intensify near Texas, US and could become a Category 2 storm, which means a hurricane threat. Some production facilities in Texas may be shut down until weather conditions improve.
Brent technical analysis
The BRENT H4 chart shows that the market has broken below the 74.96 level and completed a downward wave, reaching 70.50. A consolidation range could form at the current lows today. An upward breakout will open the potential for growth to 75.00 (testing from below). With a downward breakout, the range could expand to the local target of 69.69. This scenario is technically supported by the MACD indicator, with its signal line below the zero level at the lows and poised for growth.
The BRENT H1 chart shows that the market has reached the downward wave’s local target of 70.50. Today, the market is forming a consolidation range above this level. The range expanded up to 71.90 and down to 70.46. A breakout above the 71.90 level will open the potential for a corrective wave towards 75.00. With a breakout below 70.46, the range could expand downwards, with the wave continuing to 69.69. This scenario is technically supported by the Stochastic oscillator, whose signal line is below 20 and poised for growth.