Sample Category Title
Gold as an Investment: Detailed Analysis and Price Forecasts for 2025-2050
Since ancient times, gold has remained a crucial element of global economies. Its unique properties have made it not only valuable as jewellery but also a reliable means of preserving wealth. Today, this metal constitutes a significant part of both investor portfolios and central bank reserves. This review analyses the dynamics and reasons for changes in the price of gold and presents forecasts from leading banks and experts regarding the XAU/USD pair in the medium- and long-term perspectives.
Gold Price: From Ancient Times to the 20th Century
Ancient Times. Gold mining and usage began in the 4th millennium BC. One of the first civilizations to actively use this metal was ancient Egypt, where it was mined from around 2000 BC. The importance of gold in ancient Egypt is hard to overestimate – it was considered "the flesh of the gods" and used in all aspects of life, from religious ceremonies to burial rites, in making vessels and statuettes, jewellery, and home decor, as well as a means of payment. Gold's resistance to corrosion made it a symbol of immortality and strength.
Exact data on the value of gold in ancient civilizations is hard to find, but it is known to have been one of the most valuable commodities, used not only for trade but also for wealth storage. For example, in Babylon in 1600 BC, one talent of gold (about 30.3 kg) was worth approximately 10 talents of silver (about 303 kg).
In the late 8th century BC, in Asia Minor, gold was first used as coinage. The first pure gold coins with stamped images are attributed to the Lydian King Croesus. They were of irregular shape and often minted only on one side.
Antiquity. In antiquity, gold continued to play a key role in the economy and culture. The Greeks mined gold in various places, including the region of Troy, where, according to myth, the deposit was a gift from the god Zeus. For the ancient Greeks, gold symbolized purity and nobility and was used to create unique artworks and jewellery.
In classical Athens (5th century BC), one gold drachma was worth about 12 silver drachmas. During the time of Alexander the Great (4th century BC) and the subsequent Hellenistic kingdoms, the gold-to-silver ratio varied but generally stayed within the range of 1:10 to 1:12. (Interestingly, this ratio has now grown to about 1:80). Alexander the Great issued gold staters weighing about 8.6 grams, highly valued coins often used for large international transactions.
Middle Ages. In the Middle Ages, gold remained a vital element of the economy. In the Byzantine Empire, the solidus gold coin, weighing 4.5 grams, was used for international trade. In medieval Europe, gold also played a significant role, especially after the discovery of large gold deposits in Africa. In 1252, the gold florin was introduced in Florence and used throughout Europe. In England, the gold sovereign appeared in 1489.
What could one buy with such a coin? In England in the 11th-12th centuries, a sovereign could purchase a small piece of land about one acre or a part of a farm. In the 13th century, a gold coin could buy several heads of cattle, such as two cows or several sheep.
Gold was also used to acquire weapons or armour. For example, a good quality sword might cost about one coin. One gold coin could also pay for a skilled craftsman's work for several months. For instance, such money could order the construction or repair of a house. Additionally, it could buy a large amount of food, such as a year's supply of bread for a family.
Modern Times. During the Age of Exploration, gold came to the forefront again. After the discovery of America, Spanish conquistadors brought vast quantities of gold to Europe. In the 17th-18th centuries, gold became the basis for the formation of monetary systems in Europe. By 1800, the price of one troy ounce of gold (31.1 grams) in Britain was about £4.25. Therefore, one troy ounce of this metal could buy a small plot of land in some rural areas or pay rent for housing for 8 months. It could also order the tailoring of four men's suits or pay for elementary school education for several years.
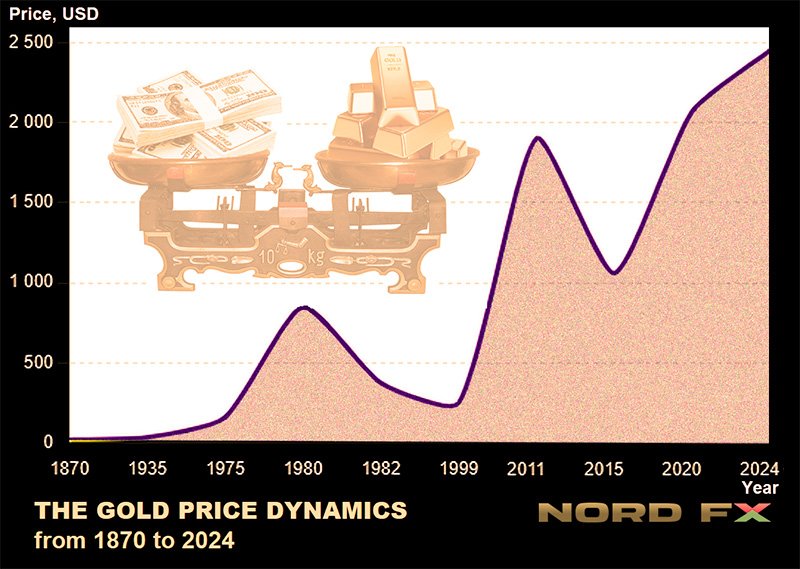
19th Century. The 19th century was marked by the Gold Rush, especially in California and Australia. This led to a significant increase in gold production and, consequently, a relative decrease in its price. In 1870, the price of one troy ounce of gold was about $20. Starting in 1879, the US monetary system was based on the so-called "gold standard," which tied the amount of paper money to the country's gold reserves, and $20 could always be exchanged for a troy ounce of this precious metal. This price level remained until the early 20th century.
20th Century: $20 – $850 – $250
1934. It had been 55 years since the adoption of the "gold standard" when, during the Great Depression, US President Franklin D. Roosevelt enacted the "Gold Reserve Act." According to this document, private ownership of gold was declared illegal, and all precious metals had to be sold to the US Treasury. A year later, after all the gold had been transferred from private ownership to the state, Roosevelt raised its price by 70% to $35 per troy ounce, allowing him to print the corresponding amount of paper money.
For the next four decades, gold prices remained stable at around $35 until 1971, when another US President, Richard Nixon, decided to abandon the "gold standard" altogether, delinking the dollar from gold. This decision can be considered a turning point in the history of the modern world economy. Gold ceased to be money and began to be traded on the open market at a floating exchange rate. This completely freed the US government's hands, allowing it to print infinite amounts of fiat currency, and the price of precious metals to grow exponentially.
By the end of 1973, the price of precious metals had already reached $97 per ounce and continued to rise amid economic instability and inflation, reaching $161 in 1975 and $307 in 1979. Just a year later, amid high inflation and political instability (including the Soviet invasion of Afghanistan and the Iranian revolution), XAU/USD reached a record level of $850 .
1982. After reaching this peak, there was a rollback to $376 in 1982, linked to rising interest rates in the US and stabilizing economic conditions. Political and economic changes in the world, such as the end of the Cold War and the development of global financial markets, stabilized the gold market, and until the mid-1990s, XAU/USD traded in the range of $350-$400. By 1999, the price had fallen to $252 per ounce, due to rising stock markets, low inflation, and decreased demand for gold as a safe-haven asset.
First Quarter of the 21st Century: From $280 to $2450
2000s. At the beginning of the 2000s, the price of gold was about $280 per troy ounce. However, it began to rise following the dot-com bubble burst and sharply increased during the global financial crisis, reaching $869 in 2008. This growth was driven by economic instability, falling stock markets, declining confidence in the dollar, and increased demand for gold from investors seeking safe-haven assets. By the end of 2010, the gold price continued to rise, reaching $1421. In September 2011, it reached a record level of $1900 per ounce. This rise was due to the European debt crisis and concerns about global economic instability. However, the dollar began to strengthen, inflation expectations fell, and stock markets rose, leading XAU/USD to turn south, falling to $1060 by the end of 2015.
After this, another reversal occurred, and the pair headed north again. In 2020, the price reached a new record level of $2067. The primary driver here was the COVID-19 pandemic, which prompted massive monetary stimulus measures (QE) by governments and central banks, primarily the US Federal Reserve. The historical maximum to date was reached in May 2024 at $2450, aided by geopolitical instability in the Middle East, Russia's military invasion of Ukraine, and expectations of interest rate cuts by the Federal Reserve, ECB, and other leading central banks.
Why Gold?
Mid-2024. Before moving on to gold price forecasts, let's answer the question: what exactly makes this yellow metal valuable?
Firstly, note its physical and chemical properties. Gold is chemically inert, resistant to corrosion, and does not rust or tarnish over time, making it an ideal asset for value storage. It has an attractive appearance and lustre that does not fade over time, making it popular for making jewellery and luxury items. It is also relatively rare in the Earth's crust. Limited availability makes it valuable since demand always exceeds supply.
Next, follow the economic factors, which are perhaps more important in the modern world. Gold is traditionally used as a means of preserving capital. We have already mentioned that in times of economic instability and geopolitical tension, investors often turn to gold to protect their savings from depreciation. Naturally, in such a situation, its price is influenced by the level of inflation and related monetary policies of central banks, including interest rate changes and quantitative easing (QE) or tightening (QT) programmes.
Investors use gold to diversify their portfolios and reduce risks. Gold has high liquidity, allowing it to be quickly and easily converted into cash or goods and services worldwide. This makes it attractive not only for investors but also for central banks, which hold significant gold reserves as part of their international reserves. This helps them maintain national currency stability and serves as a guarantee in case of financial crises. For example, the Federal Reserve holds nearly 70% of its foreign reserves in gold.
Forecasts for the Second Half of 2024 and 2025
Gold price forecasts for the end of 2024 and 2025 vary, but most analysts from leading global banks and agencies agree that its price will rise. UBS strategists predict an increase to $2500 per ounce. J.P. Morgan also targets $2500 in the medium term, provided the Federal Reserve cuts rates and economic instability persists.
Goldman Sachs has revised its forecasts and expects the price to reach $2700 per ounce in 2025. Bank of America economists initially forecasted $2400 for 2024 but also revised their forecast upwards to $3000 by 2025. The primary condition for growth, according to the bank, is the start of active rate cuts by the US Federal Reserve, which will attract investors to gold as a safe-haven asset.
Citi specialists agree with this figure. "The most likely scenario in which an ounce of gold rises to $3000," they write in an analytical note, "besides the Federal Reserve rate cut, is the rapid acceleration of the current but slow trend – the de-dollarization of central banks in developing economies, which will undermine confidence in the US dollar."
Rosenberg Research analysts also mention a figure of $3000. The consulting agency Yardeni Research does not rule out that due to a possible new wave of inflation, XAU/USD could rise to $3500 by the end of next year. The super-bullish forecast was given by TheDailyGold Premium magazine editor Jordan Roy-Byrne. Based on the "Cup and Handle" model, he stated that a breakout is coming, and with it a new cyclical bull market. "The current measured target for gold," writes Roy-Byrne, "is $3000, and its logarithmic target is somewhere between $3745 and $4080."
Forecasts to 2050
Most major banks and financial data providers typically offer only short- and medium-term forecasts. The main reason is that markets can be very volatile, and small changes in supply or demand factors and external events can lead to unexpected price fluctuations, casting doubt on prediction accuracy.
Despite this, there are different scenarios and long-term price forecasts for gold for 2030-50. Economist Charlie Morris, in his work "Rational Case for Gold by 2030," forecasts a price of $7000 per ounce. Another specialist, David Harper, predicted that the price of gold could reach $6800 by 2040. This scenario, according to Harper, describes reasonable growth with a return rate of about 7.2% per year.
Regarding a 25-year horizon, Josep Peñuelas, a research professor at the Centre for Ecological Research in Barcelona, warned that by 2050, the world might run out of key metals, including gold. However, other futurist theories are more optimistic. According to renowned investor and writer Robert Kiyosaki, gold has existed since time immemorial and, being "God's money," is likely to become the primary form of currency in the future. In his book "Fake," Kiyosaki argues that ultimately, gold, along with bitcoins, could destroy paper currencies and become the foundation of the global financial system.
Dollar Plummets as Markets Brace for Double or Even Triple Fed Rate Cuts This Year
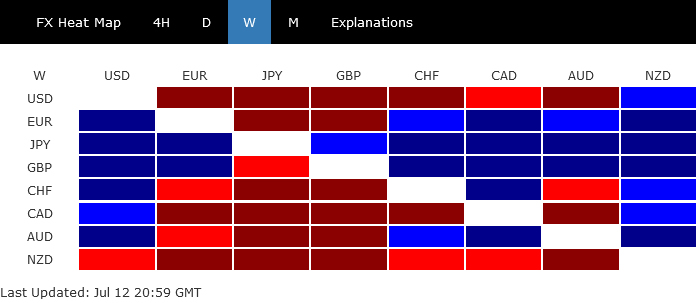
Dollar weakened broadly last weeks market expectations on Fed's policy path shifted dramatically. The June US CPI report continued the narrative painted by the previous week's Non-Farm Payroll data, both suggesting further cooling in economic activity and easing price pressures. These developments have firmly positioned a September Federal Reserve rate cut as a near certainty in the minds of traders, with additional expectations for another reduction in December. Some aggressive market participants are even betting on an additional reduction in November. This shift in sentiment also boosted US stocks to new record highs and hammered treasury yields.
However, despite its significant movement, Dollar was only the second worst performer, with the New Zealand Dollar taking the bottom spot. Kiwi plunged following the surprisingly dovish statement from RBNZ, which accompanied their decision to hold interest rates unchanged. The hint of future monetary easing has markets betting on a rate cut by RBNZ as early as November. Meanwhile, Canadian Dollar was the third worst performer.
Conversely, Japanese Yen emerged as the week's star performer, buoyed by what appeared to be a strategically timed market intervention by Japan. The next move for Yen will depend on whether market participants join in to further boost its value, a development that might hinge on BoJ's meeting later this month.
Meanwhile, British Pound secured its position as the second strongest performer, rallying after expectations for an August rate cut by BoE were dashed by comments from a top BoE official and stronger-than-expected UK economic data. Euro ranked third in performance, while Aussie and Swiss Franc ended mixed in the middle.
Odds of Three Fed Rate Cuts in 2024 Now a Toss-Up
US stock markets were on a high, with even laggard DOW reaching a new intraday record, following earlier surges by S&P 500 and NASDAQ. The upbeat sentiment among investors was largely driven by optimism that Fed is on track for rate cut, and this expectation was further solidified by US June CPI data.
The CPI report showed further slowdown in both headline and core inflation rates, suggesting that the "last mile" of disinflationary process in the US might be less daunting than previously feared. This positive development should bolster Fed policymakers' confidence to consider lowering interest rates sooner.
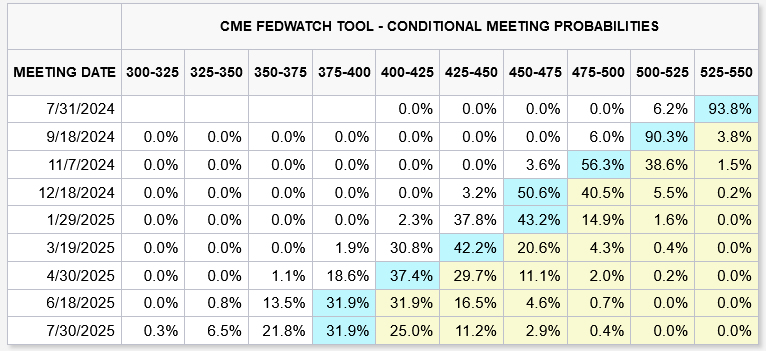
In light of these developments, fed fund futures now indicate 94% chance of a 25bps rate cut in September, bringing federal funds rate down to 5.00-5.25%. By year-end, there's also 94% chance of two total rate cuts, lowering the rate to 4.75-5.00%.
More importantly, there's around 60% chance of seeing two rate cuts by November meeting, reducing the rate to 4.75-5.00%. Furthermore, there's 54% probability of three cuts by year-end, bringing the rate down to 4.50-4.75%.
This suggests that some market participants are aggressively betting on back-to-back rate cuts in September, November, and December. This speculation has dialed back the clock to March, with close probabilities between two and three rate cuts this year.
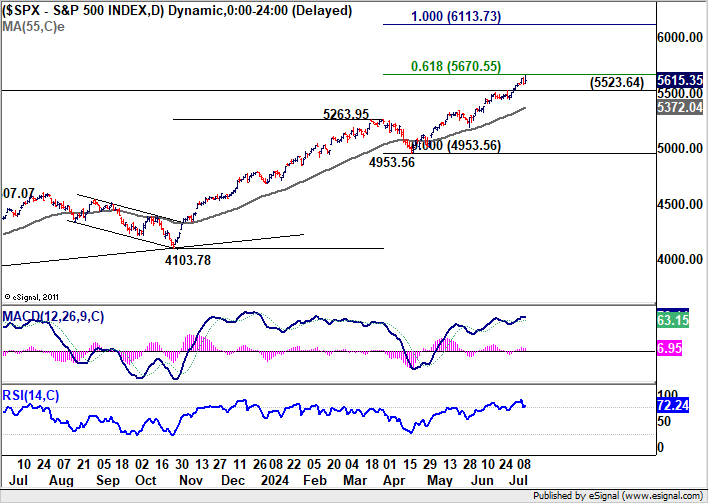
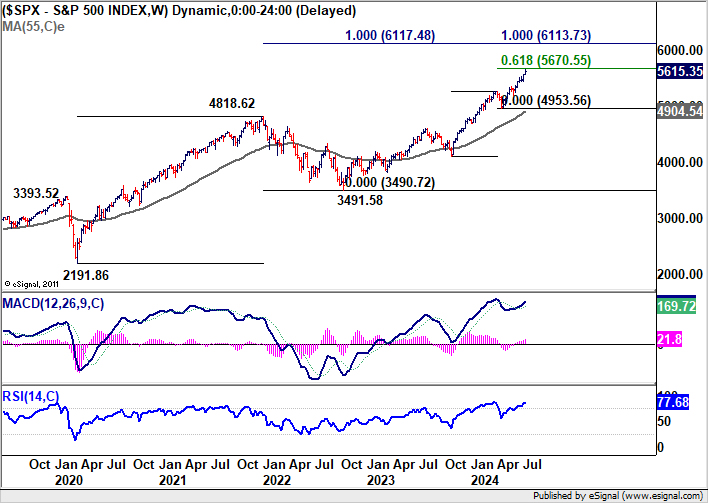
Technically, S&P 500 surged to new record high at 5655.56. But it appears to be struggling slightly facing 61.8% projection of 4103.78 to 5263.95 from 4953.56 at 5670.55.
For now, further rally is expected as long 5523.64 resistance turned support holds. Firm break of 5670.66 will pave the way to 100% projection at 6113.73. This is where the real test lies with 100% projection of 2191.86 to 4818.62 from 3491.58 nearby.
Meanwhile, firm break of 5523.64 will bring consolidations first, before the up trend resumes.
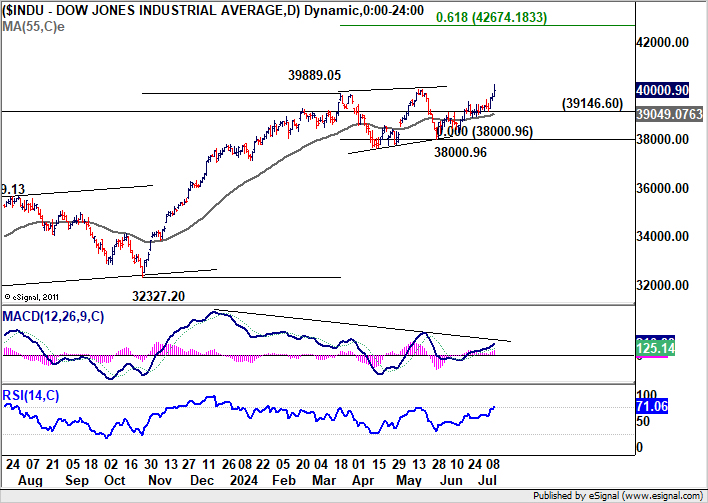
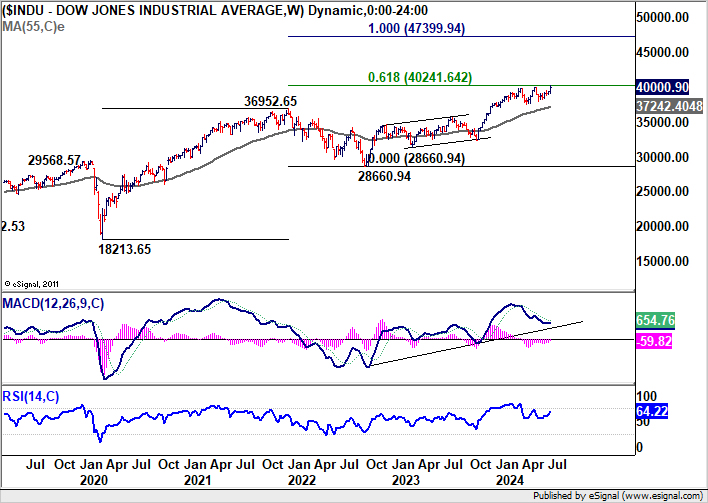
DOW's last breakout suggests that long term up trend is resuming. Further rise is expected as long as 39146.60 support holds. Sustained trading above 40000 handle will pave the way to 61.8% projection of 3237.20 to 39889.05 from 38000.96 at 42674.18.
Also, it should be emphasized that 40k handle is critical as it's also close to 61.8% projection of 18213.65 to 36952.65 from 28660.94 at 40241.64. Decisive break there could prompt medium term upside acceleration towards 100% projection at 47399.94.
Nevertheless, break of 39146.60 support will delay the bullish case.
Yields Fall and Dollar Weakens Amid Changing Fed Expectations
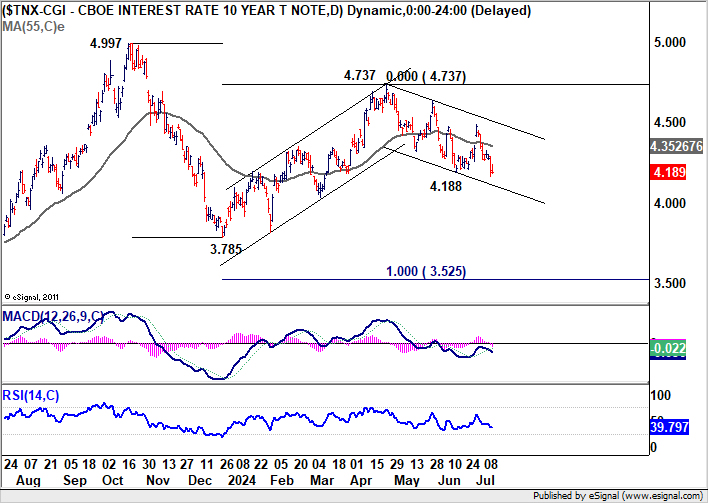
US 10-year yield fell notably last week along with the development in Fed expectations. Technically, outlook is unchanged that fall from 4.737 is the third leg of the pattern from 4.997 and it's still in progress. Further decline is expected as long as 55 D EMA (now at 4.352) holds.
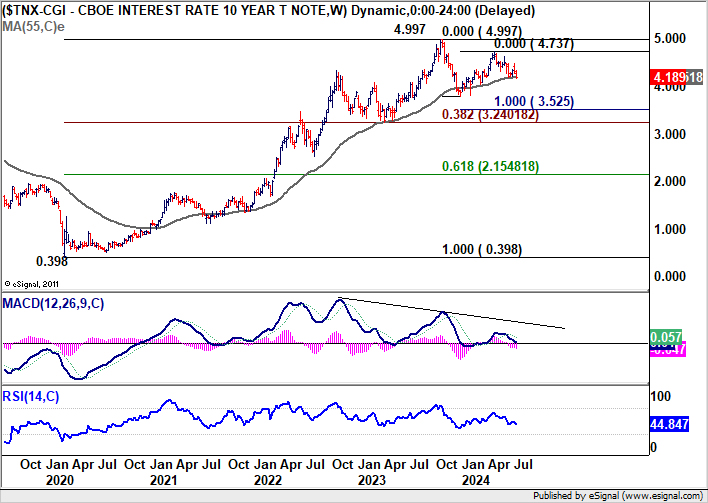
Sustained break of 55 W EMA 55 W EMA (now at 4.189) could prompt downside acceleration in TNX, and extend the fall from 4.737 to 3.785, or even further to 100% projection of 4.997 to 3.785 from 4.737 in the medium term.
However, there is a notable counterargument to this bearish outlook, linked to steepening yield curve. This steepening is reflective of market concerns that re-election of Donald Trump could lead to policies that might increase the risk premium on longer-maturity Treasuries. In this case, TNX's decline could be floored to a certain extent.
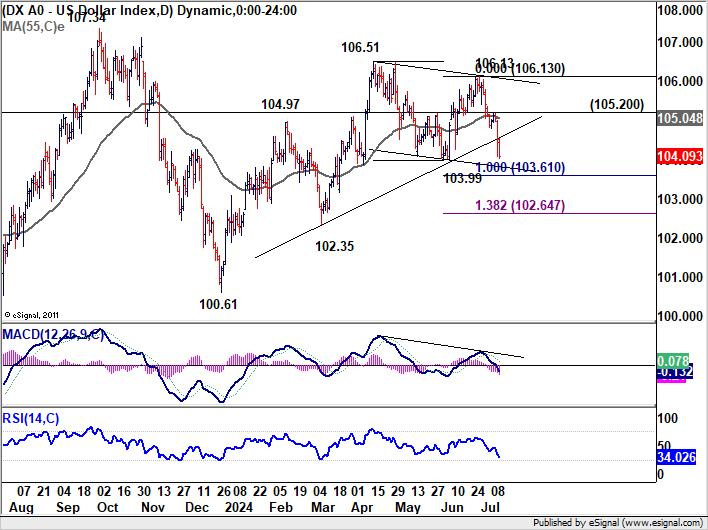
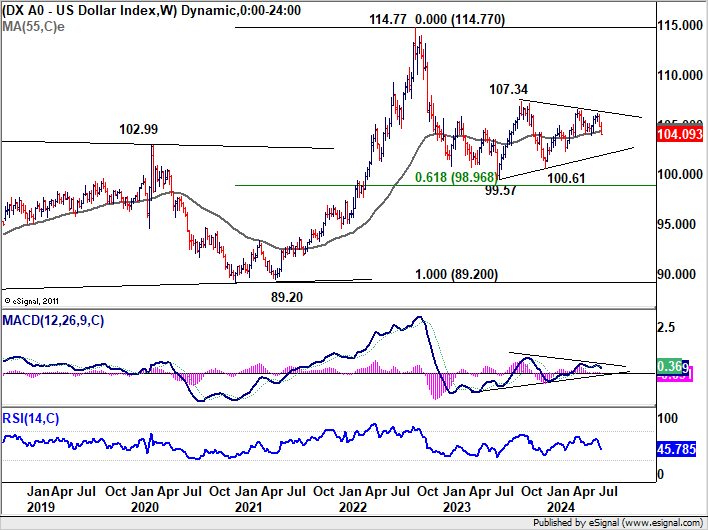
The bearish case in Dollar index is starting to build up with a close below 55 W EMA (now at 103.40). Deeper decline is expected as long as 105.20 support holds, to 100% projection of 106.51 to 103.99 from 106.13 at 103.61. Break there will target 138.2% projection at 102.64 next.
More importantly, sustained trading below 55 W EMA will strengthen the case that whole rise from 100.61 has already finished at 106.51. That would open up deeper fall through 102.35 to retest 100.61 support next.
Yen Jumps on Suspected Intervention; Market Awaits BoJ's Next Steps
Yen also dominated financial headlines, with its largest daily rally since late 2022, allegedly driven by unconfirmed market intervention from Japan. The timing of this intervention was notably strategic, occurring just after US CPI release, which had already exerted significant downward pressure on the greenback. Reports from BoJ accounts suggest that approximately JPY 3.5T may have been deployed in these efforts to buoy Yen.
Despite this surge, the yen's rebound was limited as market participants seemed hesitant to join to drive the currency higher. The focus now shifts to BoJ's meeting at the end of July. The financial community are divided over BoJ's next move: Some economists argue that market interventions increase the likelihood of a rate hike, viewing it as a necessary follow-up to governmental actions. Others believe that the easing pressure on Yen makes a rate hike less probable.
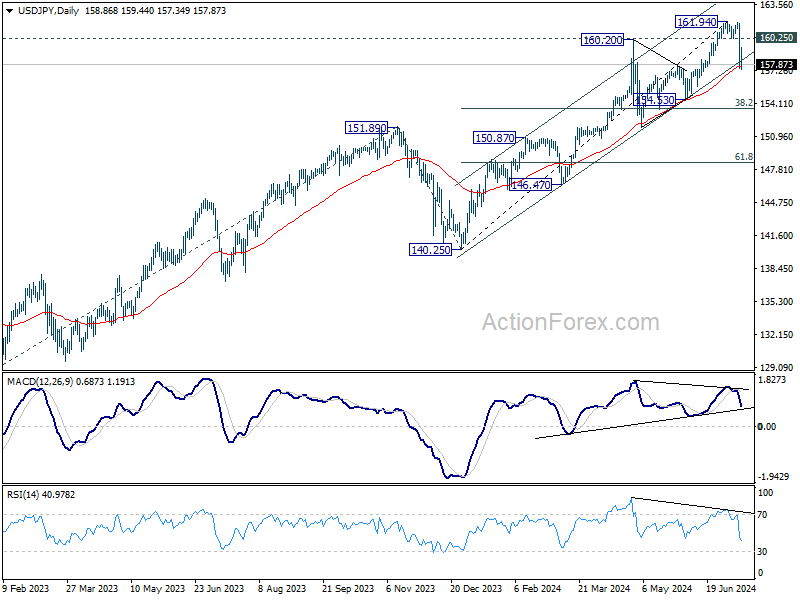
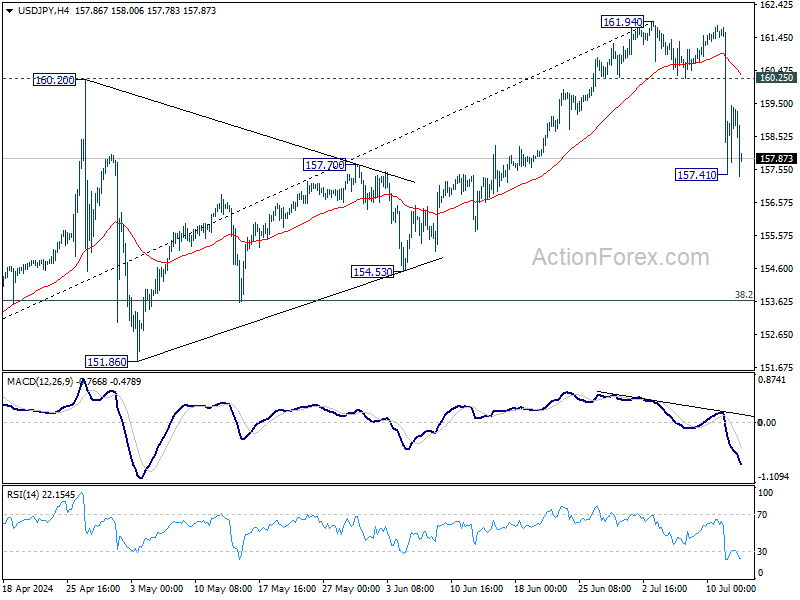
Technically, further decline is expected in USD/JPY as long as 160.25 support turned resistance holds. Considering bearish divergence condition in D MACD, fall from 161.94 might be correcting the whole five-wave rally from 140.25 already.
Sustained trading below 55 D EMA (now at 157.34) will strengthen this bearish case and send USD/JPY further lower to 38.2% retracement of 140.25 to 161.94 at 163.65. But strong support should emerge there to bring rebound, as set the range for medium term consolidations.
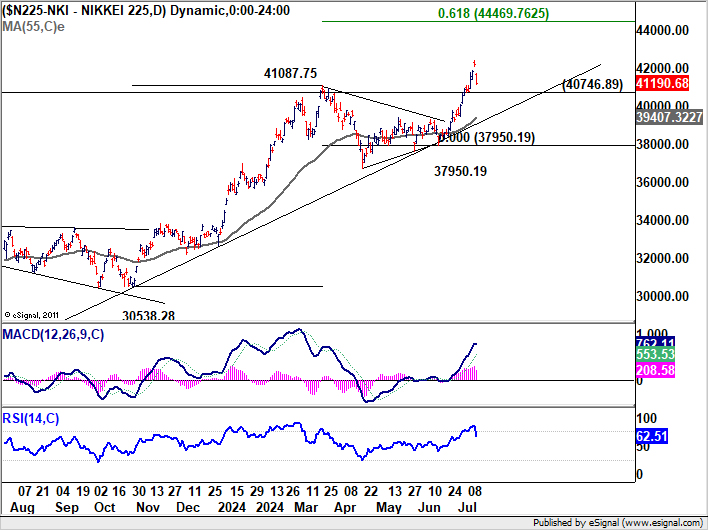
Nikkei, on the other hand, suffered with Yen's strong rebound. The Japanese index had it biggest daily drop of the year just after hitting new record above 42k. As long as 40746.89 support holds, there is still prospect of extending the record rally to 61.8% projection of 35038.28 to 41087.75 from 37950.19 at 44469.76. However, firm break of 40746.89 will bring deeper pull back to 55 D EMA (now at 39407.32). The depth of Nikkei's correct in this bearish case, would depend on that of USD/JPY too.
Sterling Stands Strong on Diminished Hopes for Aug BoE Rate Cut
Sterling stood out as one of the best performers again last week. There was a prevailing sentiment among investors that BoE might cut rates in August, especially after the general election. However, these hopes were tempered following remarks from BoE's Chief Economist, Huw Pill. Pill hinted a preference for maintaining interest rate at 5.25%, citing persistent wage growth and inflation within the services sector as key concerns. His cautious stance was further reinforced by stronger than expected UK GDP data for May. Consequently, the likelihood of an August BoE rate cut, previously priced into the market at around 60%, has tumbled to approximately 50%.
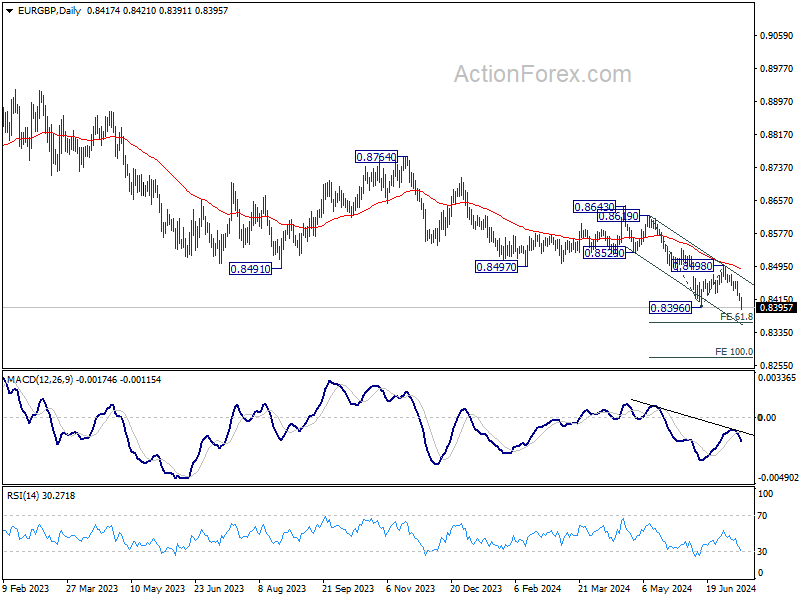
EUR/GBP's breach of 0.8396 support suggests that medium term down trend is ready to resume. Further decline would be seen to 61.8% projection of 0.8619 to 0.8396 from 0.8498 at 0.8360. Firm break there could prompt downside acceleration to 100% projection at 0.8275.
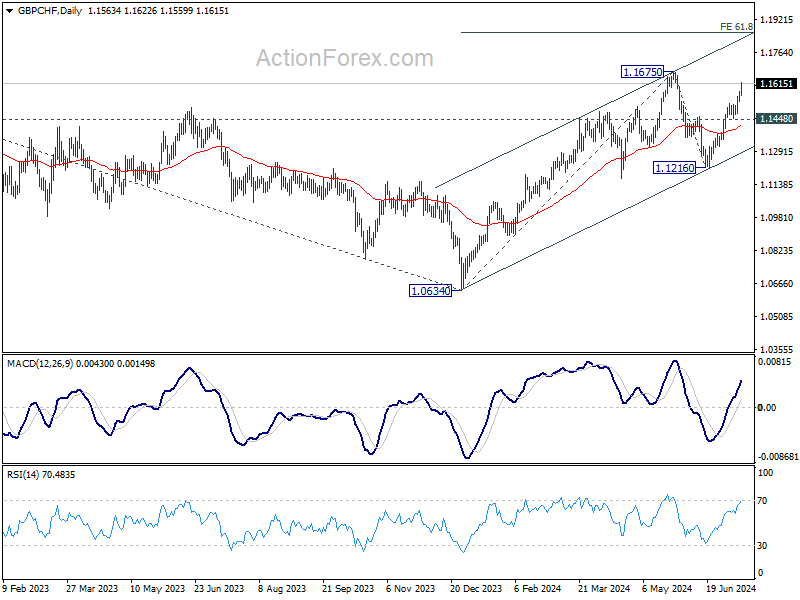
GBP/CHF's strong rebound from 1.1216 continued last week towards 1.1675 resistance. Firm break there would confirm resumption of whole rise from 1.0634. Next near term target is 61.8% projection of 1.0634 to 1.1675 from 1.1216 at 1.1859.
EUR/USD Weekly Outlook
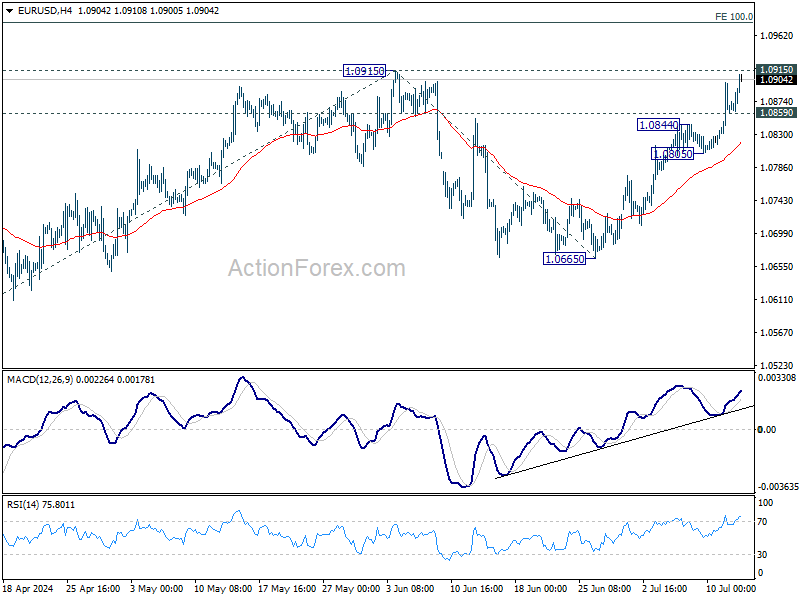
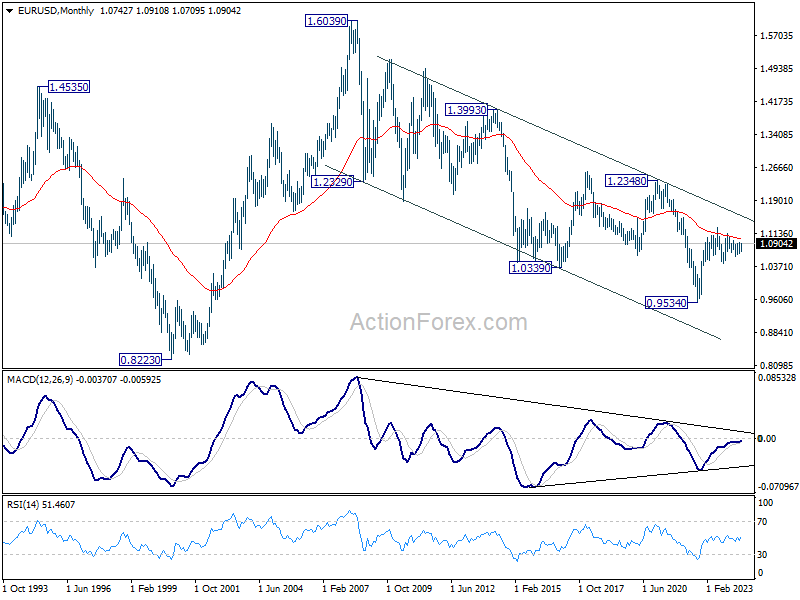
EUR/USD's rally continued last week and hit as high as 1.0910. Initial bias stays on the upside this week. Firm break of 1.0915 will resume howl rise from 1.0601 to 100% projection of 1.0601 to 1.0915 from 1.0665 at 1.0979. On the downside, below 1.0859 minor support will turn intraday bias neutral first.
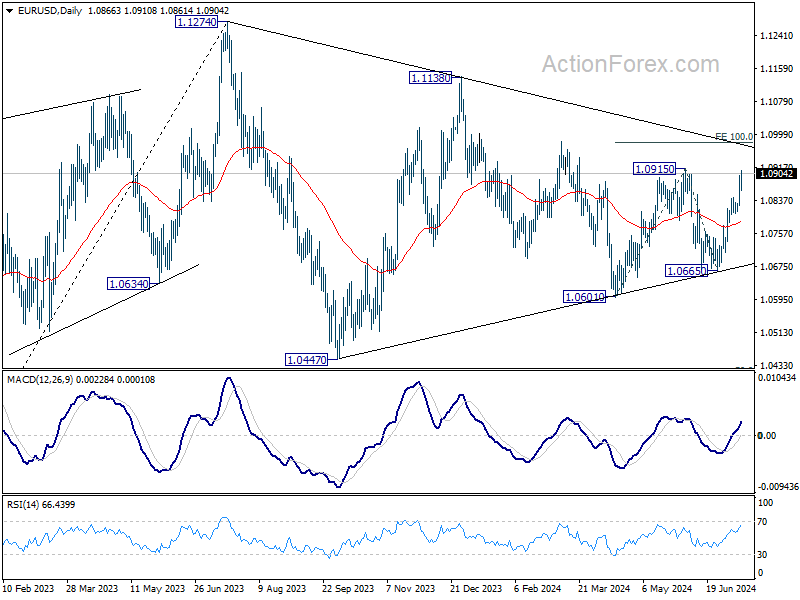
In the bigger picture, price actions from 1.1274 are viewed as a corrective pattern, possibly a triangle, that's still be in progress. Break of 1.1138 resistance will be the first signal that rise from 0.9534 (2022 low) is ready to resume through 1.1274 (2023 high). This will now remain the favored case as long as 1.0601 support holds.
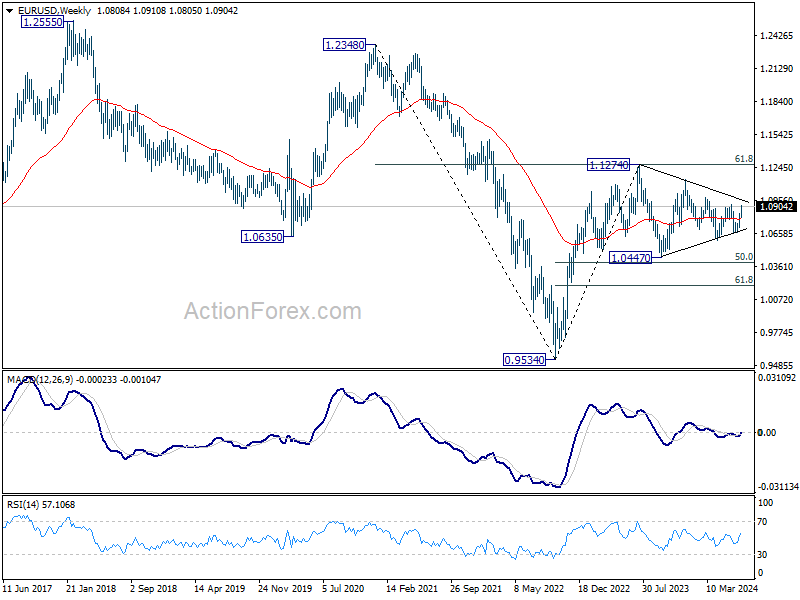
In the long term picture, a long term bottom is in place at 0.9534 (2022 low). Sustained break of 55 M EMA (now at 1.1046) will raise the chance of long term reversal. But even in this case, firm break of 1.2348 structural resistance is needed to confirm. Rejection by 55 M EMA will maintain bearishness for extend the down trend from 1.6039 (2008 high) through 0.9534 at a later stage.
EUR/USD Weekly Outlook
EUR/USD's rally continued last week and hit as high as 1.0910. Initial bias stays on the upside this week. Firm break of 1.0915 will resume howl rise from 1.0601 to 100% projection of 1.0601 to 1.0915 from 1.0665 at 1.0979. On the downside, below 1.0859 minor support will turn intraday bias neutral first.
In the bigger picture, price actions from 1.1274 are viewed as a corrective pattern, possibly a triangle, that's still be in progress. Break of 1.1138 resistance will be the first signal that rise from 0.9534 (2022 low) is ready to resume through 1.1274 (2023 high). This will now remain the favored case as long as 1.0601 support holds.
In the long term picture, a long term bottom is in place at 0.9534 (2022 low). Sustained break of 55 M EMA (now at 1.1046) will raise the chance of long term reversal. But even in this case, firm break of 1.2348 structural resistance is needed to confirm. Rejection by 55 M EMA will maintain bearishness for extend the down trend from 1.6039 (2008 high) through 0.9534 at a later stage.
USD/JPY Weekly Outlook
USD/JPY's sharp decline last week confirmed short term topping at 161.94. Considering bearish divergence condition in D MACD, fall from 161.94 is likely corrective whole five-wave rally from 140.25. Risk will stay on the downside as long as 160.25 support turned resistance holds. Sustained break of 55 D EMA (now at 157.67) will affirm this bearish case. Next target will be 38.2% retracement of 140.25 to 161.94 at 163.65.
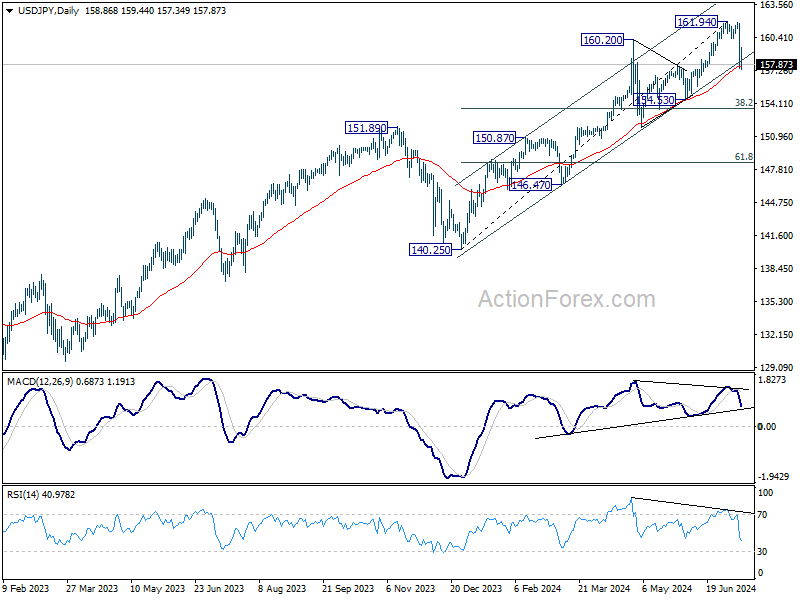
In the bigger picture, as long as 151.89 resistance turned support holds, long term up trend could still continue through 161.94 at a later stage. Next target will depend on the depth of the current correction from 161.94. However, sustained break of 151.89 will argue that larger scale correction or trend reversal is underway.
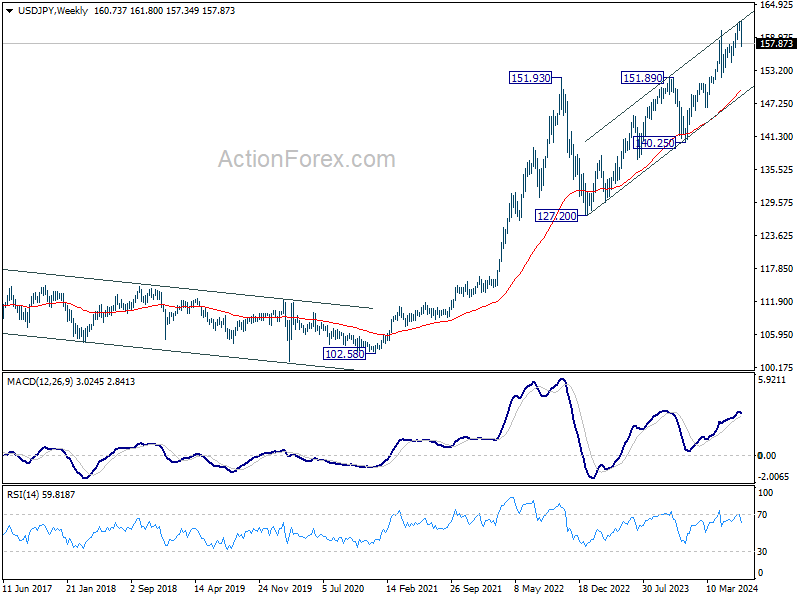
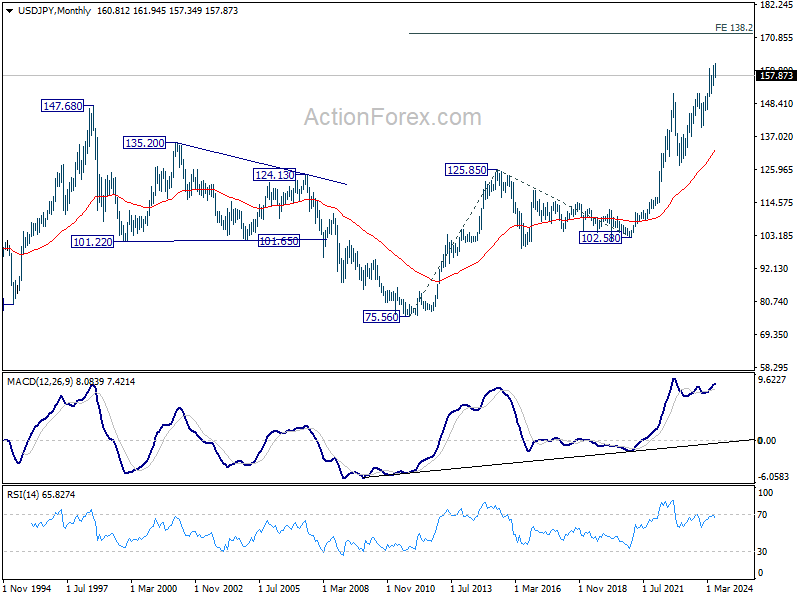
In the long term picture, as long as 140.25 support holds, up trend from 75.56 (2011 low) is still in progress. Next target is 138.2% projection of 75.56 (2011 low) to 125.85 (2015 high) from 102.58 at 172.08.
GBP/USD Weekly Outlook
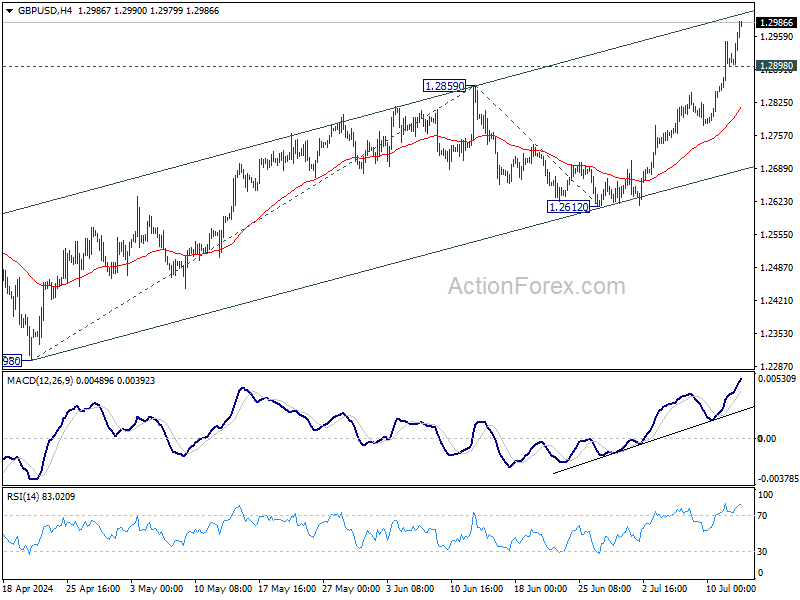
GBP/USD's strong break of 1.2859 resistance last week confirmed resumption of rally from 1.2298. Initial bias stays on the upside this week. Next target is 100% projection of 1.2298 to 1.2859 from 1.2612 at 1.3173, which is slightly above 1.3141 key medium term resistance. On the downside, below 1.2898 minor support will turn bias neutral and bring consolidations first, before staging another rally.
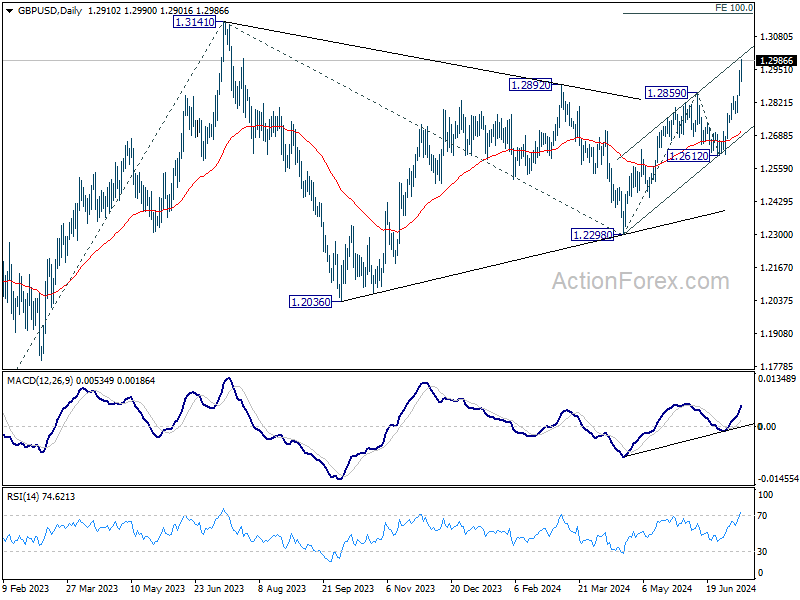
In the bigger picture, corrective pattern from 1.3141 medium term top (2023 high) could have completed with three waves to 1.2298 already. This will now remain the favored case as long as 1.2612 support holds. Firm break of 1.3141 will target 61.8% projection of 1.0351 (2022 low) to 1.3141 from 1.2298 at 1.4022.
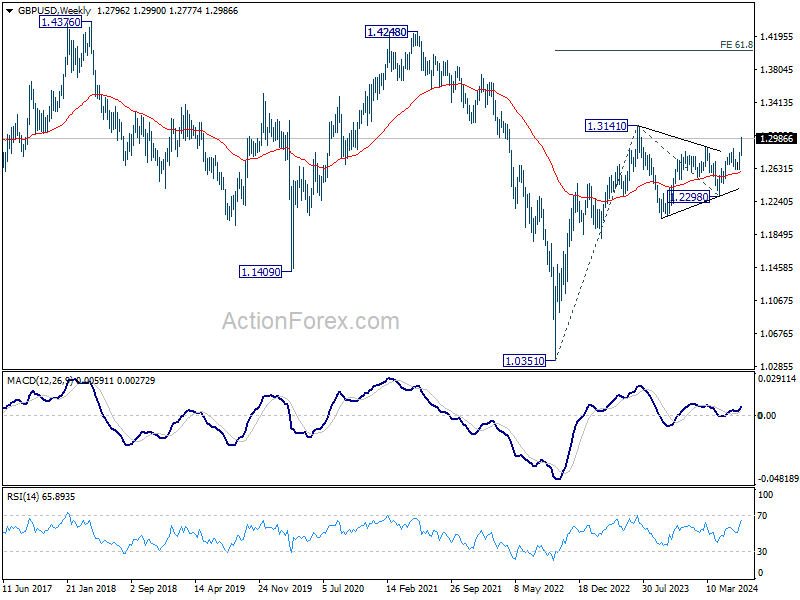
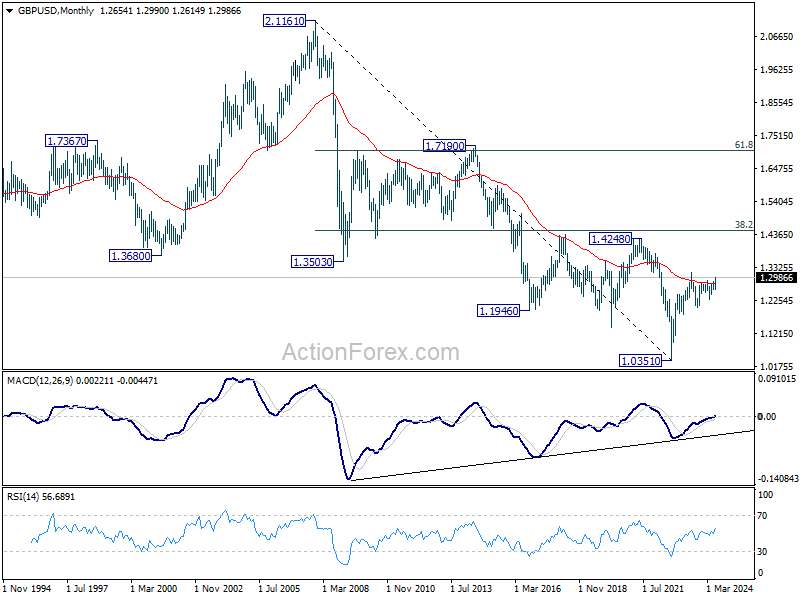
In the long term picture, as long as 1.2298 support holds, rise from 1.0351 long term bottom is expected to continue. But still, firm break of 1.4248 structural resistance is needed to indicate bullish trend reversal. Otherwise, price actions from 1.0351 are tentatively seen as a consolidation pattern only.
USD/CHF Weekly Outlook
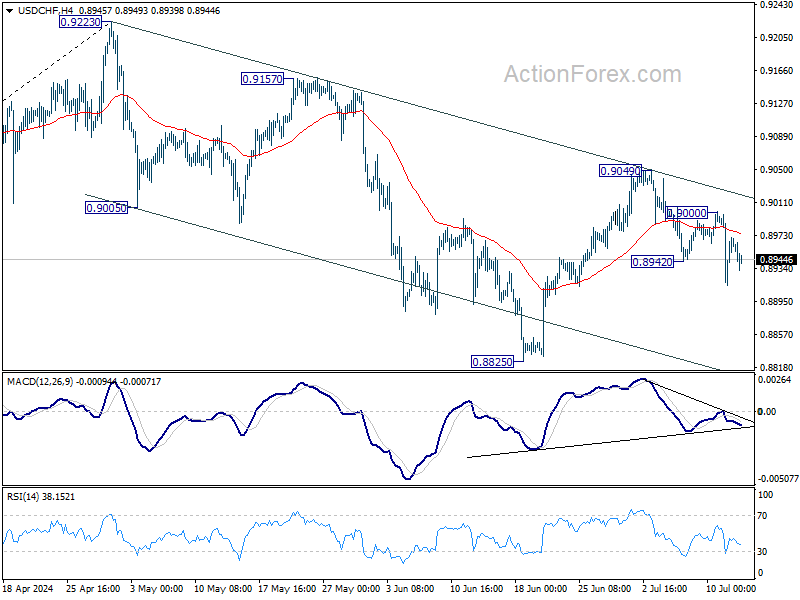
USD/CHF's fall from 0.9049 continued last week despite interim recovery. As noted before, rebound from 8825 should have completed after rejection by channel resistance. Deeper decline is expected as long as 0.9000 resistance holds, to 0.8825 low. Break of 0.8825 will target 50% retracement of 0.8332 to 0.9223 at 0.8778 next. However, break of 0.9000 will turn bias back to the upside for 0.9049 resistance instead.
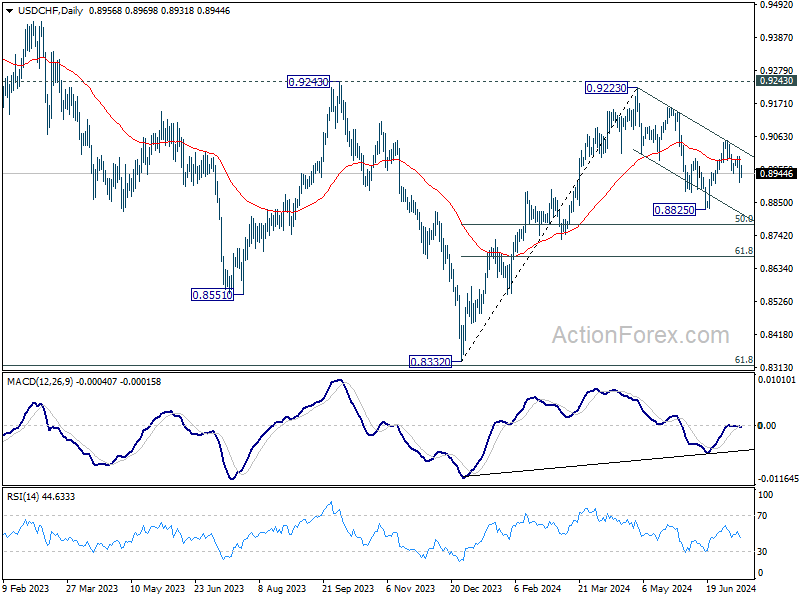
In the bigger picture, with 0.9243 resistance intact, medium term outlook in USD/CHF is neutral at best. For now, more sideway trading is likely between 0.8332/9243. However, firm break of 0.9243 will indicate larger bullish trend reversal.
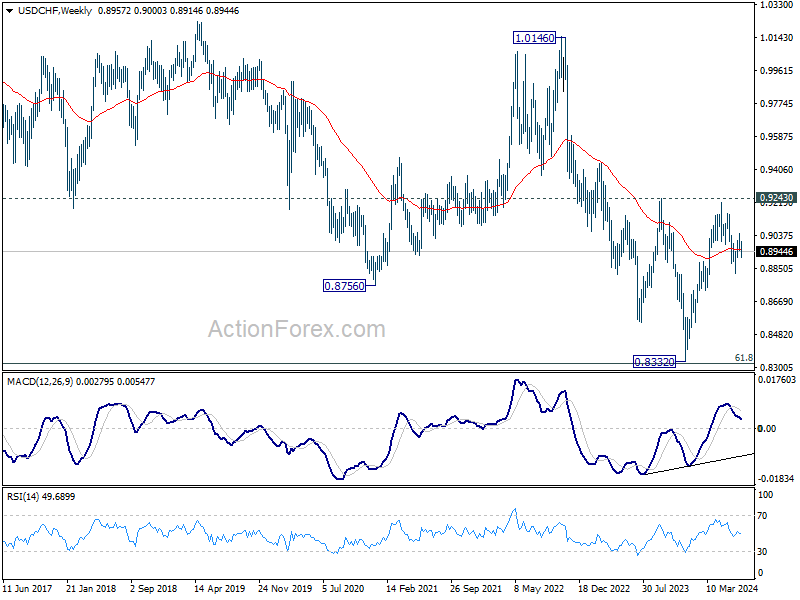
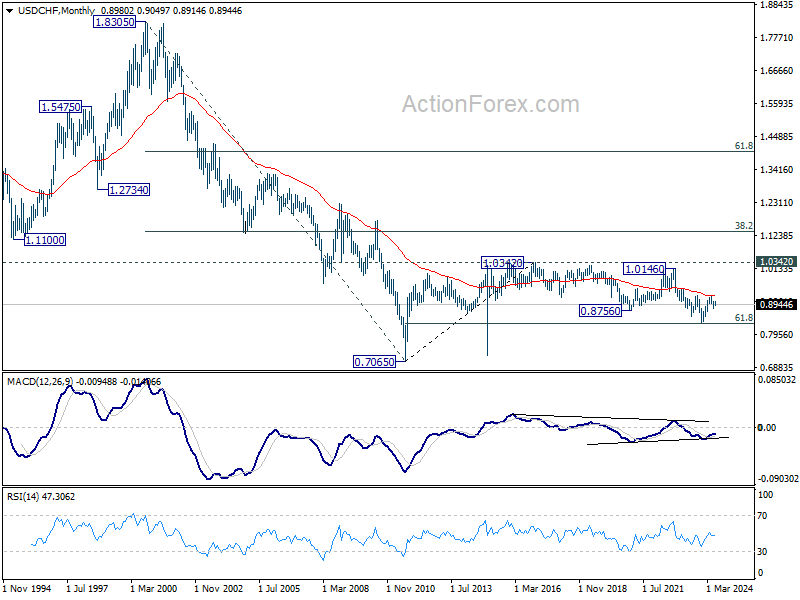
In the long term picture, price action from 0.7065 (2011 high) are seen as a corrective pattern to the multi-decade down trend from 1.8305 (2000 high). Strong rebound from 61.8% retracement of 0.7065 to 1.0342 (2016 high) will start the third leg as a medium term rally. But there will be no sign of long term reversal until firm break of 38.2% retracement of 1.8305 to 0.7065 at 1.1359.
AUD/USD Weekly Report
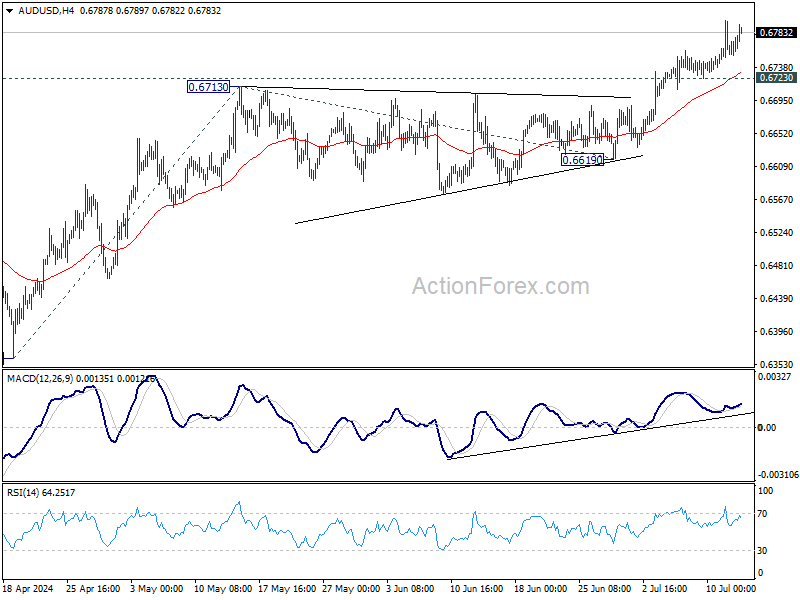
AUD/USD's rally from 0.6361 continued last week and outlook is unchanged. Initial bias stays on the upside this week for 61.8% projection of 0.6361 to 0.6713 from 0.6619 at 0.6837. Decisive break there could prompt upside acceleration through 0.6870 resistance to 100% projection at 0.6971. On the downside, however, break of 0.6723 support will turn intraday bias to the downside for deeper pullback.
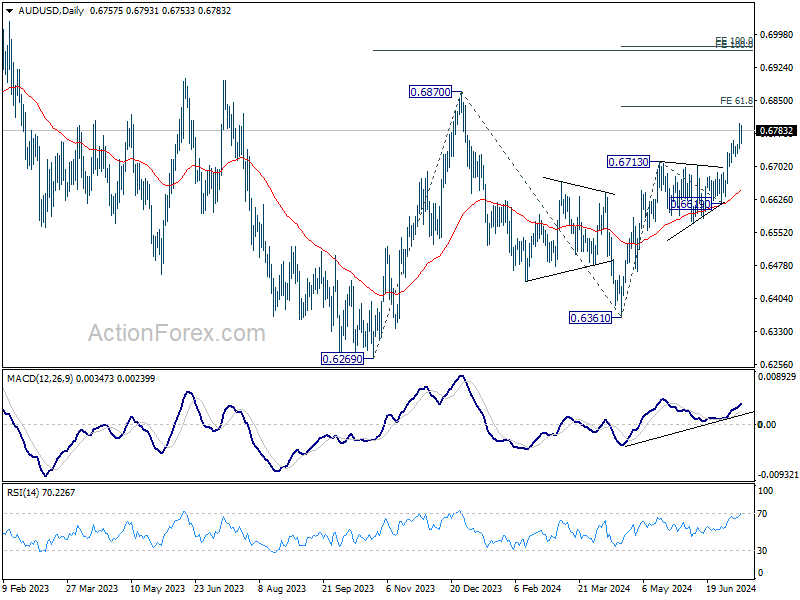
In the bigger picture, price actions from 0.6169 (2022 low) are seen as a medium term corrective pattern to the down trend from 0.8006 (2021 high). Fall from 0.7156 (2023 high) is seen as the second leg, which could have completed at 0.6269 already. Rise from there is seen as the third leg. Break of 0.6870 will target 100% projection of 0.6269 to 0.6870 from 0.6361 at 0.6962.
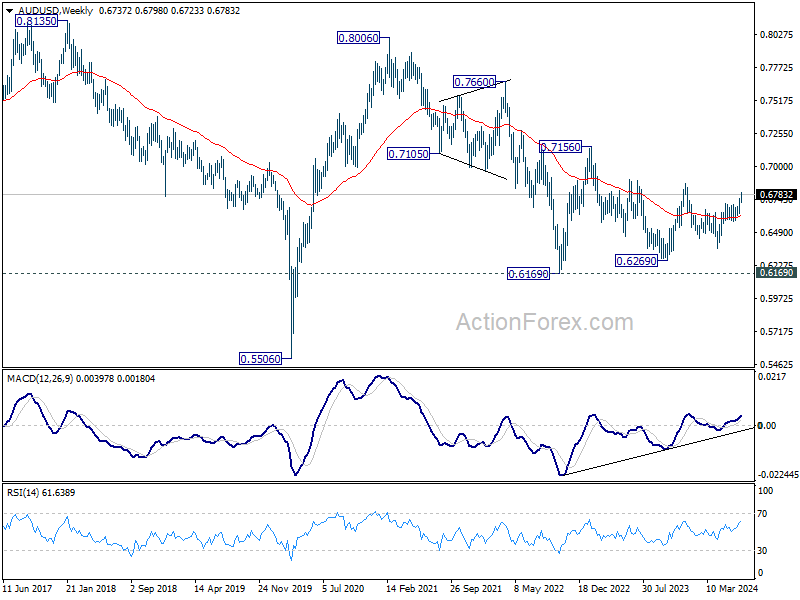
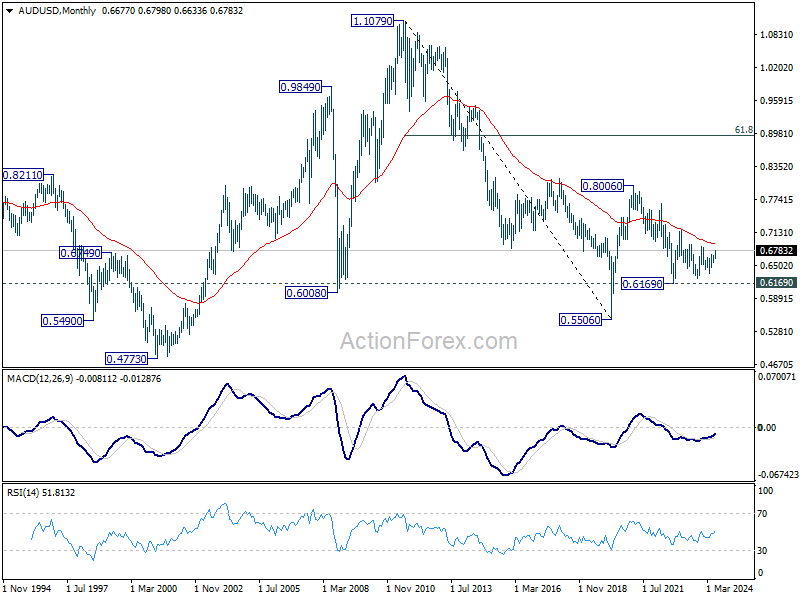
In the long term picture, the down trend from 1.1079 (2011 high) should have completed at 0.5506 (2020 low) already. It's unsure yet whether price actions from 0.5506 are developing into a corrective pattern, or trend reversal. But in either case, fall from 0.8006 is seen as the second leg of the pattern. Hence, in case of deeper decline, strong support should emerge above 0.5506 to bring reversal.
USD/CAD Weekly Outlook
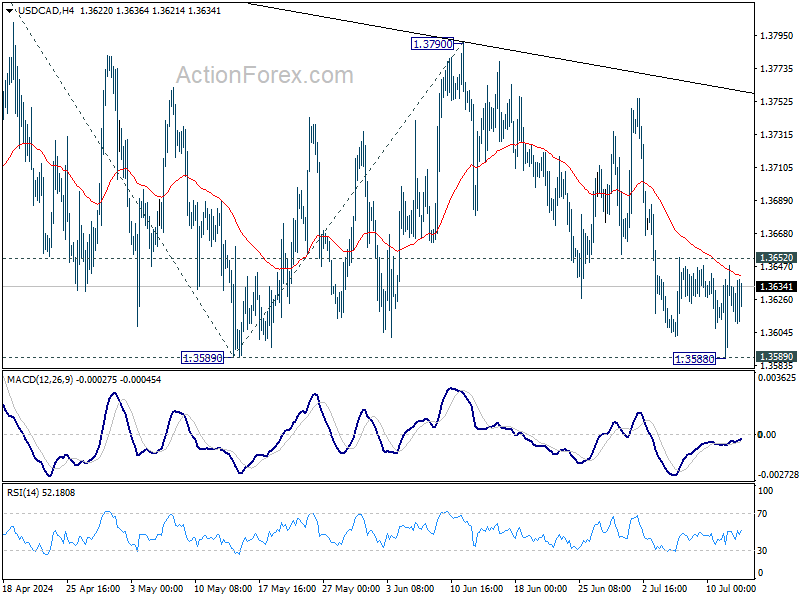
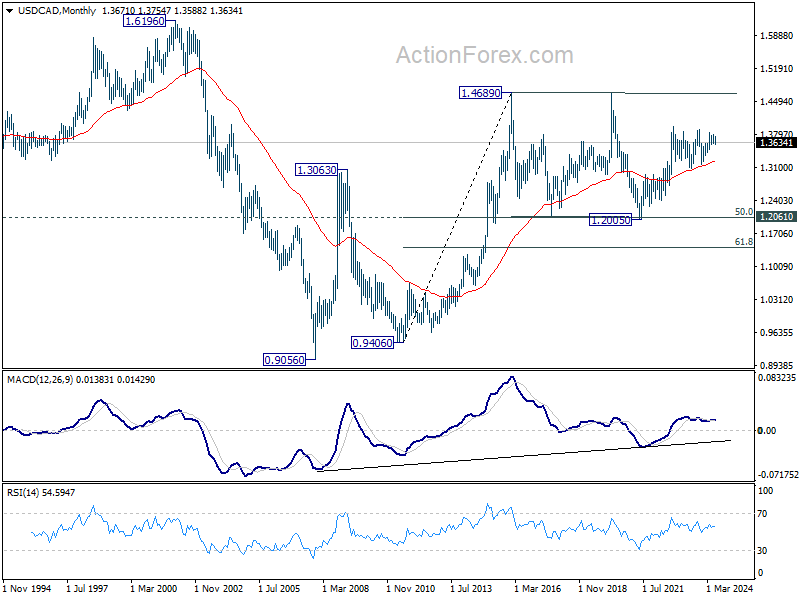
USD/CAD edged lower to 1.3588 last week but recovered after hitting 1.3589 support. Initial bias remains neutral this week first. On the downside, firm break of 1.3589 will extend the corrective pattern from 1.3845 and target 100% projection of 1.3845 to 1.3589 from 1.3790 at 1.3534. Strong support would be seen there to bring rebound. On the upside, above 1.3652 minor resistance will turn bias back to the upside for 1.3790 resistance instead.
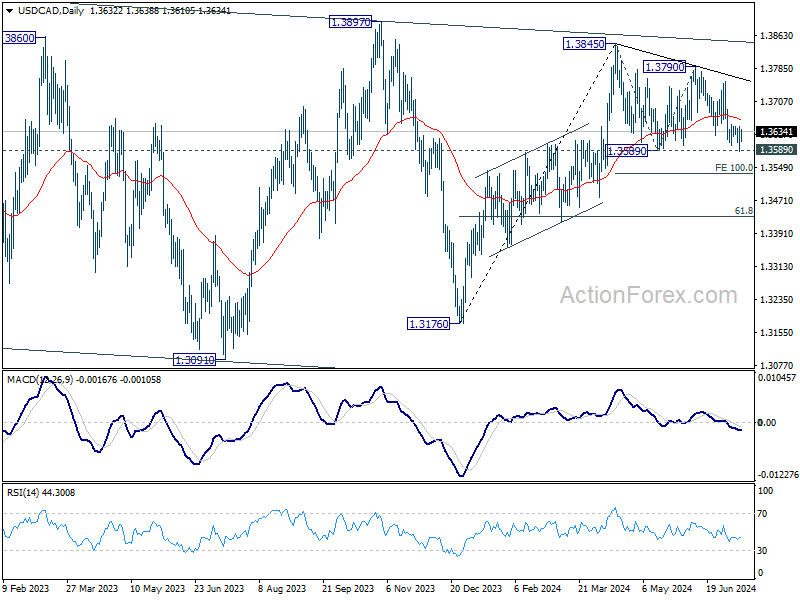
In the bigger picture, price actions from 1.3976 (2022 high) are viewed as a corrective pattern. In case of another fall, strong support should emerge above 1.2947 resistance turned support to bring rebound. Firm break of 1.3976 will confirm up resumption of whole up trend from 1.2005 (2021 low). Next target is 61.8% projection of 1.2401 to 1.3976 from 1.3176 at 1.4149.
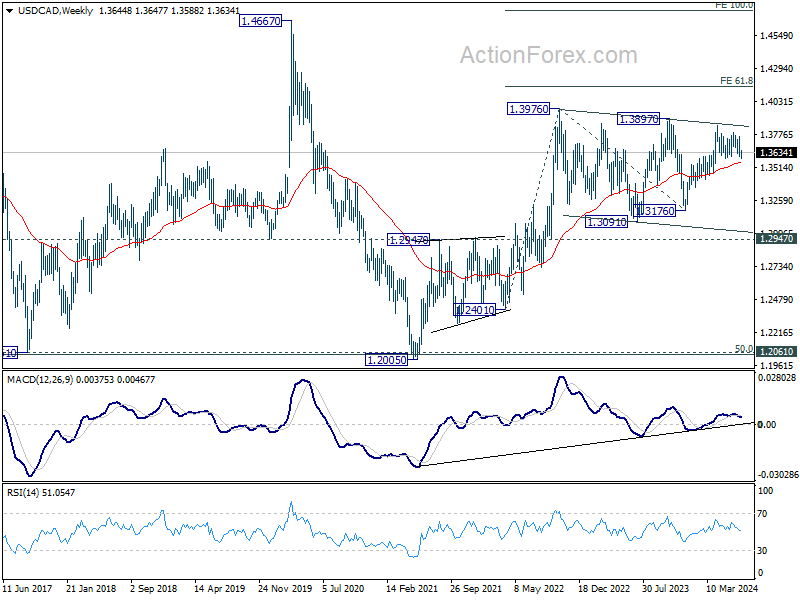
In the longer term picture, price actions from 1.4689 (2016 high) are seen as a consolidation pattern, which might have completed at 1.2005. That is, up trend from 0.9506 (2007 low) is expected to resume at a later stage. This will remain the favored case as long as 1.2947 resistance turned support holds.
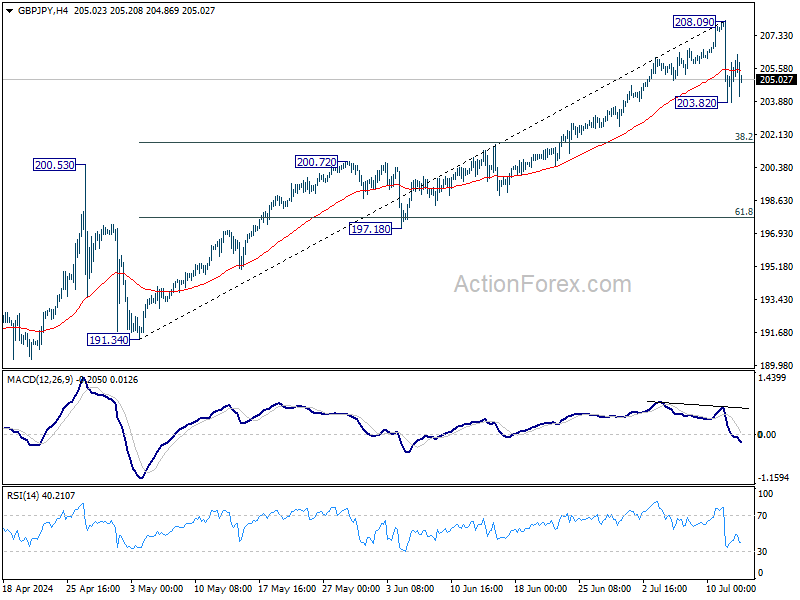
GBP/JPY Weekly Outlook
GBP/JPY retreated sharply after edging higher to 208.09 last week. Considering bearish divergence condition in 4H MACD, a short term top should be in place. Deeper pullback could be seen through 203.82 temporary low. But downside should be contained by 38.2% retracement of 191.34 to 208.09 at 201.69 to bring rebound, and set the range of consolidations. However, sustained break of 201.69 will argue that larger correction is already underway.
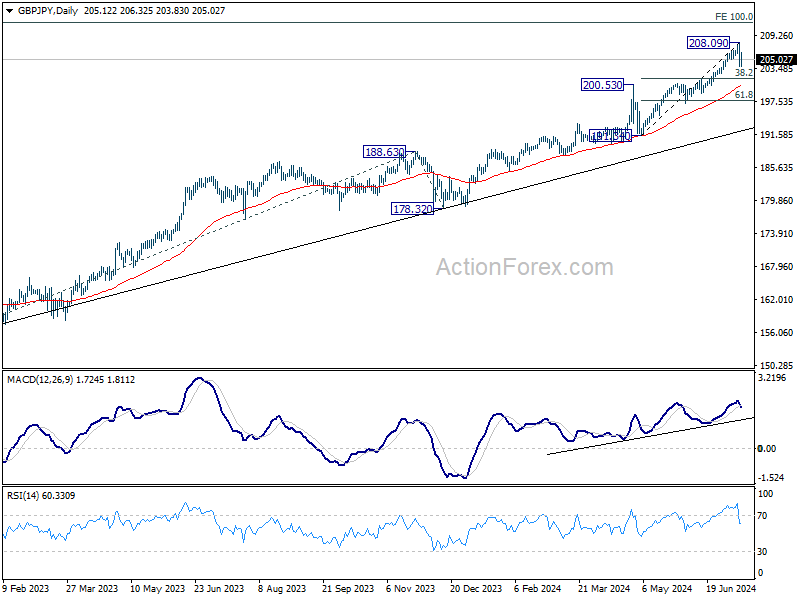
In the bigger picture, as long as 200.72 resistance turned support holds, the long term up trend should still be in progress. Next target is 100% projection of 155.33 to 188.63 from 178.32 at 211.62. However, firm break of 200.72 will suggest that it's already in larger scale correction.
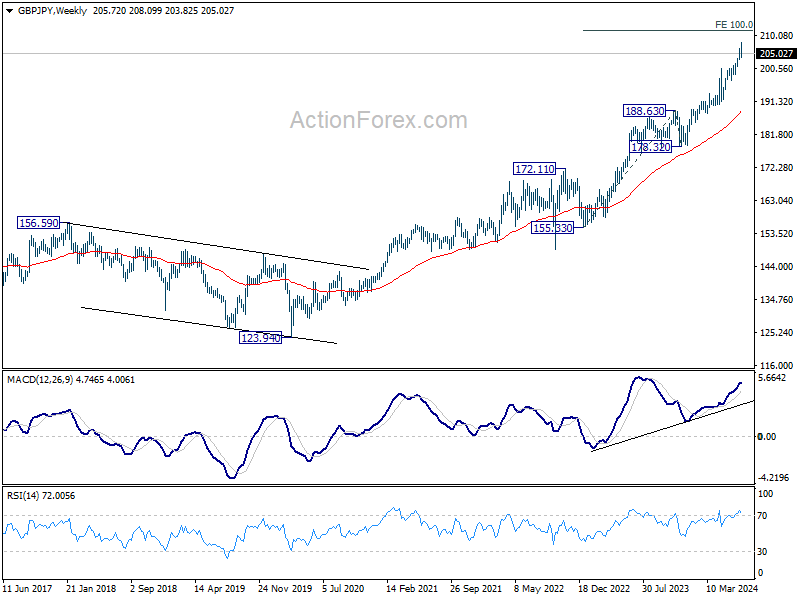
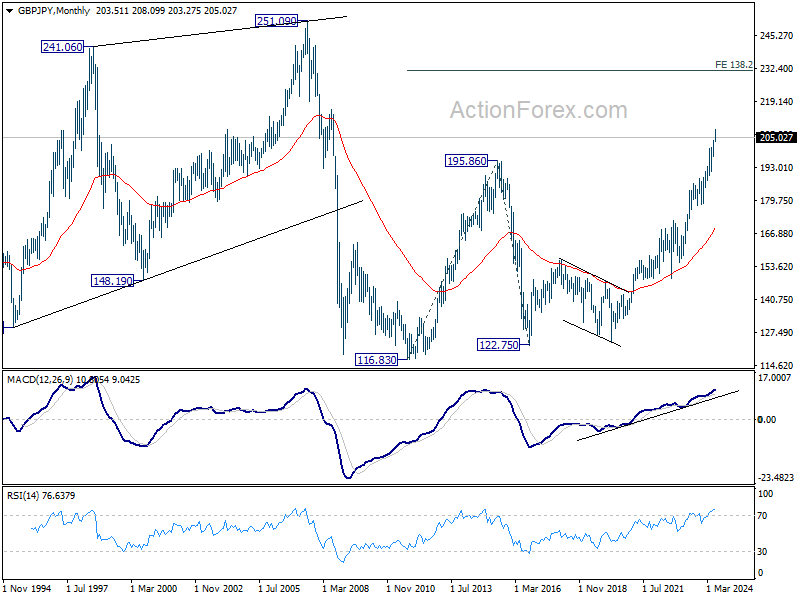
In the longer term picture, rise from 122.75 (2016 low) is seen as the third leg of the pattern from 116.83 (2011 low). Next target is 138.2% projection of 116.83 to 195.86 from 122.75 at 231.96. Outlook will stay bullish as long as 178.32 support holds, or until a clear reversal pattern forms.
EUR/JPY Weekly Outlook
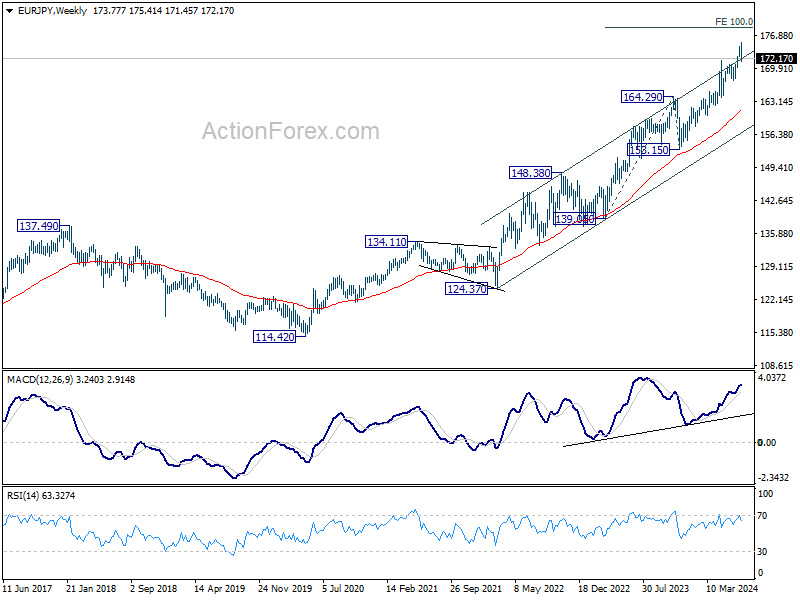
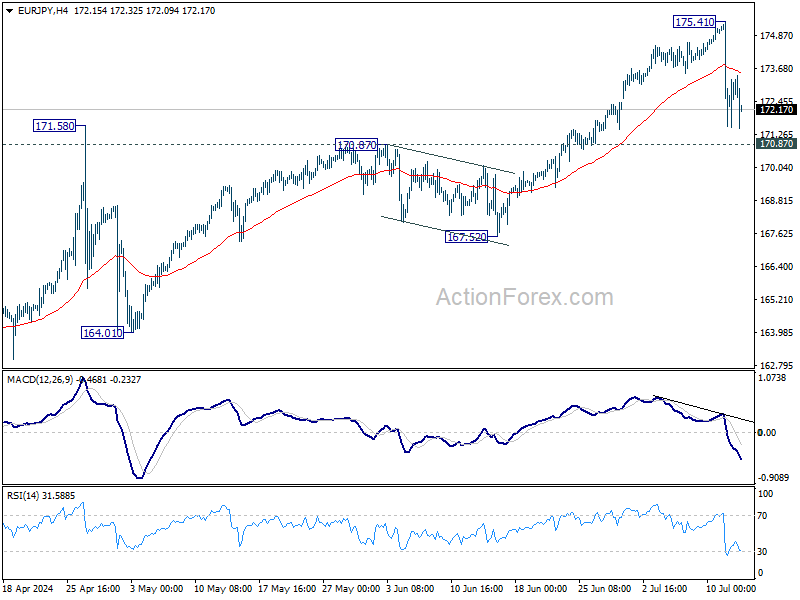
EUR/JPY fell sharply after edging higher to 175.41 last week. Considering bearish divergence condition in 4H MACD, a short term top should be in place. Deeper correction cannot be ruled out. But for now, downside should be contained by 170.87 and bring rebound, to set the range for consolidations. However, firm break of 170.87 will argue that larger correction is already underway and target 167.52 and possibly below.
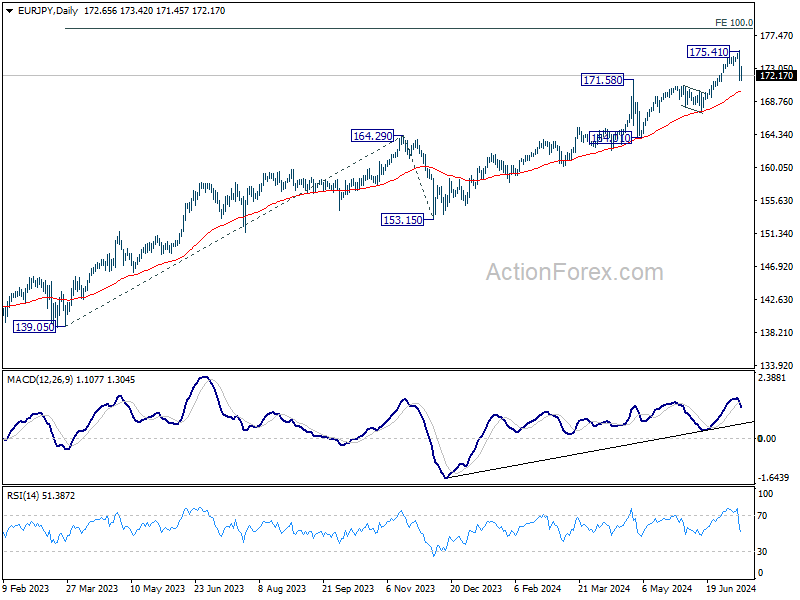
In the bigger picture, as long as 170.87 resistance turned support holds, the long term up trend is still expected to continue. Next target is 100% projection of 139.05 to 164.29 from 153.15 at 178.38. However, firm break of 170.87 will bring deeper fall to 167.52 support. Decisive break there will confirm that larger correction in in progress for 153.15/164.29 support zone.
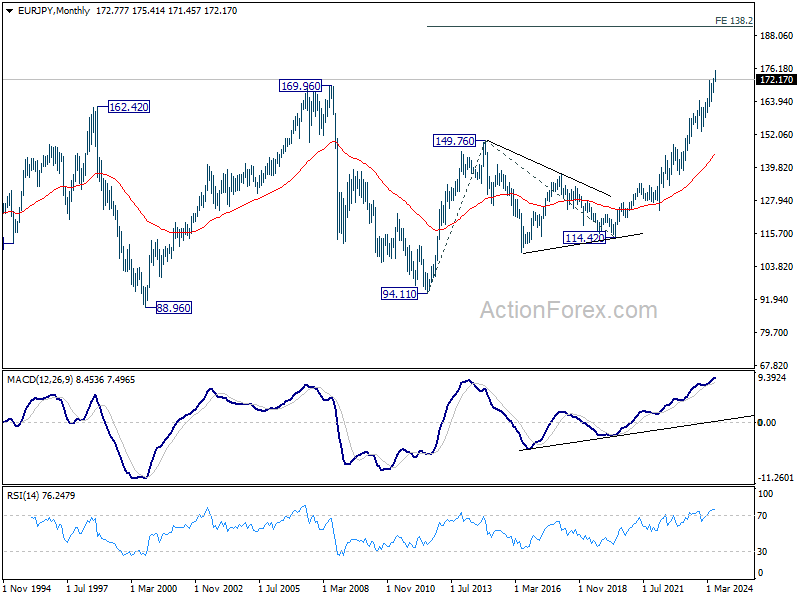
In the long term picture, rise from 114.42 (2020 low) is seen as the third leg of the whole up trend from 94.11 (2012 low). Next target is 138.2% projection of 94.11 to 149.76 from 114.42 at 191.32. This will remain the favored case as long as 167.52 support holds.