

Sample Category Title
Corporates Have Weighed in on Crypto Once Again
Market picture
The crypto market capitalisation fell by 0.8% in 24 hours to $2.11 trillion. An attempt to strengthen the market’s offensive on news about inflation in the US attracted new sellers, which this time can easily be linked to the similar dynamics of the Nasdaq index, with which crypto has the closest correlation.
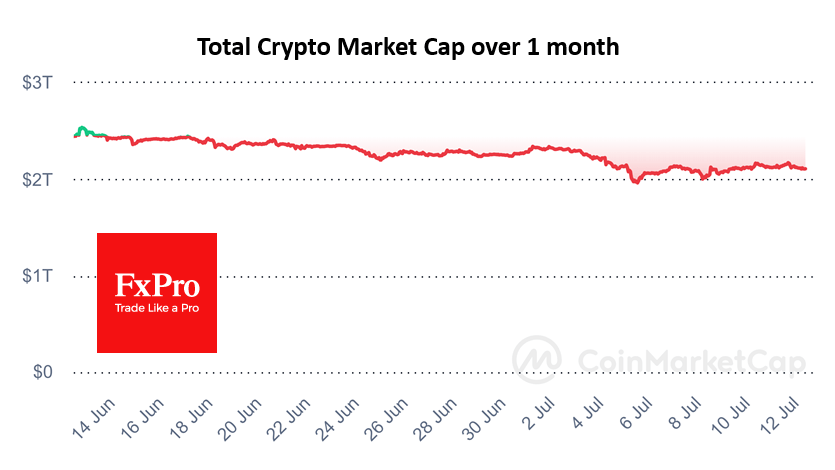
At the same time, the dynamics of the last 24 hours were not one-sided: Bitcoin lost 1.4%, Ethereum—0.3%, BNB—0.9%, and Solana—3.5%, but such coins as XRP, Toncoin, and many others added. Perhaps we can say that those who added were the majority, but their weight in the market was not that big. That is, buyers showed interest in buying, but corporate and government sellers were pulling the market down this time.
Bitcoin is back at $57K after a failed assault on $60K on Thursday. Technically, the bears are keeping the price above the 200-day moving average. In fact, the sellers could be corporates, whose actions are often closely tied to Nasdaq100 performance. German authorities were also actively selling off previously confiscated Bitcoins. This volume is not huge, but some potential buyers prefer to stay on the sidelines, seeing the overhang of sales.
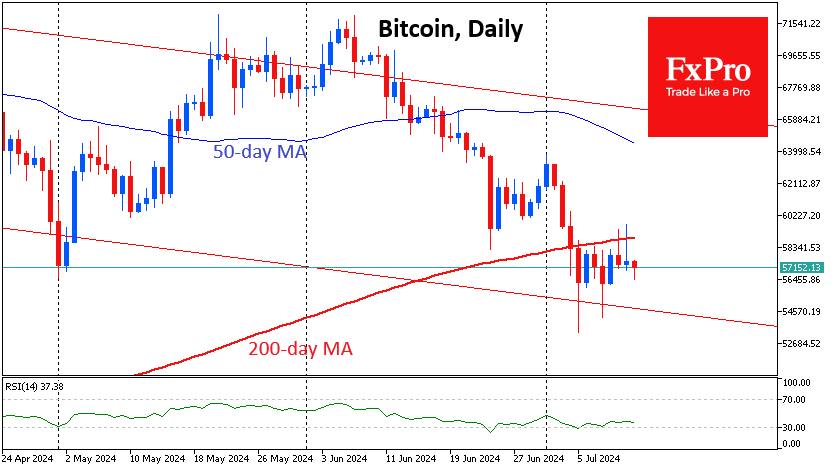
Could we be seeing the start of an altcoin rally? We doubt it, suggesting that the altcoin season only begins when the prices of the largest coins have reached all-time highs and appear overvalued to some.
News background
German authorities have left only 4925 BTC worth about $282 million for sale. This is less than 10% of the original amount seized in January from the pirate movie site Movie2k.
The BitMEX exchange pleaded guilty to violating the US Bank Secrecy Act and wilfully failing to implement an anti-money laundering (AML) programme. The platform became a vehicle for large-scale money laundering and sanctions evasion schemes, the US Attorney for the Southern District of New York said in a statement.
The US SEC has terminated its investigation into stablecoin issuer Paxos and does not intend to pursue enforcement action.
US CFTC Chairman Rostin Banham said that 70-80% of crypto assets do not qualify as securities, contradicting the SEC’s position.
Ethereum co-founder Vitalik Buterin urged the community to prepare for a potential ‘51% attack’ on ETH, one of the main threats. In the context of Proof-of-Stake, a 51% attack occurs when an attacker controls more than 50% of all coins blocked from participating in the validation of network blocks.
Analysis of USD/JPY: Was There an Intervention?
Yesterday’s news of slowing inflation in the US sharply weakened the dollar, anticipating the Federal Reserve’s monetary easing. In the first 15 minutes after the data release:
→ EUR/USD rose by approximately 0.45% to the psychological level of 1.09;
→ GBP/USD increased by approximately 0.55%, reaching a 2024 high.
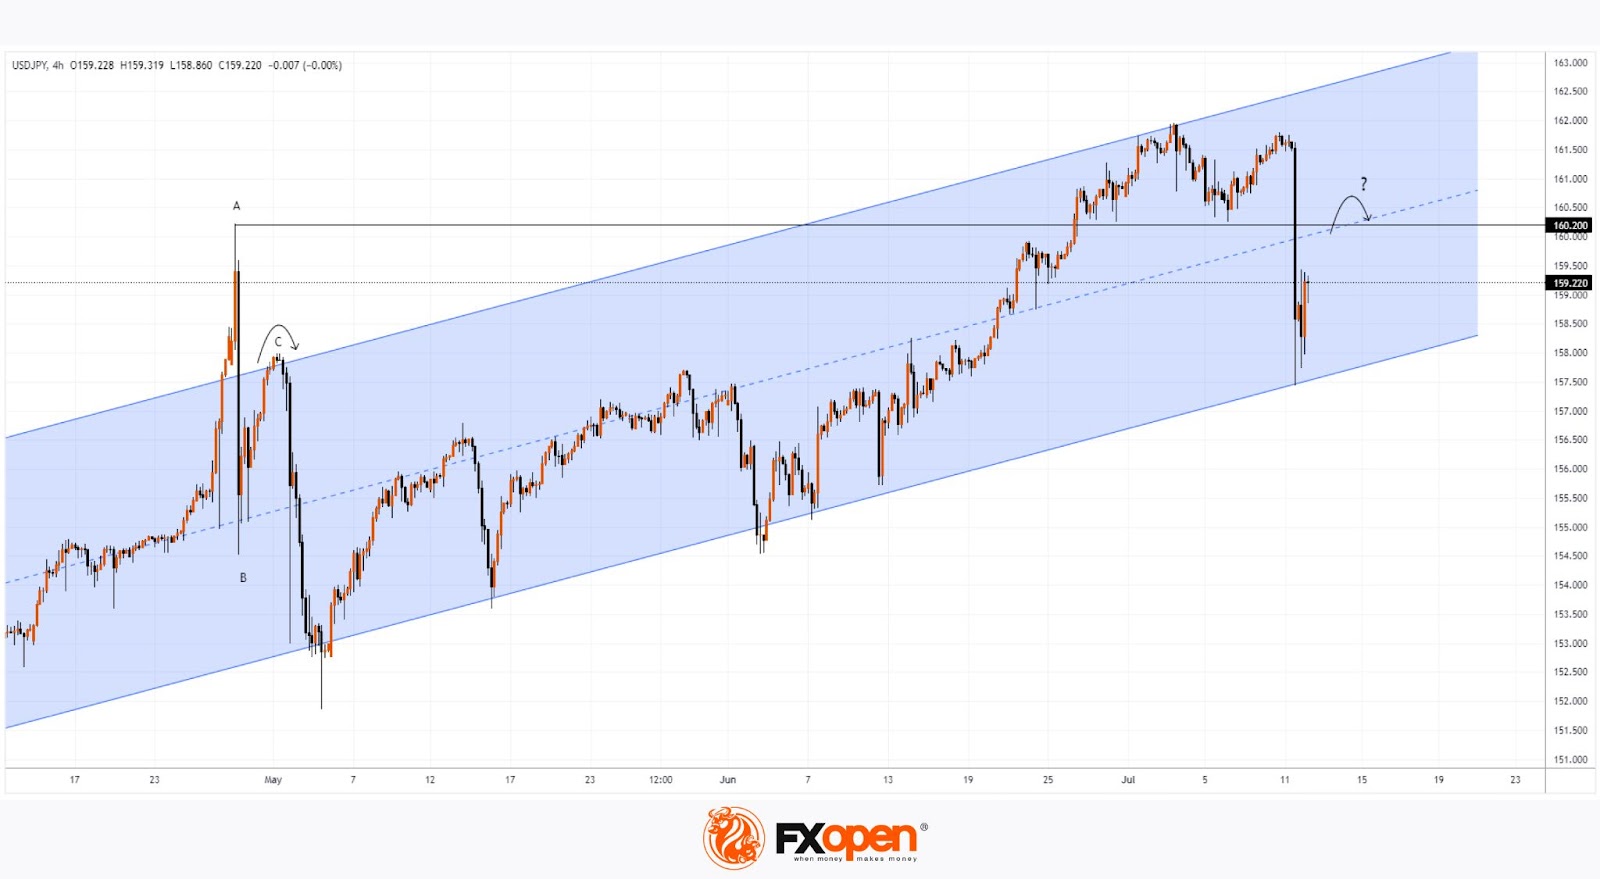
Conversely, USD/JPY fell, with a more aggressive movement. As the chart shows, the dollar weakened against the yen by about 1.8% in the first 15 minutes after the release. This suggests that amidst the US news, the Bank of Japan intervened to support its currency, which hadn’t fallen below 160 yen per USD since June 26.
Reuters reports that Tokyo’s chief currency diplomat, Masato Kanda, stated on Friday that authorities would take necessary measures in the currency market but declined to comment on whether they had intervened.
Aside from the question of intervention, the future outlook for the yen against the dollar is of interest.
On June 27, analysing USD/JPY, we constructed an ascending blue channel.
Technical analysis of USD/JPY with updated data shows that:
→ the price remains within the boundaries of this channel;
→ yesterday’s sharp drop began near its upper boundary, finding support at its lower boundary.
Note the price behaviour in a similar situation after the sharp fall from A→B in late April. A rebound from B→C of approximately 50% occurred, forming a Rounding Top pattern at the upper part (as indicated by the arrow). Bears then reasserted themselves.
If USD/JPY follows a similar scenario, we may see a recovery to the resistance block formed by the median line of the blue channel and the 160.20 level (drawn from the April high), followed by the formation of a rounding top with renewed bearish activity (indicated by the question-marked arrow).
Trade over 50 forex markets 24 hours a day with FXOpen. Take advantage of low commissions, deep liquidity, and spreads from 0.0 pips. Open your FXOpen account now or learn more about trading forex with FXOpen.
This article represents the opinion of the Companies operating under the FXOpen brand only. It is not to be construed as an offer, solicitation, or recommendation with respect to products and services provided by the Companies operating under the FXOpen brand, nor is it to be considered financial advice.
USD/JPY Stabilizes After Massive Slide
The Japanese yen has edged lower on Friday, after posting huge gains a day earlier. USD/JPY is trading at 159.16 in the European session, up 0.26% on the day at the time of writing.
Japanese yen soars – soft US inflation or intervention?
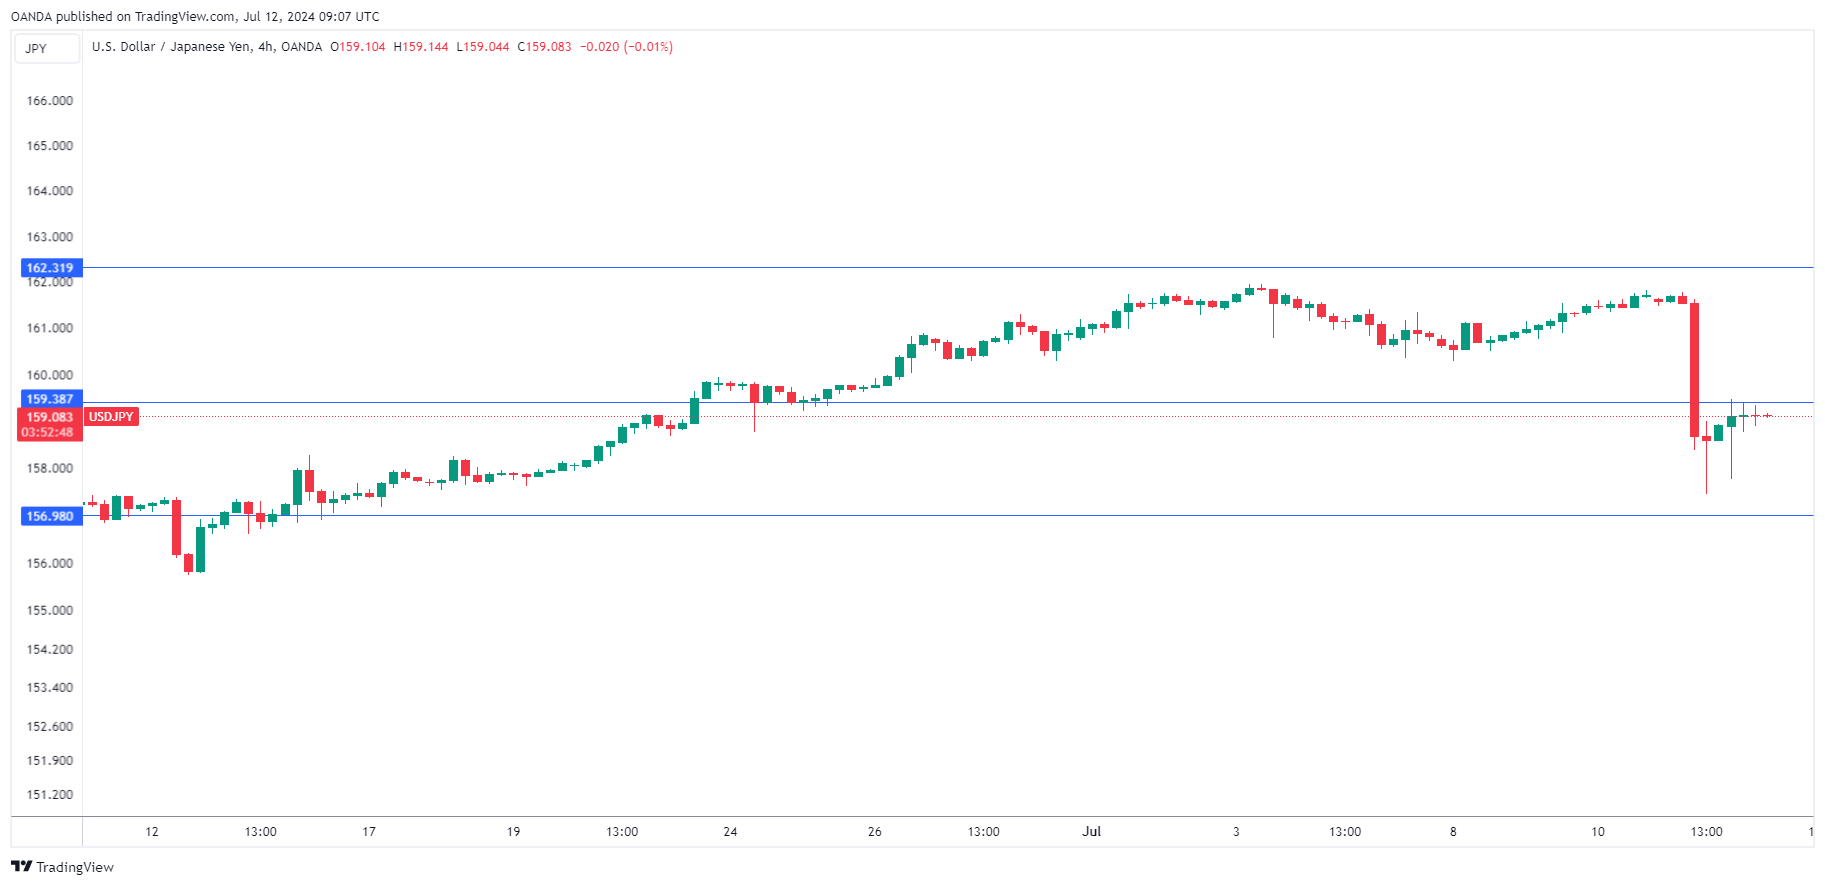
The US dollar was down against most of the major currencies on Thursday, after a softer–than-expected US CPI report raised expectations for a rate cut in September. The yen was the big winner on the day, surging as much as 2.7% and climbing to 157.41 against the dollar. The US dollar recovered some of these losses and USD/JPY closed at 158.76, down 1.8% on the day.
US inflation fell to 3.0% y/y/ in June, its lowest level in a year. This was down from 3.3% in May and below the market estimate of 3.1%. The monthly reading was impressive at -0.1%, the first decline since May 2020. Core inflation also eased in June and market expectations for a September rate cut have jumped to 86%, compared to 69% a day just prior to the inflation report. The Federal Reserve has gone to great lengths to dampen rate cut expectations but may send a more dovish signal to the markets following the very soft inflation data.
The US dollar had a bad day at the office on Thursday but the extent of the slide against the yen raised suspicions that Tokyo had intervened in the currency markets. A report on Japanese TV said that the government and the Bank of Japan had intervened after the US dollar posted losses following the US inflation report.
Japan’s chief currency diplomat, Masato Kanda, didn’t surprise anyone by saying “no comment” about whether there was an intervention on Thursday. Japan is embroiled in a constant cat-and-mouse game with yen speculators and its policy is to keep market participants in the dark about currency interventions. With the Bank of Japan signaling that it plans to tighten policy, we can expect additional volatility from the Japanese currency.
USD/JPY Technical
- USD/JPY tested resistance at 159.37. Above, there is resistance at 161.30
- There is support at 156.97
NZ Dollar Edges Higher Despite Soft Mfg. Data
The New Zealand dollar is slightly higher on Friday. NZD/USD is trading at 0.6110 in the European session, up 0.24% on the day at the time of writing.
New Zealand dollar showing big swings
It has been a volatile few days for the New Zealand dollar. On Wednesday, NZD/USD fell as much as 1% after the Reserve Bank of New Zealand surprised the markets with an unusually dovish rate statement. The RBNZ held the cash rate at 5.5% for an eighth consecutive time but opened the door to rate cuts earlier than expected, perhaps as early as August.
At the previous meeting in May, the RBNZ projected rates would remain at 5.5% until August 2025 and even discussed a rate hike. The central bank made a startling 180 degree pivot at this week’s meeting, hinting at possible rate cuts due to the slowing economy and expectations for inflationary pressures to ease. The markets jumped on the RBNZ’s dovish pivot and have priced in rate cuts in August or November. The rise in expectations of a rate cut sent the New Zealand dollar sharply lower.
New Zealand’s manufacturing sector has been in a depression and the Manufacturing PMI fell deeper into contraction territory in June. The index slid to 41.1 in June, down sharply from 47.2 in May and shy of the forecast of 46.8. This was the lowest reading since August 2021 and has contracted for 15 straight months. The weak domestic economy and softer demand for New Zealand exports continues to weigh on manufacturing.
.
NZD/USD Technical
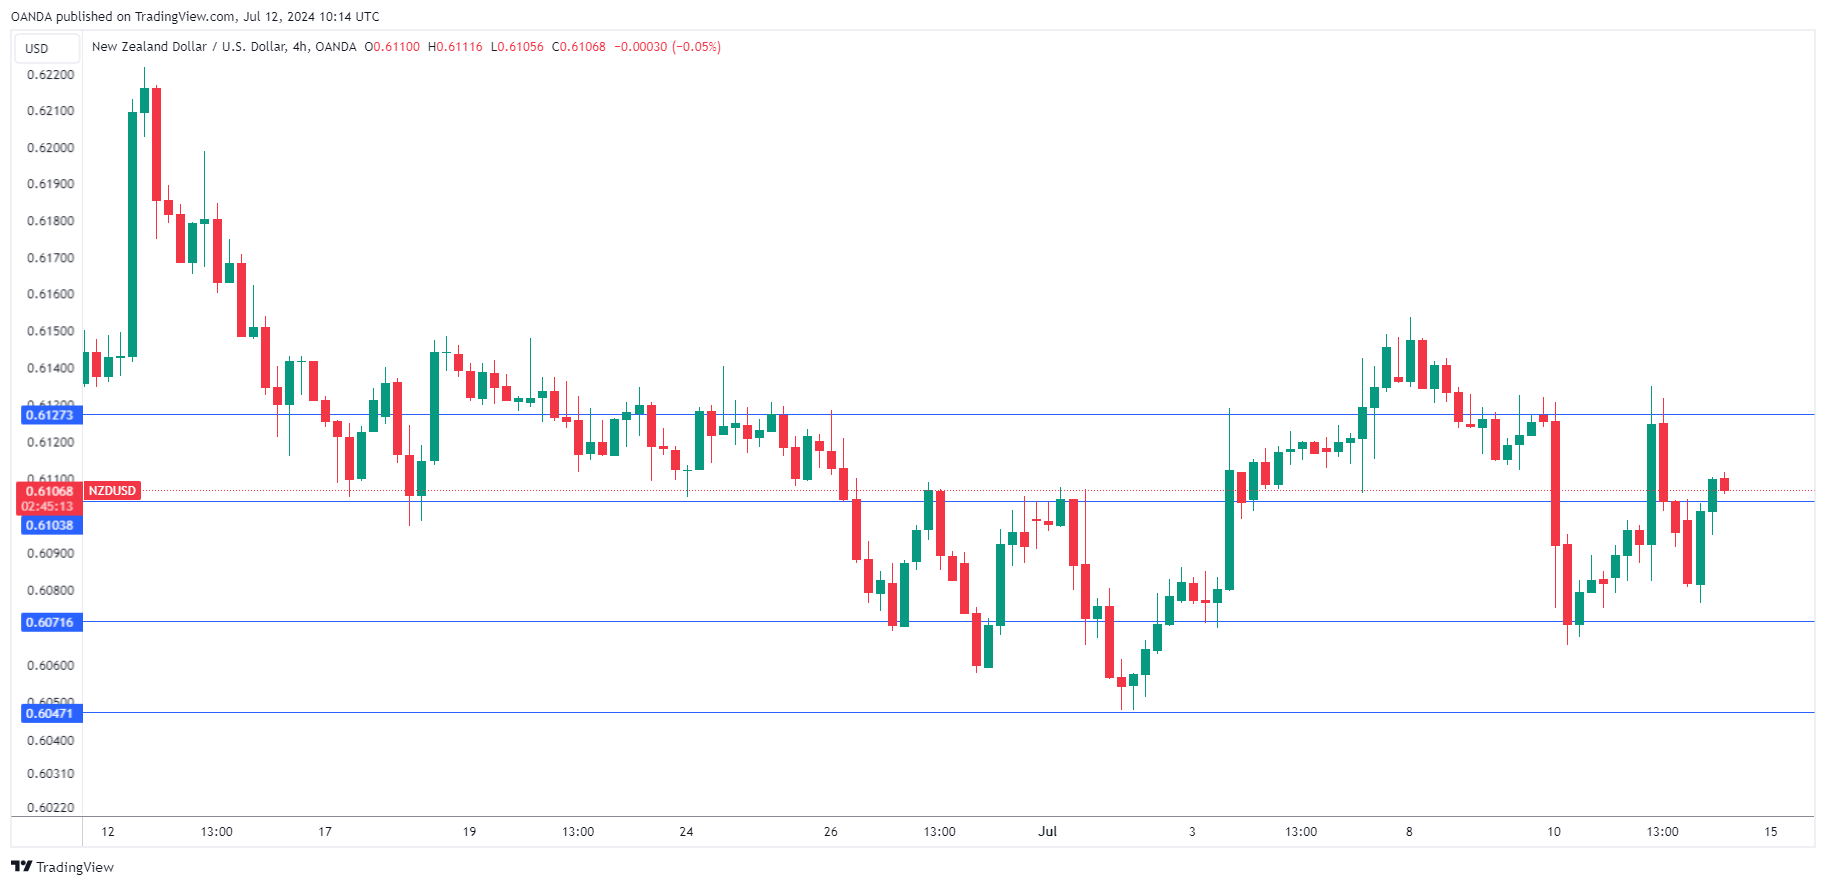
- NZD/USD is testing resistance at 0.6103. Above, there is resistance at 0.6127
- 0.6071 and 0.6047 are providing support
XAU/USD: Gold May Rally Further After US CPI Data Boosted Bets for September Fed Rate Cut
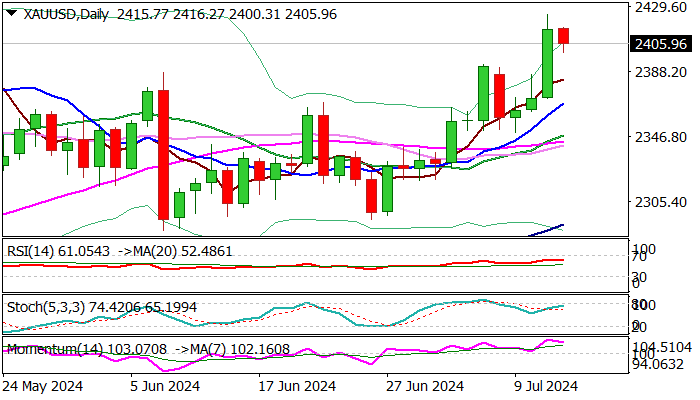
Gold price eases from new seven-week high on Friday morning, as traders took some profits from Thursday’s 1.9% post-US CPI data rally.
The yellow metal received fresh boost from cooler than expected US inflation, which boosted bets (93% from 70% before the data) for Fed rate cut in September.
Easing consumer prices was probably the signal that US policymakers were waiting for, as Fed Chair Powell said in his latest comments that the central bank is on rate cut path but needs more evidence before making a final decision.
Gold price moved to the upper side of broader range under new all-time high, with improving fundamentals (falling inflation and weak economic data, as well as deteriorating geopolitical situation) and bullish technical studies, supporting scenario of fresh acceleration through $2450 barrier and rally into uncharted territory, with initial target at $2500 expected to come in focus.
Corrective dips should be ideally contained at $2380 zone and not exceed daily Tenkan-sen ($2371) to keep bulls in play and offer better buying opportunities.
Res: 2424; 2433; 2450; 2500.
Sup: 2392; 2380; 2371; 2355.
Japanese Yen Surges: Potential Intervention Amid Inflation Shocks
The USD/JPY pair experienced a significant drop to 159.06, driven by sharp declines following the release of unexpectedly low US inflation figures and potential interventions from Japanese authorities.
On Thursday, the pair plunged nearly 3%, prompted by US inflation data and rumours of Tokyo's intervention to bolster the yen, which is nearing 38-year lows. Masato Kanda, Japan's chief currency diplomat, hinted at readiness to intervene in the currency market but remained non-committal about the specific actions taken the previous evening.
Market participants are left to speculate on the nature of these moves as official data that could confirm government interventions will only be available at the end of the month. Reports from Asahi suggest that interventions did occur, while Nikkei highlighted the BoJ's inspections of banks' euro-yen rates, potentially escalating market tensions and supporting the yen's strength.
USD/JPY technical analysis
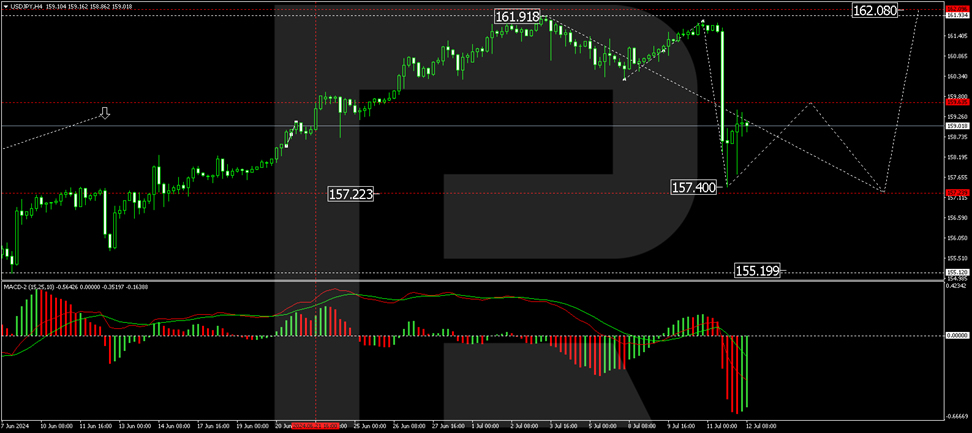
The USD/JPY chart shows a second correction impulse down to 157.40. The potential for a recovery to 159.60 is noted, which would serve as a test from below. A subsequent decline to 157.22 is anticipated. This bearish outlook is supported by the MACD indicator, whose signal line is below zero, indicating a downward trend.
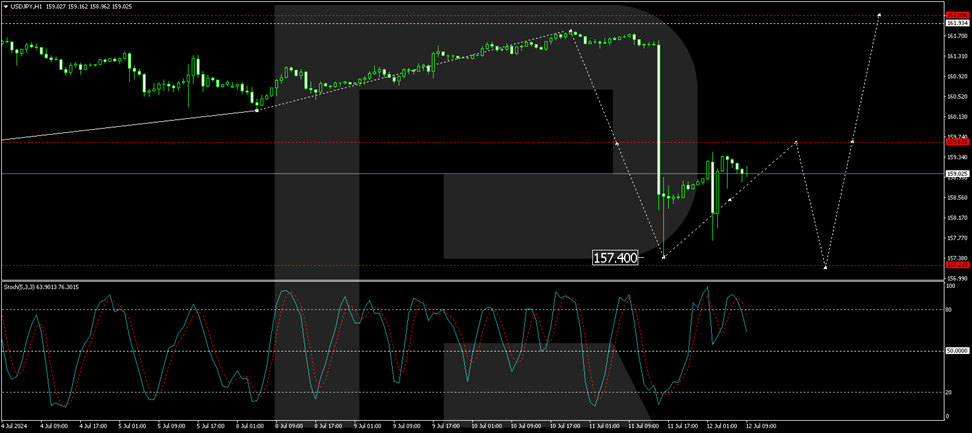
The H1 chart confirms the formation of a downward trajectory towards 157.22, with the immediate target of 157.40 already achieved. A rebound to 159.60 is expected, followed by another decline to the target level. The Stochastic oscillator aligns with this analysis, showing a signal line above 80 and preparing for a downward adjustment to 20, suggesting potential for further declines.
Investors and traders will closely watch further statements from Japanese officials and the forthcoming official statistics to clarify the situation, as these factors will significantly influence the yen's trajectory in the near term.
USDCAD Trades Sideways as 200-SMA Provides Support
- USDCAD is rangebound in the past few sessions
- The 200-day SMA caps the pair’s downside
- Momentum indicators are negatively tilted
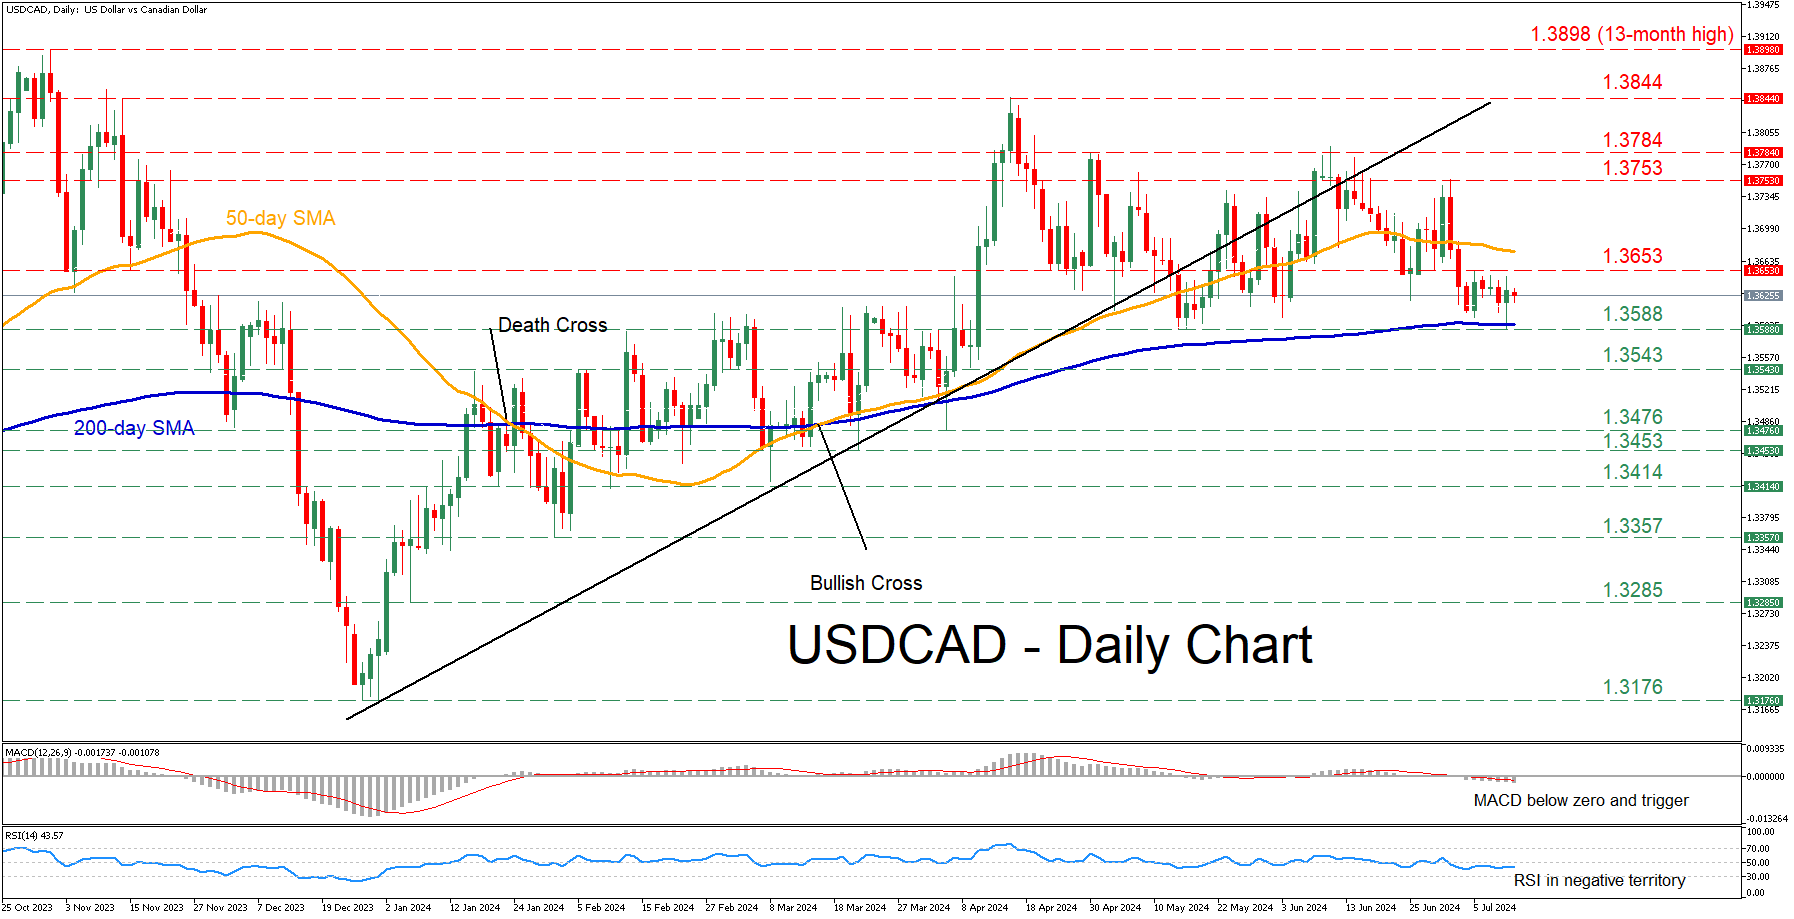
USDCAD had been hovering around its 50-day simple moving average (SMA) for the past two months, appearing incapable of clearing this hurdle. This repeated inability triggered a decisive break below the 50-day SMA on July 3, with the pair trading undecided since then, supported by the 200-day SMA.
Should the bears continue to apply downside pressures, the pair might challenge the recent support of 1.3588, which overlaps with the 200-day SMA and also held strong in May. Lower, the spotlight could turn to 1.3543, a region that acted both as support and resistance from January since April 2024. A break below that level could set the stage for the April low of 1.3476.
On the flipside, if pair reverses higher, the recent resistance of 1.3653 could act as the first line of defense. Conquering that barricade, the bulls could attack the July high of 1.3753. Further advances could then come to a halt at 1.3784, which curbed the pair’s upside both in May and June.
In brief, USDCAD has been stuck in a tight range in the past few sessions, unable to adopt a clear directional trajectory. Therefore, a break above or below that range is likely to be followed by a strong move in the same direction.
GBPJPY Hits 20-Day SMA After Multi-Year High
- GBPJPY may start bearish correction
- Stochastics move down; RSI ticks up
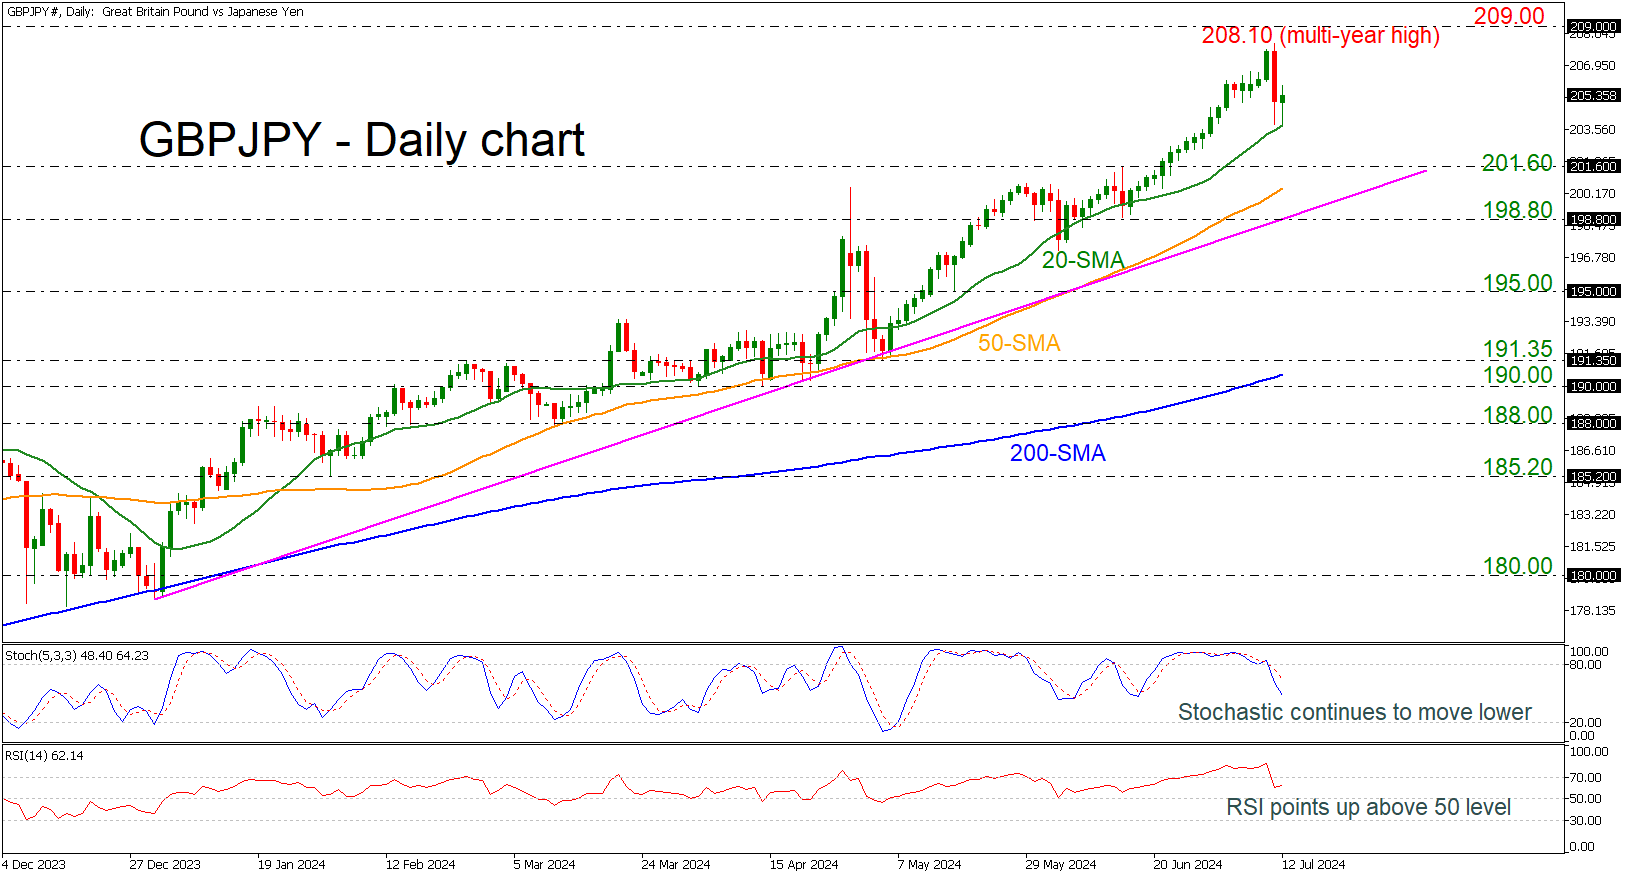
GBPJPY suffered significant losses following an aggressive rally to the multi-year high of 208.10. The pair found immediate support at the 20-day simple moving average (SMA) of 203.80, keeping the bias bullish for now.
Technically, the stochastic oscillator is diving from the overbought region; however, the RSI is ticking up above the neutral threshold of 50.
If there are steeper declines, immediate support could come from the 201.60 barrier ahead of the 50-day SMA at 200.45, before battling with the long-term ascending trend line near 198.80.
On the other hand, a successful move above yesterday’s high could open the way for a test of the next round numbers of 209.00 and 210.00.
All in all, GBPJPY has had a strong upside tendency, and only a decline below the uptrend line and, more importantly, below the 200-day SMA could change the outlook to negative.
Cliff Notes: Shifting Risks and Rhetoric
Key insights from the week that was.
The July Westpac-MI Consumer Sentiment Survey confirmed that households remain downbeat, with the headline index falling 1.1% to 82.7. The latest update continues to speak to a challenging context, characterised by a resurgence in anxiety over inflation and fears over further interest rate increases. Indeed, Westpac-MI Mortgage Rate Expectations have staged a cumulative 30% bounce over the past three months alone, representing the sharpest ‘hawkish’ turn in the past seven years. Against that backdrop, it is hardly surprising that households’ views on their financial position soured in the month, the sub-index tracking ‘family finances vs a year ago’ and ‘family finances next 12 months’ declining 8.4% and 4.5% respectively in July.
Consumers’ unemployment expectations fell 3.3% in July, returning back to the long-run average after having begun to tick higher over recent months. This is consistent with a softening in labour market conditions rather than a sharp rise in job losses, as has broadly been the case for much of the past year. Given that the unemployment rate remains fairly close to its lows, one might speculate that the labour market remains just as tight as it was last year. Earlier this week, Chief Economist Luci Ellis instead highlighted that labour market tightness can ease significantly without necessitating a corresponding large rise in unemployment. In today’s essay, Chief Economist Luci Ellis explores the importance of identifying the underlying drivers and appropriate response to such dynamics.
Other data received this week was in line with our views. Growth in Australian housing finance approvals caught its breath in May, posting a broad-based decline of –1.7% in the month after having experienced an 11.6% surge over the past three months. With some of the steam coming out of housing market – both with respect to prices and turnover – a more moderate pace of firming heading into next year looks more likely. Meanwhile, the latest NAB business survey provided a downbeat update on business conditions, underscored by a persistent weakening in forward orders and a slowdown in hiring. For policy, it was constructive to see gauges of prices and costs ease following May’s bounce however, the onus ultimately lies on official inflation data to assess disinflation’s current pace.
In the US, the headline CPI fell –0.1% in June, bringing annual headline inflation down from 3.3%yr to 3.0%yr. Meanwhile, core inflation rose just 0.1% in the month and at 3.3%yr, it remains slightly above the headline measure. The detail showcased a decline in core goods prices (–0.1%) and a marginal 0.1% lift in core services prices, much lower compared to the six-month average of 0.4%. Deceleration in the shelter component was key to the latter, as both rent and owners' equivalent rent components eased. This is consistent with other timely measures on rents which are showing weaker rental growth in new leases signed. The result provides the ‘greater confidence' that FOMC Chair Powell alluded to in his recent hearings.
During his semi-annual testimony to Congress this week, Powell’s comments hinted that the FOMC may be more open to rate cuts in the near future. Powell characterised the labour market as 'fully back into balance' compared to ‘moving into better balance’ last month, reflecting an updated assessment following recent labour market data. Better still, he remarked that the labour market was ‘not a source of broad inflationary pressure for the economy’. Alongside the risks of elevated inflation, he emphasised the risks of reducing policy ‘too late or too little’. That the risk of moving too slowly is being actively considered suggests the Committee is more biased towards moving than not.
Overall, this week’s data and commentary further supports our view that the FOMC will begin rate cuts in September and pursue at a measured pace of one rate cut per quarter until June 2026. Before then, we will get a couple more inflation readings which is likely to help bolster the FOMC’s confidence. The July meeting and the sentiment during the Jackson Hole symposium in late August should provide a clearer signal of willingness to cut rates.
Meanwhile, the Bank of Korea (BoK) also noted this week that they will ‘examine the timing of a rate cut’. The BoK was the first central bank in Asia to raise rates in 2021, finishing its hiking cycle a year and a half ago. Core inflation in South Korea was at the 2.0% target in May and June while headline has been easing, currently at 2.4%yr. Korea is similar to most of Asia, where inflation is at, or very close, to central bank targets. However, most are hesitant to move before the FOMC at risk of devaluing their currencies and potentially introducing imported inflation. This leaves many policymakers buying time before cutting, even as domestic conditions necessitate easing monetary policy settings.
In China, consumer prices undershot expectations rising 0.2%yr while producer prices fell –0.8%yr. While some of the downward pressure on consumer prices in the month were a result of discounting for various household contents and automobiles during the “618” shopping festival, the underlying picture of slow consumer demand remains. The more benign fall in producer prices compared to history reflects an increase in energy and commodity prices in recent months. However, excess capacity in the economy will continue to be a disinflationary force looking ahead.
Finally in the UK, GDP grew 0.4% in May, adding to the cumulative 1.5% increase in GDP since December 2023. Much of this was supported by the 0.7% growth in consumer-facing services, no doubt a result of robust real wages growth. As BoE policymakers focus on bringing sticky services inflation down, this result suggests they can be patient if needed in normalising policy.
Nasdaq 100 Index Fell Despite Positive Inflation News
Yesterday, Consumer Price Index (CPI) values were published, indicating a slowdown in the rate of inflation in the USA. According to ForexFactory:
→ CPI month-on-month: actual = -0.1%, forecast = 0.1%, previous month = 0.0%;
→ CPI year-on-year: actual = 3.0%, forecast = 3.1%, previous month = 3.3%.
The data confirming the slowdown in inflation raised expectations that the Federal Reserve might lower interest rates as early as September. But why did the Nasdaq 100 (US Tech 100 mini on FXOpen) drop then? Yesterday, the tech stock index fell by over 2.1%, marking its worst day since early May.
The reason lies in rotation. Investors seem to have shifted their focus from the highly inflated tech stocks since the start of 2024 to other sectors. Approximately 400 companies in the S&P 500 index (US SPX 500 mini on FXOpen) showed growth. Meanwhile, the Dow Jones Industrial Average (Wall Street 30 mini on FXOpen) closed in the green yesterday.
Bloomberg reports that Kelly Cox from Ritholtz Wealth Management believes this day could be a turning point for the markets. It also serves as a good reminder of the importance of diversification.
One of the drivers of yesterday's decline was NVDA shares, which fell by more than 5% in a day (we wrote about the bearish behaviour of Nvidia’s price and volumes just the day before).
What’s next?
The equal-weighted version of the S&P 500, where stocks like Nvidia have the same weight as Dollar Tree Inc., rose yesterday. This version of the index is less sensitive to the influence of large tech companies, making a case for the rally expanding to other stocks.
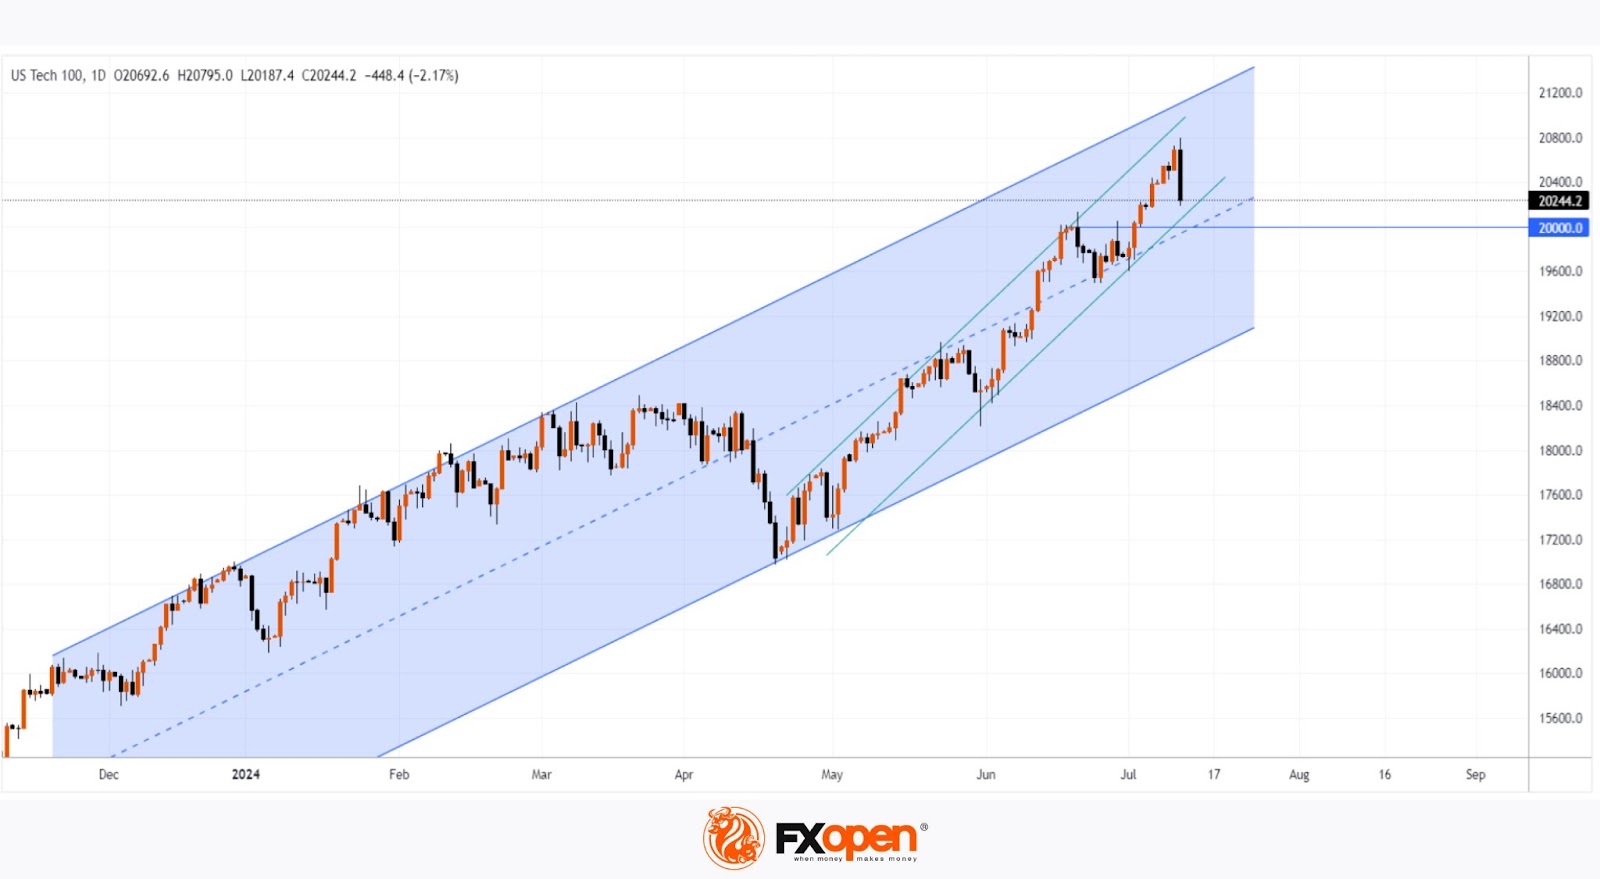
Technical analysis of the Nasdaq 100 (US Tech 100 mini on FXOpen) chart gives bulls some hope, as if the price continues to fall, it will encounter a series of supports:
→ from the lower boundary of the green channel;
→ from the psychological level of 20,000;
→ from the median line of the blue channel.
It is possible that the bearish momentum seen yesterday may dissipate when it meets these supports. However, it is unlikely to restore the attractiveness of tech stocks to the level they had before yesterday.
Trade global index CFDs with zero commission and tight spreads. Open your FXOpen account now or learn more about trading index CFDs with FXOpen.
This article represents the opinion of the Companies operating under the FXOpen brand only. It is not to be construed as an offer, solicitation, or recommendation with respect to products and services provided by the Companies operating under the FXOpen brand, nor is it to be considered financial advice.