

Sample Category Title
GBP/USD Daily Outlook
Daily Pivots: (S1) 1.2858; (P) 1.2903; (R1) 1.2960; More...
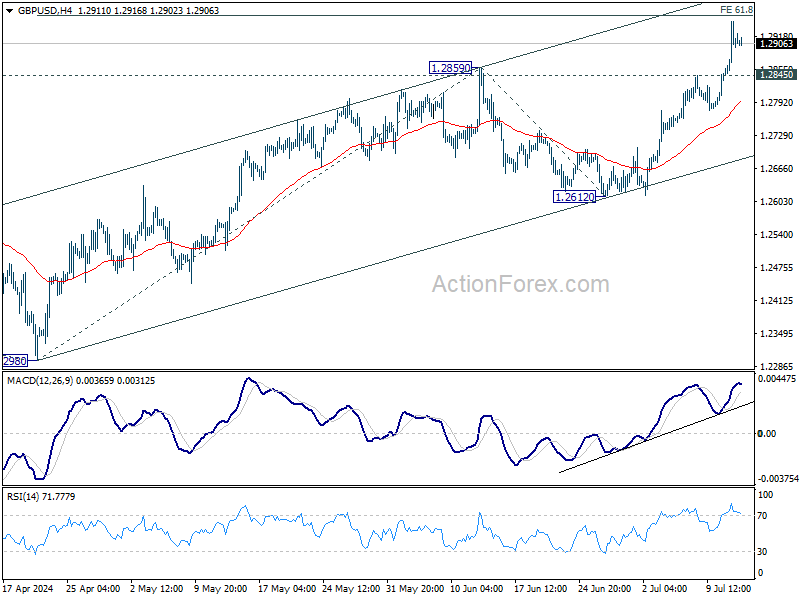
Intraday bias in GBP/USD remains on the upside for 61.8% projection of 1.2298 to 1.2859 from 1.2612 at 1.2959. Decisive break there would prompt upside acceleration through 1.3141 resistance to 100% projection at 1.3173. On the downside, below 1.2845 resistance turned support will turn intraday bias neutral first.
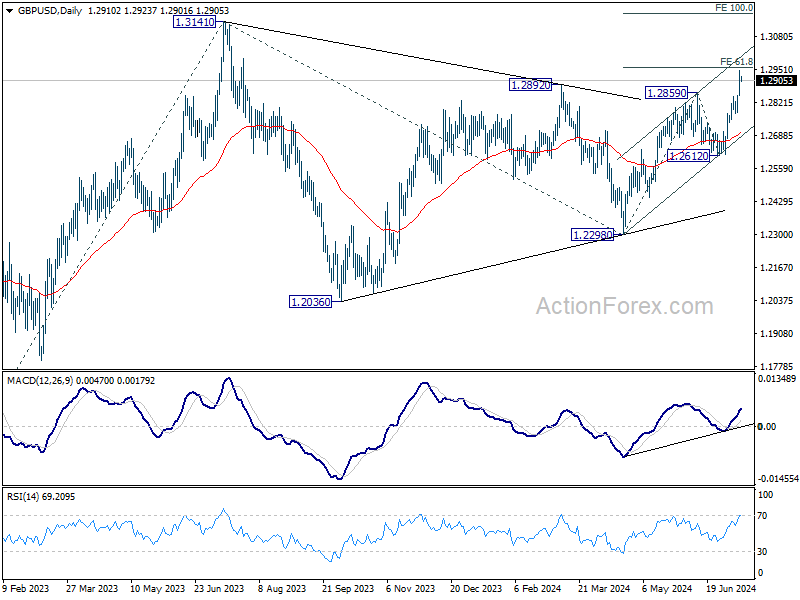
In the bigger picture, price actions from 1.3141 medium term top are seen as a corrective pattern which might have completed with three waves to 1.2298 already. This will now remain the favored case as long as 1.2612 support holds. Firm break of 1.3141 will target 61.8% projection of 1.0351 (2022 low) to 1.3141 (2023 high) from 1.2298 at 1.4022.
Soft US CPI Boosts Reflation Trade
I don’t know for the Federal Reserve (Fed) but investors definitely got to the evidence that inflation is on a right path to justify a Fed rate cut sooner rather than later yesterday after the latest CPI report printed a slower-than-expected figures both for headline and core inflation, both on a monthly and on a yearly basis. The US 2-year yield fell by another 10bp chunk to around 4.50% and the 10-year yield tipped a toe below 4.17% before bouncing back above the 4.20% mark. Activity on Fed funds futures showed that the probability of a September rate cut soared up to 95% and is holding near 92.5% this morning, while this probability was less than 75% at the same time yesterday morning. The US dollar index sank shortly below its 200-DMA. From a technical perspective, the index is still in the bullish trend, above 104.20 - the major 38.2% Fibonacci retracement on this year’s rebound, yet we now have a stronger case building for a sustainably decline below this level.
The sharp dollar selloff sent the US dollar meaningfully higher against most currencies but the Japanese yen particularly attracted attention after the USDJPY tanked from near 162 to below 159 level in a single move. The move sparked speculation that the Bank of Japan (BoJ) may have stepped in and took the opportunity to exacerbate the negative move. Some news outlet backed the rumours while the BoJ officials kept silent. Not knowing whether yesterday’s yen purchases were or were not fueled by the BoJ makes intervention significantly more effective as traders simply don’t know if – by buying the dip – they are betting against the BoJ, which has only limited sources to make such interventions, or they are betting against thousands of buyers who have the power to overhaul the market. As a result, we don’t know, but the USDJPY is trading below 160 this morning.
In the UK, the pound was already bid yesterday morning after stronger-than-expected growth data helped traders scale back the expectation of an August cut from 70% to a coin toss. Combined with rising hawkish voices at the Bank of England (BoE), waning political risks and softening US dollar, we could see Cable make an attempt on the 1.30 level. But the fact that the BoE hawks cry louder doesn’t mean that the doves are not around…
Across the Channel, the EURUSD advanced to 1.09 yesterday. The single currency got a further support from the French finance minister Bruno Le Maire’s pressing with planned spending cuts to reassure the EU and the markets that France will comply with the EU rules and not let the debt explode following a government change, while the Bank of France Chief Francois Villeroy warned against increasing the government debt and taxes for companies. The fiscal and monetary policymakers joint efforts seem to be paying off with the French 10-year yield back to levels when Macron had called for the snap election and the CAC 40 is again testing the 200-DMA offers to the upside on lower yields and on a revived reflation trade on rising Fed cut expectations.
Interestingly, the S&P500 and Nasdaq fell sharply yesterday after the US CPI data. The sharp rise in Fed rate cut bets and falling yields looked like they didn’t give support to the major US indices, but they did. The S&P500’s equal weight index jumped 1.20%. Almost 400 stocks within the S&P500 gained yesterday, all sectors gained except for technology – and consumer staples as it was dragged down by Amazon, but most stocks in the S&P500 cheered the news. The Russell 2000 soared more than 3.5% to this year’s peak level that was reached by the end of March. Oil gained, gold jumped past the $2400 level as lower yields decreased the opportunity cost of holding the non-interest bearing metal while SPDR’s metals & mining ETF jumped 2.74%. So the flight from Big Technology to other sectors, the reflation trade, was big like a mountain at yesterday’s trading session. But it also came as a proof that, no matter how hard the other sectors rally, if the bleeding in Big Tech stocks is not contained, the major indices will suffer.
Inside Tech, Nvidia lost more than 5.5% as investors left the safety of Big Tech which are rate-proof thanks to AI, MAMAA stocks fell 2.77% while Tesla dived almost 8.5% as the selloff was amplified by the news that the company will delay revealing details on its robotaxi from August to October and use the additional weeks to build additional prototypes. It sounded like the prototypes that they have in hand are not good enough to keep investors dreaming. Note that, Tesla’s stock price rallied 11-day in a row after Elon Musk pointed at August 8th robotaxi reveal, let’s see how many days of selloff the delay will cause.
Today, attention shifts to earnings. The US big banks will open the dance today. Shares of big US big banks outperformed the S&P500 this year. But the Q2 results may look mixed as the interest rate environment wasn’t favourable due to rise in yields, the net interest income may have remained limited due to sluggish loan growth, the non interest revenues were probably mixed due to slowing economic activity and credit is a place to watch given the fears around the commercial real estate but investors could look past the rate-related worries as the Fed is now expected to announce the first rate cut as early as September and cut three times before the year ends.
EUR/USD Daily Outlook
Daily Pivots: (S1) 1.0829; (P) 1.0864; (R1) 1.0904; More....
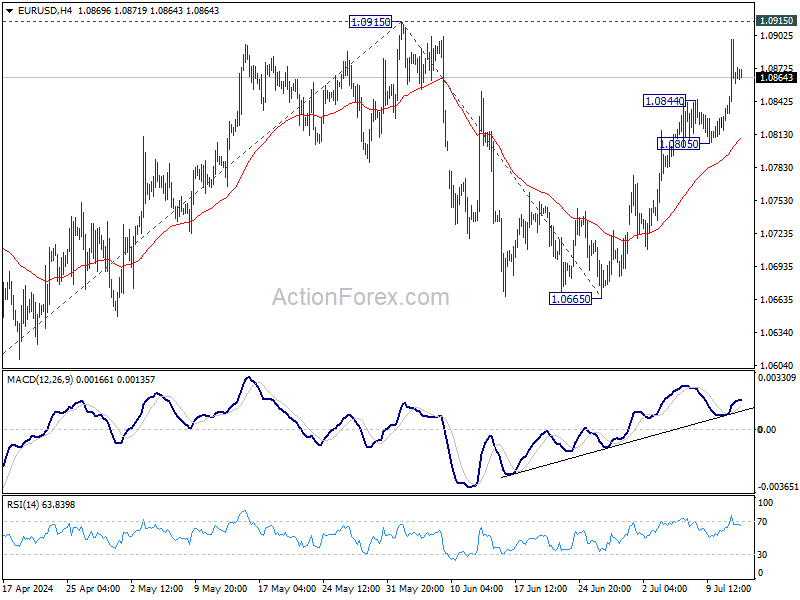
Intraday bias in EUR/USD remains on the upside for retesting 1.0915 resistance. Decisive break there will resume whole rally from 1.0601 and target 100% projection of 1.0601 to 1.0915 from 1.0665 at 1.0919 next. For now, risk will stay on the upside as long as 1.0805 support holds, in case of retreat.
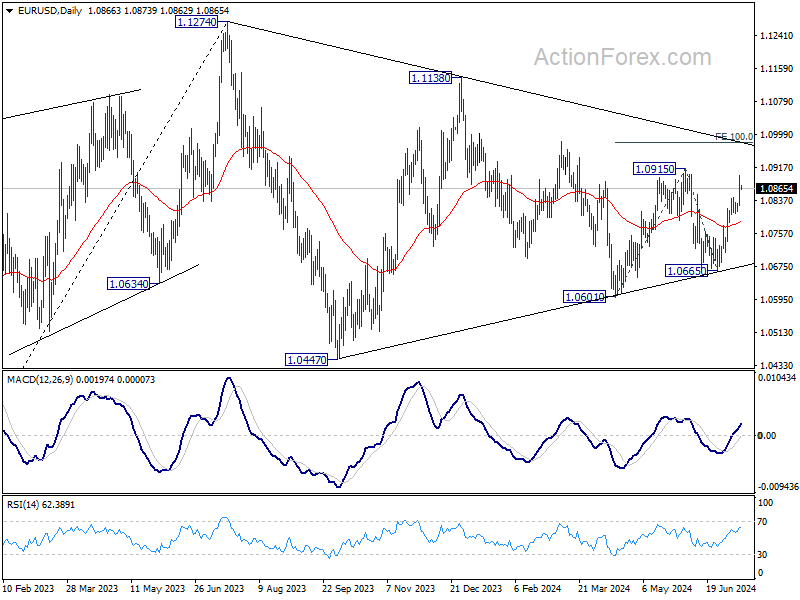
In the bigger picture, price actions from 1.1274 are viewed as a corrective pattern that could still be in progress. Break of 1.0601 will target 1.0447 support and possibly below. On the upside, firm break of 1.0915 resistance will start another rising leg back to 1.1138 resistance instead.
Yen’s Sharp Rally Pauses, Japan Declines to Confirm Intervention
Japanese Yen is currently the best performer of the week, bolstered by alleged intervention by Japanese authorities overnight. Both Finance Minister Shunichi Suzuki and outgoing top currency official Masato Kanda declined to confirm whether Japan had intervened, with Suzuki reiterating that foreign exchange levels should be market-determined but rapid fluctuations are undesirable. He added that Japan is particularly concerned about one-sided movements.
Yen's strength was not limited to its rally against Dollar, which was weakened by lower-than-expected US consumer inflation data, reinforcing expectations for a September Fed rate cut. The Japanese currency also surged sharply against both European majors and commodity currencies. The scale and breadth of the Yen's rally suggest possible intervention. However, as Yen stabilized in the Asian session, it appears the move was not broadly followed by market participants. This stabilization might cap Yen's strength for now, or at least until BoJ meeting at the end of the month.
Overall in the markets, New Zealand Dollar is the worst performer for the week, pressured by RBNZ's dovish stance and further weighed down today by data showing sharp deterioration in the manufacturing sector. Swiss Franc and Dollar are tied for the second worst spot. On the other hand, Sterling is the second strongest currency this week, supported by strong UK GDP data, hawkish comments from BoE Chief Economist Huw Pill, and relative political stability in the UK. Australian Dollar and Euro are tied for the third strongest, while Canadian Dollar remains mixed in the middle.
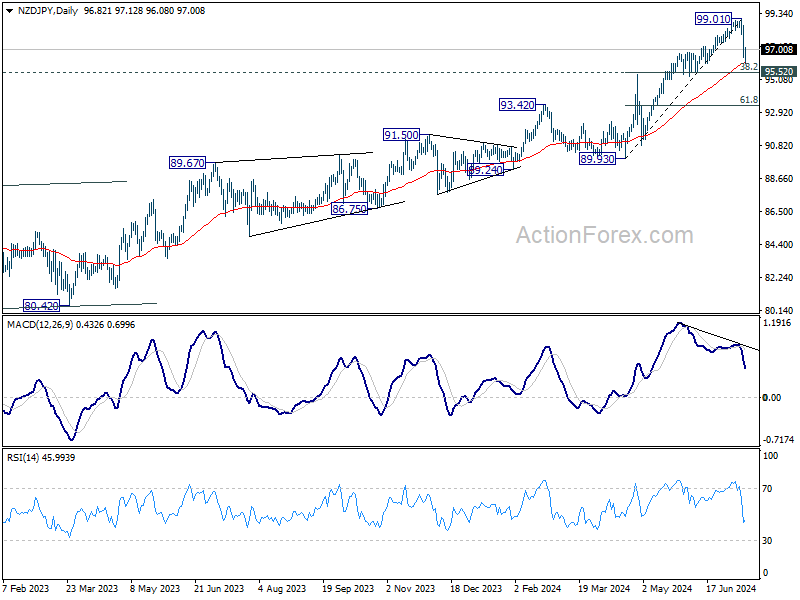
Technically, considering bearish divergence condition in D MACD, as well as the depth of the decline, NZD/JPY should now be corrective the whole rise from 89.93. However, the crosses is now sitting close to a key support level of 55 D EMA (now at 96.14) and 95.52 cluster (38.2% retracement of 89.93 to 99.01 at 95.54). Strong rebound should be seen from this support zone to bring rebound, as set the range for consolidations. Nevertheless, decisive break of 95.52/4 will argue that larger scale correction is already underway.
In Asia, Nikkei fell sharply by -2.45%, possibly affected by Yen's strong bounce. Hong Kong HSI is up 2.47%. China Shanghai SSE is up 0.21%. Singapore Streait Times is up 0.74%. Japan 10-year JGB yield fell -0.0347 to 1.049. Overnight, DOW rose 0.08%. S&P 500 fell -0.88%. NASDAQ fell -1.95%. 10-year yield fell -0.087 to 4.193.
Fed officials optimistic on inflation progress, markets see two rate cuts this year
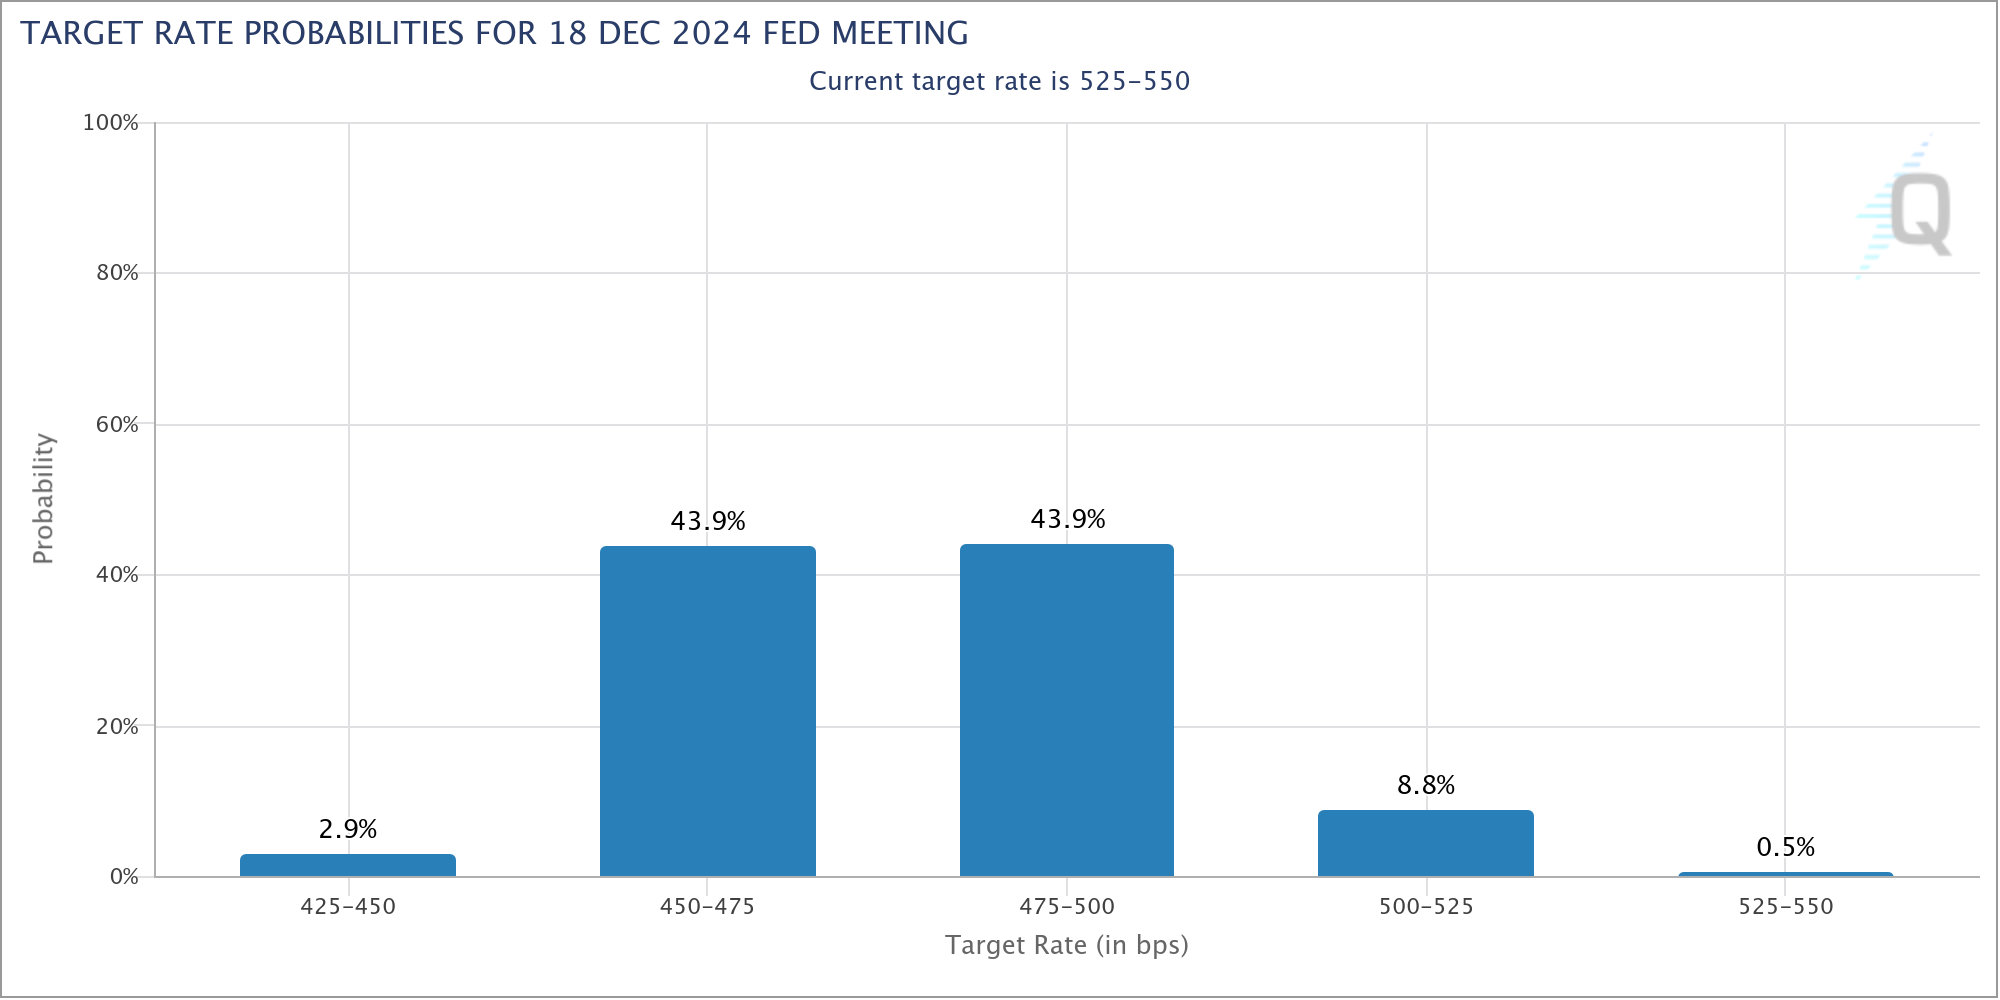
Several Fed officials welcomed the US June CPI data released yesterday, which showed better-than-expected disinflation progress. This has intensified expectations that Fed would start cutting interest rates in September, with Fed fund futures indicating a 93% chance. More importantly, there is now over 90% probability of two rate cuts by the end of the year, lowering rates to 4.75-5.00%.
Chicago Fed President Austan Goolsbee described the latest inflation data as "excellent," noting the significant deceleration in shelter inflation as "profoundly encouraging." He added that "this is what the path to 2% looks like."
St. Louis Fed President Alberto Musalem also saw the June CPI data as "encouraging further progress toward lower inflation." He emphasized the need for greater confidence that inflation will converge to 2% before lowering rates. Musalem noted the importance of seeing a moderation in demand and data that shows inflation converging to 2% by mid to late next year, adding, "we're on a good path."
San Francisco Fed President Mary Daly highlighted the broader economic context, saying, "With the information we have received today, which includes data on employment, inflation, GDP growth, and the outlook for the economy, I see it as likely that some policy adjustments will be warranted." However, she noted that the timing of these adjustments is still uncertain.
New Zealand BNZ manufacturing freefalls to lowest non-lockdown level since 2009
New Zealand BusinessNZ Performance of Manufacturing Index fell sharply from 46.6 to 41.1 in June, well below the long-term average of 52.6 and marking the lowest non-lockdown monthly level since February 2009.
Breaking down the details, production dropped from 44.0 to 35.4, and new orders fell from 43.9 to 38.8. These sub-40 activity levels for production and new orders are the lowest seen outside of COVID lockdowns since November 2008. Employment also declined significantly, from 50.4 to 43.8, its lowest non-COVID monthly result since July 2019. Finished stocks decreased from 52.3 to 47.9, while deliveries remained unchanged at 44.9.
BusinessNZ's Director of Advocacy, Catherine Beard, expressed significant concern over the "freefall in activity from May to June," highlighting the severe challenges facing a sector that has been contracting for the past 15 months. The proportion of negative comments surged to 76.3%, up from 63.5% in May and 69% in April, with respondents highlighting an overall economic slowdown and tough recessionary conditions.
Looking ahead
Canadian building permits will be released in European session. But US PPI and U of Michigan consumer sentiment will catch more attention.
EUR/USD Daily Outlook
Daily Pivots: (S1) 1.0829; (P) 1.0864; (R1) 1.0904; More....
Intraday bias in EUR/USD remains on the upside for retesting 1.0915 resistance. Decisive break there will resume whole rally from 1.0601 and target 100% projection of 1.0601 to 1.0915 from 1.0665 at 1.0919 next. For now, risk will stay on the upside as long as 1.0805 support holds, in case of retreat.
In the bigger picture, price actions from 1.1274 are viewed as a corrective pattern that could still be in progress. Break of 1.0601 will target 1.0447 support and possibly below. On the upside, firm break of 1.0915 resistance will start another rising leg back to 1.1138 resistance instead.
Economic Indicators Update
| GMT | Ccy | Events | Actual | Forecast | Previous | Revised |
|---|---|---|---|---|---|---|
| 22:30 | NZD | Business NZ PMI Jun | 41.1 | 47.2 | 46.6 | |
| 03:00 | CNY | Trade Balance (USD) Jun | 99.1B | 85.1B | 82.6B | |
| 03:00 | CNY | Trade Balance (CNY) Jun | 704B | 590B | 586B | |
| 04:30 | JPY | Industrial Production M/M May F | 3.60% | 2.80% | 2.80% | |
| 12:30 | CAD | Building Permits M/M May | -5.00% | 20.50% | ||
| 12:30 | USD | PPI M/M Jun | 0.10% | -0.20% | ||
| 12:30 | USD | PPI Y/Y Jun | 2.20% | 2.20% | ||
| 12:30 | USD | PPI Core M/M Jun | 0.20% | 0.00% | ||
| 12:30 | USD | PPI Core Y/Y Jun | 2.50% | 2.30% | ||
| 14:00 | USD | Michigan Consumer Sentiment Jul P | 68.5 | 68.2 |
Elliott Wave Favors Further Upside in GBPUSD
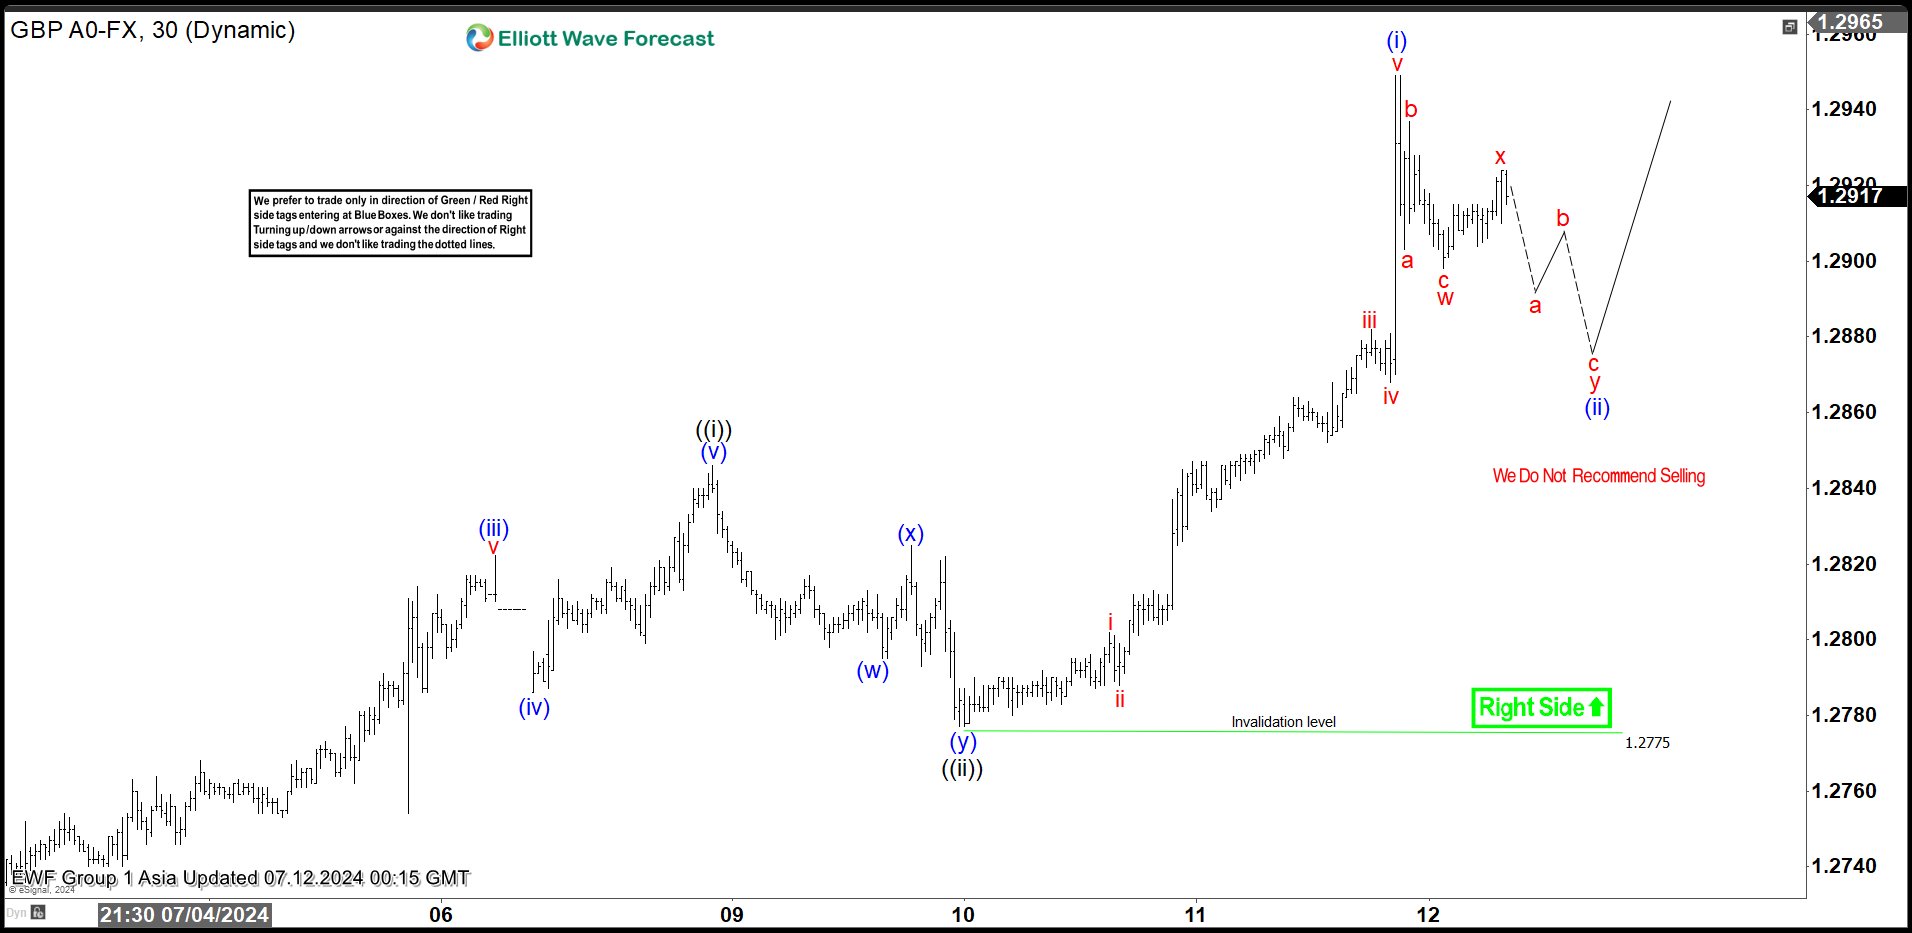
GBPUSD broke above the previous peak on 6.12.2024 which opens up a bullish sequence from 4.22.2024 low. Rally from there is unfolding as a 5 waves impulse Elliott Wave structure where wave 1 ended at 1.286 and pullback in wave 2 ended at 1.261. Wave 3 higher is currently in progress as another impulse in lesser degree as 30 minutes chart below shows. Up from wave 2, wave ((i)) ended at 1.284 and dips in wave ((ii)) ended at 1.277. Internal subdivision of wave ((ii)) unfolded as a double three Elliott Wave structure. Down from wave ((i)), wave (w) ended at 1.2795 and wave (x) ended at 1.2825. Wave (y) lower ended at 1.2775 which completed wave ((ii)) in higher degree.
Pair has resumed higher again in wave ((iii)). Up from wave ((ii)), wave i ended at 1.28 and dips in wave ii ended at 1.2788. Pair extends higher in wave iii towards 1.288 and pullback in wave iv ended at 1.2868. Final leg wave v ended at 1.2949 which completed wave (i) in higher degree. Wave (ii) pullback is now in progress as a double three structure. Down from wave (i), wave w ended at 1.289, and wave (x) ended at 1.292. Expect wave y of (ii) to complete at 1.284 – 1.287 area where support is seen. Near term, as far as pivot at 1.277 low stays intact, expect pullback to find buyers in 3, 7, 11 swing for further upside.
GBPUSD 30 Minutes Elliott Wave Chart
GBPUSD Elliott Wave Video
https://www.youtube.com/watch?v=4724O8biJjc
New Zealand BNZ manufacturing freefalls to lowest non-lockdown level since 2009
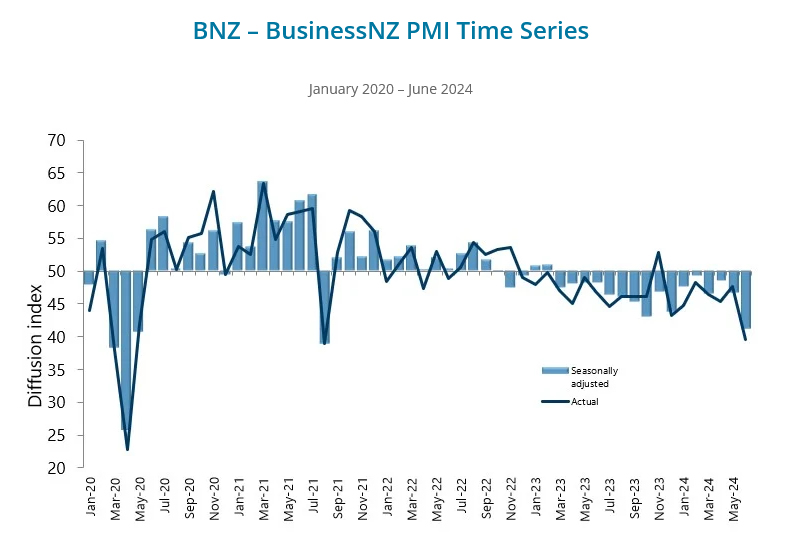
New Zealand BusinessNZ Performance of Manufacturing Index fell sharply from 46.6 to 41.1 in June, well below the long-term average of 52.6 and marking the lowest non-lockdown monthly level since February 2009.
Breaking down the details, production dropped from 44.0 to 35.4, and new orders fell from 43.9 to 38.8. These sub-40 activity levels for production and new orders are the lowest seen outside of COVID lockdowns since November 2008. Employment also declined significantly, from 50.4 to 43.8, its lowest non-COVID monthly result since July 2019. Finished stocks decreased from 52.3 to 47.9, while deliveries remained unchanged at 44.9.
BusinessNZ's Director of Advocacy, Catherine Beard, expressed significant concern over the "freefall in activity from May to June," highlighting the severe challenges facing a sector that has been contracting for the past 15 months. The proportion of negative comments surged to 76.3%, up from 63.5% in May and 69% in April, with respondents highlighting an overall economic slowdown and tough recessionary conditions.
Fed officials optimistic on inflation progress, markets see two rate cuts this year
Several Federal Reserve officials welcomed the US June CPI data released yesterday, which showed better-than-expected disinflation progress. This has intensified expectations that Fed would start cutting interest rates in September, with Fed fund futures indicating a 93% chance. More importantly, there is now over 90% probability of two rate cuts by the end of the year, lowering rates to 4.75-5.00%.
Chicago Fed President Austan Goolsbee described the latest inflation data as "excellent," noting the significant deceleration in shelter inflation as "profoundly encouraging." He added that "this is what the path to 2% looks like."
St. Louis Fed President Alberto Musalem also saw the June CPI data as "encouraging further progress toward lower inflation." He emphasized the need for greater confidence that inflation will converge to 2% before lowering rates. Musalem noted the importance of seeing a moderation in demand and data that shows inflation converging to 2% by mid to late next year, adding, "we're on a good path."
San Francisco Fed President Mary Daly highlighted the broader economic context, saying, "With the information we have received today, which includes data on employment, inflation, GDP growth, and the outlook for the economy, I see it as likely that some policy adjustments will be warranted." However, she noted that the timing of these adjustments is still uncertain.
What Would RBNZ Need to See to Start Cutting?
- Surprisingly, the RBNZ's July OCR Review was markedly less hawkish than the May Statement.
- The RBNZ's growth forecasts seem to have been significantly downgraded from their May view.
- The RBNZ crucially seems more confident that annual inflation will be below 3% quite soon, giving them more latitude to reduce policy restriction.
- The recent QSBO survey likely crystalised the downside risks to the growth and inflation outlooks that were evident in other high frequency indicators.
- The RBNZ's abrupt change in messaging at the July Review suggests a non-trivial risk of policy easing before long.
- Our central expectation remains that the RBNZ will begin easing policy in February next year. But an earlier move is very feasible and will be data dependent.
- We set out here what we think the RBNZ would likely need to see in the upcoming data to begin easing sooner than February.
What caused the marked change in the RBNZ's tone in the July OCR Review?
Like most commentators and financial market participants, we were very surprised by the marked change in tone in this week's July OCR Review. The economy has looked to be steadily weakening relative to the RBNZ's May Statement view. Hence, we expected the RBNZ would soon begin to moderate the very hawkish tone conveyed in the May Statement. But we didn't expect as large a shift so soon given in May the RBNZ seemed particularly hawkish and had pushed out the timing of the first policy easing until August 2025. We thought it more likely the RBNZ's view would begin to evolve in the August Statement and converge towards our own longstanding view that easing could begin early in 2025.
But the July OCR Review message was much less hawkish than that. We discussed the main features of the July OCR Review in our review. In summary, the commentary in the press statement and record of meeting pointed to a more optimistic outlook for inflation this year and a less optimistic outlook for activity, with the latter now said to be "declining" based on high-frequency indicators. And most jarring of all was the final paragraph of the press statement: "The Committee agreed that monetary policy will need to remain restrictive. The extent of this restraint will be tempered over time consistent with the expected decline in inflation pressures" (our emphasis in italics). This latter discussing of future policy easing was not expected at this review and was surprising as the RBNZ likely understood markets would amplify the point and push even harder for a much earlier move in the OCR.
So, what has led to such an abrupt change in the RBNZ's tone? We think that the RBNZ has been sufficiently shaken by the flow of data and business commentary since the May meeting to move totally away from their previous tightening bias.
The path for activity has been reassessed.
We suspect the latest QSBO business survey was key as it echoed earlier indications from the ANZ Business Outlook survey and from the BusinessNZ PMIs. Collectively these surveys suggest that GDP likely contracted in the June quarter, in contrast with the RBNZ's forecast of modest growth, with little indication of a pick-up in the second half of the year.
The QSBO also pointed to a further easing of pressures in the labour market and associated indicators of productive capacity. This confirmed the reading from our own Employment Confidence Survey and an emerging downtrend in filled jobs, as measured by the Monthly Employment Indicator and the even more timely weekly filled jobs data (taken from tax data).
Inflation looks more likely to be below 3% in 2024.
Importantly, the QSBO also confirmed the significant step lower in firms' pricing intentions that had been reported in the May and June editions of the ANZ Business Outlook survey. These now suggest inflation will soon return to the inflation target range. This data, combined with the latest monthly CPI indicators, has likely been the key driver of the RBNZ's increased confidence that headline inflation will return to within the target range "in the second half of this year" (in May the RBNZ forecast inflation below 3% "by the end of 2024").
The return of inflation to the 1-3% target range would be an important milestone for the RBNZ. The RBNZ's relatively hawkish stance since late 2023 has been entirely driven by concerns that inflation would take too long to adjust lower. It seems that the RBNZ's optimism has significantly increased which is giving them room to shift strategy towards considering easing.
Why did the RBNZ make this change in July, and not wait until August?
The abrupt shift in tone at the July Review raises significant questions about the RBNZ's current view of the OCR profile and the likely timing of the first policy easing. It's almost certain that the RBNZ's OCR profile is much flatter and shows earlier easing than before. The key question is how large their adjustment is relative to the 60% chance of a further 25 bp hike in interest rates and an initial easing at the August 2025 Statement that was previously forecast.
We suspect their adjustment is relatively large as otherwise we doubt that the RBNZ would have felt the need to make such a significant change to its policy stance this week, especially with important inflation and labour market data looming.
Referring to the RBNZ's past forecasts of the OCR through 2024 and 2025 could help provide a benchmark for how large the reassessment might be. With the May Statement view being stale, some potential options to consider are the RBNZ's forecasts back in February 2024 (when they expressed a relatively dovish view compared to market expectations) and May 2023 (when the RBNZ thought the tightening cycle was over and the next move in the OCR would likely be lower). The chart below summarizes the RBNZ's past OCR forecasts.
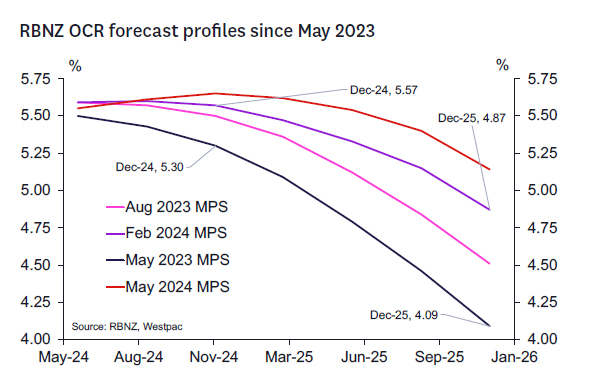
These benchmarks might provide a range within the RBNZ could be sitting now while awaiting the key CPI and labour market data ahead. A move back to their February view (removing the May hawkish sojourn) would imply easing around February 2025 (Westpac's current forecast). Total easing through 2025 would add up to around 50- 75 points.
A move back to May 2023 could provide a relatively dovish alternative. The overall inflation forecasts are not much different (perhaps a tad higher) than what we face today (although the markedly higher non-tradables profile would suggest caution in extrapolating the expected fall in inflation too far ahead). That scenario showed a chance of an easing in October 2024 and a likely easing in November 2024.
The decision to change course in the July Review likely means that the RBNZ now sees some possibility that incoming data could make a compelling case for policy easing before the end of this year. That would be consistent with the RBNZ lying somewhere within the range of where it has been in May 2023 and February 2024.
The RBNZ is almost certainly giving some weight to the possibility that near-term growth outlook could be considerably weaker than forecast in May, with significant downside consequences for the medium-term inflation outlook. Hence the RBNZ probably felt it needed to begin moving away from its very hawkish May view sooner rather than later. This would allow for a less jarring change of tone in the August or October policy reviews should downside risks continue to build.
Its likely the RBNZ's forward estimates of the output gap will be revised lower from the relatively high-water mark reached in May. The May 2023 output gap profile marked the low tide mark in the chart below and could be consistent with a mark down in GDP of 0.5-1.0% range through the balance of 2024 (and perhaps a 0.25-0.5% increase in forecasts of the unemployment rate).
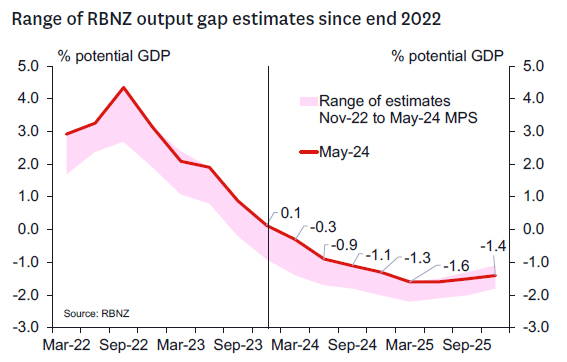
But we doubt that the changes in the risks in the activity outlook alone would have justified such a dovish tilt. The RBNZ's growth forecasts had already been marked down a lot in May and were not especially optimistic. Rather it's the additional confidence they seem to have on the inflation outlook – and particularly the near-term inflation profile – that seems particularly prominent. The weaker growth expectations help increase confidence that medium term inflation will move towards 2% - which likely remains a core goal of the RBNZ. But its that confidence that inflation will nudge below 3% relatively soon that will be giving them the confidence to move earlier. And it probably explains why the RBNZ's language focuses on "tempering" restriction as opposed to pumping the accelerator to boost growth. This latter point is likely important in understanding the pace and extent of the easing profile once started.
What scenarios could see the RBNZ tempering restriction in the next 6 months?
Here we discuss some more specific data hurdles we think need to be crossed to begin reducing restriction, recognizing that there are also other key indicators (both domestic and abroad) that will impinge on the assessment of the domestic policy outlook:
- For easing to begin in August, we would likely need to have seen the following:
- A significant broad-based downside surprise in the Q2 CPI on 17 July (WBC forecast 0.6% qoq/3.5% yoy). The surprise would need to be sufficient to give confidence that future quarterly CPI outcomes will soon sit close to historic norms. This implies a need to see significant downside surprise in the non-tradables component of the CPI (WBC forecast 0.8% qoq/5.3% yoy) that is itself broad-based and consistent with excess capacity flowing through to lower core inflation pressures; and
- A significant upside surprise (perhaps close to 5%) in the unemployment rate in the Q2 labour market data on 7 August (WBC forecast 4.6%), and clear signs that wage inflation is dissipating more quickly than expected (WBC forecast 3.5% annual total private sector LCI); and
- Further evidence that Q2/Q3 GDP growth is significantly weaker than current forecasts (WBC -0.2 qoq perhaps with some downside risks).
- A first easing to occur at the October meeting, would likely require:
- The RBNZ to have foreshadowed some probability of an October easing at the August Statement and a much larger probability of a November easing; and
- A moderate downside surprise in the Q2 CPI on 17 July, including the non-tradables component. This should be sufficient to suggest some additional and ongoing progress in reduced core inflation pressures; and
- A significant upside surprise in the unemployment rate in the Q2 labour market data on 7 August, and clear signs that wage inflation is dissipating more quickly than had been expected; and
- Confirmation of a marked decline in activity in the Q2 GDP report on 20 September (WBC forecast -0.2 qoq – perhaps with downside risks); and
- More evidence of weak activity, expanding spare capacity and easing inflation indicators in the Q3 QSBO on 1 October; and
- Signs that tax cuts in late July aren't significantly increasing economic momentum or reducing excess capacity unduly.
- For a first easing to occur at the November meeting, we would likely need to have seen the following:
- Sufficient broad-based weakness in the Q2 and Q3 CPIs (17 July and 17 October), including in the non-tradables component of the CPI that suggest that inflation is clearly on track to move close to the midpoint of the target in 2025 (WBC Q3 forecasts 1.1% qoq total/1.4% qoq non-tradables); and
- A moderate upside surprise in the unemployment rate in the Q2 and Q3 labour market data on 7 August and 6 November respectively (WBC Q3 forecast 4.9%), and signs that wage inflation is dissipating more quickly than had been expected; and
- Confirmation of a decline in activity in the Q2 GDP report on 20 September; and More evidence of weak activity, expanding spare capacity and easing inflation indicators in the Q3 QSBO on 1 October; and
- Signs that tax cuts in late July were not leading to a greater lift in household spending than the RBNZ had expected.
- For the first easing to occur at the February 2025 meeting, we would expect to see something like our current Economic Overview outlook to evolve with a focus on the inflation outlook in particular.
The Two Wolves of Monetary Policy
The ‘two wolves’ inside monetary policy are demand shocks and supply shocks. It is important to know which is which.
There is a story in Native American folklore that inside each of us are two wolves, one evil, one good. The one that wins – the one you become – goes the saying, is the one you feed.
So too for monetary policy. In that case, though, the two wolves are demand shocks and supply shocks. The demand shocks are well known and well understood. Policymakers know how to respond to these. When demand is strong, tighten policy to keep inflation in check. When it is weak, ease policy to support demand.
In contrast, supply shocks create a trade-off between keeping inflation at target and stabilising output or employment. It is an easy trade-off to stomach when the supply shocks are benign and inflation is showing a tendency to undershoot your target. Adverse supply shocks are less comfortable, with higher prices and lower output.
We can see this conflict of narratives in the Reserve Bank’s own analysis of the economy, as well as in some of the discourse from other quarters. Some observers frame the situation as demand-driven. They focus on fiscal and monetary support during the pandemic and argue that this has resulted in an economy where demand is simply too strong for the economy’s supply capacity to meet it. No wonder we see repeated stories worrying about every extra dollar going into households’ pockets, afraid that this will boost inflation. Perhaps this is right, but there are a lot of assumptions going into that argument.
A demand-led narrative is also more comfortable for the economics profession. Most of the models we learned at university primarily capture demand-side relationships. Supply capacity is usually treated as given or driven by unpredictable (and transitory) ‘productivity shocks’.
Don’t assume, test
We should grant that advanced economy governments and central banks provided massive stimulus during the peak of the pandemic. In Australia and a handful of other economies, fiscal support managed to overfill the income hole created by lockdowns – an understandable outcome given the many uncertainties at the time. We should recognise the possibility that some of the resulting strength in demand might not have unwound fully. But we should test this proposition, not assume it.
Recognising and understanding the supply shocks – much like making the virtuous choices involved in feeding the good wolf – can be hard. Hitting the strong demand ‘nail’ with the policy hammer is so much more straightforward. Even when supply shocks are recognised, it is sometimes assumed that the response still needs to be to hammer down demand to fit supply. We see some flavour of this view in the June 2024 RBA Minutes, which said, ‘The case to raise the cash rate could be further strengthened if members judged that aggregate supply was likely to be more constrained than had been assumed.’
Again, there are some unstated assumptions here: that the supply constraint is persistent, or fading so slowly that demand-based policy still needs to respond to keep inflation in check. It would be a mistake to assume that a particular supply constraint lasts forever; better to understand what is driving it before reaching that conclusion.
Curves, shifts and other fruit
We must bear a few things in mind when assessing whether something is a supply constraint and how it might play out.
Firstly, and as we have said before, simultaneous increases in prices and volumes for some goods and services are not necessarily evidence of strong overall demand. We could be dealing with an ‘other fruit’ problem, where supply shocks affecting some goods and services displace demand elsewhere.
Another thing to be aware of is that some economic relationships are nonlinear and others can shift. The RBA knows this: it has long recognised that the Phillips Curve is indeed a curve, not a straight line. It has also, commendably, recognised that the unemployment rate consistent with the full employment concept in its mandate can shift.
There are other labour market phenomena that we should recognise are nonlinear, or shifting, or some combination of the two. As discussed in a recent note, Fed Governor Waller and others at the Federal Reserve have argued that theory would suggest that when job vacancies are high enough, they can fall back to more usual levels without unemployment rising much. The relationship between the two variables is nonlinear.
Subsequent events, including in other countries, have supported Waller’s thesis. For some countries, like the Netherlands, the high vacancy rate was in line with the normal nonlinear relationship, and it could reverse without unemployment rising by much. For others, like the United States, United Kingdom – and possibly Australia – there was a bit more going on. But that ‘bit more’ was a pandemic-related shock to labour supply. As the shock faded and participation recovered, the historical relationship re-asserted itself.
There is a deeper question about why labour supply took a long time to come back in those countries, but not others, even after social distancing restrictions were removed. Indeed, in the United Kingdom it is going in the wrong direction again. In Australia, at least, the constraint was more about the borders than about participation. This means that we can reasonably conclude that this supply shock, to the extent it was relevant, has been fading of its own accord.
Of course, there might still be other supply constraints at play in Australia. Some supply shocks might persist, while others unwind without help from monetary policy. However, policymakers might not recognise that the shock will not persist. And even if they do, policymakers might still conclude – rightly or wrongly – that demand needs to be reduced to meet it.
It would be good to know what the RBA is assuming about supply constraints, their causes, and their likely persistence. Newish Deputy Governor Hauser mentioned the need to do more work on supply issues during the Q&A to his recent speech. Hopefully the post-Review changes will direct more resources into such activity than was previously available.
Which wolf should we feed? More importantly, which wolf is the RBA feeding?
USD/JPY Plummets After US CPI Release: Is BOJ Stepping In?
Key Highlights
- USD/JPY dived over 250 pips from the 161.80 resistance zone.
- It traded below a key bullish trend line with support at 160.90 on the 4-hour chart.
- The US CPI slowed more than expected and came in at 3% in June 2024 (YoY).
- There were speculations of BOJ’s intervention after USD/JPY declined over 2%.
USD/JPY Technical Analysis
The US Dollar failed to extend gains above 162.00 against the Japanese Yen. USD/JPY started a sharp decline and traded below the 160.00 level after the US CPI report.
Looking at the 4-hour chart, the pair declined heavily below a key bullish trend line with support at 160.90. The pair even settled below the 160.00 level and the 100 simple moving average (red, 4-hour). Finally, there was a spike below the 158.50 support and the 200 simple moving average (green, 4-hour).
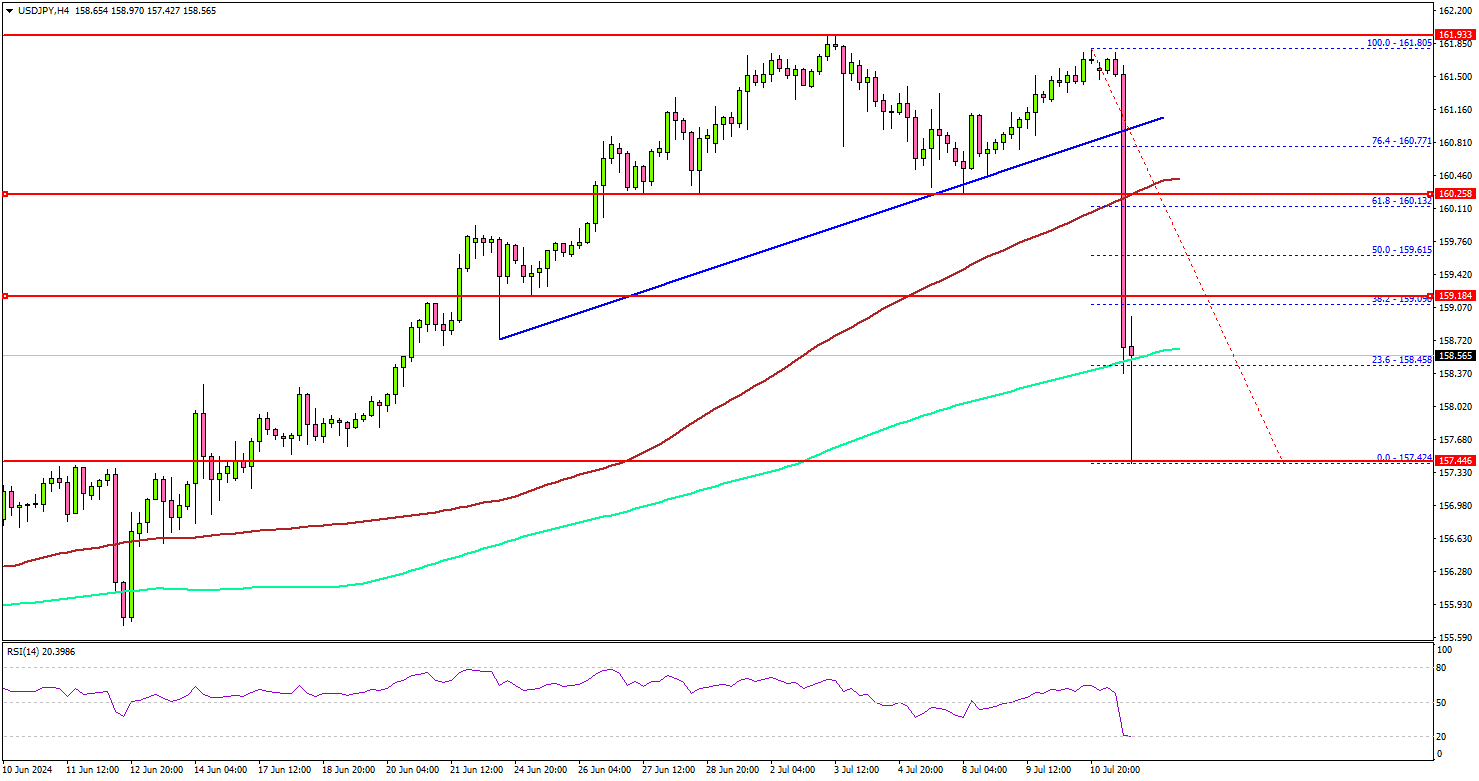
It tested the 157.50 support before the bulls appeared. If there is a recovery wave, the pair could face resistance near the 159.20 level. The next resistance sits at 159.60.
The main hurdle sits at 160.00 and the 100 simple moving average (red, 4-hour). A clear move above the 160.00 resistance might send it toward the 160.80 level. Any more gains might open the doors for a test of the 161.80 zone in the coming days.
Immediate support is near the 157.50 level. The next major support is near the 156.20 level. A downside break and close below the 156.20 support zone could open the doors for more losses.
Looking at Gold, the price gained bullish momentum after the US CPI release and rallied above the $2,400 level.
Economic Releases
- US Producer Price Index for June 2024 (MoM) – Forecast +0.1%, versus -0.2% previous.
- US Producer Price Index for June 2024 (YoY) – Forecast +2.3%, versus +2.2% previous.