Sample Category Title
Cliff Notes: Assurance Over Inflation a Matter of Time
Key insights from the week that was.
In Australia, the Minutes from the RBA June Meeting provided more colour around the Board’s deliberations, in particular its considerations for monetary policy in the context of lingering inflation pressures. The case for another rate hike was premised largely on the RBA’s assessment that demand had continued to outstrip supply and that this imbalance could continue –the former could hold up better than expected, or the latter could be more constrained than currently assumed – increasing the possibility that inflation will take longer to sustainably return to target. The case for leaving policy unchanged was deemed stronger, the Board of the view that “the economy was still broadly tracking on a path consistent with returning inflation to target in 2026, while preserving as many of the gains in employment as possible.”
Chief Economist Luci Ellis highlighted that it is the ‘gaps’ between demand and supply, whether that be in the labour market or the broader economy, that are receiving a greater focus in the Board’s policy deliberations. Here, it is noted that both labour market tightness and the output gap are assessed as narrowing, but given the difficulty in precisely estimating such dynamics, there remains uncertainty in judging when the ‘gaps’ might actually close. For now, the Board expects inflation to continue decelerating towards target as demand and supply come into better balance, but it needs more confidence in this view before debating the timing and scale of easing. Last week’s partial inflation data may have unnerved market participants but it had no impact on our inflation forecasts nor our view on the interest rate outlook. We continue to believe the Board will have this confidence by November, allowing the RBA to embark on a measured rate cutting cycle, 25bps per quarter to 3.10% in Q4 2025.
Other data received this week were largely focused on the consumer and housing. On the former, retail sales beat expectations, rising 0.6% (1.7%yr). However, most of the strength can largely be attributed to inflation and population growth, with real per capita sales likely tracking in the realm –2.5% to –3.0%. Meanwhile, growth in dwelling prices continues to forge ahead at a solid pace, up 0.7% across the nation’s eight major capital cities. While the latest increase in dwelling approvals was certainly welcome, the outlook for new dwelling investment remains fragile, at odds with needs of a rapidly growing economy.
Offshore, the focus was on the US with the June ISM PMIs. The ISM non-manufacturing index fell 5pts in June from 53.8 to 48.8. This is the second sub-50 reading in three months, but more importantly the June read is almost 7.5pts below the decade average. The employment index also fell back to April's weak level (6pts below average) after rebounding in May. Business activity and new orders also dropped sharply in June. The level of these sub-components speak to the risk of outright contraction against our base expectation of modest growth, warranting close monitoring ahead. The ISM manufacturing survey edged lower from 48.7 to 48.5 against expectations for a modest lift to 49.1. Production deteriorated, from 50.2 to 48.5, but new orders gained in the month, from 45.4 to 49.3. Both sub-indexes are below their respective six-month averages, signalling a continuation of the sector's deceleration. At 49.3, the employment sub-index was again consistent with outright job loss. Prices paid fell back to 52.1 in the month, below both the six-month and long-run historic averages.
The FOMC also released its minutes for the June meeting which were consistent with the Committee's positive forecasts for the economy. Policy is viewed as restrictive and as working toward bringing about desired inflation outcomes in time. That said, there were some notes of caution over momentum in the labour market, in particular "several" participants noted that nonfarm payrolls may be overstating job creation. Anecdotes on the labour market and consumer behaviour were also used to justify the view that both wage inflation and consumer inflation is continuing to decelerate. That said, “some” participants were willing to raise rates should inflation remain elevated. That raising rates was not considered and inflation looks to be on its downward trajectory suggests this scenario remains improbable. Despite the shift to only one cut this year in its published forecasts, the Committee looks to be ready to begin easing as incoming data give confidence in inflation's downtrend and/or should downside risks materialise. We maintain our view that rate cuts will begin in September 2024. For more detail, see our latest edition of Market Outlook, published earlier today on WestpacIQ.
The June JOLTS survey provided further evidence of labour demand and supply coming into balance. The job opening count was a touch higher than the market expected at 8.14mn, but the job opening rate was little changed from May and within 0.5% of the pre-pandemic level. The hiring, separation and quit rates were also all near their pre-pandemic averages.
In Europe, the European Central Bank held its annual conference in Sintra, the key event being a panel with ECB President Lagarde, FOMC Chair Powell and Bank of Brazil's Campos Neto. Lagarde and Powell's remarks were both constructive on inflation and the health of their respective economies. Powell in particular noted that the US is back on a "disinflationary path", but that further confidence is necessary amongst Committee members before acting. Powell also made clear that the risks the US faces are increasingly balanced, with downside risks to the labour market coming into view.
Euro Area inflation was as expected in June, prices rising 0.2% in the month and 2.5% over the year. Core inflation was a touch stronger than consensus at 2.9%yr as services inflation held around 4%yr, a rate held since the start of this year. Overall, this flash release indicates goods remain the predominant disinflationary force and further progress on services will be needed for inflation to remain sustainably at target. The unemployment rate remained at 6.4% in May. Labour market conditions are heterogenous across the region with services-oriented industries seeing labour market tightness persist while others see slack building.
In Asia, the Bank of Japan's Q2 Tankan Survey reflected a constructive outlook with some risks emerging on the horizon. The outlook on general prices remains little-changed around 2.0% for the 3-year and 5-year horizons, suggesting inflation expectations are holding firm. Forecasts for employment conditions declined further, suggesting businesses are expecting it to be difficult to secure labour ahead. Persistent sentiment around labour scarcity will support wage negotiations ahead. Expectations for investment continue to grow – at present they sit around where they were prior to the Asian Financial Crisis when capacity was expanding rapidly. Profits however are expected to decline. This creates risk to both the investment and wages outlook as strong profitability has supported both over the last year. Wages and investment need to remain strong for inflation to persist and for policy to normalise further.
GBP/USD Daily Outlook
Daily Pivots: (S1) 1.2744; (P) 1.2756; (R1) 1.2772; More...
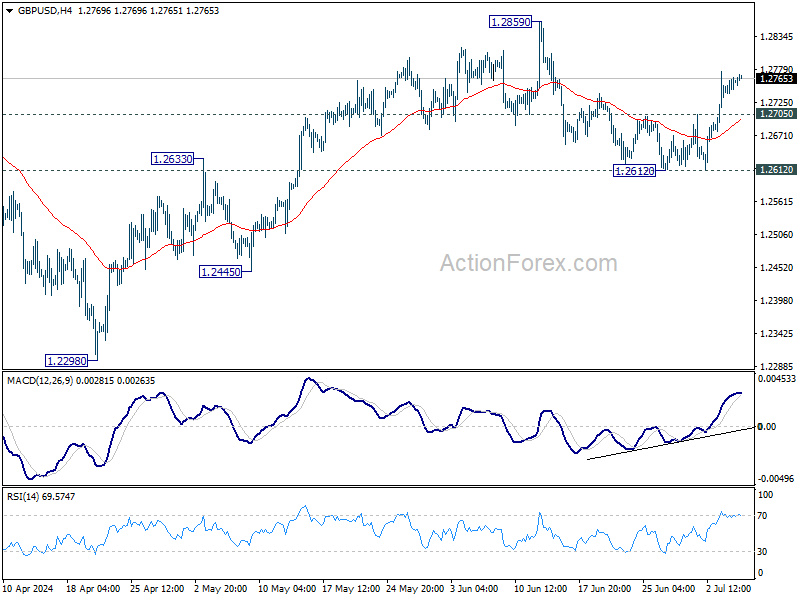
GBP/USD's rebound from 1.2612 is still in progress and intraday bias stays on the upside. Correction from 1.2859 should completed at 1.2612. Firm break of 1.2859 will resume rally from 1.2298. On the downside, though, below 1.2705 will dampen the immediate bullish case, and turn intraday bias neutral again first.
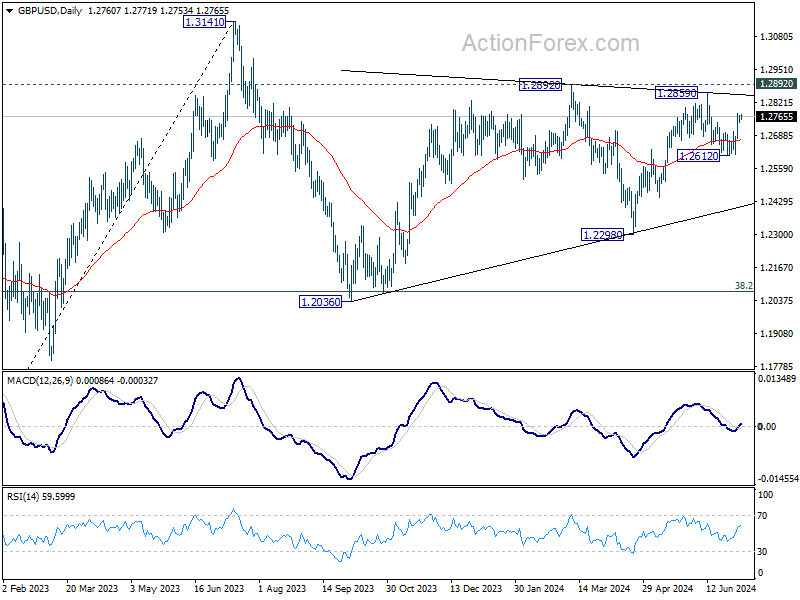
In the bigger picture, price actions from 1.3141 medium term top are seen as a corrective pattern that is still in progress. Break of 1.2445 support will confirm that another falling leg has started and target 1.2036 cluster support again (38.2% retracement of 1.0351 (2022 low) to 1.3141 at 1.2075. Nevertheless, break of 1.2892 resistance will argue that larger up trend from 1.0351 is ready to resume through 1.3141.
Dollar Under Pressure Ahead of NFP Data; Sterling Strengthens with Labour Victory
Dollar's broad-based decline continues in Asian session today as market attention shifts to the highly anticipated US Non-Farm Payroll data. Traders are eager to see a weak report on job and wage growth to reinforce the expectation that the Fed will initiate a rate cut in September. If these expectations are met, we could see a boost in risk sentiment, particularly with S&P 500 and NASDAQ extending their record highs. This risk-on sentiment could subsequently weaken Dollar further.
Sterling is holding strong following a decisive victory for the UK Labour Party in the general elections, securing a substantial majority. As of now, with many results yet to be announced from Thursday's vote, Labour has already won more than 326 of the 650 seats in parliament, with exit polls suggesting it could capture around 410 seats. Conversely, the Conservative Party faces its worst result in history, securing only 136 MPs.
On the politics front, focus would then shifts to France, where the parliamentary election run-off is scheduled for Sunday. Recent polls suggest that the far-right National Rally party is poised to win more seats than any other party, but will likely fall short of the 289-seat threshold required for an absolute majority. The strategy of the "republican front," where candidates from various political parties withdraw to support those best positioned to defeat the National Rally, seems to be effective.
For the week, Sterling, Euro, and Aussie are tied as the top performers, while Dollar is now the weakest, followed by Swiss Franc and Yen. Loonie and Kiwi remain in the middle positions.
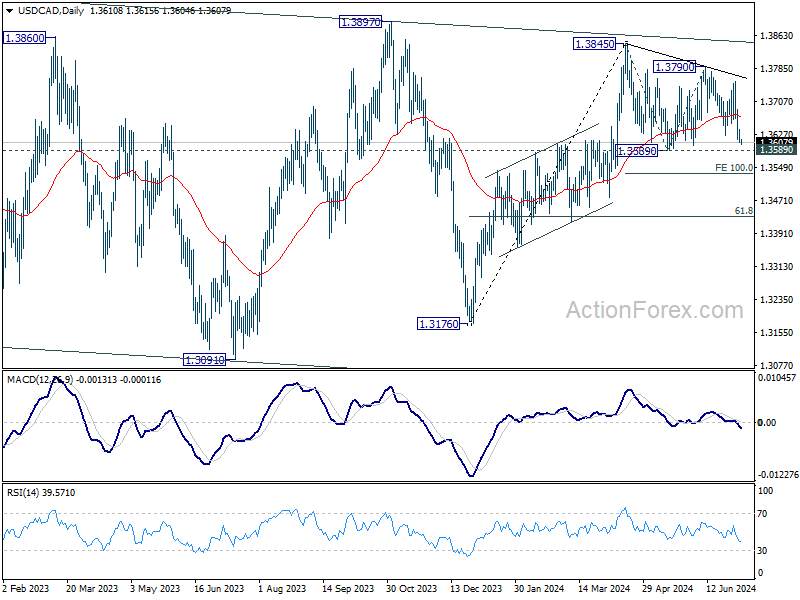
Technically, USD/CAD is a key pair to watch with employment data from both the US and Canada on the horizon. The current trend suggests that the decline from 1.3845 is likely to continue through the 1.3589 support level. Break below this level would target the 100% projection of 1.3845 to 1.3589 from 1.3790 at 1.3534. If this decline is merely a correction, strong support should emerge around 1.3534, leading to a notable rebound.
In Asia, at the time of writing, Nikkei is down -0.15%. Hong Kong HSI is down -1.00%. China Shanghai SSE is down -0.99%. Singapore Strait Times is down -0.73%. Japan 10-year JGB yield is down -0.0040 at 1.079.
US NFP to shape Fed's Sep rate cut odds
Markets focuses are on US Non-Farm Payroll report, a critical data release that could significantly influence market sentiment and monetary policy expectations. Dollar has been under selling pressure this week, driven by a series of disappointing economic data, particularly from ISM services. These developments have heightened expectations that Fed will begin cutting interest rates in September. Current fed funds futures suggest a nearly 73% probability of this outcome.
For June, markets are anticipating a headline job growth figure of 180k. Unemployment rate is expected to remain steady at 4.0%, while average hourly earnings are projected to increase by 0.3% mom. Recent economic indicators have painted a mixed picture: ISM Services Employment declined to 46.1 from 47.1, and ISM Manufacturing Employment fell to 49.3 from 51.1. ADP Employment report showed an addition of 150k net new jobs, and 4-week moving average of initial unemployment claims rose to 239,000, up from 222,000 last month, marking the highest level in ten months.
US stock markets have been responding to weak economic data with a "bad news is good news" attitude recently, where disappointing data increases the likelihood of an earlier rate cut by Fed. This sentiment is expected to persist with today's NFP report. Market reactions could be pronounced, especially if unemployment rate rises or earnings growth falls short of expectations.
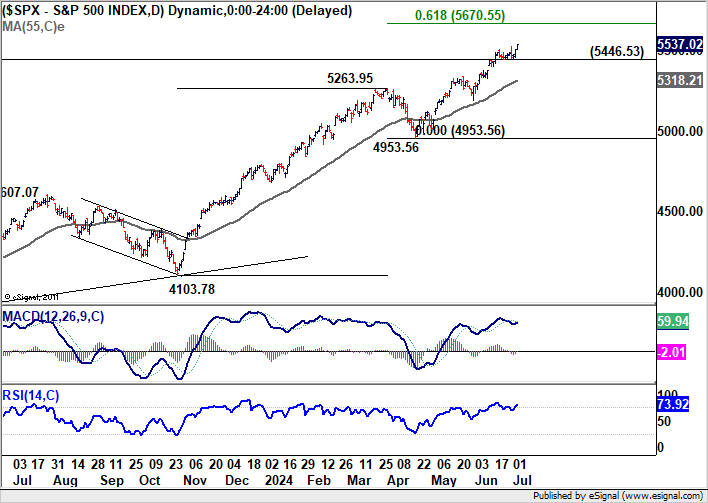
S&P 500 has been on a record-breaking run, and weaker-than-expected NFP report could further extend this rally. Current up trend is in progress for 61.8% projection of 4103.78 to 5263.95 from 4953.56 at 5670.55. Nevertheless, break of 5446.53 support will bring consolidations first, before extending the up trend at a later stage.
ECB's Lagarde: Vigilance needed as inflation fight continues
ECB President Christine Lagarde emphasized the importance of remaining vigilant in the fight against inflation in an interview with Portuguese TV RTP overnight. She underscored the necessity of being confident that inflation is on a continuous downward trend, supported by data on wages, profits, and economic activity.
"We have to remain vigilant and we have to be confident that inflation is continuously down and that the data that we receive on wages, on profit, on activity, reinforce our confidence that we are on a path to win the fight," Lagarde stated.
Lagarde highlighted the importance of comprehensive data to guide monetary policy decisions, noting, "We need a lot of data — I'm not sure that we are getting those data at every single monetary-policy Governing Council meeting that we have." She acknowledged that, in theory, policy adjustments could be made at any meeting, but emphasized that such decisions would require a robust set of data.
Looking ahead
Germany industrial production, France industrial production and trade balance, Swiss foreign currency reserves and SECO consumer climate, and Eurozone retail sales will be released in European session. Later in the day, US non-farm payrolls will take center stage while Canada will also publish job data and Ivey PMI.
GBP/USD Daily Outlook
Daily Pivots: (S1) 1.2744; (P) 1.2756; (R1) 1.2772; More...
GBP/USD's rebound from 1.2612 is still in progress and intraday bias stays on the upside. Correction from 1.2859 should completed at 1.2612. Firm break of 1.2859 will resume rally from 1.2298. On the downside, though, below 1.2705 will dampen the immediate bullish case, and turn intraday bias neutral again first.
In the bigger picture, price actions from 1.3141 medium term top are seen as a corrective pattern that is still in progress. Break of 1.2445 support will confirm that another falling leg has started and target 1.2036 cluster support again (38.2% retracement of 1.0351 (2022 low) to 1.3141 at 1.2075. Nevertheless, break of 1.2892 resistance will argue that larger up trend from 1.0351 is ready to resume through 1.3141.
Economic Indicators Update
| GMT | Ccy | Events | Actual | Forecast | Previous | Revised |
|---|---|---|---|---|---|---|
| 23:30 | JPY | Household Spending Y/Y May | -1.80% | 0.20% | 0.50% | |
| 05:00 | JPY | Leading Economic Index May P | 111.1 | 111.1 | 110.9 | |
| 06:00 | EUR | Germany Industrial Production M/M May | 0.20% | -0.10% | ||
| 06:45 | EUR | France Trade Balance (EUR) May | -7.2B | -7.6B | ||
| 06:45 | EUR | Industrial Output M/M May | -0.20% | 0.50% | ||
| 07:00 | CHF | Foreign Currency Reserves (CHF) Jun | 718B | |||
| 08:00 | EUR | Italy Retail Sales M/M May | 0.20% | -0.10% | ||
| 09:00 | EUR | Eurozone Retail Sales M/M May | 0.20% | -0.50% | ||
| 12:30 | USD | Nonfarm Payrolls Jun | 180K | 272K | ||
| 12:30 | USD | Unemployment Rate Jun | 4.00% | 4.00% | ||
| 12:30 | USD | Average Hourly Earnings M/M Jun | 0.30% | 0.40% | ||
| 12:30 | CAD | Net Change in Employment Jun | 25.0K | 26.7K | ||
| 12:30 | CAD | Unemployment Rate Jun | 6.30% | 6.20% | ||
| 14:00 | CAD | Ivey PMI Jun | 53 | 52 |
Elliott Wave Expects EURUSD to Turn Higher
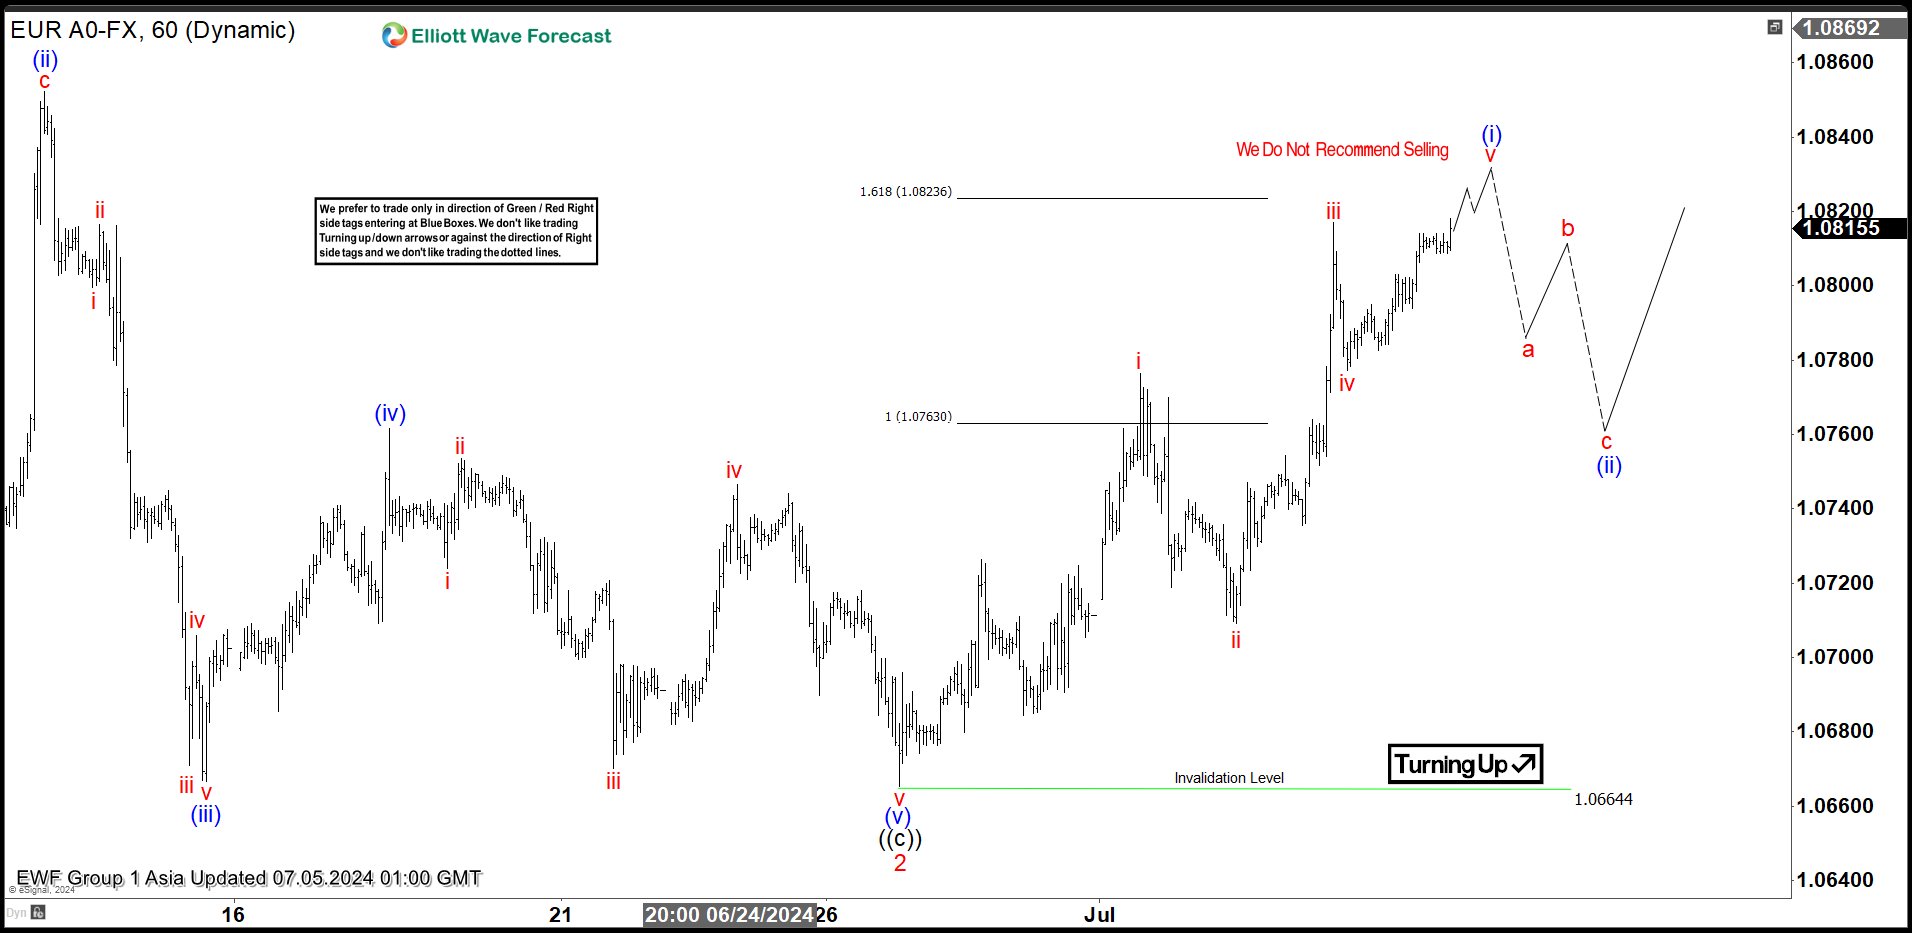
Short Term Elliott Wave in EURUSD suggests cycle from 4.16.2024 low is in progress as a 5 waves impulse. Up from 4.16.2024 low, wave 1 ended at 1.0916. Pullback in wave 2 ended at 1.0664 as the 1 hour chart below shows. Pair has turned higher in wave 3. However, it still needs to break above wave 1 at 1.0916 to validate the bullish view and creates a bullish sequence. Up from wave 2, wave i ended at 1.0776 and pullback in wave ii ended at 1.0709. Pair then resumed rally higher in wave iii towards 1.0817 and pullback in wave iv ended at 1.0777.
Expect pair to extend higher in wave v to complete wave (i) in higher degree. Afterwards, pair should pullback in wave (ii) to correct cycle from 6.26.2024 low before it resumes higher again. Near term, as far as pivot at 1.066 low stays intact, pullback should find support in 3, 7, or 11 swing for further upside. Potential target for wave 3 higher is 100% – 161.8% Fibonacci extension of wave 1. This area comes at 1.0982 – 1.1177.
EURUSD 60 Minutes Elliott Wave Chart
EURUSD Elliott Wave Video
https://www.youtube.com/watch?v=lVg5eUjy1ds
USD/JPY Recedes From Peaks: Analyzing The Pullback
Key Highlights
- USD/JPY climbed to a new multi-year high at 161.95 before it corrected lower.
- It traded below a key bullish trend line with support at 161.50 on the 4-hour chart.
- EUR/USD extended gains above the 1.0785 resistance zone.
- Oil prices might soon attempt to clear the $85.00 resistance.
USD/JPY Technical Analysis
The US Dollar remained in a strong uptrend above 158.00 against the Japanese Yen. USD/JPY surpassed the 160.00 and 161.20 resistance levels and traded to a new multi-year high.
Looking at the 4-hour chart, the pair traded as high as 161.95 and recently started a downside correction. There was a move below the 50% Fib retracement level of the upward move from the 160.26 swing low to the 161.95 high.
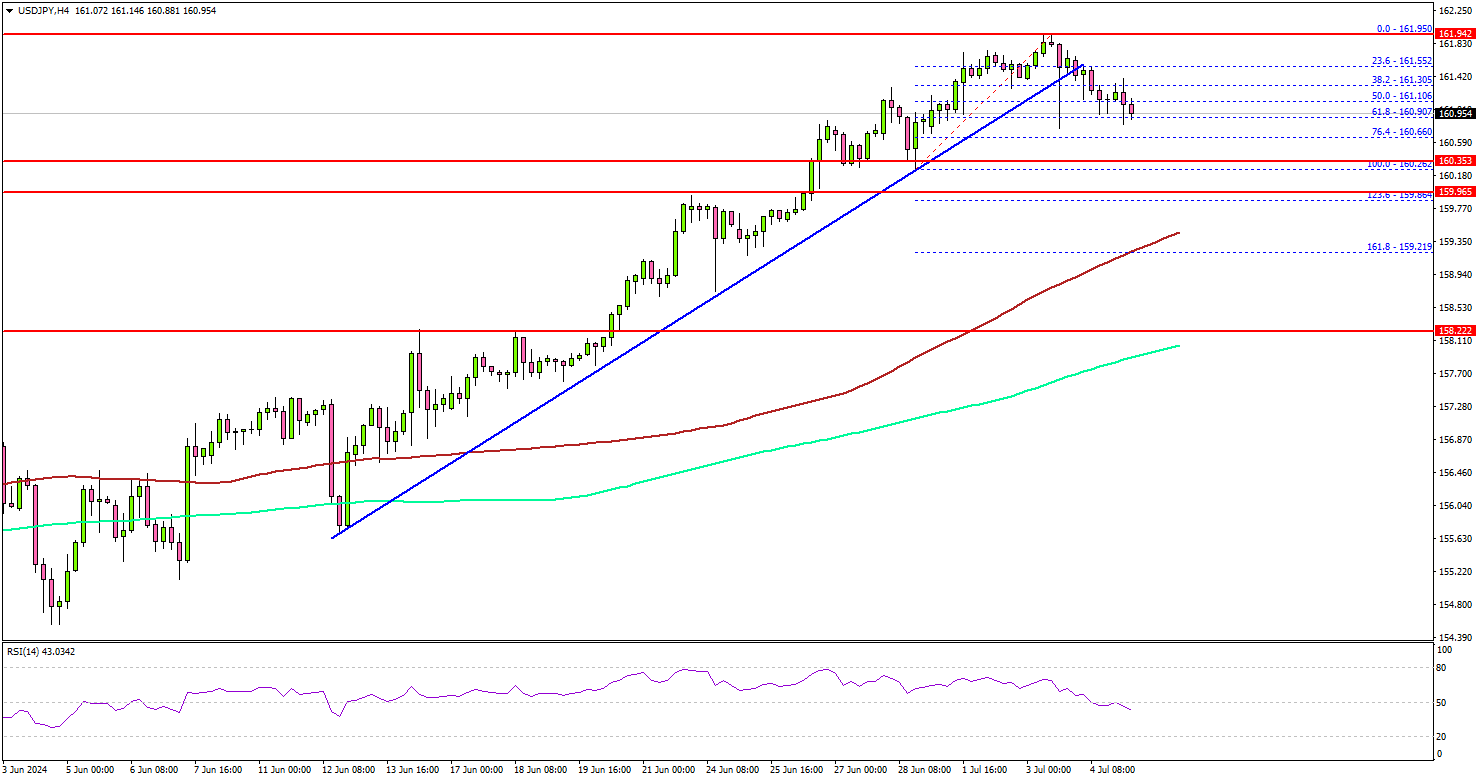
Besides, the pair traded below a key bullish trend line with support at 161.50 on the same chart. However, it is still well above the 100 simple moving average (red, 4-hour) and the 200 simple moving average (green, 4-hour).
Immediate support is near the 160.65 level and the 76.4% Fib retracement level of the upward move from the 160.26 swing low to the 161.95 high.
The next major support is near the 160.25 level. A downside break and close below the 160.25 support zone could open the doors for more losses. In the stated case, the pair could decline toward the 159.20 level and the 100 simple moving average (red, 4-hour).
On the upside, USD/JPY might face resistance near the 161.50 level. The next resistance sits at 161.80. The main hurdle sits at 162.00.
A clear move above the 162.00 resistance might send it toward the 162.75 level. Any more gains might open the doors for a test of the 163.50 zone in the coming days.
Looking at Oil, the bulls seem to be in action, and they might soon aim for more upsides above the $85.00 resistance zone.
Economic Releases
- US nonfarm payrolls for June 2024 – Forecast 190K, versus 272K previous.
- US Unemployment Rate for June 2024 - Forecast 4.0%, versus 4.0% previous.
US NFP to shape Fed’s Sep rate cut odds
Markets focuses are on US Non-Farm Payroll report, a critical data release that could significantly influence market sentiment and monetary policy expectations. Dollar has been under selling pressure this week, driven by a series of disappointing economic data, particularly from ISM services. These developments have heightened expectations that Fed will begin cutting interest rates in September. Current fed funds futures suggest a nearly 73% probability of this outcome.
For June, markets are anticipating a headline job growth figure of 180k. Unemployment rate is expected to remain steady at 4.0%, while average hourly earnings are projected to increase by 0.3% mom. Recent economic indicators have painted a mixed picture: ISM Services Employment declined to 46.1 from 47.1, and ISM Manufacturing Employment fell to 49.3 from 51.1. ADP Employment report showed an addition of 150k net new jobs, and 4-week moving average of initial unemployment claims rose to 239,000, up from 222,000 last month, marking the highest level in ten months.
US stock markets have been responding to weak economic data with a "bad news is good news" attitude recently, where disappointing data increases the likelihood of an earlier rate cut by Fed. This sentiment is expected to persist with today's NFP report. Market reactions could be pronounced, especially if unemployment rate rises or earnings growth falls short of expectations.
S&P 500 has been on a record-breaking run, and weaker-than-expected NFP report could further extend this rally. Current up trend is in progress for 61.8% projection of 4103.78 to 5263.95 from 4953.56 at 5670.55. Nevertheless, break of 5446.53 support will bring consolidations first, before extending the up trend at a later stage.
ECB’s Lagarde: Vigilance needed as inflation fight continues
ECB President Christine Lagarde emphasized the importance of remaining vigilant in the fight against inflation in an interview with Portuguese TV RTP overnight. She underscored the necessity of being confident that inflation is on a continuous downward trend, supported by data on wages, profits, and economic activity.
"We have to remain vigilant and we have to be confident that inflation is continuously down and that the data that we receive on wages, on profit, on activity, reinforce our confidence that we are on a path to win the fight," Lagarde stated.
Lagarde highlighted the importance of comprehensive data to guide monetary policy decisions, noting, "We need a lot of data — I'm not sure that we are getting those data at every single monetary-policy Governing Council meeting that we have." She acknowledged that, in theory, policy adjustments could be made at any meeting, but emphasized that such decisions would require a robust set of data.
Bitcoin (BTCUSD) Found Sellers After Elliott Wave Zig Zag Pattern
Hello fellow traders. In this technical blog we’re going to take a quick look at the Elliott Wave charts of Bitcoin ( BTCUSD). As our members know, Bitcoin is correcting the cycle from the 25068 low, and we have been predicting a price decline. Recently, we observed a bounce against the June 7th peak. This recovery formed an Elliott Wave Zig Zag Pattern. In the following text, we will explain the Elliott Wave Pattern and the forecast.
Before we take a look at the real market example, let’s explain Elliott Wave Zigzag pattern.
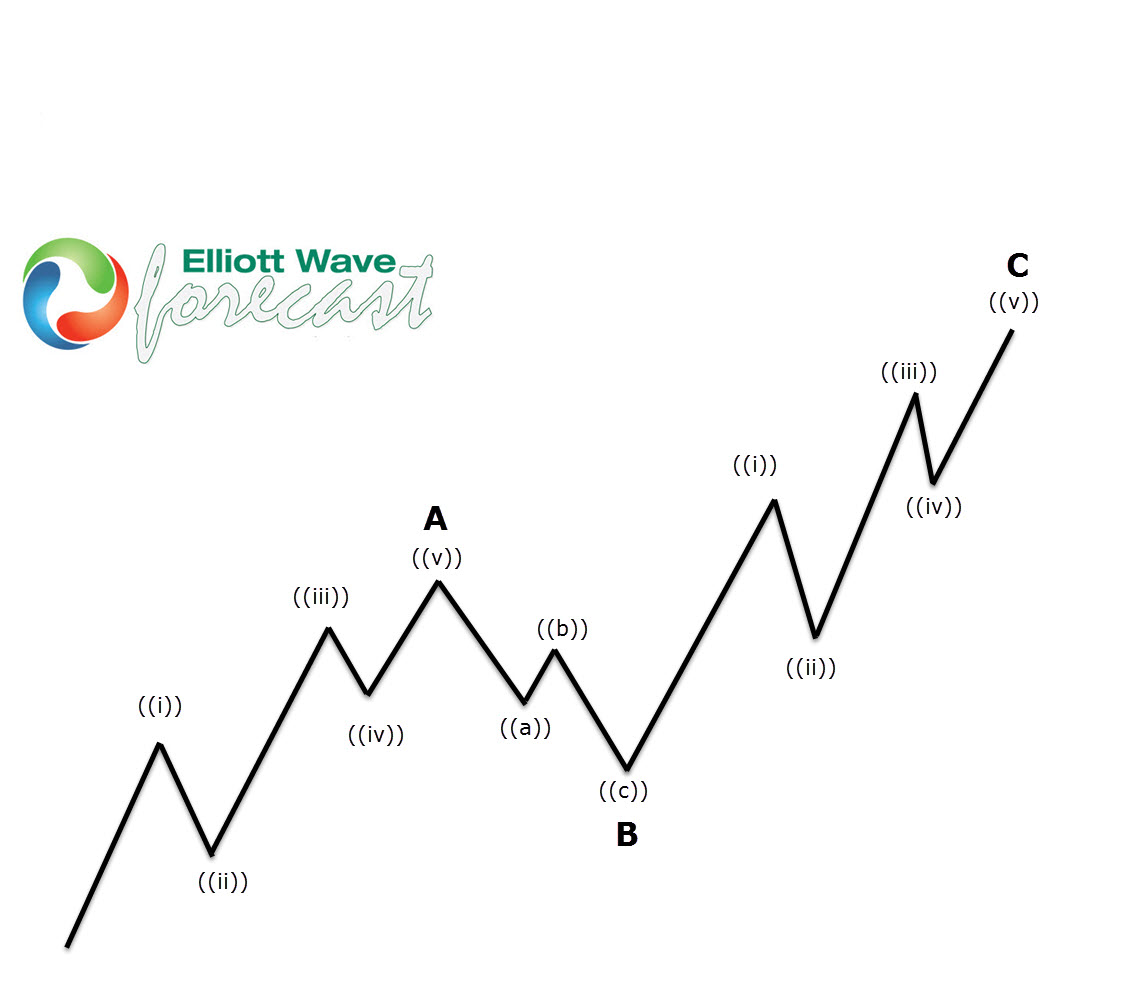
Elliott Wave Zigzag is the most popular corrective pattern in Elliott Wave theory . It’s made of 3 swings which have 5-3-5 inner structure. Inner swings are labeled as A,B,C where A =5 waves, B=3 waves and C=5 waves. That means A and C can be either impulsive waves or diagonals. (Leading Diagonal in case of wave A or Ending in case of wave C) . Waves A and C must meet all conditions of being 5 wave structure, such as: having RSI divergency between wave subdivisions, ideal Fibonacci extensions and ideal retracements.
BTCUSD H1 Elliott Wave Analysis 07.01.2024
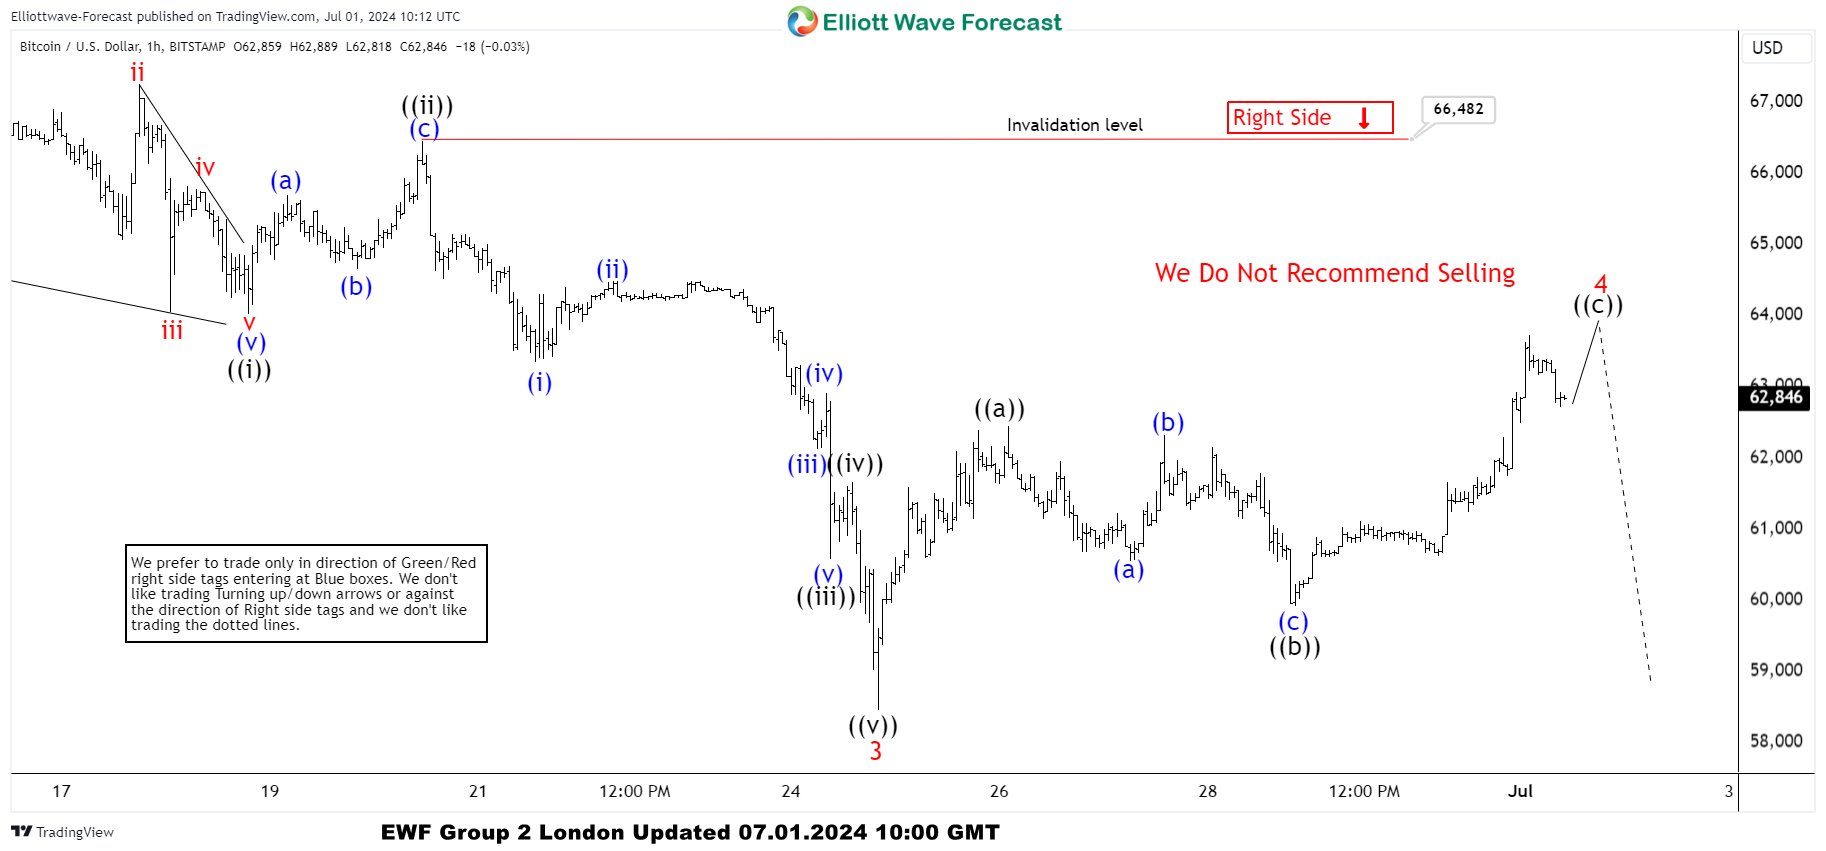
BTCUSD is showing incomplete sequences in the cycle from the 79.791 peak, suggesting we should get at least another leg down to complete 5 waves in the proposed cycle. The current view suggests Wave 4 red correction appears to be unfolding as an Elliott Wave Zig Zag pattern. The first leg ((a)) of 4 looks like a 5-wave pattern, after which we got a clear 3-wave pullback in ((b)) black. Currently, we are in the ((c)) leg, which also has the form of a 5-wave pattern. Another short-term high would be ideal to complete 5 waves within the ((c)) leg and Wave 4 red recovery as an Elliott Wave Zig Zag pattern. We don’t recommend buying the cryptocurrency at this stage and expect to see a decline toward new lows ideally.
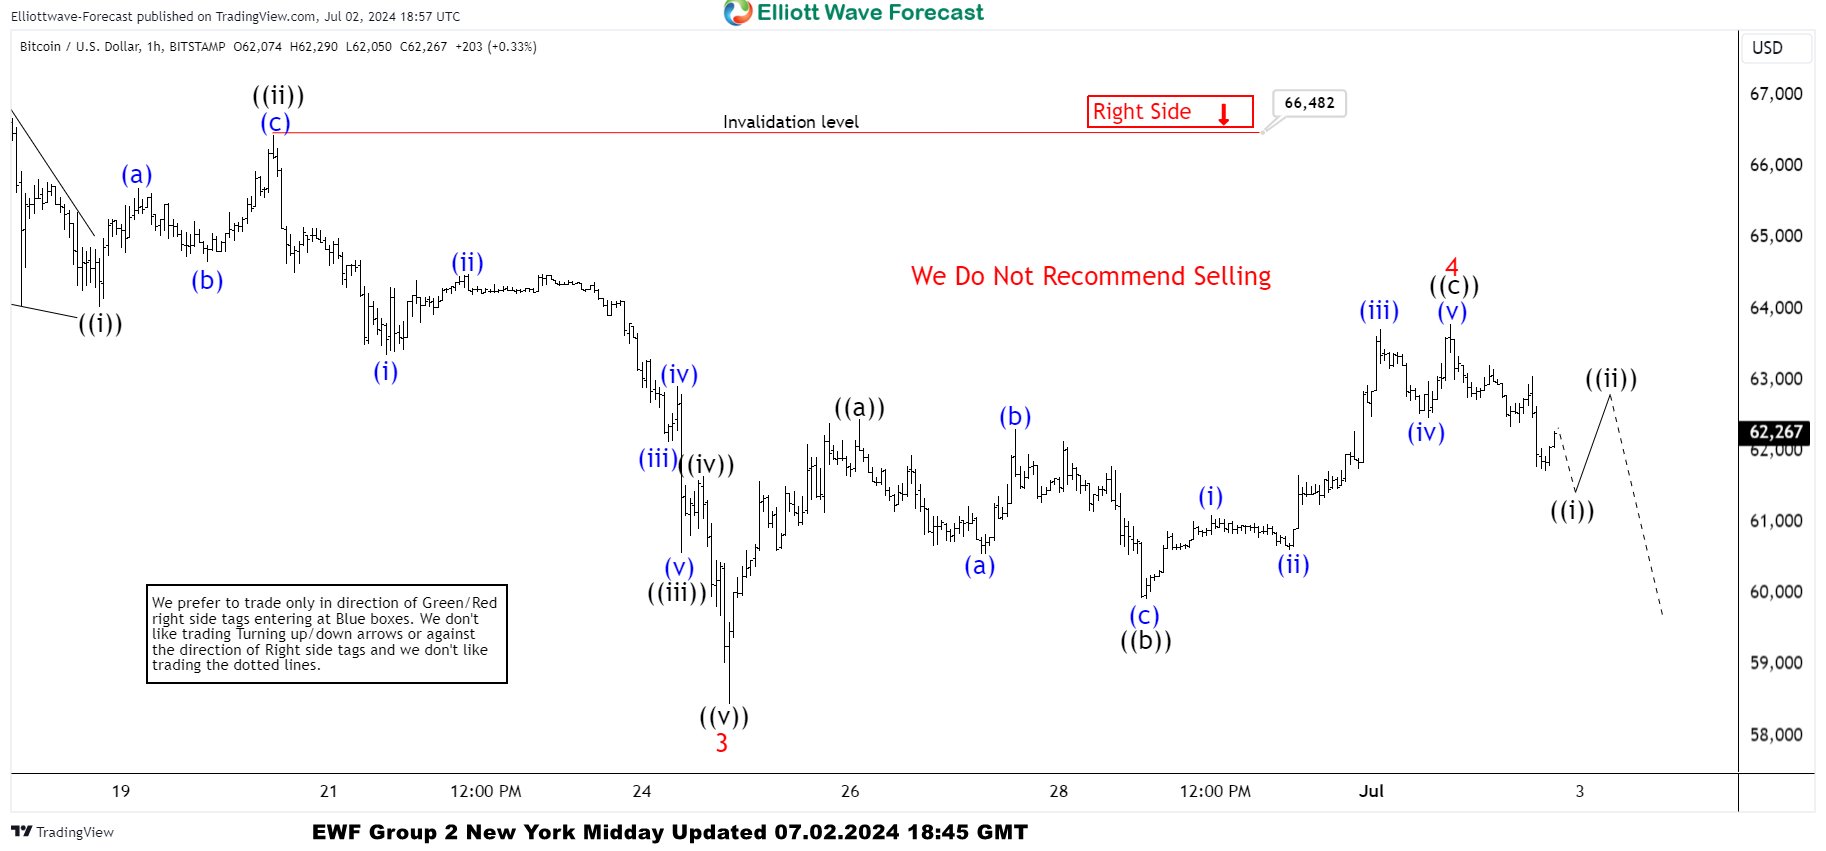
BTCUSD H1 Elliott Wave Analysis 07.02.2024
The cryptocurrency made another short-term high before declining as expected. The Wave 4 red recovery completed at the 63846 high. As long as Bitcoin remains below that peak, we expect it to continue finding sellers and extend toward new lows, targeting 57207-55166 area.
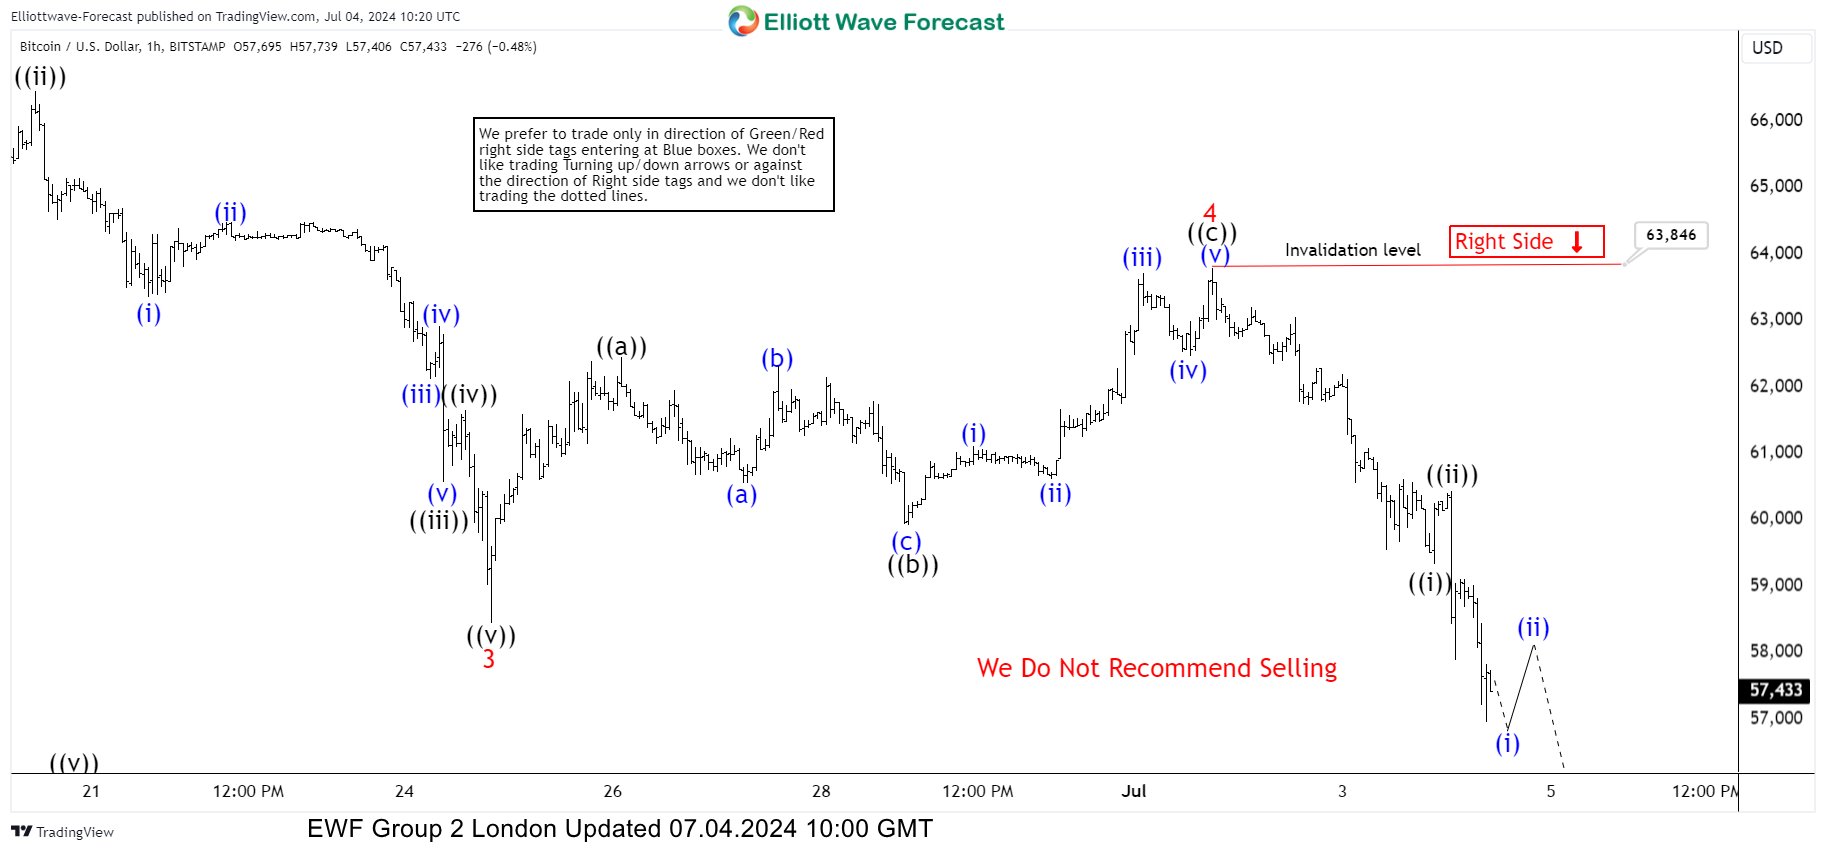
BTCUSD H1 Elliott Wave Analysis 07.04.2024
Eventually, the price made a further decline. Bitcoin broke the previous low and reached the first target area at 57207-55166 as we expected. The cryptocurrency remains bearish against the 63846 pivot.
WTI Wave Analysis
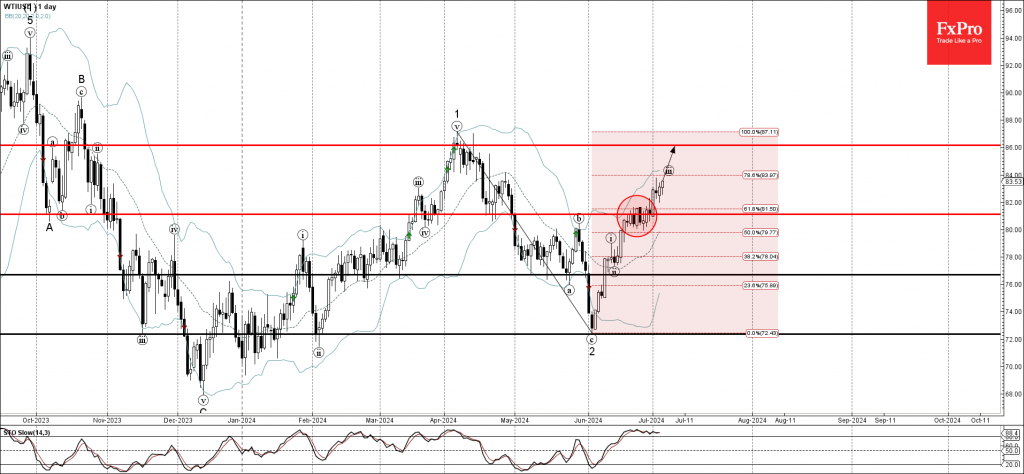
- WTI broke resistance level 81.10
- Likely to rise to resistance level 86.00
WTI crude oil recently broke the resistance level 81.10 (former top of the minor correction (b) from the end of May).
The breakout of the resistance level 81.10 coincided with the breakout of the 61.8% Fibonacci correction of the previous sharp ABC correction 2 from the start of April.
WTI crude oil can be expected to rise further toward the next resistance level 86.00, former strong resistance from April and the target price for the completion of the active impulse wave (iii).
Natural Gas Wave Analysis
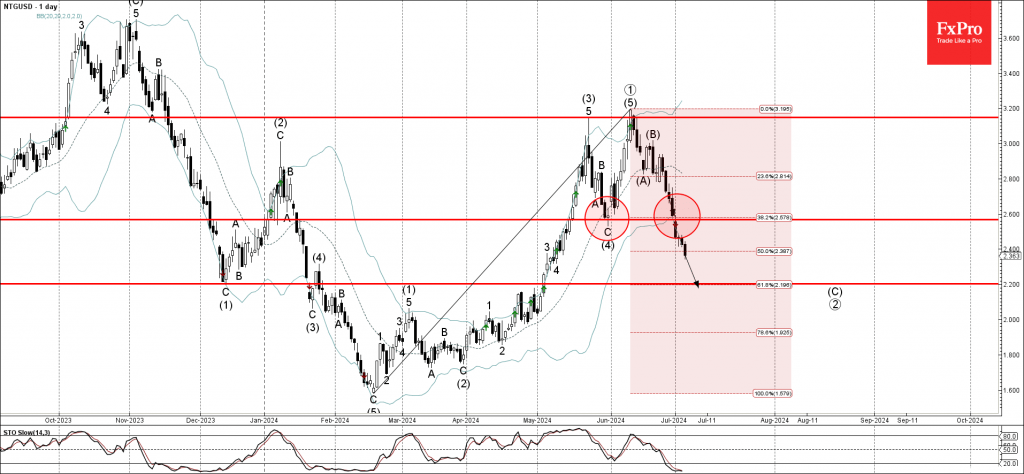
- Natural gas under the bearish pressure
- Likely to fall to support level 2.200
Natural gas is under bearish pressure after the earlier breakout of the key support level 2.600 (which stopped the previous medium-term ABC correction (4) from the end of May).
The breakout of the support level 2.600 coincided with the breakout of the 38.2% Fibonacci correction of the previous sharp upward impulse from February.
Natural gas can be expected to fall further toward the next support level 2.200, the target price for the completion of the active impulse wave (C).