Sample Category Title
Gold Maintains Upward Trend as Market Anticipates US Jobs Data
Gold prices have continued their ascent, with a troy ounce of the precious metal reaching USD 2363. This rise is primarily fuelled by anticipated US employment data for June, which could significantly influence the Federal Reserve's rate decisions.
Recent US economic indicators, including a contraction in the service sector and weaker-than-expected private sector employment figures from ADP, have painted a dovish picture regarding the Fed's upcoming monetary policy moves. These factors contribute to the prevailing sentiment that the Fed might lower interest rates, with market probabilities favouring a cut by September currently standing at 73%.
Furthermore, ongoing political uncertainties in Europe, especially in France and the UK, affect the EUR exchange rate, thereby impacting the USD and indirectly influencing gold prices. Additionally, persistent geopolitical tensions in the Middle East continue to drive demand for safe-haven assets like gold.
Technical analysis of XAU/USD
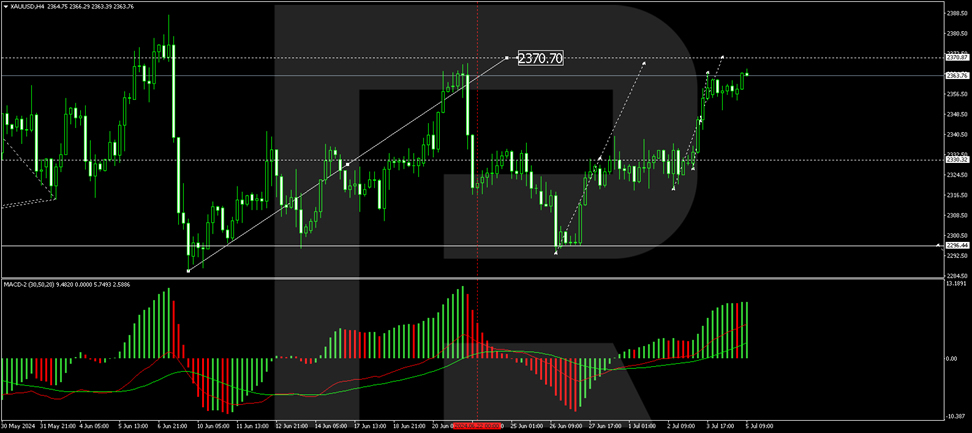
Gold is currently undergoing a correction that is anticipated to conclude at the level of 2370.70. Post-correction, the market might experience a decline towards 2295.00. A break below this could extend losses to 2222.22, setting a local target. This bearish potential is supported by the MACD indicator, which, although above zero, shows signs of peaking.
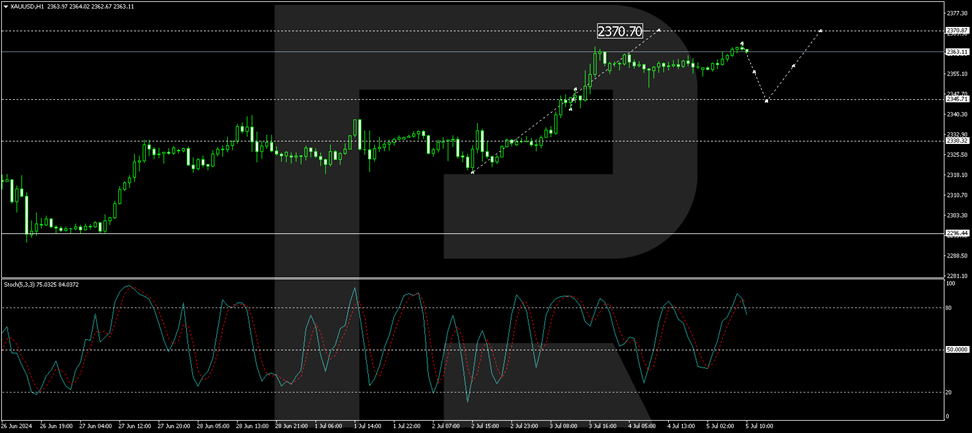
On the hourly chart, gold formed a tight consolidation around 2345.70 and breached the 2366.26 level upward, setting a local high. A corrective move down to 2345.70 is likely, followed by a potential rise to 2370.70, completing the current correction phase. Subsequently, the market might prepare for a new downtrend. The Stochastic oscillator, currently above 80, suggests an impending downturn, reinforcing the likelihood of a corrective decline.
Investors and traders will closely monitor the release of the US jobs report, given its potential to significantly sway Federal Reserve policy and, by extension, gold prices.
Terrifying Crypto Sell-off
Market picture
The crypto market cap has fallen back below $2 trillion, accelerating its decline and losing over 8%, while many altcoins have suffered double-digit losses within the last 24 hours.
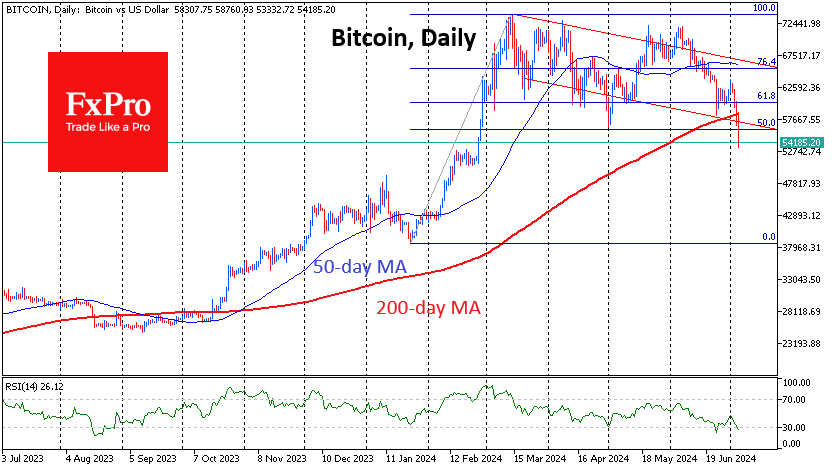
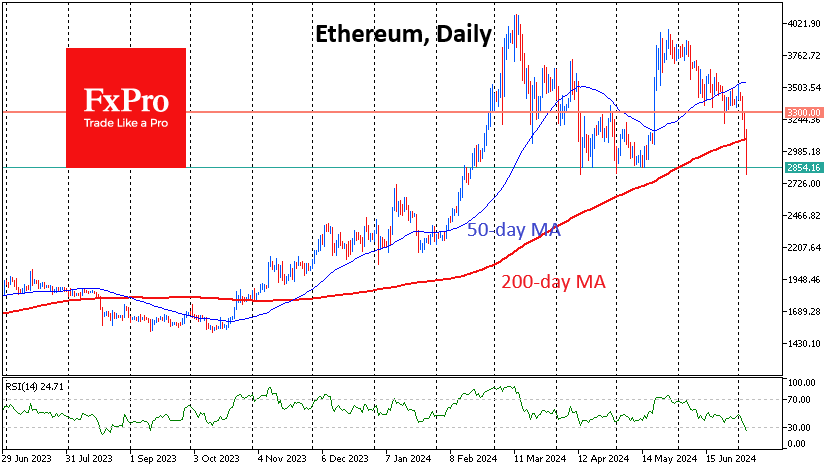
Bitcoin pulled back to $54.7K, losing around 6.5% since the start of the day and hitting a low of $53.3K. The 200-day moving average failed to act as support, and we saw an acceleration in the sell-off after a break below this line. The current failure is an acceleration of the downtrend that has been in place since March. The fundamental pressure appears to be accelerating selling by miners and long-term “holders” such as the German and US governments, in addition to payments to Mt. Gox creditors.
On Friday morning, Ethereum rewrote February’s lows and briefly dipped to $2800. By the start of the active European trading day, the price had returned to the April and May lows, but it’s hard to see signs of active buying yet. So far, the situation looks like a pause before a new downward impulse that could take the price back to $2300.
News background
Bloomberg recalled the Mt. Gox trustee’s gradual refund of 137,000 BTC to customers of the bankrupt platform and traders’ concerns that some of the coins would end up on the open market.
Also causing nervousness is the distribution of digital gold by the US and German authorities. On Thursday, German authorities sent 1,300 BTC to Coinbase, Kraken and Bitstamp. On the same day, 237 BTC worth $13.67 million were transferred from a US government-linked address.
In addition, the US election factor may be putting pressure on the price. “The likelihood of Biden being replaced by a stronger Democratic candidate, who may not be supportive of cryptocurrencies, is one of the factors behind the decline,” said Digital Asset Capital.
10x Research has allowed bitcoin to fall towards $50,000 due to the sudden change in sentiment. On the BTC chart, a technical reversal figure, the double top, is being realized, suggesting a drop in prices to the $45K—$50K area. Miners, ETF buyers, and hodlers are leading the selling.
CryptoQuant noted that Bitcoin miners have started shutting down inefficient equipment and selling off reserves, which are clear signs of capitulation. Historically, such periods are associated with price lows.
Whale Alert noted that the 119 BTC that had been “dormant” for more than 12 years had been moved.
Historic French Vote Could Propel Le Pen to Power
French election: Will the far-right win a majority?
French voters will head to the polls on Sunday, July 7 for round two of the parliamentary elections. In the first round, Mary Le Pen’s far-right National Rally party (RN) made big gains and won 33% of the vote. President Macron’s Ensemble alliance was relegated to third place, as voters delivered the President a stinging rebuke after he called the snap election.
Macron finds himself on the ropes and is desperate to prevent the NR from winning a majority in parliament. The NR is poised to become the biggest party but it will need to pick up 289 seats of the 577 seats in parliament in order to assured of an absolute majority. Election polls are projecting that the NR will win between 190 and 250 seats, which would mean that no single party can form a government on its own, leaving both the left and the right blocs maneuvering to form a coalition.
The scenario of no clear winner in the election, known as a ‘hung parliament’, could lead to weeks of political paralysis which could easily result in fluctuations in the financial markets.
An outright majority for the NR would be a nightmarish scenario for the markets. Le Pen is a Eurosceptic and has previously advocated that France leave the European Union, abandon the euro and revert back to the French franc. Le Pen has opposed market liberalization and with a parliamentary majority the NR could enact legislation which puts France at odds with the European Union. In the past, when the NR has had electoral success, French markets have reacted negatively. This would likely repeat itself if the NR wins a majority on Sunday.
Despite the uncertainty ahead of the election, investors aren’t panicking. The CAC 40, the benchmark French stock market index, posted slight gains this week and the euro has looked sharp, climbing 1.06% this week against the US dollar. If the euro can hang on to these gains, it will mark its best weekly gains in 2024. If the NR falls short of a majority, as expected, investor confidence should remain steady, provided that Macron is quickly able to form a coalition.
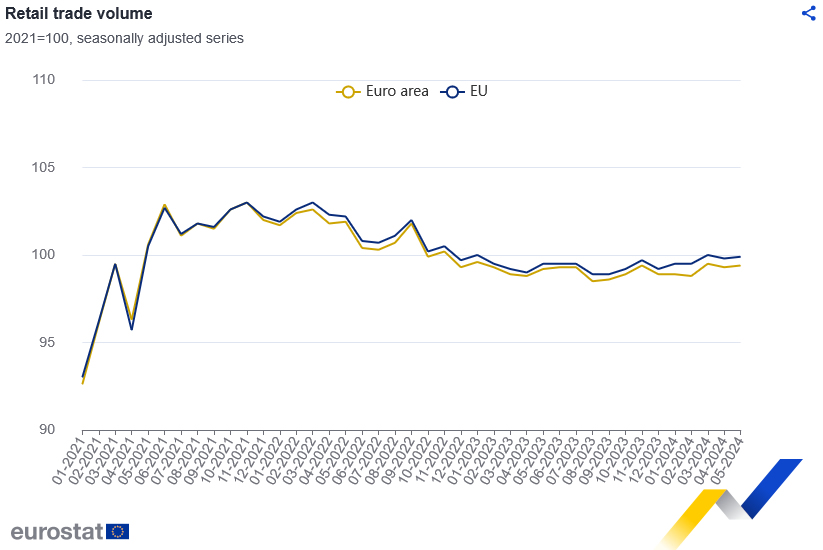
Eurozone retail sales rises 0.1% mom in May, EU up 0.1% mom too
Eurozone retail sales volume rose 0.1% mom in May, below expectation of 0.2% mom. Sales volume, increased by 0.7% mom for food, drinks, tobacco, and by 0.4% mom for automotive fuel in specialized stores. Sales volume fell -0.2% mom for non-food products (except automotive fuel).
EU retail sales also rose 0.1% mom. Among Member States for which data are available, the highest monthly increases in the total retail trade volume were recorded in Denmark (+2.3%), Lithuania (+1.8%) and Luxembourg (+1.7%). The largest decreases were observed in Slovakia (-1.0%), Ireland (-0.9%), Bulgaria and Malta (both -0.8%).
GBP/JPY Daily Outlook
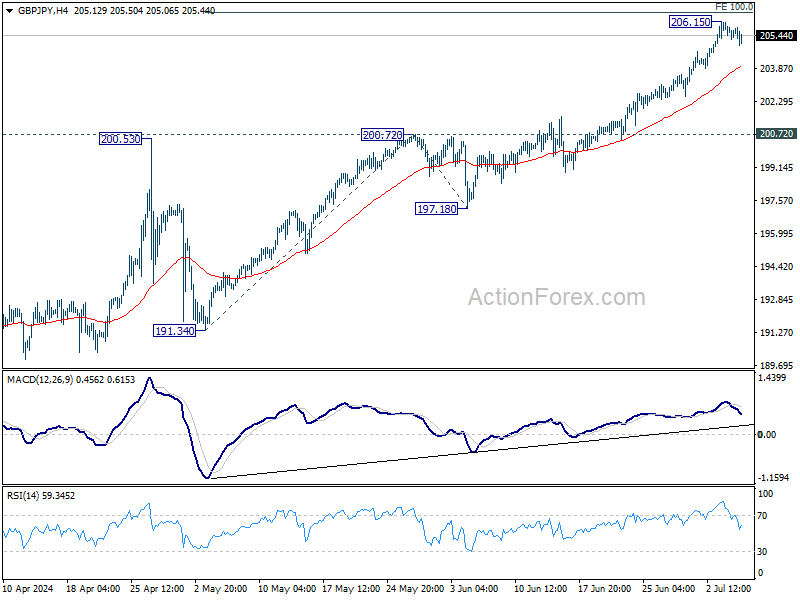
Daily Pivots: (S1) 205.24; (P) 205.82; (R1) 206.36; More...
Intraday bias in GBP/JPY is turned neutral with current retreat and some consolidations would be seen below 206.15. Further rise is expected as long as 200.72 resistance turned support holds. Firm break of 100% projection of 191.34 to 200.72 from 197.18 at 206.56 will target 138.2% projection at 210.17.
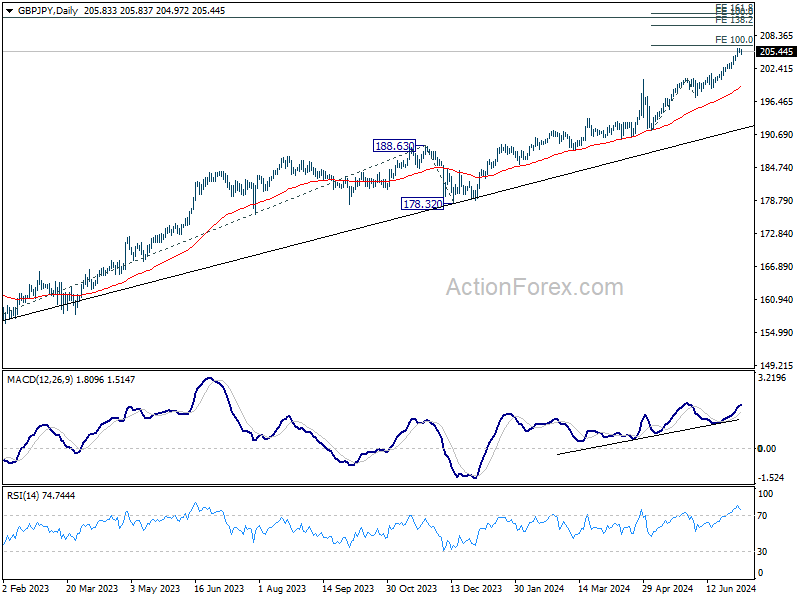
In the bigger picture, long term up trend is still in progress. Next target is 100% projection of 155.33 to 188.63 from 178.32 at 211.62. Outlook will stay bullish as long as 197.18 support holds, even in case of deep pullback.
EUR/JPY Daily Outlook
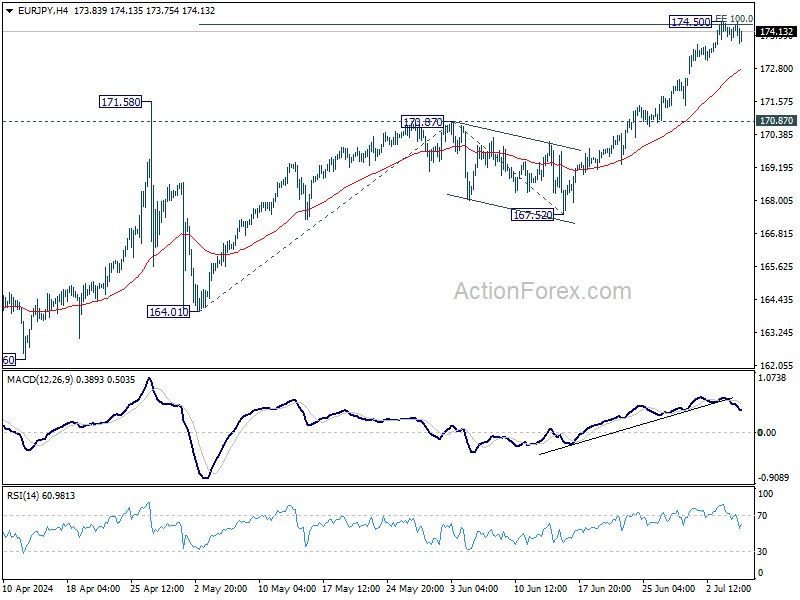
Daily Pivots: (S1) 173.97; (P) 174.21; (R1) 174.61; More...
Intraday bias in EUR/JPY is turned neutral first with current retreat, and some consolidations would be seen below 174.50. Further rally is expected as long as 170.87 resistance turned support holds, in case of deeper retreat. Firm break of 174.50 will target 138.2% projection of 164.01 to 170.87 from 167.52 at 177.00.
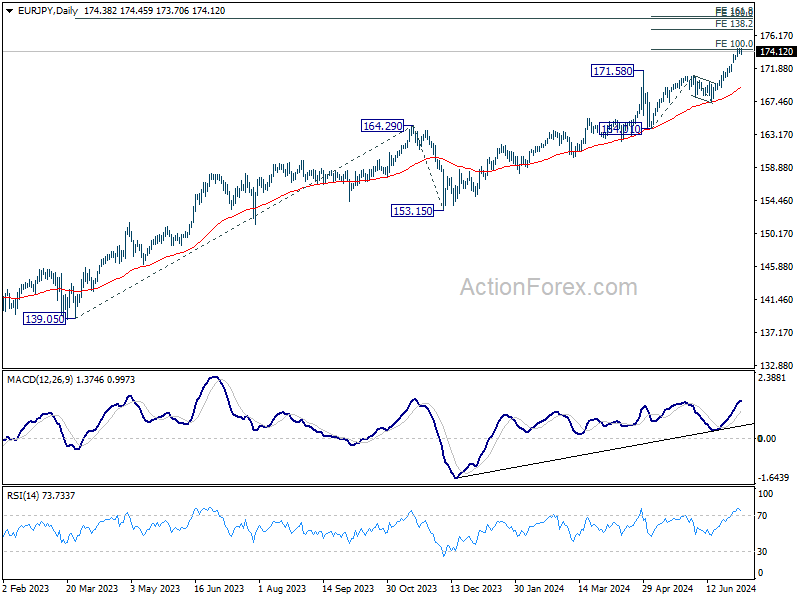
In the bigger picture, long term up trend is still in progress. Next target is 100% projection of 139.05 to 164.29 from 153.15 at 178.38. For now outlook will stay bullish as long as 167.52 support holds, even in case of deep pullback.
EUR/GBP Daily Outlook
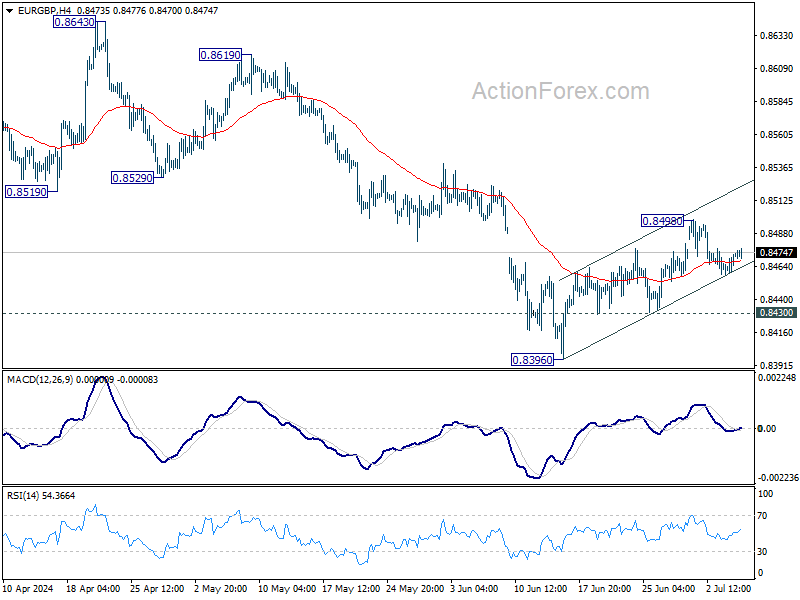
Daily Pivots: (S1) 0.8460; (P) 0.8467; (R1) 0.8483; More...
Intraday bias in EUR/GBP stays neutral and outlook is unchanged. On the upside, sustained trading above 55 D EMA (now at 0.8501) will extend the rise from 0.8396 short term bottom to 0.8529 support turned resistance. Nevertheless, On the downside, break of 0.8493 support will suggest that the corrective recovery has completed. Intraday bias will be back on the downside for retesting of 0.8396 low. Firm break there will resume larger down trend.
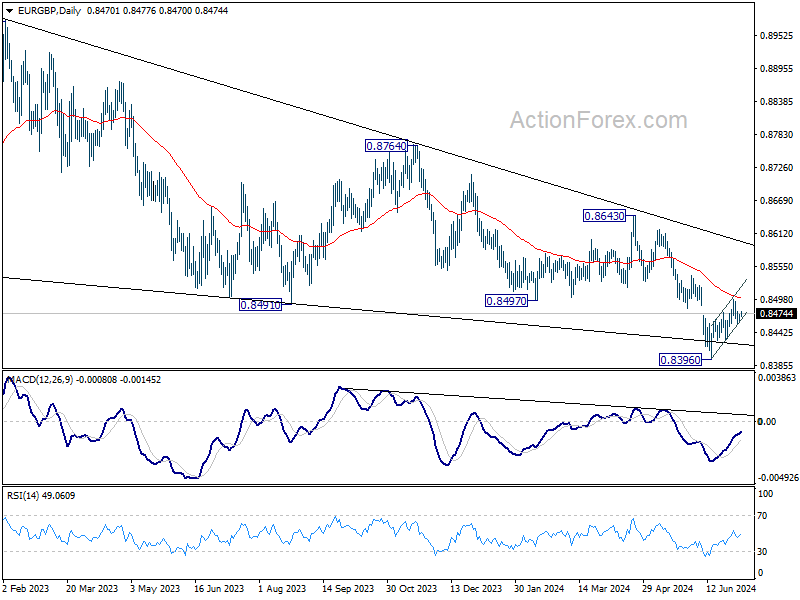
In the bigger picture, down trend from 0.9267 (2022 high) is in progress. Break of 0.8396 will target 0.8201 (2022 low). For now, outlook will remain bearish as long as 0.8643 resistance holds, even in case of stronger rebound.
EUR/AUD Daily Outlook
Daily Pivots: (S1) 1.6047; (P) 1.6070; (R1) 1.6096; More...
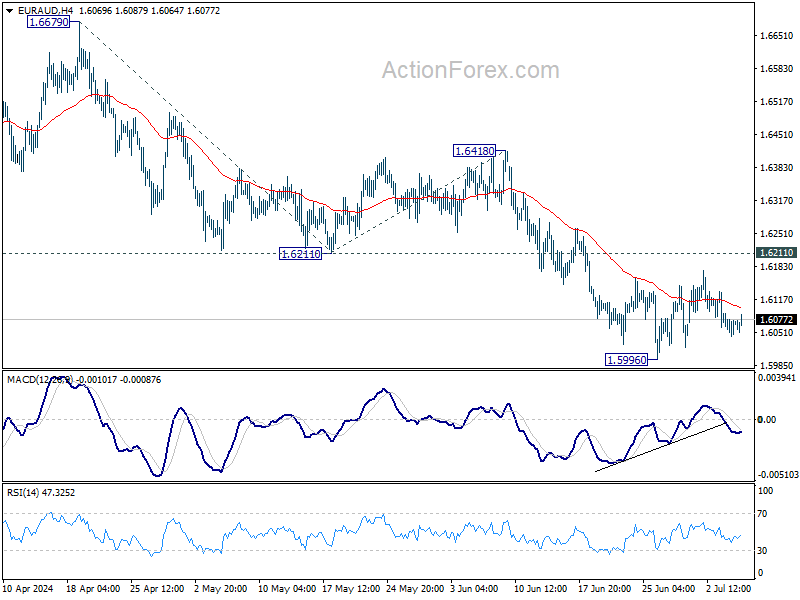
EUR/AUD is extending the consolidation from 1.5996 and intraday bias stays neutral. With 1.6211 support turned resistance intact, outlook remains bearish. On the downside, break of 1.5996 will target 100% projection of 1.6679 to 1.6211 from 1.6418 at 1.5950. Firm break there will target 1.5846 key support next.
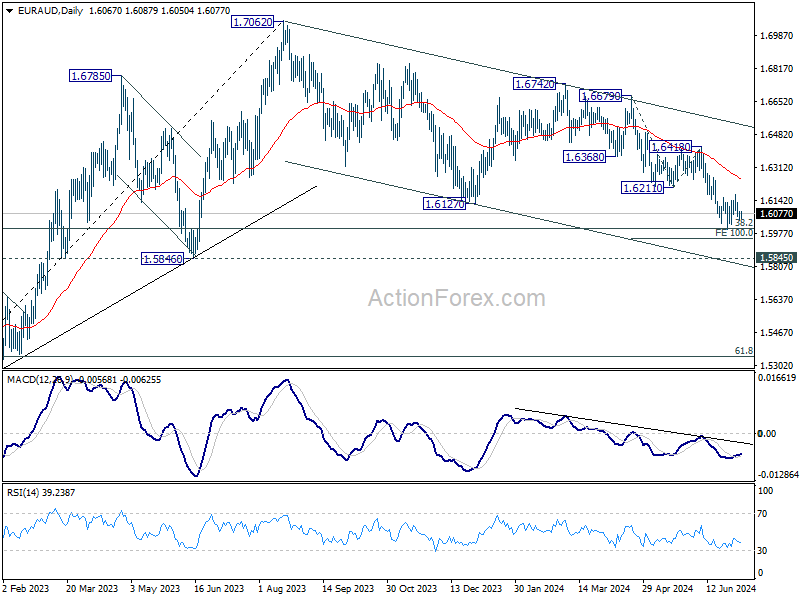
In the bigger picture, fall from 1.7062 medium term top is seen as a correction to the up trend from 1.4281 (2022 low) only. Strong support is still expected between 1.5846 and 38.2% retracement of 1.4281 to 1.7062 at 1.6000 to bring rebound. Break of 1.6148 resistance will argue that the correction has completed.
EUR/CHF Daily Outlook
Daily Pivots: (S1) 0.9711; (P) 0.9733; (R1) 0.9755; More....
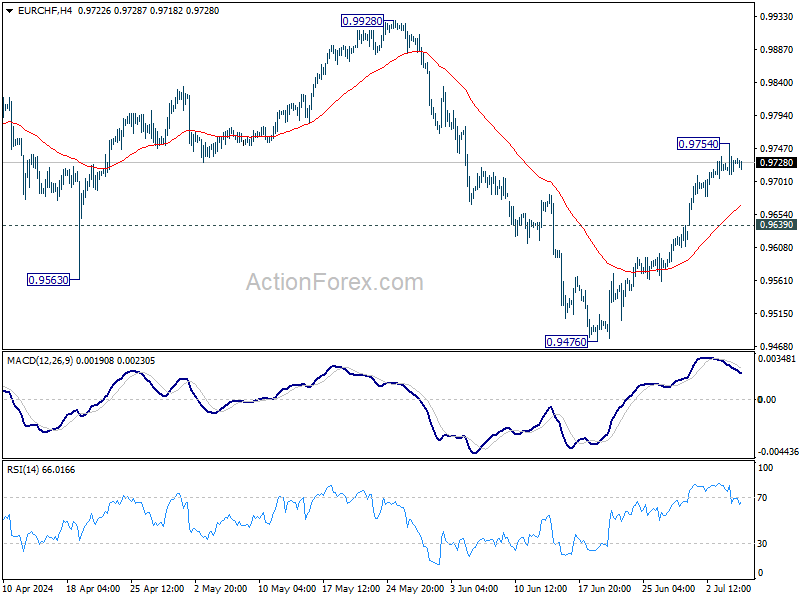
Intraday bias in EUR/CHF is turned neutral with current retreat and some consolidations would be seen first. Further rally is expected as long as 0.9639 minor support holds. Above 0.9754 will resume the rise from 0.9476 to 0.9928 high. Nevertheless, break of 0.9639 will turn bias back to the downside for 0.9476 low instead.
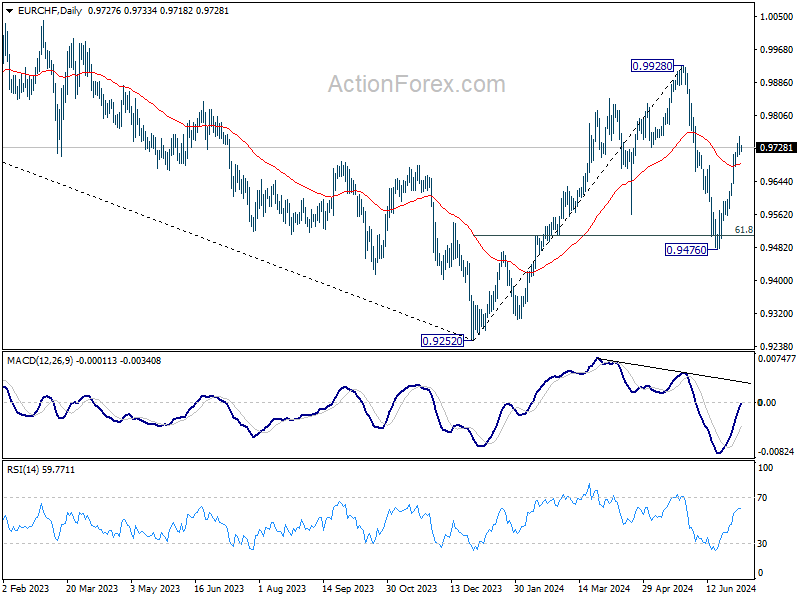
In the bigger picture, rebound from 0.9252 medium term bottom might not be completed yet. But even in case of resumption, strong resistance could emerge from 1.0095 to limit upside. Medium term outlook will be neutral at best as long as 1.0094 structural resistance holds. Meanwhile, break of 0.9476 will bring retest of 0.9252 low.
GBPJPY Eases After Hitting New 16-Year High
- GBPJPY remains in strong upside tendency in long-term
- RSI flirts with uptrend line above 70
- Stochastic looks overstretched
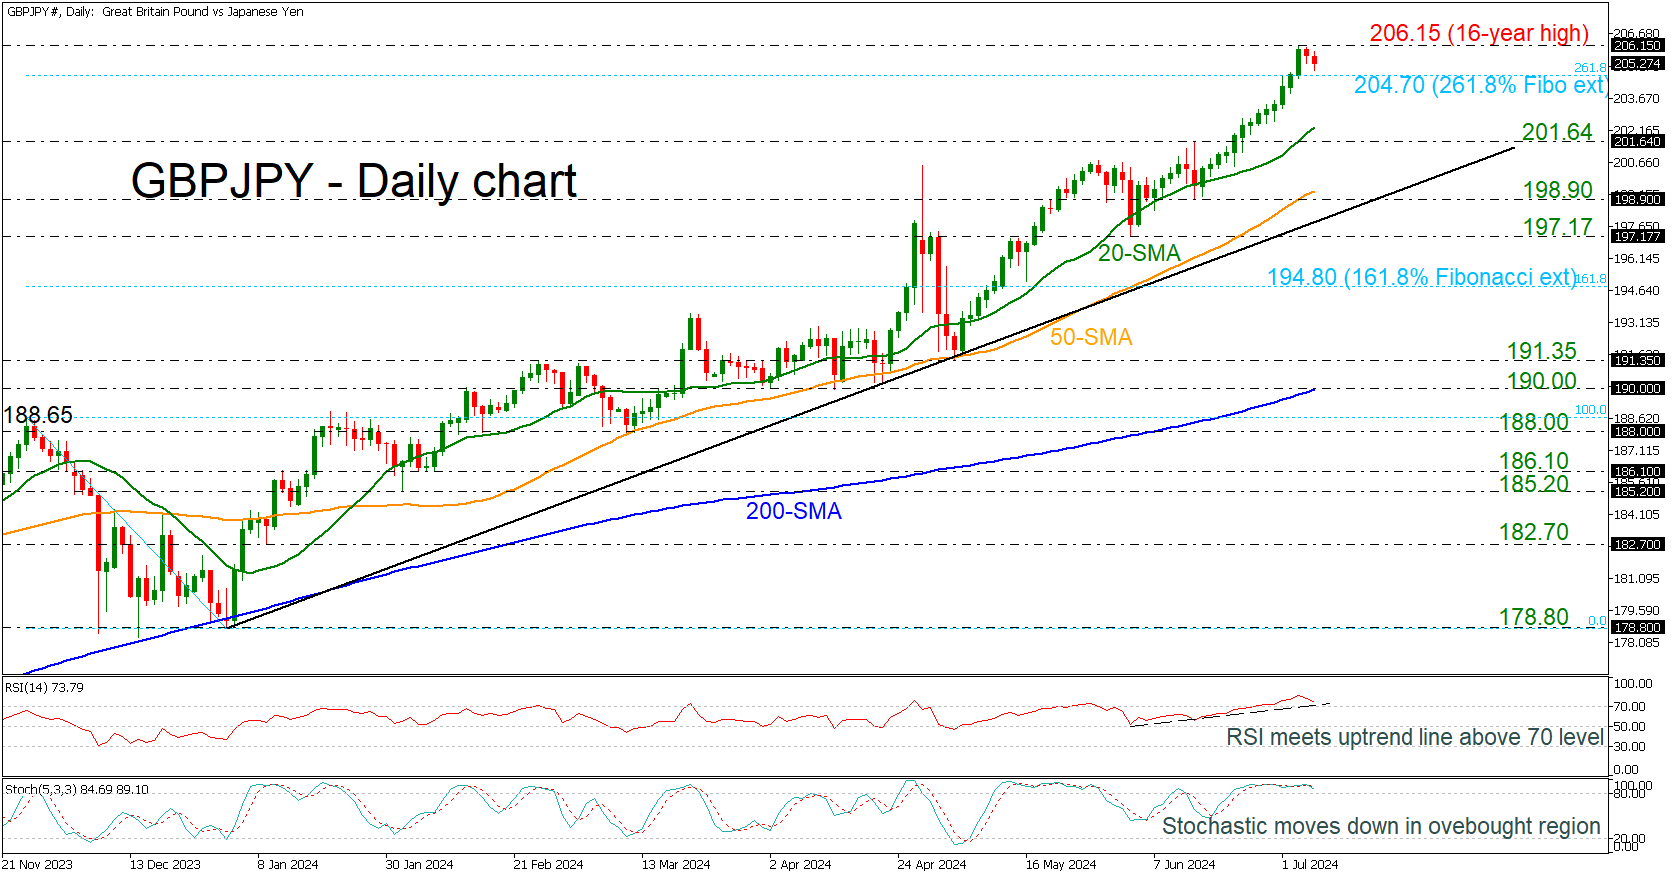
GBPJPY is declining somewhat after rallying to a fresh 16-year high of 206.15 earlier in the week. The pair posted 13 straight days of gains before falling near the 261.8% Fibonacci extension level of the down leg from 188.65 to 178.80 at 204.70.
The technical oscillators indicate an overstretched market, as the RSI is heading south, meeting the uptrend line that has been holding since the beginning of June, above the 70 level. Also, the stochastic oscillator is pointing down after the bearish crossover within the %K and %D lines above the 80 level.
If there are more declines and a dive below the immediate Fibonacci level, the market could visit the 20-day simple moving average (SMA) at 202.30, ahead of the 201.64 support level. Even lower, the bearish correction may continue until the 50-day SMA, near the 198.90 support, before testing the long-term ascending trend line at 198.50.
In the positive scenario, a successful climb above the latest multi-year peak could meet the next round numbers, such as 207.00 and 208.00, until the high in July 2008 at 215.90.
All in all, GBPJPY has been in a strong upward trend since the start of the year, and only a decisive fall below the 200-day SMA near the 190.00 psychological mark could change the current outlook.