Sample Category Title
Fed’s Bowman: Inflation to remain elevated, rate hold necessary
Fed Governor Michelle Bowman, in a speech today, said her baseline outlook that US inflation will return to the 2% target, provided federal funds rate remains at its current level of 5.25-5.50% "for some time." She emphasized that Fed is "still not yet at the point" where it would be appropriate to lower the policy rate.
Bowman stressed the need for Fed to "consider a range of possible scenarios" as monetary policy decisions evolve. She remains "willing" to raise interest rates "should progress on inflation stall or even reverse."
Regarding inflation outlook, Bowman noted that since the beginning of 2024, there has been only "modest" progress on inflation. Core CPI has been running at 3.8% through May, which is significantly above the average inflation rate in the second half of last year. She expects inflation to "remain elevated for some time."
Bowman also highlighted several upside risks to inflation. She mentioned that it is unlikely that further supply-side improvements will continue to reduce inflation. Geopolitical developments could also pose additional risks. Furthermore, increased immigration and continued labor market tightness could lead to persistently high core services inflation.
Brent Crude Oil Hits Two-Month High Amid Geopolitical Tensions
Brent crude oil prices surged to $86 per barrel on Tuesday, marking the highest level in two months. This rise was driven by escalating geopolitical risks in Eastern Europe and the Middle East, particularly the ongoing confrontation between Israel and Hamas, which shows no sign of abating despite the involvement of international mediators backed by the US.
On the demand side, uncertainties persist. China, the world's largest oil importer, continues to face significant economic challenges, contributing to the volatile market sentiment. The retail sector in China is under pressure following disappointing results from the mid-year online sales, with Chinese consumers showing reluctance to spend amidst concerns about personal wealth, the ongoing property market crisis, delayed wages, and high youth unemployment. These factors are critical as they jeopardise China’s GDP growth target of around 5% for the year.
Brent technical analysis
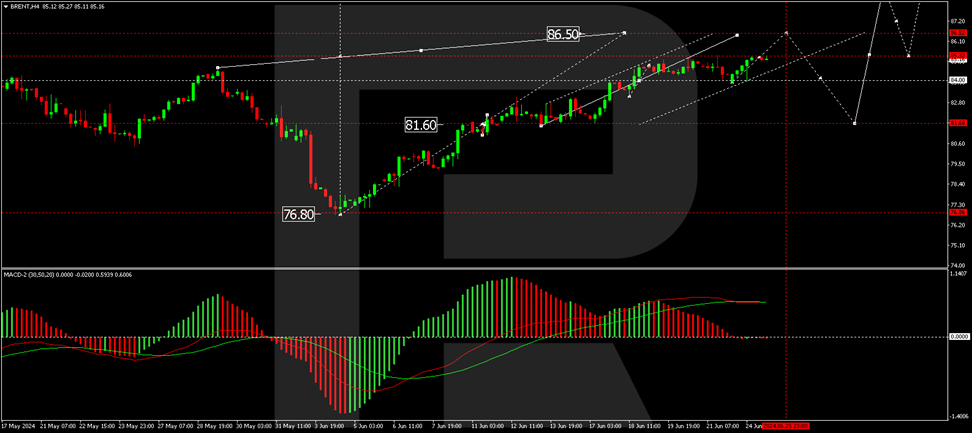
On the H4 chart, Brent is currently advancing towards the $86.50 level, which is identified as the immediate target. Once this level is reached, a potential correction to $81.60 may occur, testing from above. Subsequently, the market might initiate a new growth wave aiming for $89.00, with potential to extend up to $94.00. This bullish outlook is supported by the MACD indicator, whose signal line is above zero and climbing steeply.
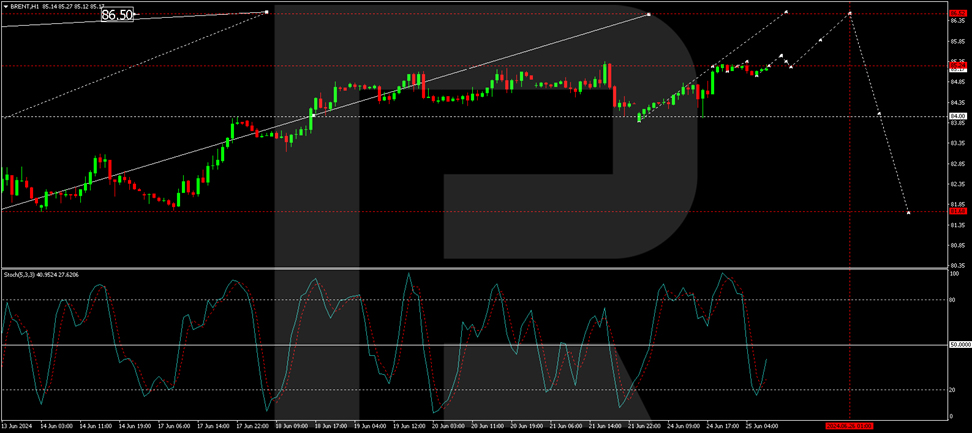
On the H1 chart, Brent found support at $84.00 and is now progressing through the latter stages of the current growth wave. The market has already achieved the $85.24 mark. We anticipate the formation of a narrow consolidation range around this level, with a breakout above potentially leading to further growth towards $86.50. This scenario is technically reinforced by the Stochastic oscillator, with its signal line poised above 20 and gearing up for an ascent to 80.
Market outlook
Investors should closely monitor developments in geopolitical hotspots and economic indicators from major economies like China and the US, as these could significantly sway oil prices. The current trajectory suggests bullish momentum for Brent crude, but the volatile nature of geopolitical events and economic data releases warrants cautious optimism.
USD/JPY: Bulls Gesitate on Approach to 160.00 Barrier, Potential Intervention Trigger
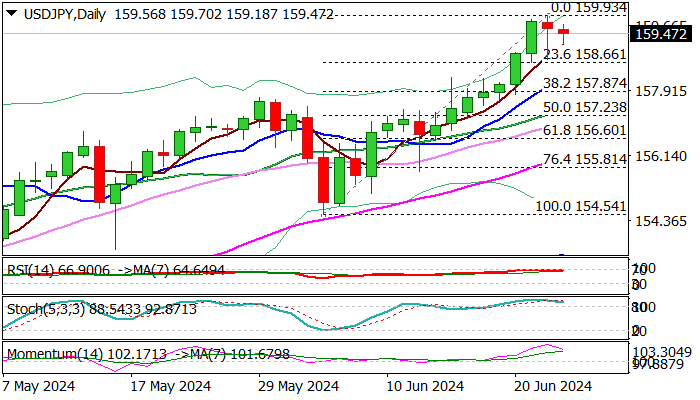
USDJPY edges lower after hitting levels just ticks away from 160 barrier, which many see as a trigger for intervention, as Japan’s authorities intervened at the end of April when the pair cracked 160 barrier.
Monday’s trading was closed in red for the first time in eight days, although long tail of daily candle suggests that bids are still very strong and markets may attack 160 level again, despite intervention threats.
Dips were so far shallow and contained by rising 5 DMA, keeping lower triggers at 158.25/157.87 (rising 10DMA / Fibo 38.2% of 154.54/159.93 upleg) out of reach for now.
Fading bullish momentum and overbought conditions on daily chart add to correction signals.
Any pullback above these supports should be considered as a healthy correction and keep larger bulls intact.
On the other hand, firm break here would point to deeper correction.
Res: 159.70; 160.00; 160.19; 160.87.
Sup: 158.66; 158.25; 157.87; 157.38.
Bitcoin’s Attractive Drop
Market Picture
The cryptocurrency market was falling to a total capitalisation of $2.2 trillion at the end of the day on Monday but managed to add over 2% to the lows, recovering to $2.25 trillion, down 0.5% from the day before.
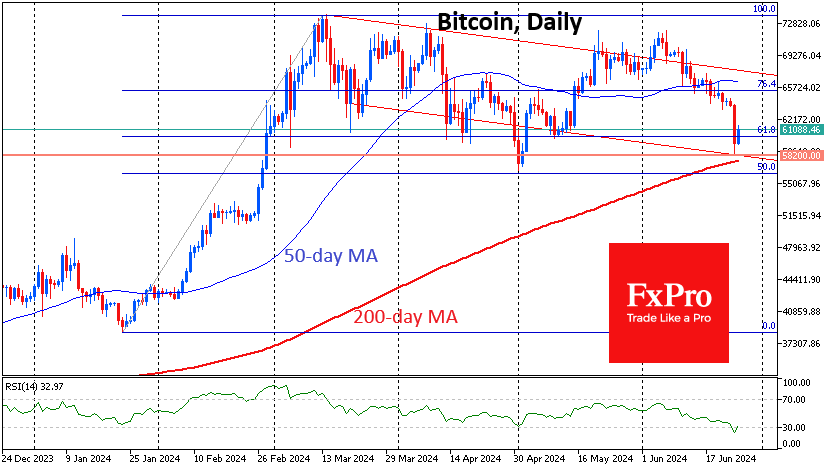
The technical picture in Bitcoin is almost perfect. The low price of $58.2K coincided with the lower boundary of the descending range, was as close to the 200-day moving average as possible, and almost duplicated the impulsive lows of early May. On the daily charts on Monday, BTC closed in the oversold RSI area, and today, it is already trying to get out of it. All this looks like a tempting signal to buy this dip. However, it may well turn out to be a bull trap, although we give less priority to such a scenario.
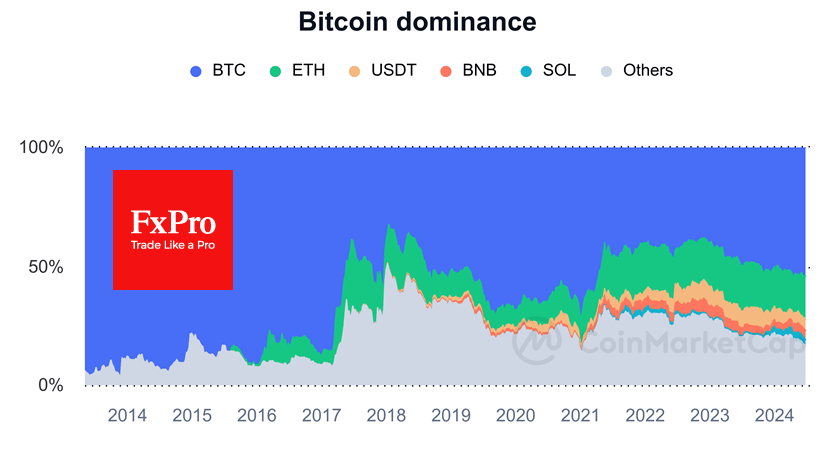
Bitcoin’s share of the total crypto market capitalisation is near 54%. Since March, there has been an acceleration in the decline of the share of “other” coins, as buyers’ interest has focused on the leading coins. Such dynamics are typical signs of the first half of the 4-year cycle in Bitcoin, and sustained interest in altcoins may not come until next year.
News background
Bitcoin fell below $60,000 amid news of the Mt.Gox payout. The trustee of the bankrupt 2014 exchange, Mt.Gox, announced plans to begin paying out compensation in Bitcoin, Bitcoin Cash and cash in early July. Mt.Gox is expected to distribute more than $9 billion in assets by 31 October 2024.
According to CoinShares, investments in crypto funds fell by $584 million last week after an outflow of $600 million a week earlier; the two-week decline came after five weeks of inflows. Bitcoin investments were down $630 million; Ethereum was down $58 million.
According to Deribit, the options market has been betting on Ethereum, which will rise to $4,000 by September.
Block CEO Jack Dorsey said he sees Bitcoin not just as a currency but as the dominant global reserve asset that could topple the U.S. dollar.
Cryptocurrency and NFT holders in The Open Network (TON) ecosystem have faced massive phishing attacks to steal assets. Malicious links and malicious bots are being spread in Telegram groups, particularly under the guise of airdrop announcements.
CADJPY Aims for April’s Multi-Year High
- CADJPY surpasses key resistance levels, but enters overbought zone
- Next resistance at 117.93; support at 115.80-116.00
- Canadian CPI inflation due for release at 12:30 GMT
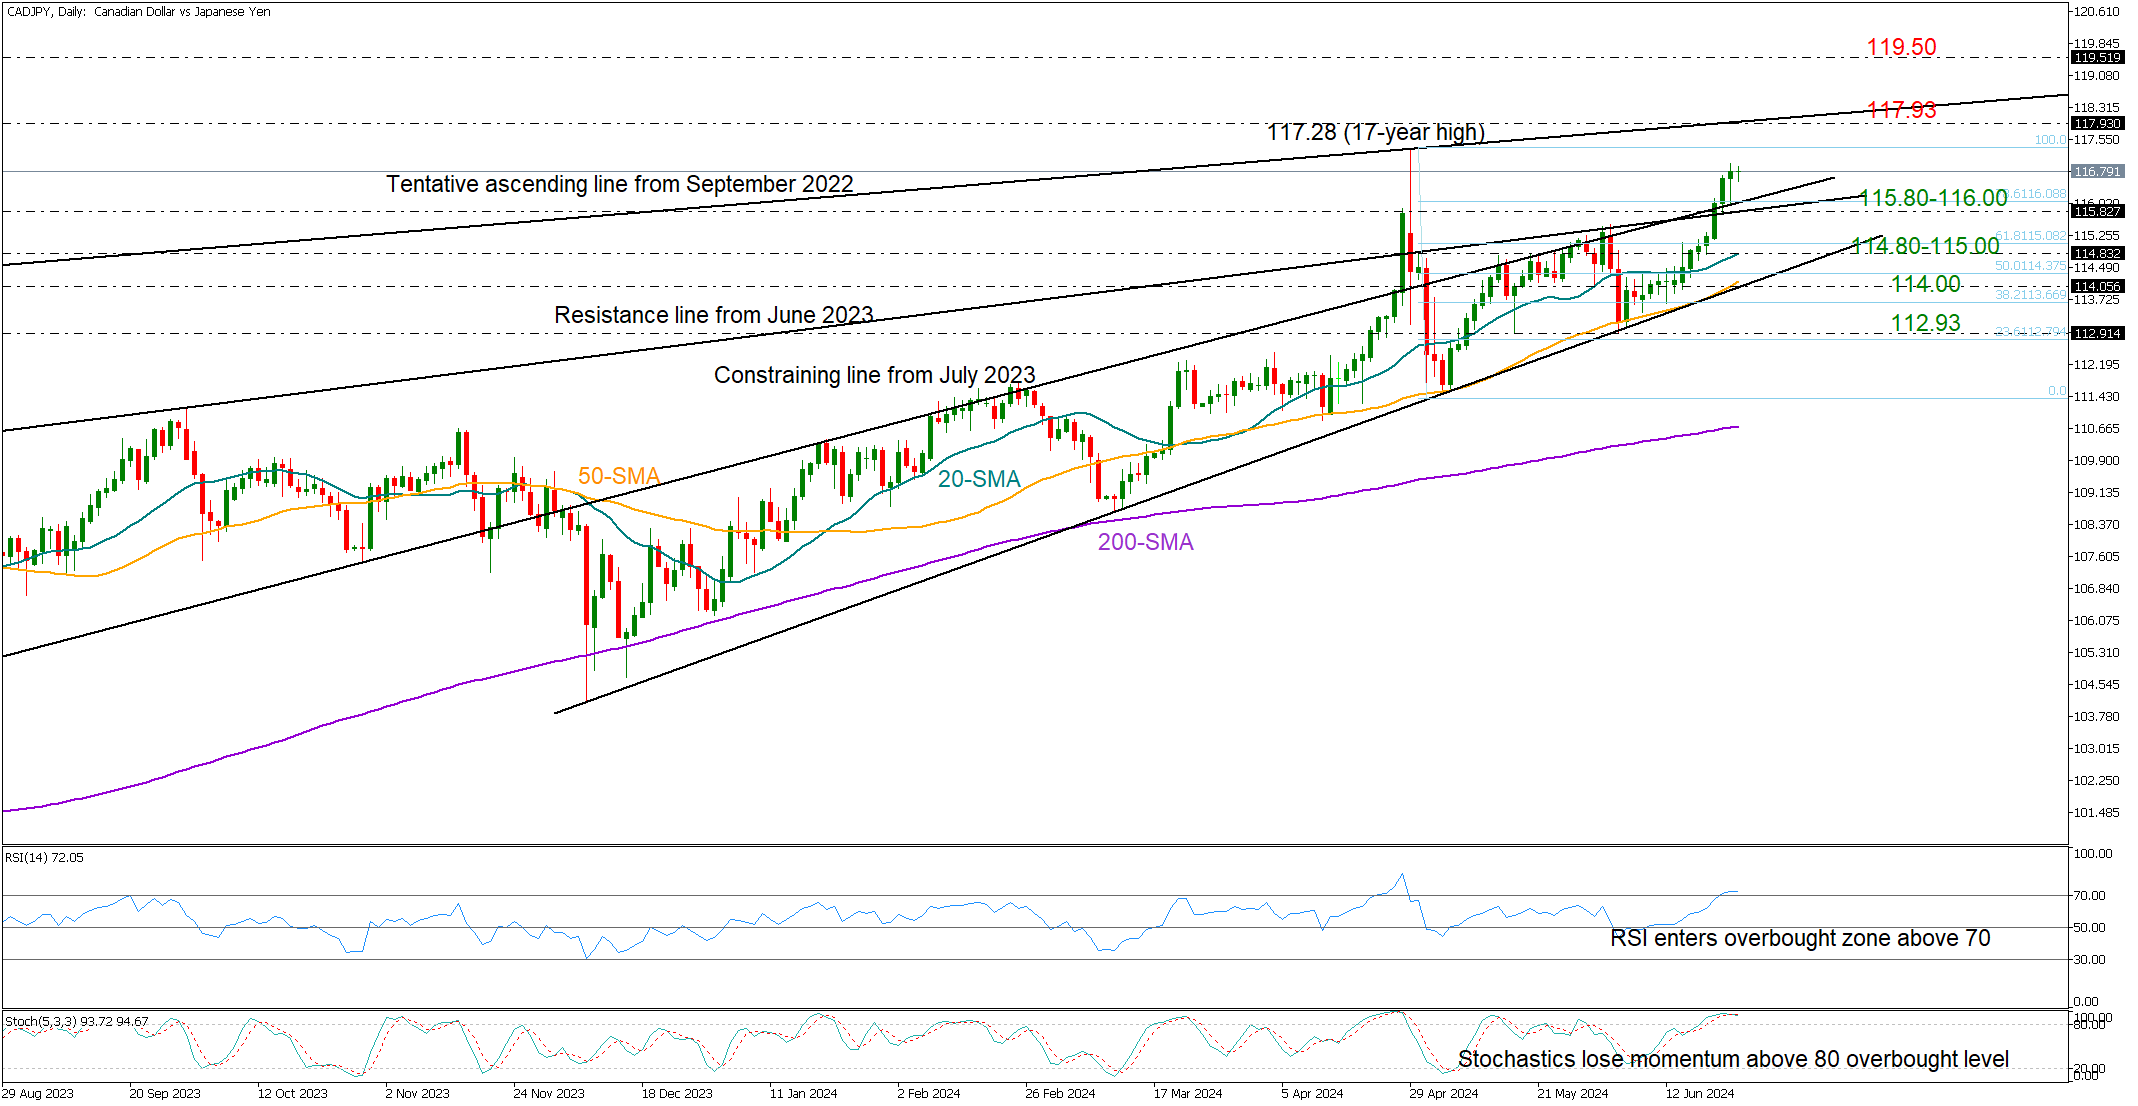
CADJPY is in the third consecutive week of gains, having experienced an impressive rally to almost reach the 117.00 round level following the rebound near the 50-day simple moving average (SMA) at 113.20.
The bulls accelerated successfully above April’s closing price of 115.78 last Friday, surpassing the constraining lines from the summer of 2023. The focus is now on the 117.28 top and the ascending line, which connects the 2022 and 2024 highs at 117.93. A move higher could take a rest near the 119.50 barrier taken from October-November 2007, while a steeper increase could halt near the 121.00 round mark, where the 161.8% Fibonacci extension of May’s sharp downfall is located.
Based on the RSI and stochastic oscillator, the market is in an overbought state. Hence, the bulls might have limited room for improvement, though only a step below the 115.80-116.00 region could give the lead to the bears.
If the price tumbles below 115.80, the decline could stretch into the 114.80-115.00 territory, where the 20-day SMA is located. A step lower could then re-challenge the key 50-day SMA and the long-term support trendline at 114.00, a break of which could cause an aggressive downfall towards the 112.93 base.
Despite trading within bullish territory, CADJPY’s recent price surge might encourage some investors to take profits. A break below 115.80 could neutralize the short-term outlook again.
Gold Reverses Back Below 50-day SMA
- Gold retreats after unsuccessful break above 50-day SMA
- The price extends its structure of lower highs
- Momentum indicators turn bearish
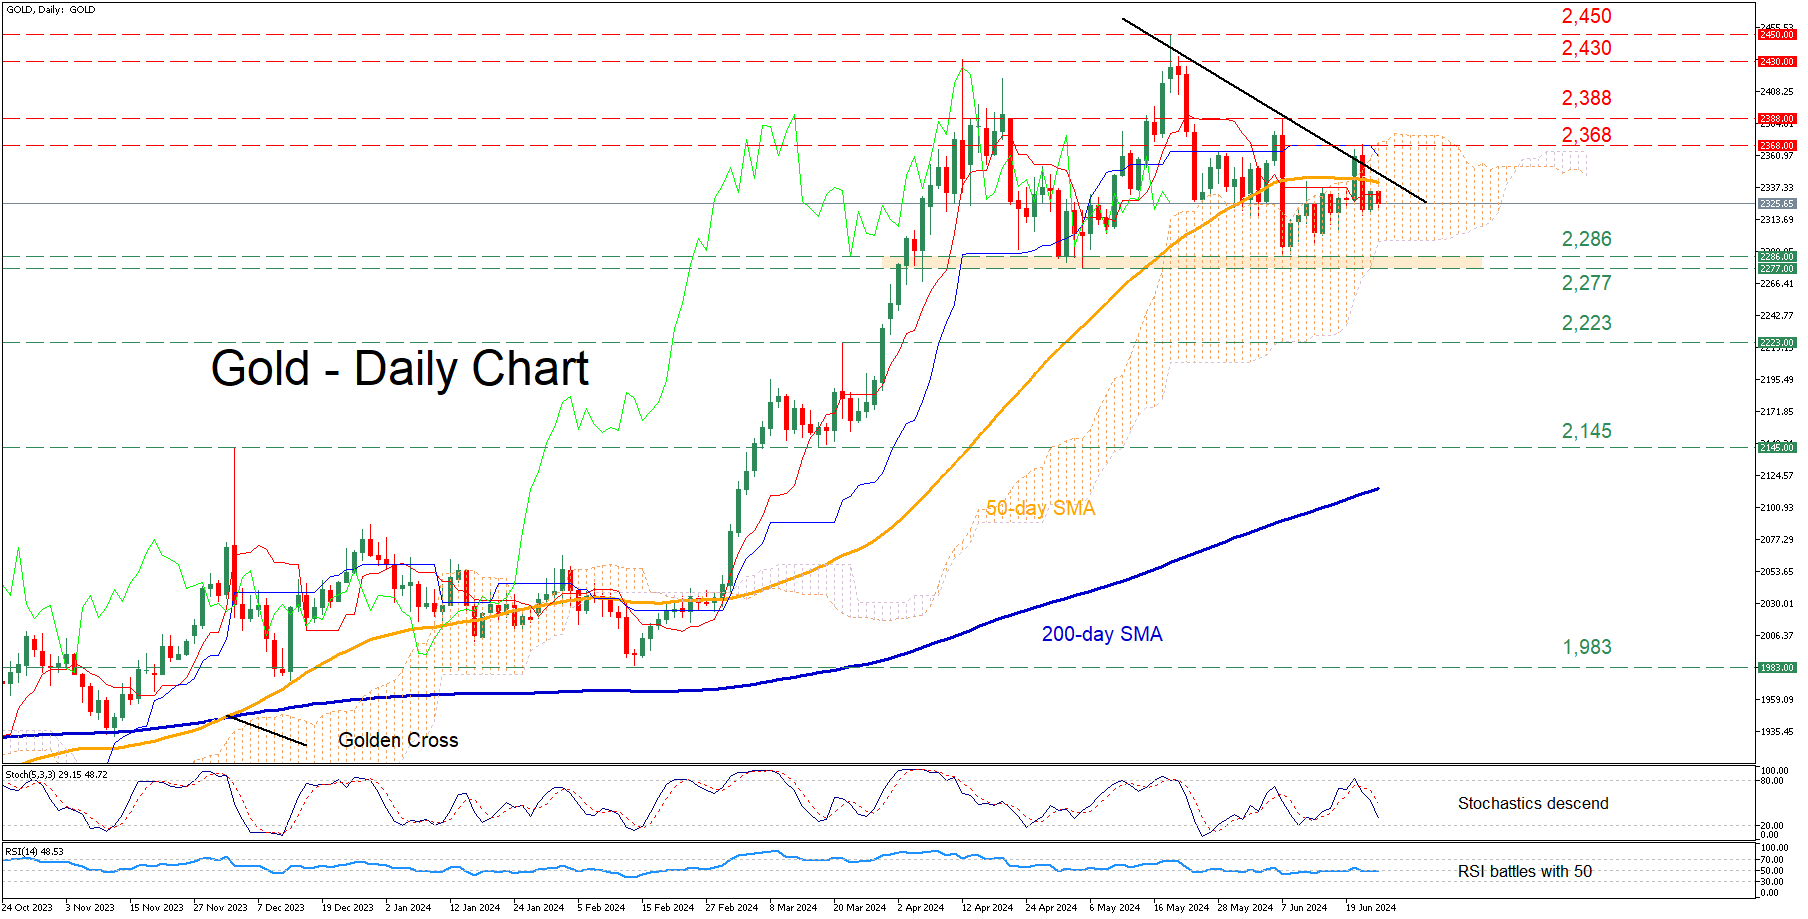
Gold had been in a steady recovery from its recent one-month low, which led to the price closing above its 50-day simple moving average (SMA) last Thursday. Despite the violation of that crucial hurdle, bullion reversed back lower after failing to jump above the upper end of the Ichimoku cloud.
Should the latest weakness persist, initial support could be found at the 2,286-2,777 range, defined by the May and June lows. Sliding beneath that zone, the price could challenge the March resistance of 2,223, which could serve as support in the future. Further declines could then stall at 2,145, a region that has acted both as support and resistance in recent months.
On the flipside, if the price rotates back above the 50-day SMA, the latest rejection region of 2,368 could prove to be the first barricade for the bulls to overcome. Higher, the June peak of 2,388 may prevent further upside attempts ahead of the April high of 2,430. Failing to halt there, the price might revisit its record high of 2,450.
In brief, gold dipped below its 50-day SMA, extending its structure of lower highs. Therefore, a solid move above the restrictive trendline drawn by connecting these lower highs is needed for the price to escape its short-term bearish pattern.
Japanese Yen Technical Outlook: USD/JPY, EUR/JPY & GBP/JPY
- FX intervention chatter returns, but is it enough for the ailing JPY?
- USD/JPY at psychological 160.00 handle.
- EUR/JPY prints morningstar candlestick pattern, hinting at the potential for further upside.
Fundamental Overview
The Japanese Yen continues to tread water against its G 7 peers as its monetary policy stance continues to be scrutinized. Many analysts, myself included, had hoped for a bold approach from Bank of Japan (BoJ) Governor Ueda at the June meeting of the BoJ.
The Governor however opted to remain cautious given the existential risks which have become a hot topic for central banks globally. Following a swathe of Central Bank meetings in June, the one commonality seems to be the uncertainty from the global geopolitical sphere, which many central banks see as the main risk for the second half of 2024.
Since the BoJ meeting in June, the Japanese Yen has come under renewed selling pressure. FX intervention has been used in the past by the central bank, but this doesn’t seem to have a lasting impact anymore.
Comments from policymakers and Japanese officials have had a similarly lackluster impact of late. Thus the comments this morning from top FX diplomat Masato Kanda is unlikely to rescue the ailing JPY. Mr Kanda stated authorities are prepared to step in to support the Japanese yen 24 hours a day, if necessary, the Yen was trading below 160 per US dollar and remains there for now. This was followed by comments this morning from Moody’s Analyst Christian De Guzman, who stated that the BoJ is likely to take time raising interest rates. Another hint that market participants may be in for a bumpy ride when it comes to the Japanese Yen in the coming months.
The Week Ahead: Japanese and US Inflation Data
Looking ahead to the rest of the week, there is a fair bit of data which could have an impact on Japanese Yen pairs. Most notably the US PCE data (Federal Reserve’s preferred inflation gauge) and of course the Japanese unemployment rate and Tokyo inflation numbers. ANy increase in the PCE number or a print above estimates could lead to US dollar strength as market participants may view it as a sign that rates may remain higher for longer.
The Japanese unemployment data may prove key as one of the sticking points for BoJ Governor Ueda has been improving wage growth. A rise in unemployment may signal that wage growth may remain stagnant while a drop in unemployment could be seen as signs of a tight labor market which usually results in upward pressure on wage growth.
Finally, geopolitics remains a significant focus, and this week could be pivotal for developments in the Middle East. Any increase in tensions between Israel and Hezbollah might drive investors toward safe-haven assets. Additionally, the week concludes with the first round of the French Parliamentary elections which could have a lasting impact on the Euro and by extension EUR/JPY moving forward.
Japanese Yen Technical Outlook
USD/JPY
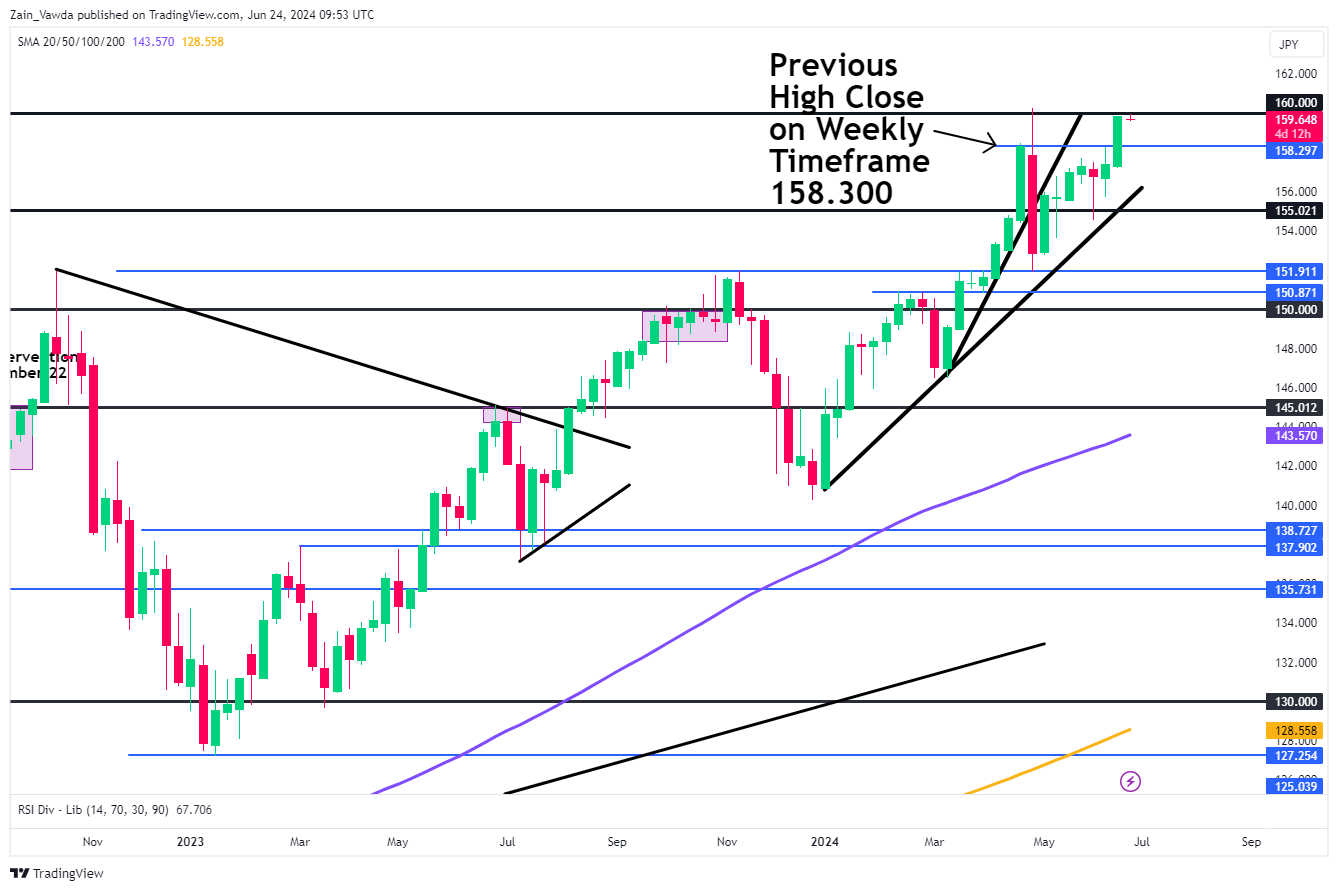
Looking at USDJPY from a technical perspective, the weekly chart below shows a very bullish close last week with no wick to the upside. This is usually a sign of the momentum in play and this is also the first time the weekly candle has closed above 158.300 (the previous weekly candle high close).
USD/JPY Weekly Chart – June 24, 2024
Source: TradingView.Com (click to enlarge)
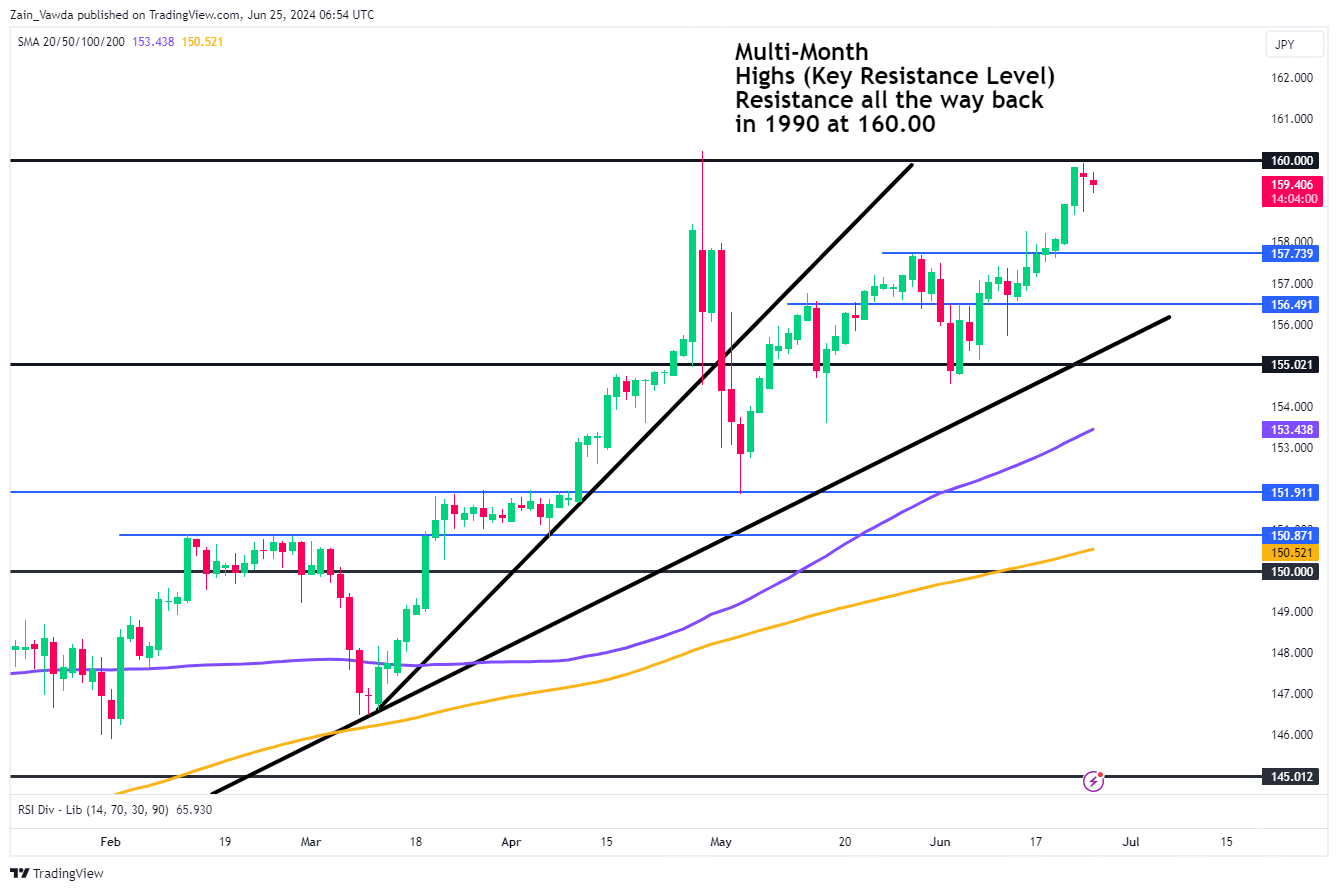
Dropping down to the daily timeframe and here it is a bit more indecisive. Despite ending the previous week on a bullish note, Sunday saw USD/JPY gap down at the market open. This has been followed by a gradual push lower throughout the early part of the European session, thanks in large part to US dollar weakness rather than intervention hopes.
Looking ahead and should USD/JPY continue to fall, immediate support rests at 158.300 with the next key area of support resting at 157.739. A break of these levels opens up a test of 156.50 and of course the psychological 155.000 handle.
To the upside, the outlook remains more uncertain as we do not have a lot in the way of historical price action to pay attention to. The first thing that needs to happen if USD/JPY is to continue higher is a daily candle close above the 160.oo psychological mark. This would be a huge milestone and could facilitate further upside for USD/JPY.
USD/JPY Daily Chart – June 24, 2024
Source: TradingView.Com (click to enlarge)
EUR/JPY
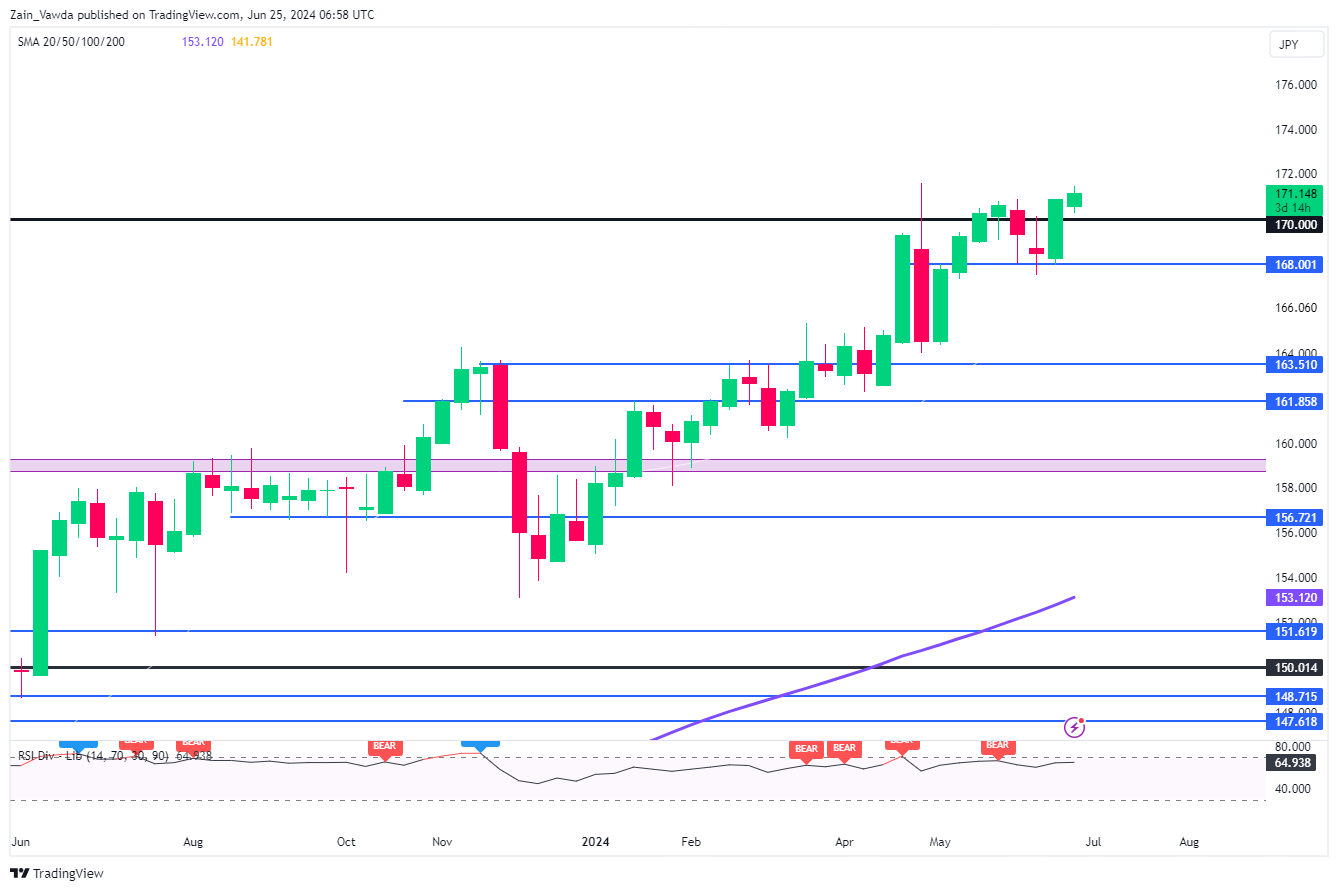
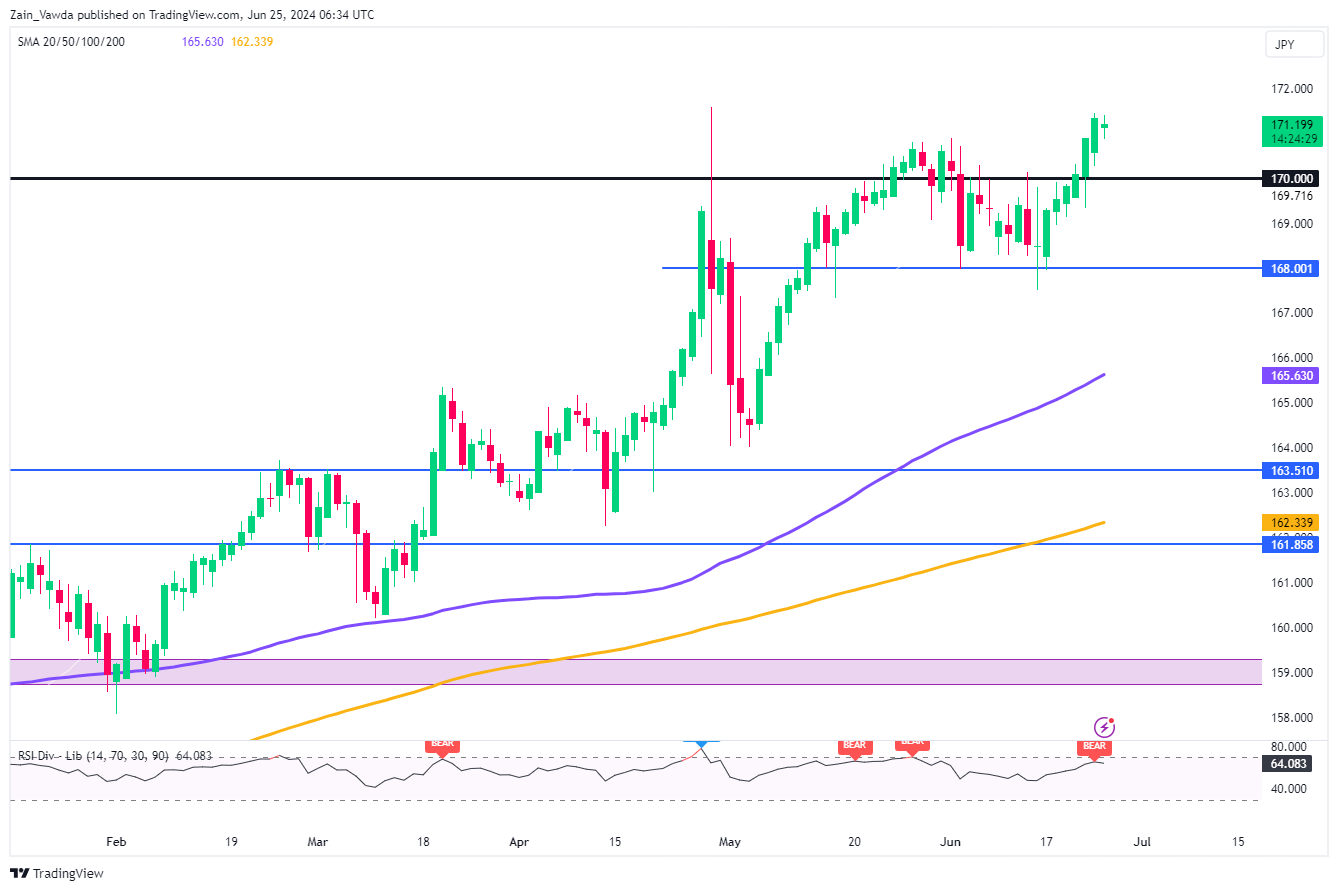
EUR/JPY on a weekly timeframe printed a bullish engulfing candle to close out last week while also closing above a key resistance level at the 170.00 handle. The weekly close looks to have a morningstar candlestick pattern hinting at further upside.
EUR/JPY Weekly Chart – June 25, 2024
Source: TradingView.Com (click to enlarge)
Dropping down to a daily timeframe and similar to USD/JPY, there is not much in terms of recent or historical price data above the 170.00 handle. Thus looking at the technical should EUR/JPY continue higher may prove challenging.
A retracement from here however, first has to navigate the 170.00 resistance now turned support area, before focus turns to the 168.00 handle and the 100-day MA at 165.63.
EUR/JPY Daily Chart – June 25, 2024
Source: TradingView.Com (click to enlarge)
GBP/JPY
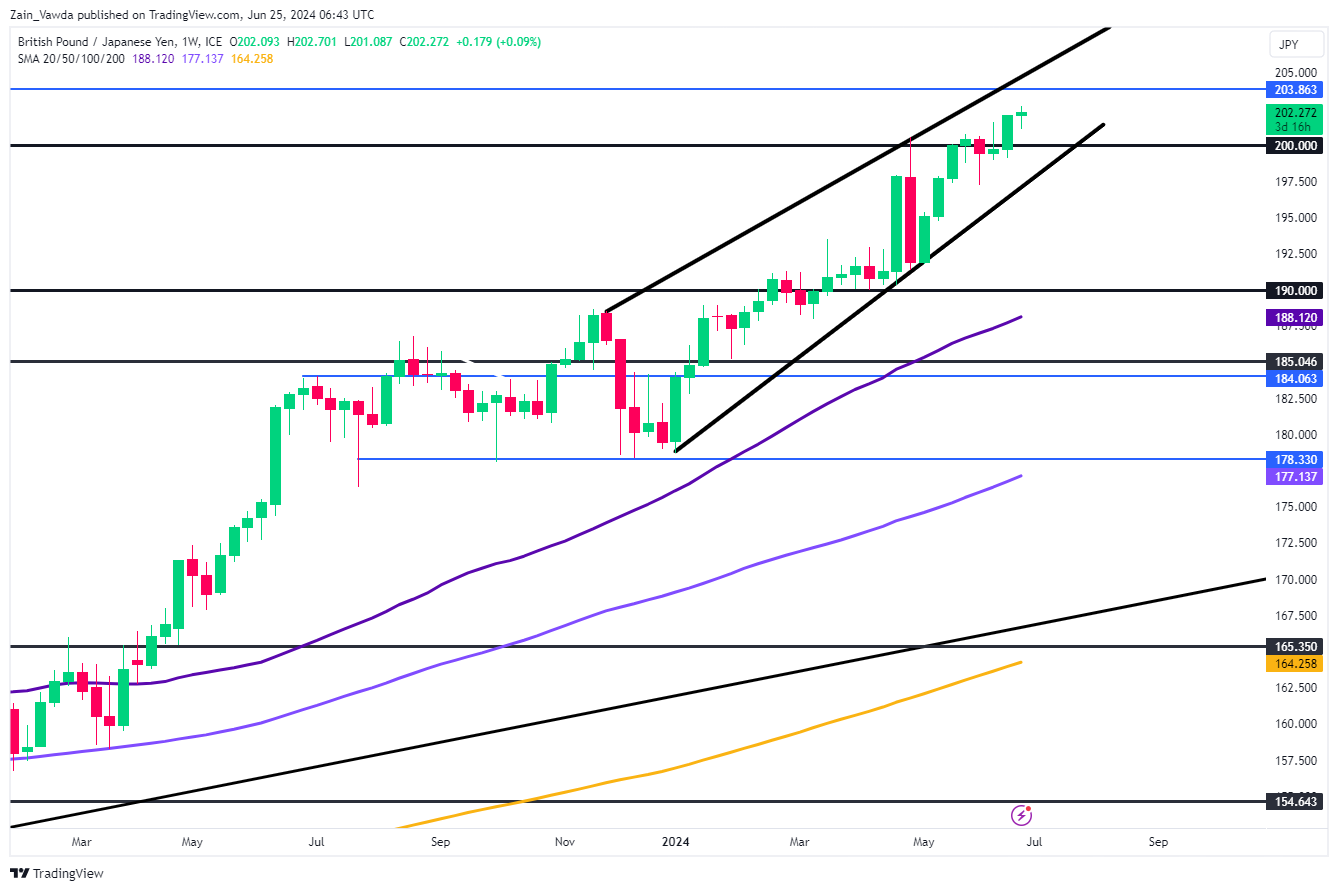
The Weekly timeframe on GBP/JPY echoes its counterparts with a bullish engulfing candle to round out last week. The weekly candle also closed convincingly above the 200.00, having done so only once previously (last week of May). This could prove significant with the engulfing candle hinting at some upside in the week ahead.
GBP/JPY Weekly Chart – June 25, 2024
Source: TradingView.Com (click to enlarge)
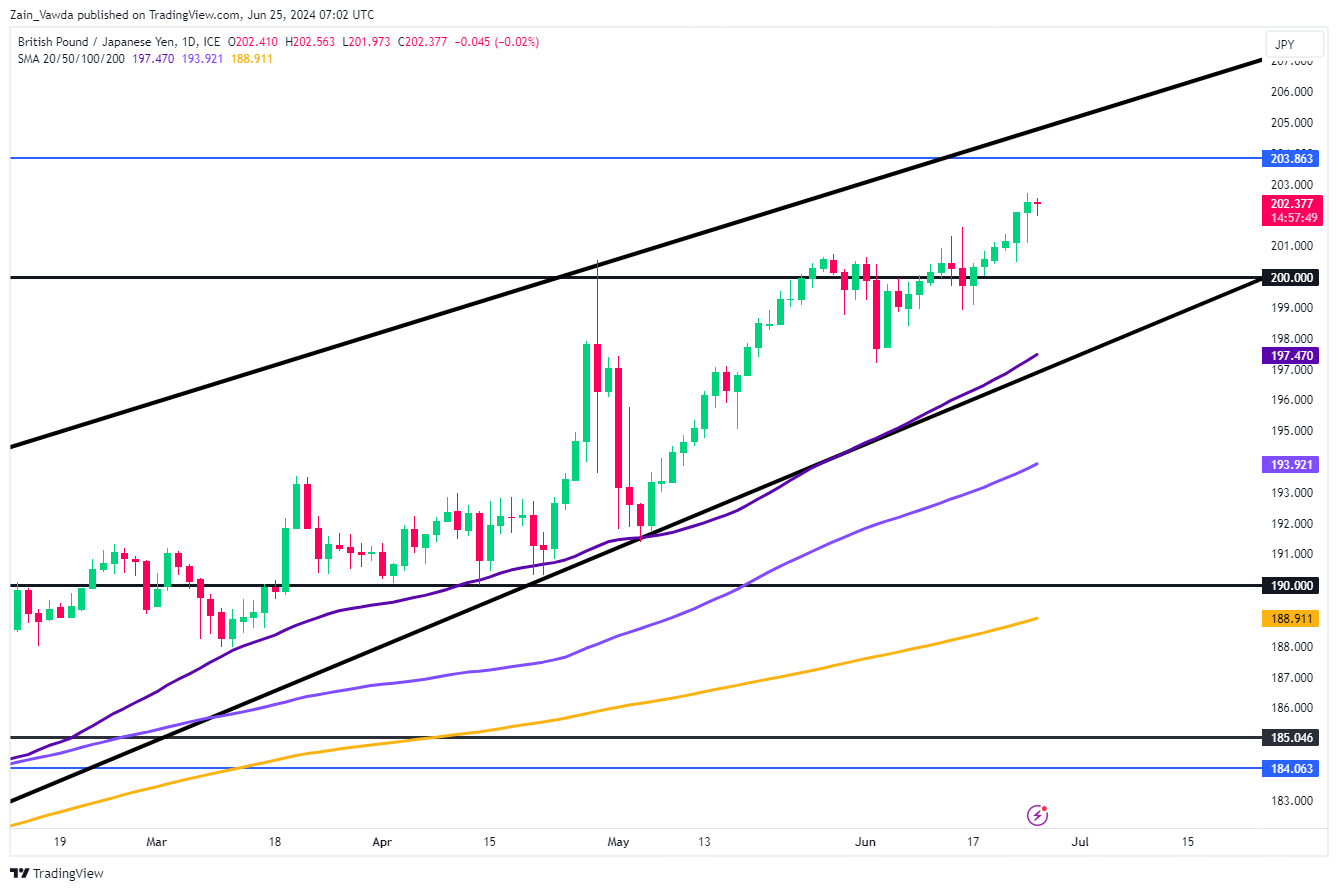
The key difference between EUR/JPY, USD/JPY and GBP/JPY is that the latter actually has some historic price action we may gauge above the 200.00 handle. Having taken a comprehensive look, immediate resistance rests at 203.86 before the psychological 205.00 handle comes into focus.
There is also a rising wedge formation in play, a break of which could lead to an extended move to the downside. A breach of 200.00 opens up a retest of the 50-day MA which rests toward the lower end of the wedge around 197.50, with the 100-day further down at 193.90.
GBP/JPY Daily Chart – June 25, 2024
Source: TradingView.Com (click to enlarge)
Dollar Declines: How Deep Could the Correction Be?
By the end of last week, the American currency traded rather mixed:
- The USD/JPY currency pair strengthened by more than 200 pips and almost tested the significant resistance level at 160.00.
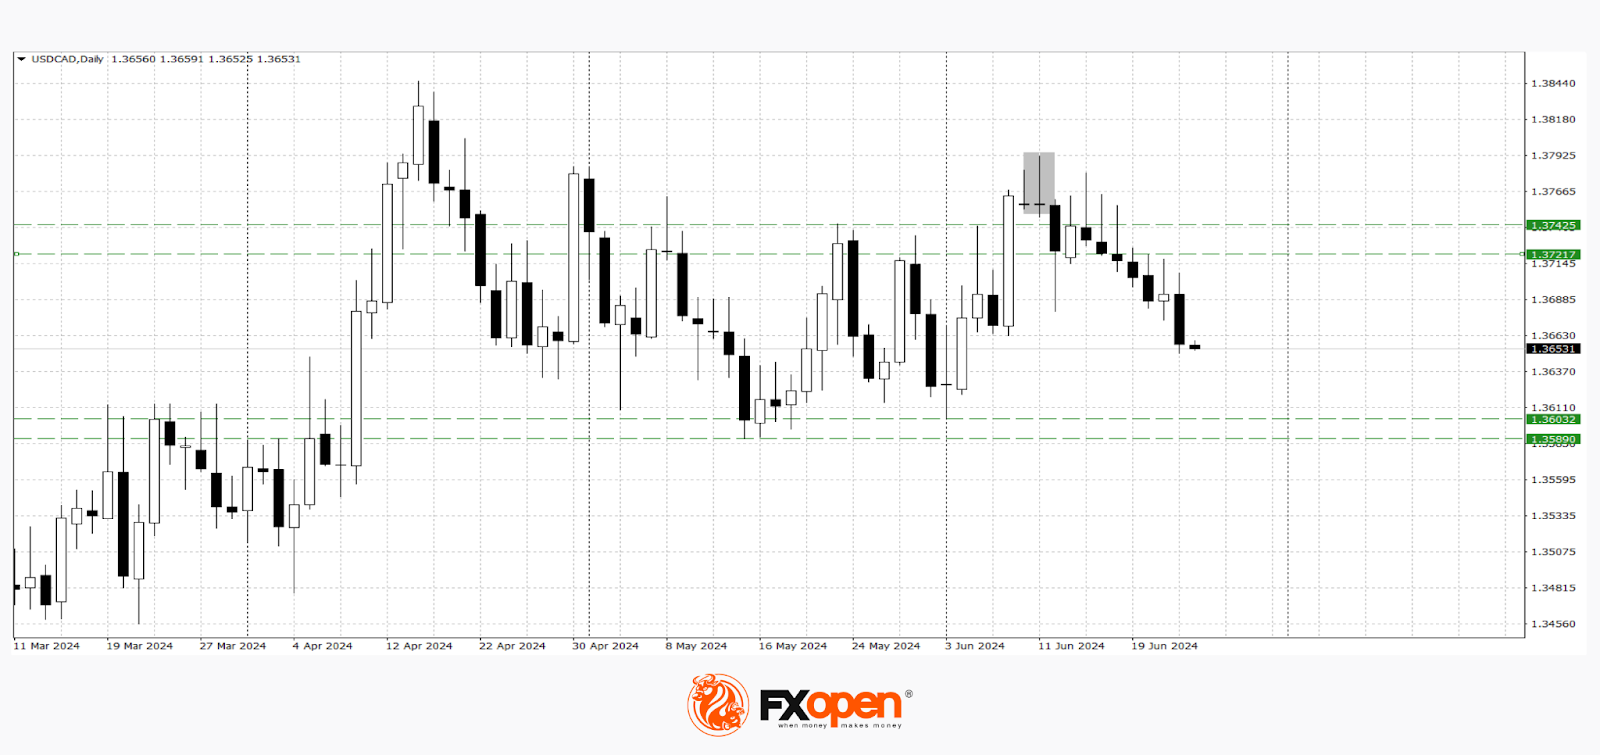
- The USD/CAD pair failed to break out of the medium-term flat corridor of 1.3740-1.3620.
- Sellers of the pound in the GBP/USD pair tried to push through the support at 1.2620-1.2600 but were unsuccessful.
However, despite recent successes, the upward momentum of dollar bulls began to slow down yesterday. In some directions, we observe a slowdown in the growth of the USD, and in some, reversal patterns have already formed.
USD/CAD
Last week, the range of 1.3740-1.3720 became a barrier to the resumption of growth in the USD/CAD pair. According to the technical analysis of USD/CAD, we observe the execution of the bearish pattern "shooting star" from 11 June. The nearest range where the price may fall within the execution of this pattern is 1.3600-1.3580. A resumption of the upward movement is possible after a confident strengthening above 1.3740. Events that could affect the pair's price formation include:
- Today at 14:00 (GMT +3:00), a speech by Michelle Bowman, a member of the US Federal Open Market Committee (FOMC).
- Today at 15:30 (GMT +3:00), the release of Canada's core consumer price index (CPI) for May.
- Today at 17:00 (GMT +3:00), the release of the US CB consumer confidence index for June.
USD/JPY
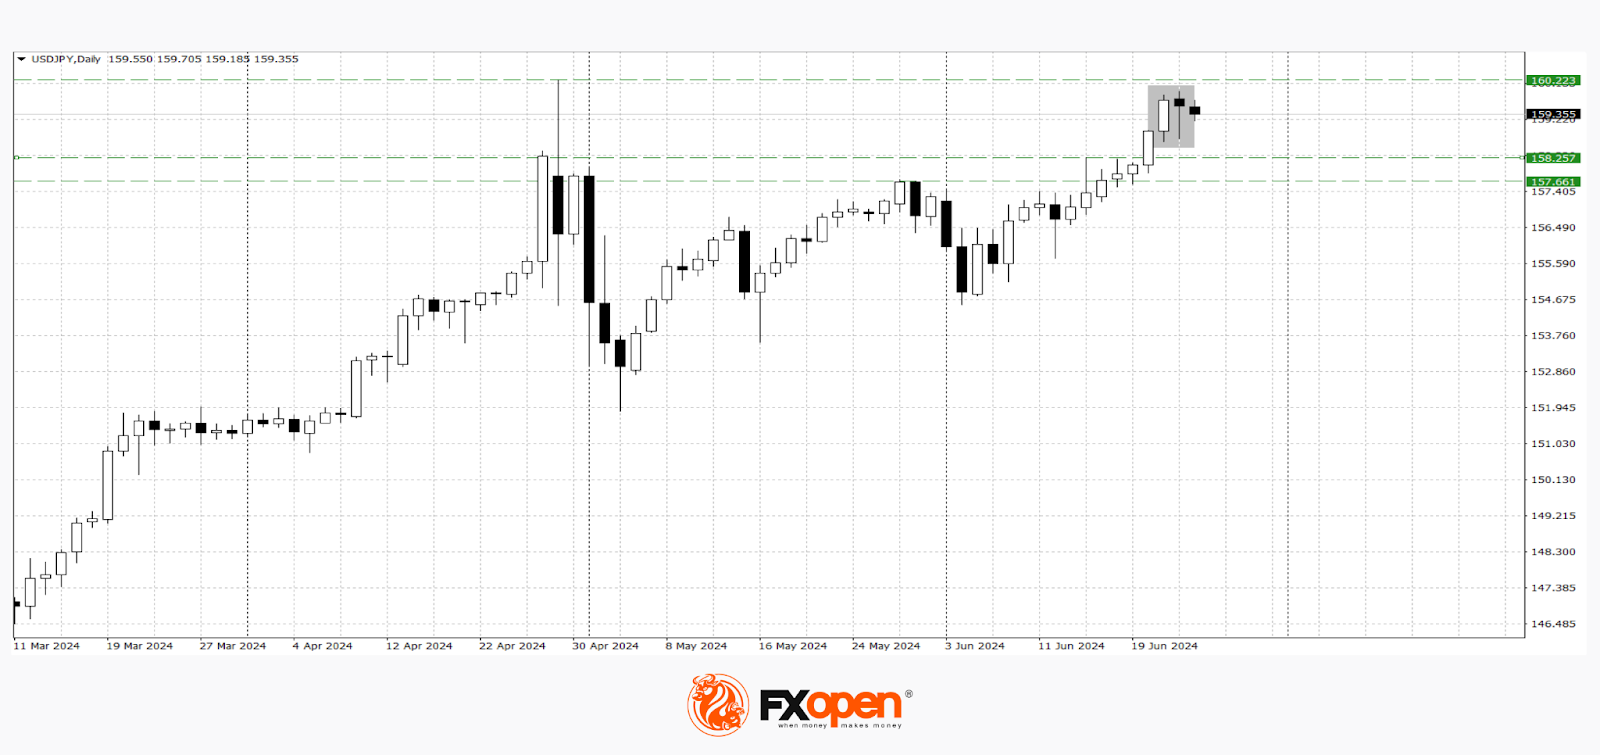
As expected, the USD/JPY pair managed to get as close as possible to 160.00, with yesterday's high recorded at 159.92. It failed to update April's high of the current year, and the price sharply bounced back from 159.92, losing over 100 pips in just a few hours.
According to the technical analysis of USD/JPY, a downward correction is possible in the coming trading sessions, as the "hanging man" pattern has formed on the daily timeframe. The execution of this pattern may contribute to a price decline towards recent lows at 158.20-157.70. A move and consolidation above 160.20 may lead to exponential growth of the pair towards historical highs.
Trade over 50 forex markets 24 hours a day with FXOpen. Take advantage of low commissions, deep liquidity, and spreads from 0.0 pips. Open your FXOpen account now or learn more about trading forex with FXOpen.
This article represents the opinion of the Companies operating under the FXOpen brand only. It is not to be construed as an offer, solicitation, or recommendation with respect to products and services provided by the Companies operating under the FXOpen brand, nor is it to be considered financial advice.
GBP/JPY Daily Outlook
Daily Pivots: (S1) 201.51; (P) 202.11; (R1) 203.09; More...
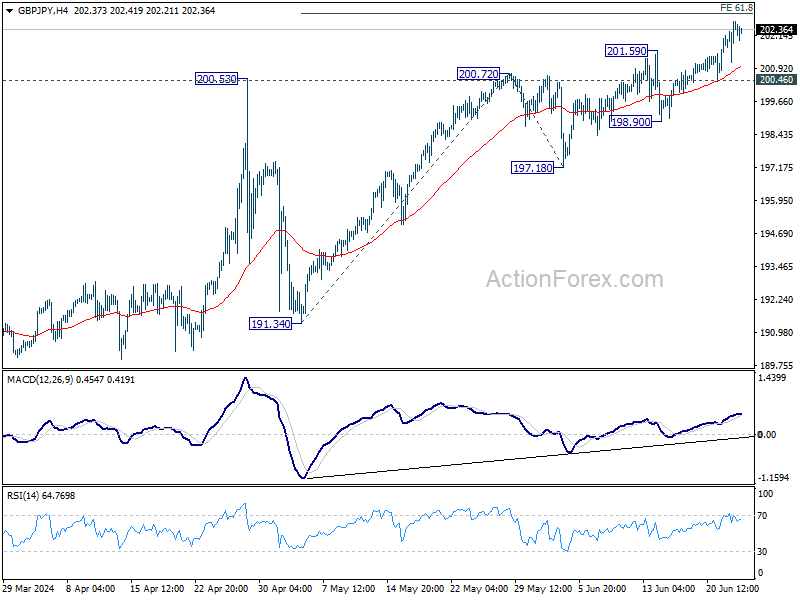
Intraday bias in GBP/JPY remains on the upside for 61.8% projection of 191.34 to 200.72 from 197.18 at 202.97. Firm break there will pave the way to 100% projection at 206.56 next. on the downside, below 200.46 minor support will turn intraday bias neutral first. But outlook will remain bullish as long as 198.90 support holds, in case of retreat.
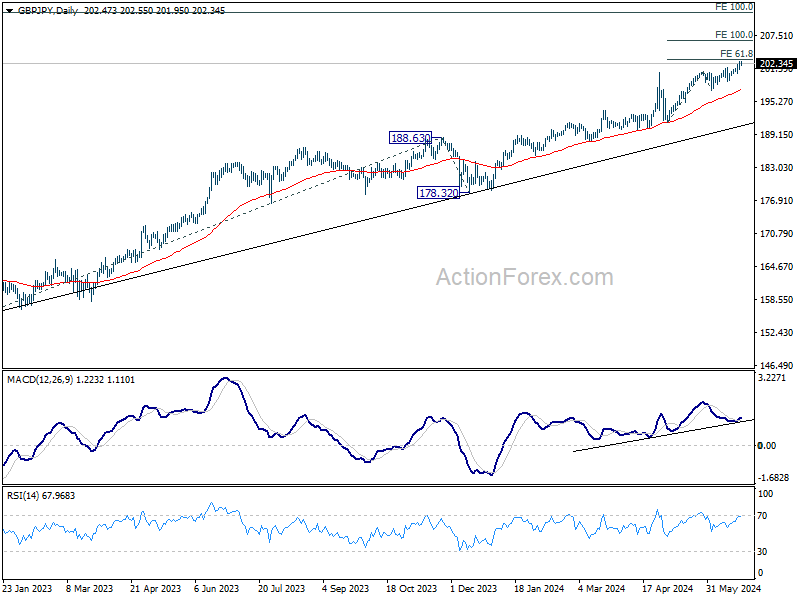
In the bigger picture, long term up trend is still in progress. Next target is 100% projection of 155.33 to 188.63 from 178.32 at 211.62. Outlook will stay bullish as long as 191.34 support holds, even in case of deep pullback.
EUR/JPY Daily Outlook
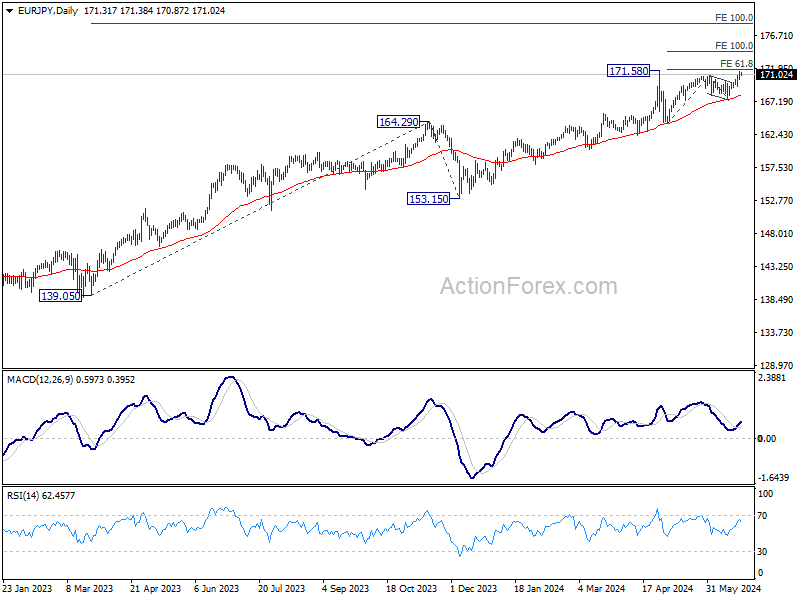
Daily Pivots: (S1) 170.60; (P) 171.03; (R1) 171.76; More...
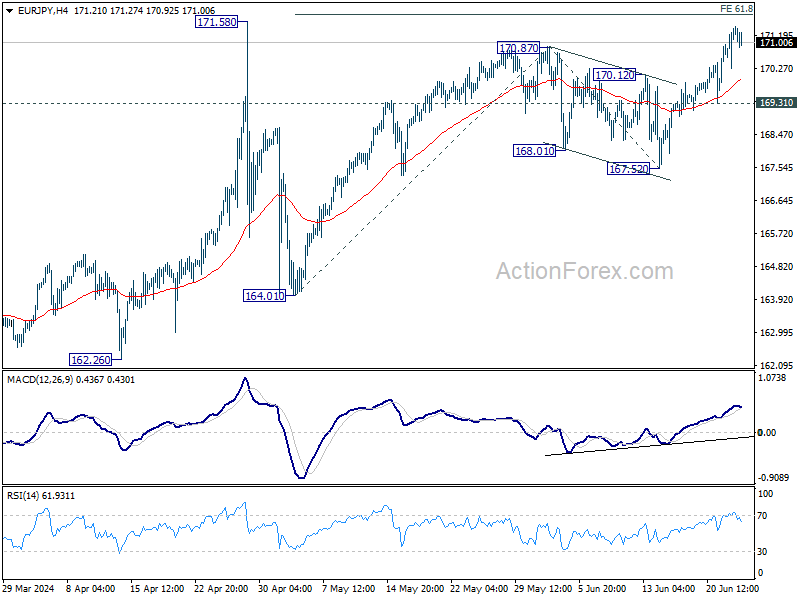
Intraday bias in EUR/JPY is turned neutral with current retreat. Some consolidations could be seen first but further rally will remain in favor as long as 169.31 support hold, for 61.8% projection of 164.01 to 170.87 from 167.52 at 171.75. However, firm break of 169.31 will turn bias back to the downside for 167.52 support instead.
In the bigger picture, strong support from 55 D EMA indicates that the long term up trend is still in progress. Decisive break of 171.58 will confirm resumption and target 100% projection of 139.05 to 164.29 from 153.15 at 178.38. For now outlook will stay bullish as long as 164.01 support holds, even in case of deep pullback.