Sample Category Title
April CPI: It’s a Start
Summary
The first CPI report of Q2 should be seen as welcome news by the FOMC. The headline CPI rose 0.3% in April, a tenth below consensus expectations, while the core CPI also increased 0.3%, in line with expectations but a downshift from the pace registered in Q1. Flat food prices and a decline in energy services prices helped to partially offset a jump in gasoline prices in the headline index. Excluding food and energy, more deflation for vehicles prices and a moderation in price growth for medical care services, motor vehicle insurance and motor vehicle maintenance contributed to the slowdown in core CPI.
Based on the April CPI and PPI data, we estimate the core PCE deflator increased 0.25% month-over-month in April. If realized, this would bring the three-month annualized and year-over-year rates to 3.4% and 2.8%, respectively. On balance, the April inflation data should help restore some confidence at the Fed that price growth is continuing to moderate through the month-to-month noise. That said, we think it will take more than just one solid CPI report to induce the first rate cut. We believe it will take at least a few more benign inflation readings for the FOMC to feel sufficiently confident to begin lowering the fed funds rate. We continue to look for the first rate cut from the FOMC to come at its September meeting, but any additional bumps in the road would likely push that timing back, absent a marked deterioration in the labor market.
Tamer Inflation Reading to Start Q2
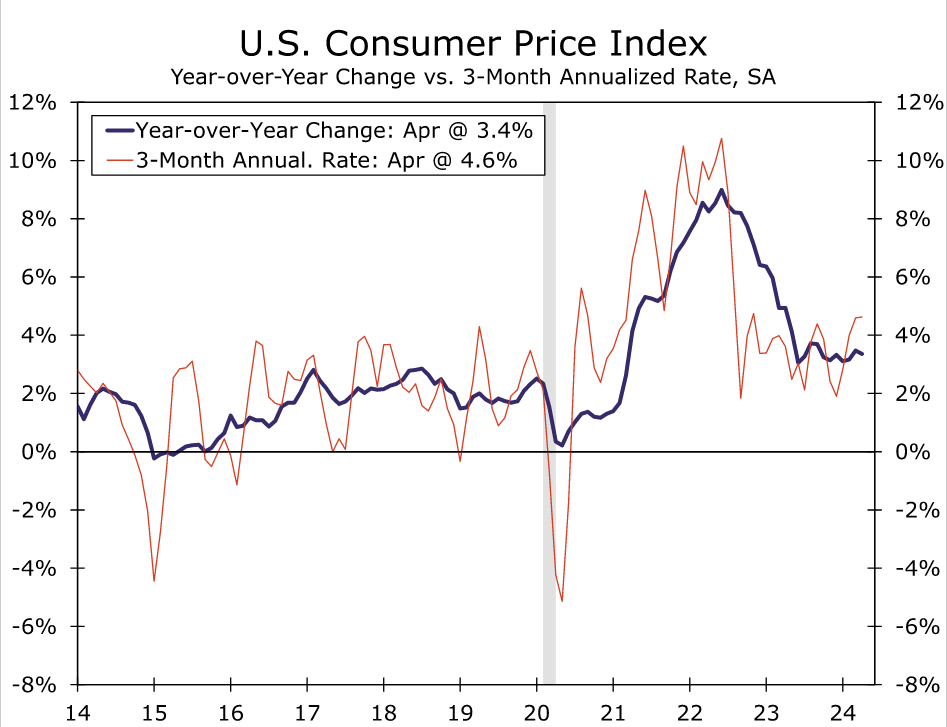
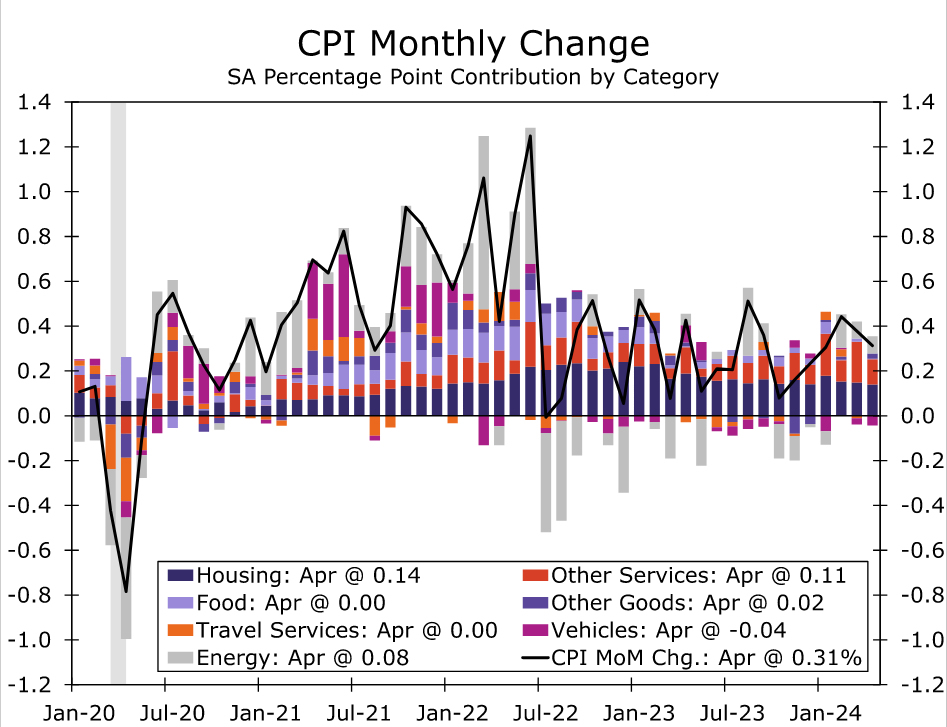
Consumer price inflation in April came in a touch softer than expected, rising 0.3% in the month against a consensus forecast for 0.4% (chart). Food prices were flat over the month as a 0.2% decline in grocery store prices was offset by a 0.3% increase in prices for food consumed away from home. Energy prices rose 1.1% in April, led by a 2.8% increase in gasoline prices. Prices at the pump climbed steadily over the past few months and have contributed to the leveling off in headline CPI inflation. A recent dip in oil prices and the early read on the May data suggest some giveback is coming in next month's CPI report. Elsewhere, energy services prices declined 0.7% on the back of a sizable 2.9% drop in utility gas services. Compared to one year ago, the CPI has risen 3.4%, a tick down from the 3.5% registered in March but still modestly above the post-pandemic low of 3.0% hit back in June 2023 (chart).
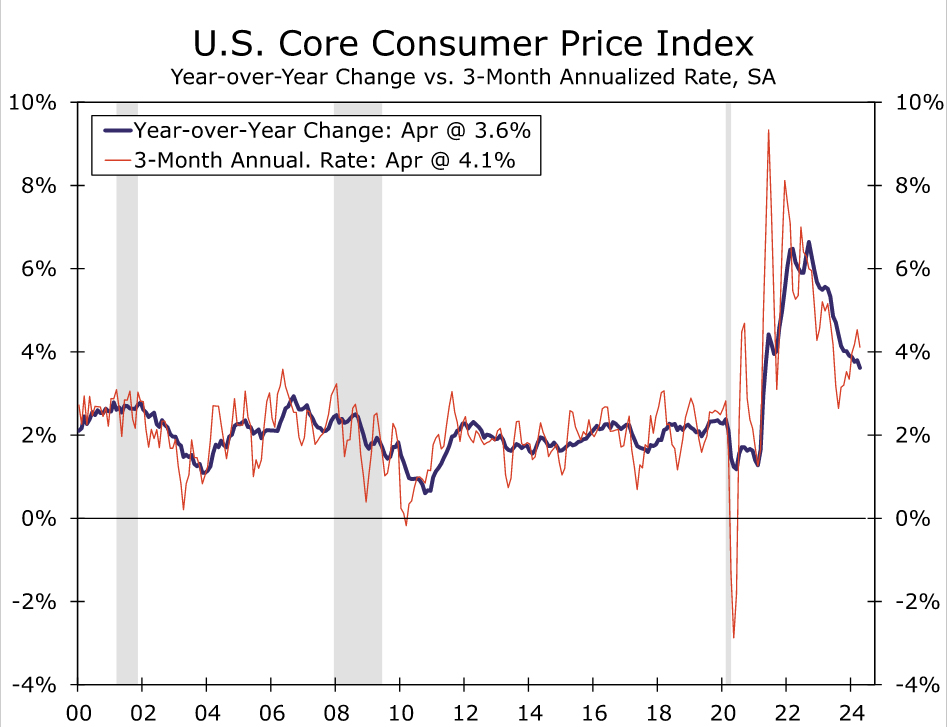
Excluding food and energy, price growth moderated in April. After three straight 0.4% gains, core CPI rose 0.3% (0.29% before rounding). On a year-ago basis, core prices are up 3.6%, the smallest increase in three years (chart).
Core goods prices continued to decline in April, falling 0.1%. Notably, the drop was driven almost entirely by new and used autos (down 0.4% and 1.4%, respectively). "Other" core goods prices rose 0.5%, which was the largest increase since August 2022 and a sign that the disinflationary impulse from the goods sector is dissipating as the tailwind from healing supply chains and elevated inventories fades. Over the past year, core goods prices have fallen 1.2%, while total goods inflation (i.e., including food and energy) is up a benign 0.3%. Whether measured on a core or total basis, the sharp slowdown in goods inflation has accounted for the bulk of the decline in inflation since its peak in the summer of 2022 (chart).
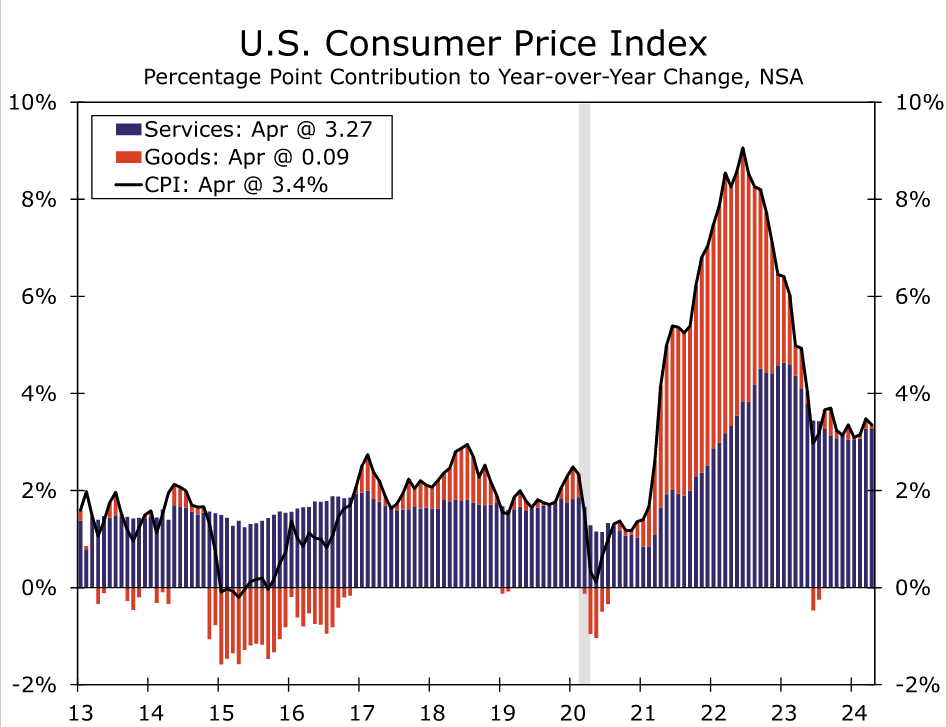
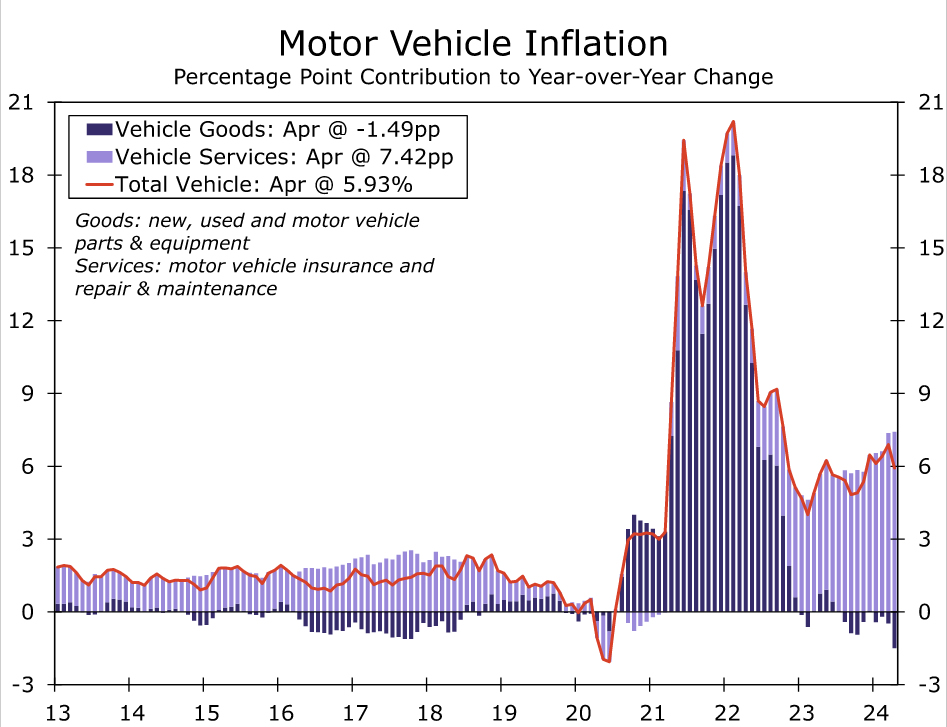
With goods inflation having returned to a pace similar to before COVID, the onus of further disinflation lies increasingly on services. Prices for services ex-energy have risen 5.3% over the past year compared to an average annual rate of 2.8% from 2015-2019. The April CPI showed inflation in the service sector easing once again, albeit at a still-painfully-slow pace. Core services prices rose 0.4% in April, returning to its Q4-23 pace. Primary shelter inflation eased somewhat further, with both owners' equivalent rent and rent of primary residences moderating to a monthly increase of 0.41%. Excluding primary shelter, services inflation cooled more materially in April, with the "super core" up 0.4% after a 0.7% gain March. Contributing to the moderation was slower growth for medical services (+0.4%) and motor vehicle insurance and maintenance. Total transportation services are up 11.2% over the past year, largely due to the 22.6% jump in vehicle insurance. However, with vehicle prices having come off their peak, we expect to see related-services price growth start to cool in the months ahead (chart).
Taking into account today's CPI data and the April Producer Price Index report, we estimate the core PCE deflator, the Fed's preferred inflation gauge, rose 0.25% in April. If realized, the core PCE index would subside from a three-month annualized rate of 4.4% in March to 3.4% in April. Relative to one year ago, we expect the core PCE deflator to remain at 2.8%. The smaller sequential increase in core PCE in April would be a step in the right direction for the Fed to regain some confidence that inflation is subsiding, but we believe it will take at least few more benign inflation readings for the FOMC to feel sufficiently confident to begin lowering the fed funds rate. We continue to look for the first rate cut from the FOMC to come at its September meeting, but any additional bumps in the road would likely push that timing back, absent a marked deterioration in the labor market.
Sunset Market Commentary
Markets
Counting down to the key US CPI release, markets clearly positioned for an outcome that kept the door open for a Fed rate cut post summer holidays. US yields already declined about 2.0-3.5 bps in the run-up to the data release. US inflation indeed printed on the softer side of expectations. Headline inflation eased to 0.3% M/M and 3.4% Y/Y (was 0.4% and 3.5% in March). Core inflation as expected slowed to 0.3% M/M and 3.6% Y/Y (was 0.4% and 3.8%). Services inflation softened to 0.4% M/M from 0.5%, as housing related costs slowed (0.2%). The super-core services inflation excluding energy and housing related services eased, but stays rather sticky at 0.42% M/M (from 0.65%). Inflation optimists can see some improvement in today’s report, but it probably won’t instantaneously change the Fed wait-and-see attitude. Still US yields extended their decline after the release, currently trading between 8.5 bps (2-y) and 6.0 bps (30-y) lower in a daily perspective. The focus today was on the price data, but disappointing retail sales (0.0% M/M headline, -0.3% M/M control group) and an unexpected decline in the Empire manufacturing index released simultaneously with the CPI report joined other recent soft activity/sentiment data and added to the bond-friendly momentum. The US 2-y yield is coming within reach of the 4.70% support touched after the US payrolls earlier this month. The 10-y yield even is at risk of breaking the 4.37% support (38% retracement rise since December low to end April top). A Fed September rate cut is now again almost 100% discounted. Bunds outperformed Treasuries this morning and still kept an advantage even after the US CPI release with yields currently declining between 7.5 bps (2-y) and 11 bps (10-y). ECB’s Villeroy today reconfirmed the ’consensus’ within the ECB to start cutting rates in June as the ECB has grown sufficiently confident that inflation will reach its 2.0% target (by next year). The easing of monetary conditions supports further equity gains. The EuroStoxx 50 (+0.2%) is nearing the April top. The S&P 500 (+0.55%) and the Nasdaq at the open even jumped to new all-time record levels. The decline in global yields reinforced the USD correction. DXY at 104.5 tested the post-payrolls low. Despite interest rate differentials moving slightly in the disadvantage of the euro, EUR/USD extended its break beyond 1.0811 resistance (currently 1.086). Even the yen rebounds with USD/JPY falling to the 155.5 area (open 156.42). A global easing of financial conditions also causes a slight sterling outperformance against the euro. EUR/GBP eases to 0.8585.
News & Views
Headline Swedish inflation accelerated from 0.1% M/M in March to 0.3% in April. Markets expected a slightly faster price gain (+0.4%) resulting in a slightly stronger deceleration in Y/Y price growth (3.9% from 4.1%). The monthly change in April was mainly due to higher prices of recreation and culture. Also, there were price increases in restaurant- and hotel visits. Actual rentals and the costs of owning a home increased in April. There were lower electricity prices and lower fruit prices. The Swedish Riksbank’s preferred price gauge, CPIF inflation using fixed interest rates) showed a similar, smaller than feared, 0.3% monthly increase with the Y/Y figure rising from 2.2% to 2.3% instead of 2.4% (consensus). Today’s inflation numbers support the Riksbank case to gradually lower the policy rate further after an inaugural 25 bps rate cut (4% to 3.75%) last week. Swedish money markets attach an 80% probability to a second move in August. The Swedish krona at EUR/SEK 11.68 was unmoved by today’s figures.
The European Commission projects 0.8% in the euro area this year in its Spring forecasts. GDP is forecast to accelerate to 1.4% in 2025. Growth is expected to be largely driven by a steady expansion of private consumption, as continued real wage and employment growth sustain an increase in real disposable incomes. A strong propensity to save still acts as a drag. Investment growth is softening dragged down by the negative cycle of residential construction. A rebound in trade is set to support EU exports, but is largely offset by an acceleration in imports. New inflation forecasts suggest a deceleration from 5.4% last year to 2.5% this year and 2.1% in 2025. Disinflation is set to be mainly driven by non-energy goods and food, while energy inflation edges up and services inflation declines only gradually, alongside moderation in wage pressures.
Graphs
US 2-y yield nearing 4.70% post-payrolls’ support as ‘soft’ US data rekindle bets for September Fed rate cut.
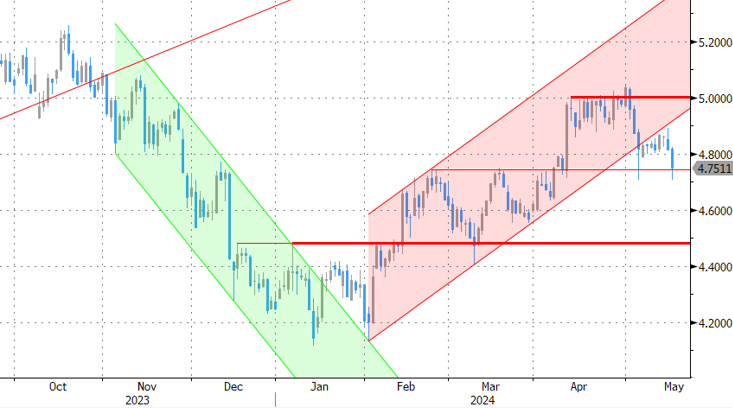
EUR/SEK: Swedish krone doesn’t decline on faster than expected disinflation as global financial conditions stay favourable.
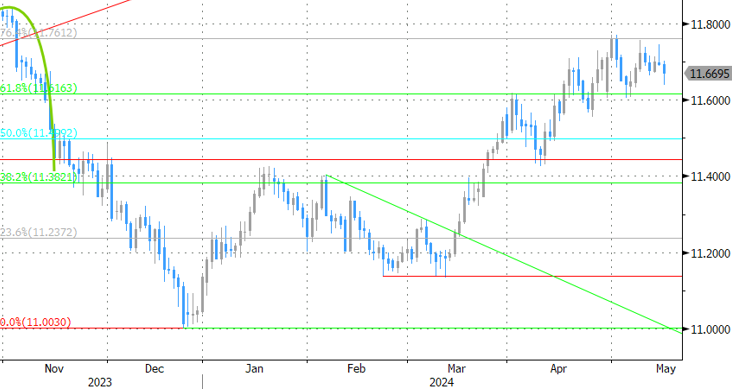
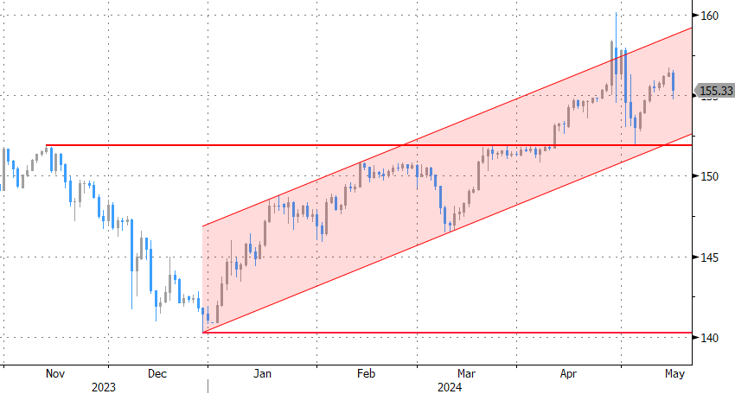
USD/JPY: yen rebounds as revival of Fed rate cut bets is pushing USD in the defensive.
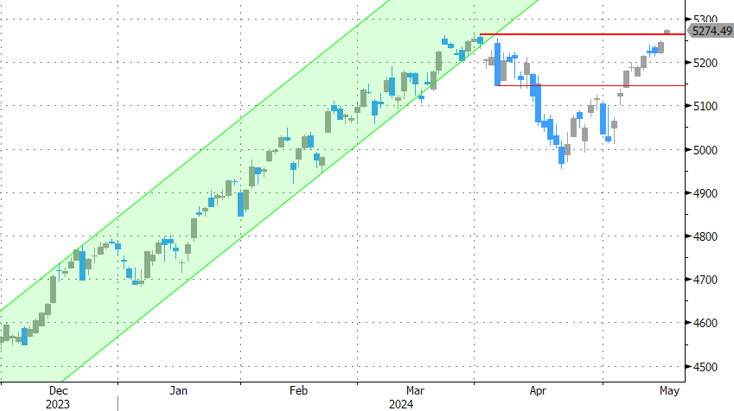
S&P 500: Easing of global financial conditions propels S&P 500 (and Nasdaq) to now record levels.
Stoxx Europe 600: What Signs of Investor Exuberance Keep Telling Us
Every day, you read news stories about the state of the economy and the stock market affecting consumer and investor behavior. The story goes something like this: When the economy and financial markets show signs of improvement, consumers start to spend more, and investors buy stocks.
But if you're a student of Elliott waves, you understand that this type of thinking is precisely backwards. It's consumer optimism and the resulting consumer spending that elevates the economic markets; and it's the investors' bullish mood that translates into a rising stock market as investors buy stocks.
Social mood, in other words, comes first. Consumer and investor behavior -- bullish or bearish -- follows.
That's why social trends can give you clues as to where the financial markets are likely heading next. For example, exuberant investor optimism often appears near major stock market tops, while deep pessimism accompanies major lows.
Let's look at a key European market as an example. Back in March, the pan-European Stoxx Europe 600 index extended its rally to seven consecutive weeks. Most investors probably saw the strength as a reason to load up on European stocks. Readers of our European Financial Forecast, on the other hand, saw warning signs of exuberance flashing throughout society.
First, Lamborghini's 2023 sales results showed an all-time record 10,112 cars sold last year. Lamborghini's electric V12 Revuelto is sold out until late 2026 -- a three-year wait! Luxury goods tend to be popular at extremes in positive social mood, as the stock market and economic prosperity approach major peaks. They tend to go out of favor when these trends reverse.
Second, a March 10 Bloomberg headline said, "One of the Most Infamous Trades on Wall Street Is Roaring Back." The trade in question was the so-called short volatility trade, where traders sell products that track stock volatility. "Investors are sinking vast sums into strategies whose performance hinges on enduring equity calm." According to data from Global X ETFs, short volatility bets nearly quadrupled in two years.
"Enduring equity calm" attitude among investors rang a bell. We had been here before. An earlier iteration of the same trade famously blew up on February 5, 2018, when the CBOE Volatility Index (VIX) suddenly spiked 20 points and destroyed vast numbers of professional and retail portfolios. The spike coincided with a global stock market sell-off and a two-and-a-half-year period of volatility that left the S&P 500 where it started. In Europe, the Stoxx 600 had peaked three years before the S&P, so the stretch of zero returns lasted nearly six years. This chart of Europe's VIX equivalent, the VStoxx Implied Volatility Index, illustrates a few of the infamous volatility spikes over the past quarter century.

In our view, the re-emergence of the short-volatility casino is a much larger version of 2018. Five years ago, traders were gambling with a little more than $2 billion within a small handful of funds. Today, a mind-blowing $64 billion is being bet using "ETFs that sell options on stocks or indexes in order to juice returns" (Bloomberg, 3/10/24). Whether they know it or not, these traders are relying on smoothly functioning markets that behave the same way today and tomorrow as they did yesterday or the day before.
The warning signs we see in investor and consumer behavior are worth heeding.
To predict the next move in European markets, I'll continue to monitor social trends for clues. But more importantly, I'll compare the Elliott wave price structures in stock market indexes to previous major junctures in those indexes. Tune in to The European Financial Forecast for my ongoing analysis, or sign up for our free newsletter, and I'll send you occasional updates like this.
This article was syndicated by Elliott Wave International and was originally published under the headline Stoxx Europe 600: What Signs of Investor Exuberance Keep Telling Us. EWI is the world's largest market forecasting firm. Its staff of full-time analysts led by Chartered Market Technician Robert Prechter provides 24-hour-a-day market analysis to institutional and private investors around the world.
US: Core Inflation Cools to Near Three-Year Low in April
The Consumer Price Index (CPI) rose 0.3% month-on-month (m/m) in April, a tick below the consensus forecast. On a twelve-month basis, CPI inflation edged lower by 0.1 percentage points to 3.4%.
- Higher gasoline prices (+2.8% m/m) were partly responsible for the uptick in headline inflation. Meanwhile, food prices were flat last month and are up 2.2% on the year.
Excluding food & energy, core prices rose a 'soft' 0.3% m/m (0.29% unrounded), meeting the consensus forecast and marking a slight deceleration from the 0.4% m/m gains registered in each of the prior three months. Relative to April 2023, core inflation was up 3.6% - down 0.2 percentage points from the March reading.
Core services prices rose 0.4% m/m, which was the softest monthly gain since last December. Shelter costs matched March's monthly gain of 0.4% and accounted for nearly two-thirds of last month's rise in core inflation.
- Price growth for non-housing services 'slowed' to a still strong 0.5% m/m gain (from 0.7% m/m in March). Both the three-and-six-month annualized rates of change on 'supercore' remain north of 6%. Motor vehicle insurance costs have been a big part of supercore inflation recently, rising 1.7% m/m and are up 23% over the past year.
Goods prices fell for a second consecutive month, with April's pullback attributed to a decline in both new (-0.4% m/m) and used (-1.4% m/m) vehicle prices as well as a further decline in household furnishings (-0.4% m/m).
Key Implications
After three months of hotter-than-expected readings, the April inflation report delivered little in the way of surprises. Thanks to a further decline in goods prices and some cooling in services price pressures, core inflation recorded its softest monthly gain of the year. However, one 'good' month does not undo Q1's string of hotter inflation readings. Both the three-and-six-month annualized rates of change on core are hovering around 4%, which is almost a percentage point higher than where they sat in December 2023.
Mapping today's release into core PCE inflation – the Fed's preferred inflation gauge – suggests we're likely to see another 0.3% m/m gain in April, which will keep the year-ago measure unchanged at 2.8%. As we noted in a recent publication, low base readings from H2-2023 will prevent the 12-month of change on core PCE from making much (if any) progress this year. However, the 3-and-6-month inflation trends are expected to gradually cool through the second half of the year and likely be in a place by late-2024 where policymakers would feel comfortable to begin dialing back the policy rate.
U.S. Retail Sales Starts Q2 on a Subdued Note
Retail sales came in flat for the month of April. Additionally, March's growth was revised downward to a 0.6 % gain (previously 0.7%). The reading was lower than the consensus forecast calling for a modest increase of 0.4%
Trade in the auto sector was down -0.8% m/m, reflecting declines both at motor vehicle dealers (-0.8%), and automotive parts and accessory stores (-0.7%).
Sales at gasoline stations rose a sizeable 3.1% m/m, extending last month's 2.1% m/m gain. This largely reflected an uptick in gas prices. The building materials and equipment category rose a more modest 0.5% m/m.
Sales in the retail sales "control group", which excludes the above volatile components (autos, building materials and gas) and is used to estimate personal consumption expenditures (PCE), pulled back on the month (-0.3%) after rising by 1.0% m/m in March (revised from 1.1% previously).
- Among the control group, the largest positive contributions came from clothing and accessory stores (1.6% m/m) and food and beverage stores (0.8% m/m).
- The largest declines were at non-store retailers (-1.2% m/m), sporting goods stores (-0.9% m/m) and health and personal care stores (-0.6% m/m).
Food services & drinking places – the only services category in the retail sales report – rose by 0.2% m/m.
Key Implications
Retail spending by consumers took a breather in April. While spending didn't fall outright, it also didn't grow, suggesting that while consumers are still spending, the momentum is waning. The pullback among the control group, adds to this view. The downward revisions to last month's numbers also erased the marginal quarterly gain for Q1 (previously +0.2% q/q annualized growth) which now stands at a -0.5% q/q annualized decline. The labor market losing some momentum in April, accompanied by slowing wage growth, likely weighed on spending for the month. This is largely in line with our expectations and is anticipated to become more pronounced as the year progresses and the labor market continues to lose steam.
Today's deceleration in retail spending is a boon to the Fed's inflation fighting program as continued moderation in consumer spending growth is key to the Fed hitting the 2% target. Moreover, it's additional good news given that the inflation print, also released today, eased in April in the first slowdown of the year. However, the sticky inflation readings of the past few months suggest the journey may be an extended one and as such, we've pushed out our rate cut call to the end of the year from July previously.
NZDUSD Rallies Beyond Downtrend Line
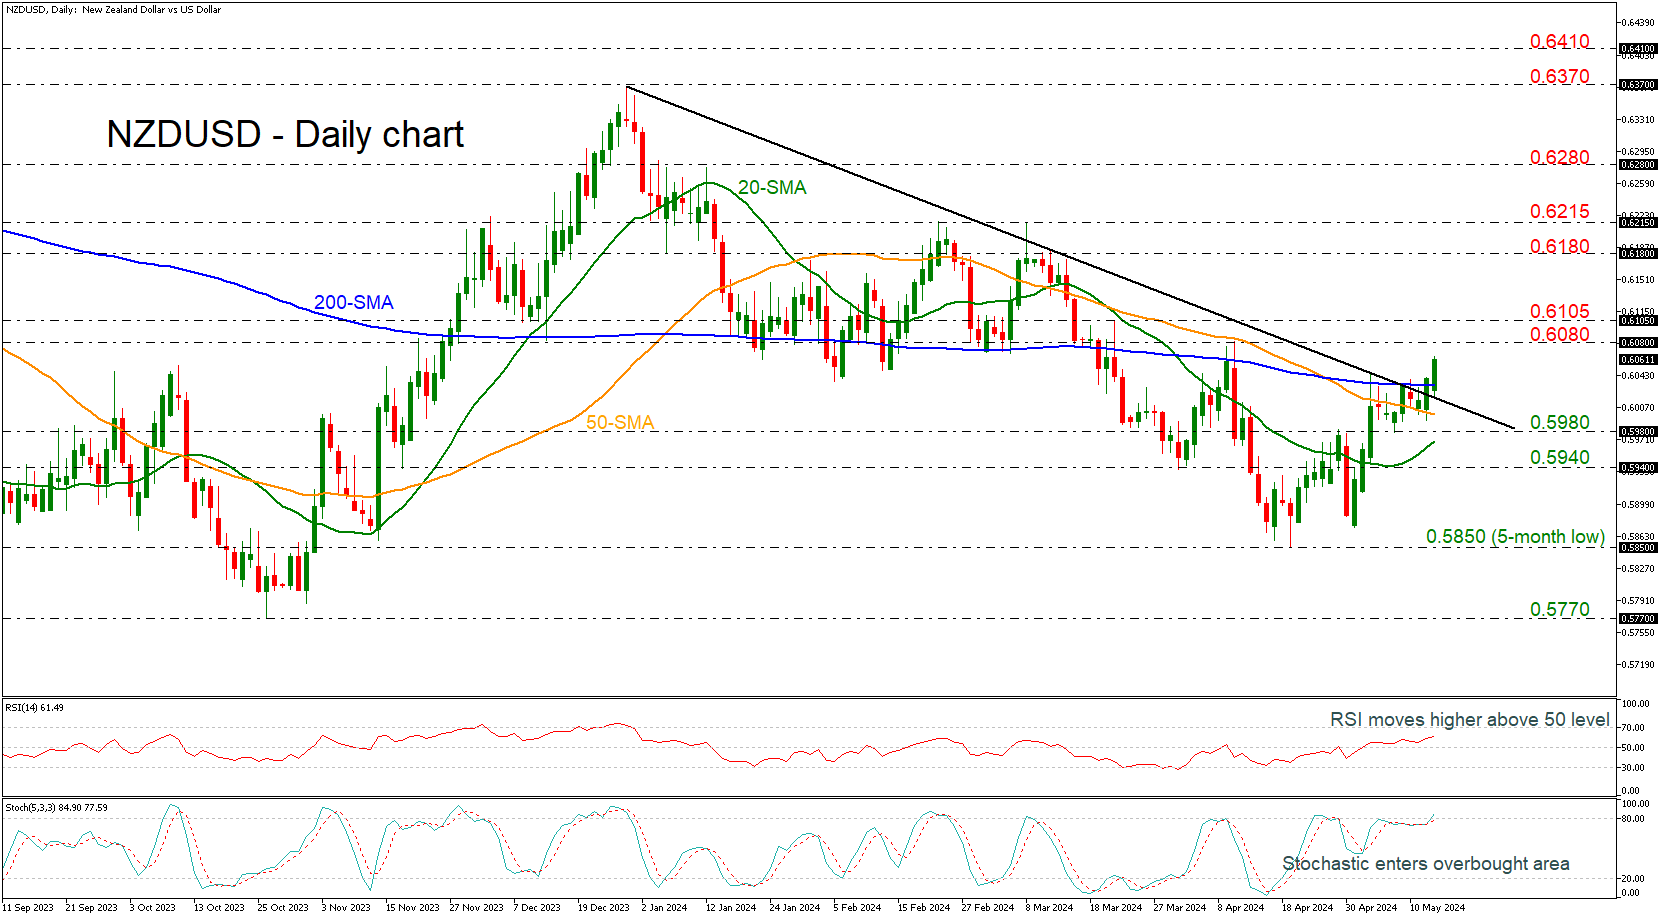
- NZDUSD rises above 200-day SMA too
- RSI and stochastics suggest more bullish moves
NZDUSD is flying above the medium-term ascending trend line and the 200-day simple moving average (SMA), indicating a potential upside recovery.
According to the technical oscillators, the RSI is heading north and is approaching the 70 level with strong momentum, while the stochastic is entering the overbought territory after the bullish crossover within its %K and %D lines.
If the market continues the buying interest, then it may move towards the 0.6080-0.6105 restrictive region. A successful rally beyond this area could drive the bulls until the 0.6180 barricade.
In the negative scenario, a move back beneath the 200-day SMA and the descending trend line could open the way towards the 50-day SMA at 0.6000 and the 0.5980 level. If the latter level is breached, this would increase the downside pressure and bring about a reversal of the upside movement that started after the bounce off 0.5850. The price may then challenge the 20-day SMA at 0.5970 and the 0.5940 support.
Overall, NZDUSD has been slightly bullish lately, but any climb above 0.6105 could endorse the upside structure in the market.
EUR/USD Mid-Day Outlook
Daily Pivots: (S1) 1.0783; (P) 1.0804; (R1) 1.0842; More...
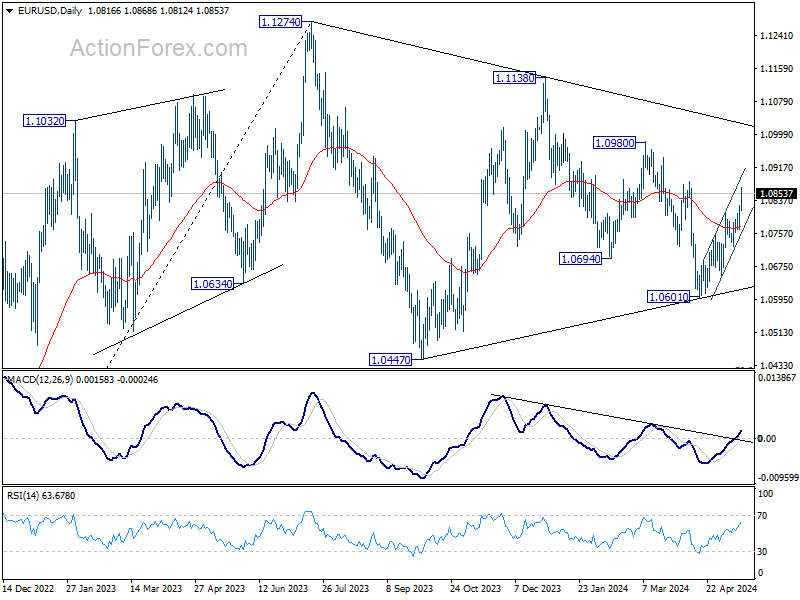
Intraday bias in EUR/USD remains on the upside as rise from 1.0601 is in progress. Firm break of 1.0884 will pave the way to 1.0980 resistance next. On the downside, below 1.0812 minor support will turn intraday bias neutral first. But further rally is expected as long as 1.0765 support holds, in case of retreat.
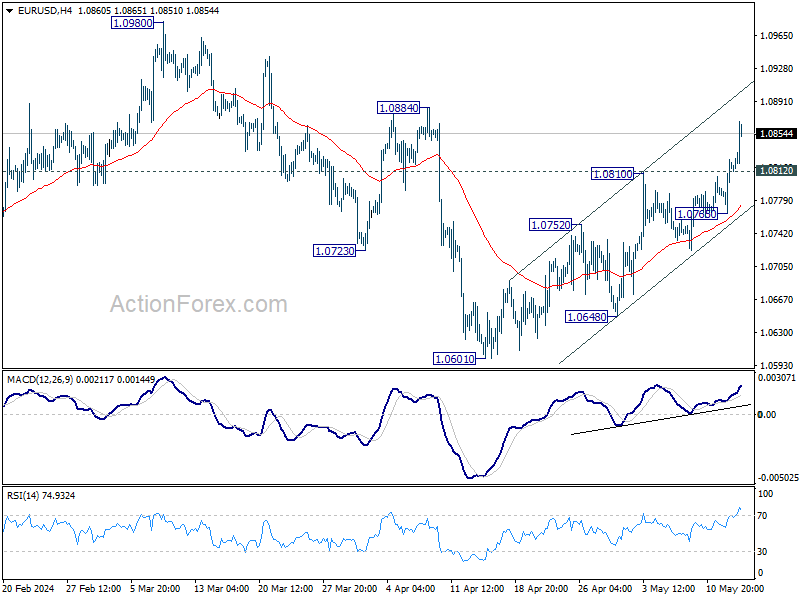
In the bigger picture, price actions from 1.1274 are viewed as a corrective pattern. Fall from 1.1138 is seen as the third leg and could have completed. Firm break of 1.1138 will argue that larger up trend from 0.9534 (2022 low) is ready to resume through 1.1274 high. On the downside, break of 1.0601 will extend the corrective pattern instead.
GBP/USD Mid-Day Outlook
Daily Pivots: (S1) 1.2538; (P) 1.2565; (R1) 1.2621; More...
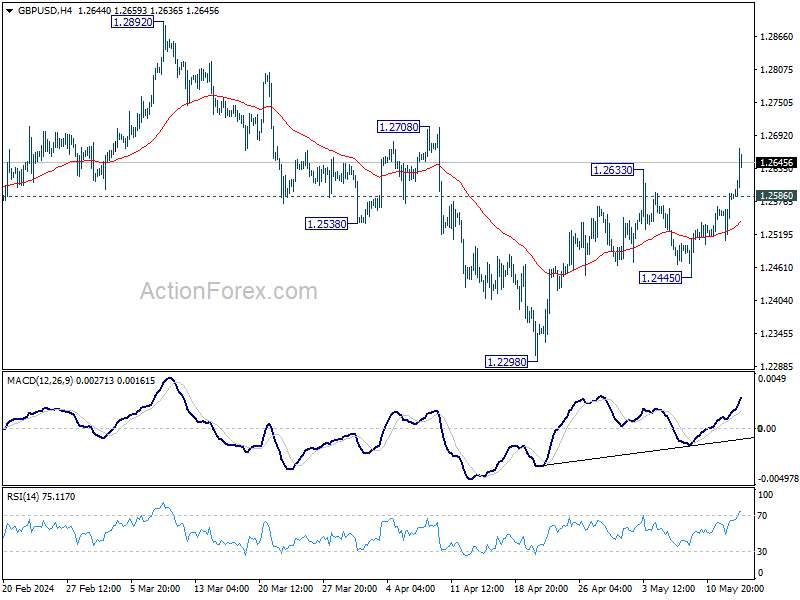
GBP/USD's rebound from 1.2298 resumed by breaking through 1.2633 and intraday bias is back on the upside. Further rise should be seen to 1.2708 resistance first. Firm break there will pave the way back to 1.2892. On the downside, below 1.2586 minor support will turn intraday bias neutral first. But further rally will remain in favor as long as 1.2445 support holds in case of retreat.
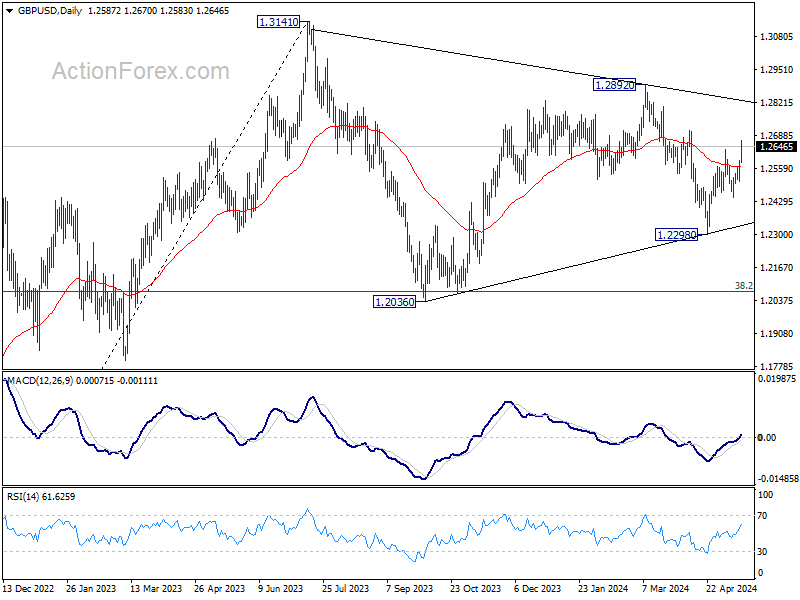
In the bigger picture, price actions from 1.3141 medium term top are seen as a corrective pattern. Fall from 1.2892 is seen as the third leg which might have completed already. Break of 1.2892 resistance will argue that larger up trend from 1.0351(2022 low) is ready to resume through 1.3141. Meanwhile, break of 1.2298 support will extend the corrective pattern instead.
USD/CHF Mid-Day Outlook
Daily Pivots: (S1) 0.9047; (P) 0.9074; (R1) 0.9094; More....
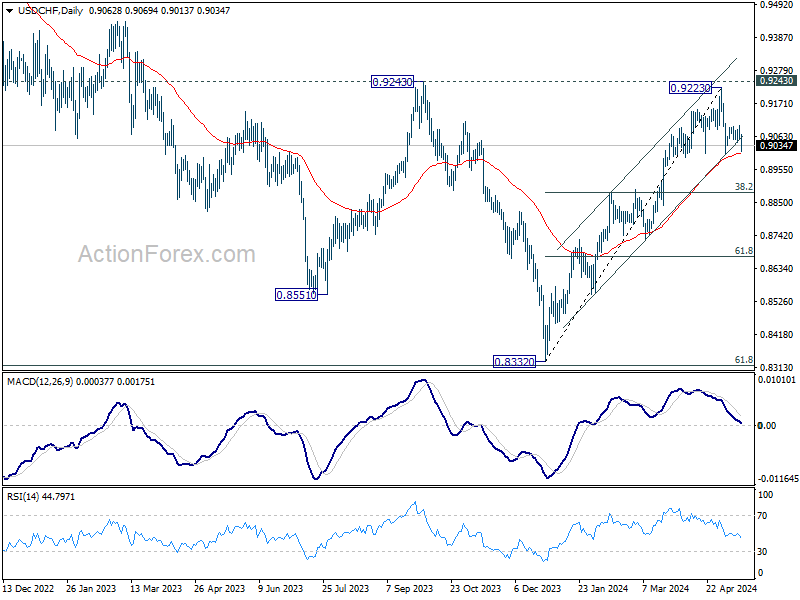
USD/CHF is holding above 0.9005 support and intraday bias remains neutral first. Further decline is expected as long as 0.9101 resistance holds. On the downside, break of 0.9005 will resume the fall from 0.9223 to 38.2% retracement of 0.8332 to 0.9223 at 0.8883. Nevertheless, break of 0.9101 will turn bias back to the upside for retesting 0.9223 instead.
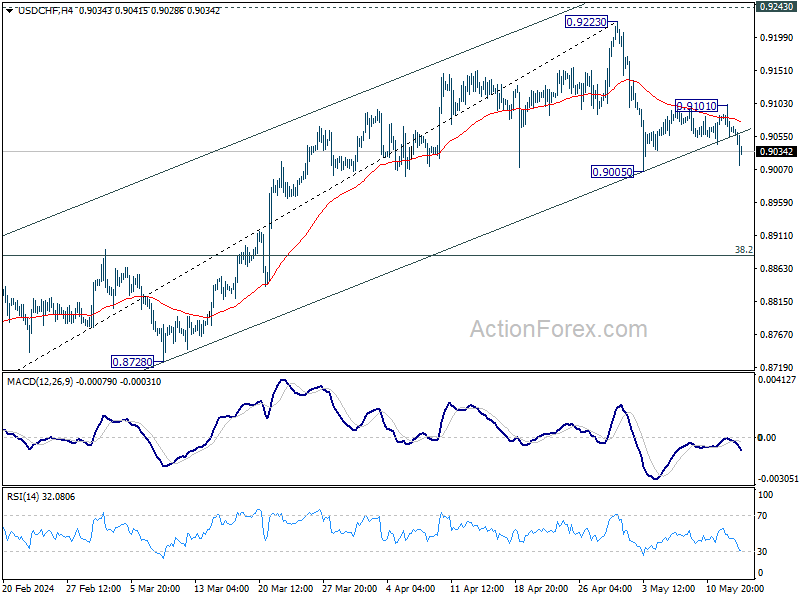
In the bigger picture, price actions from 0.8332 medium term bottom are tentatively seen as developing into a corrective pattern to the down trend from 1.0146 (2022 high). Rejection by 0.9243 resistance, followed by sustained break of 38.2% retracement of 0.8332 to 0.9223 at 0.8883 will strengthen this case, and maintain medium term bearishness. However, decisive break of 0.9243 will argue that the trend has already reversed and turn medium term outlook bullish for 1.0146.