

Sample Category Title
China’s exports rises 1.5% yoy in Apr, imports surges 8.% yoy
China's trade figures for April showcased significant recovery, with exports increasing by 1.5% yoy to USD 292.5 B, exceeding the expected 1.0% yoy growth. This rebound is particularly noteworthy given the -7.5% yoy decline observed in March.
On the import side, there was a notable surge of 8.4% yoy to USD 210.1B, substantially higher than the forecasted 5.4% yoy. This rise marks a recovery from the -1.9% decline in March. The significant increase in imports, driven partly by a weaker comparison base from the previous year, also reflects an uptick in economic activity as domestic conditions improve.
Trade surplus for April stood at USD 72.4B, smaller than the expected USD 81.4B but still an improvement from USD 58.6B recorded in March.
BoJ meeting summary indicates hawkish shift
Summary of Opinions from BoJ's April meeting revealed a notable hawkish tilt among its board members, with significant dialogue concerning further rate hikes. This development reflects a growing concern over inflationary pressures and the impact of a weaker yen, which could hasten monetary policy normalization.
One board member highlighted that if the economic activity and price forecasts from April are realized, future policy interest rates might be "higher than the path that is factored in by the market."
Further discussions emphasized the necessity of managing transitions carefully to mitigate shocks from sudden and substantial policy changes once price stability target is achieved. One approach proposed involves "moderate policy interest rate hikes".
Another critical point raised was the impact of a weakening yen on inflation. A board member warned that if underlying inflation continues to rise above the baseline scenario due to the currency's depreciation, "it is quite possible that the pace of monetary policy normalization will increase".
Japan’s real wages fall -2.5% yoy, declining for 24th consecutive month
In Japan, real wages fell notably by -2.5% yoy in March, marking a worsening trend from the previous month's -1.8% yoy. It also extended the streak of declines to 24 consecutive months—the longest since such data was first recorded in 1991.
Nominal wages, which include total cash earnings, grew modestly by 0.6% yoy in March, a deceleration from February's 1.4% yoy increase. Although regular pay saw a rise of 1.7% yoy , this was offset by -1.5% yoy decline in overtime pay, which has fallen for four consecutive months. Furthermore, special payments, which encompass bonuses and other benefits, saw a sharp decrease of -9.4% yoy.
The persistence of wage declines occurs despite a seemingly favorable outcome from Japan's annual labor-management wage talks this spring, which were described as the most beneficial for workers at major companies in three decades.
However, a labor ministry official noted that the results of the "shunto" wage negotiations were not reflected in the March data. With these results expected to influence the figures from April onwards, there is a focus on whether real wages will show an improvement and turn positive for the first time in two years.
Crude Oil Price Takes Hit, Decoding Hurdles To Fresh Increase
Key Highlights
- Crude oil prices declined further below the $80.00 support.
- A connecting bearish trend line is forming with resistance at $79.60 on the 4-hour chart.
- Gold prices are consolidating below the $2,335 resistance.
- Bitcoin prices are again moving lower below the $63,500 resistance zone.
Crude Oil Price Technical Analysis
In the past few days, Crude oil prices saw a steady decline from well above $81.80. The price dipped below the $80.50 and $80.00 support levels.
Looking at the 4-hour chart of XTI/USD, the price even settled below the 200 simple moving average (green, 4-hour) and the 100 simple moving average (red, 4-hour). Finally, the price found support near the $77.00 zone.
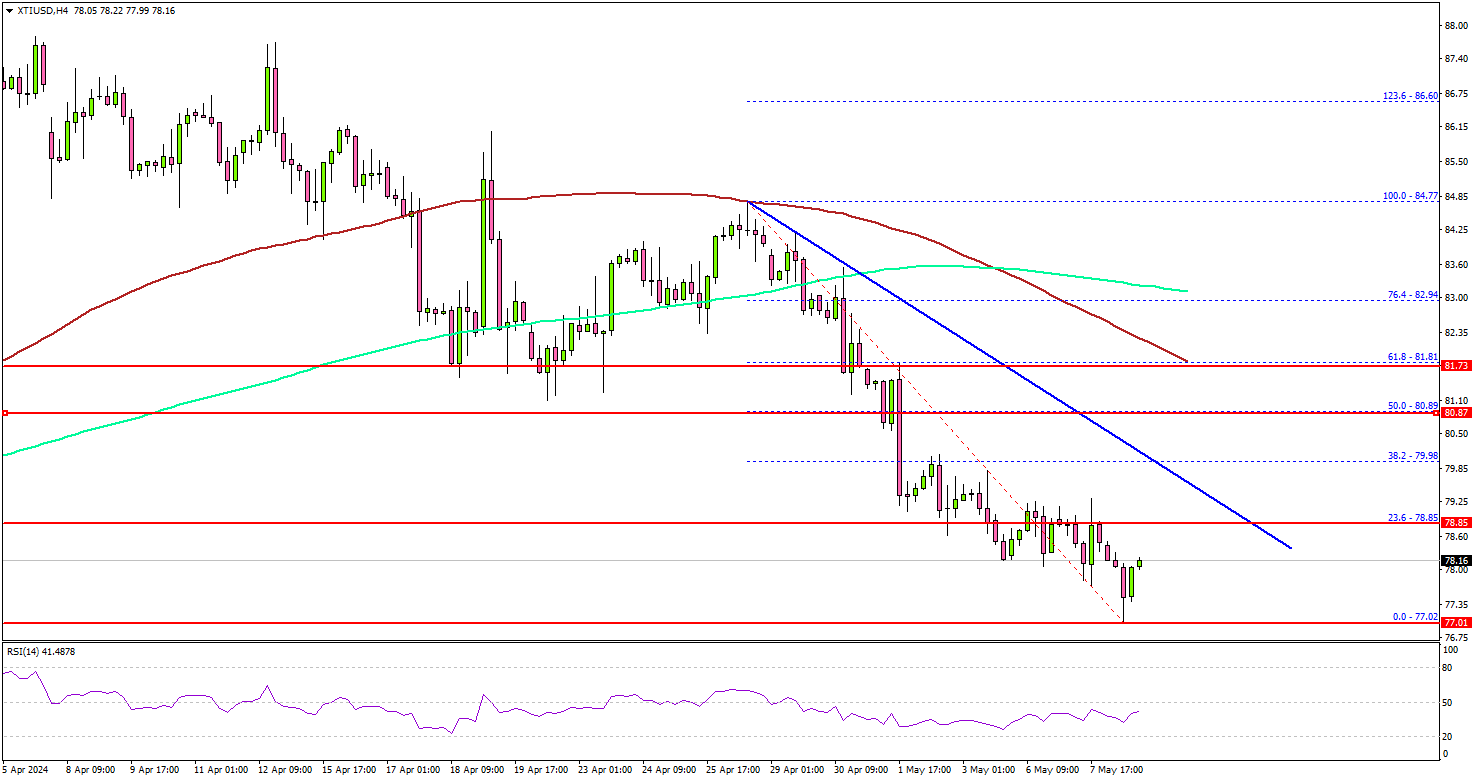
A low was formed at $77.02 and the price is now consolidating losses. On the upside, the price is facing hurdles near the $78.80 level. The next major resistance is near the $79.60.00 zone.
There is also a connecting bearish trend line forming with resistance at $79.60 on the same chart, above which the price may perhaps accelerate higher. In the stated case, it could even visit the $80.80 resistance.
If not, the price might dip lower and test the $77.00 support. The first major support on the downside is near the $76.50 level.
The next major support is at $75.00 or, below which the price might test $73.50. Any more losses might send oil prices toward $72.00.
Looking at Gold, the price remained stable above the $2,280 level but the bulls could struggle to surpass the $2,335 resistance region.
Economic Releases to Watch Today
- BoE Interest Rate Decision - Forecast 5.25%, versus 5.25% previous.
- US Initial Jobless Claims - Forecast 210K, versus 208K previous.
Fed’s Collins: Bringing down inflation will require more time
Boston Fed President Susan Collins described current monetary policy as "well positioned" to adapt based on new economic data and the evolving economic outlook. She is "optimistic" that Fed can achieve 2% inflation target in a "reasonable amount of time" while maintaining a robust labor market. However, she now anticipates that reaching this goal will "take more time than previously thought."
Collins highlighted "recent upward surprises to activity and inflation". This has led her to suggest that maintaining the current policy level might be necessary for a longer period than initially expected. She emphasized the importance of ensuring that inflation moves "sustainably toward 2%" before considering any policy adjustments.
AUDJPY Wave Analysis
- AUDJPY reversed from support area
- Likely to rise to resistance level 103.00
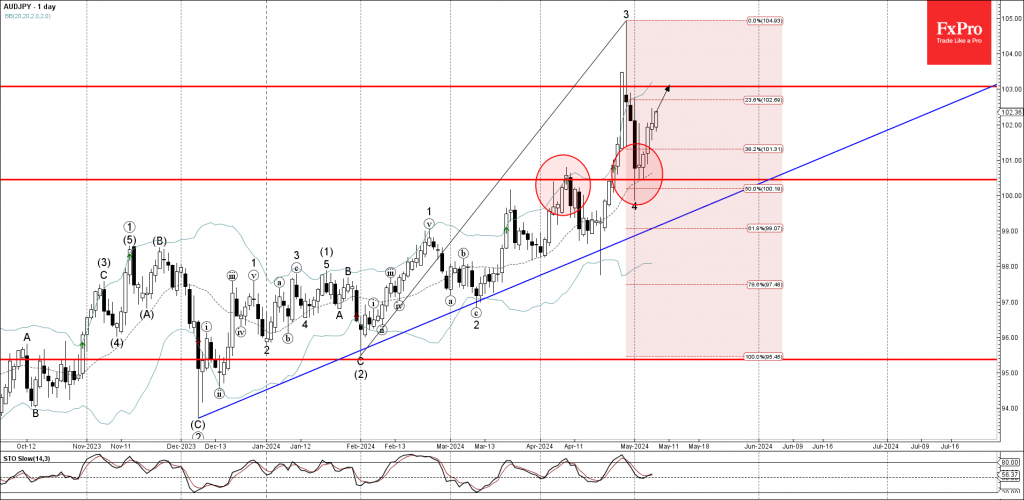
AUDJPY currency pair recently reversed up from the support area lying between the round support level 100.45 (former strong resistance from April), 20-day moving average and the 50% Fibonacci correction of the upward impulse from February.
The upward reversal from the support level 100.45 stopped the previous short-term retracement 4.
Given the predominant daily uptrend and strong yen sales, AUDJPY currency pair can be expected to rise further to the next resistance level 103.00.
WTI Crude Oil Wave Analysis
- WTI crude oil reversed from support area
- Likely to rise to resistance level 80.00
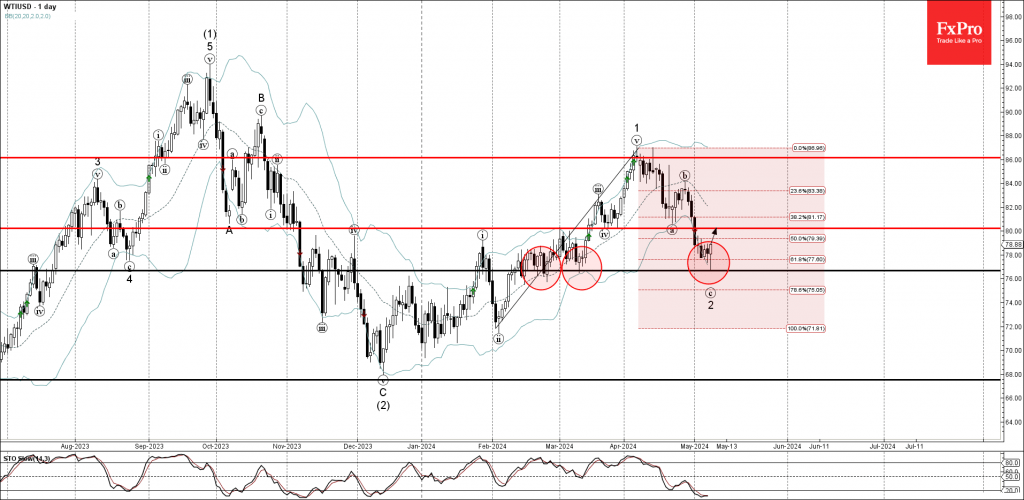
WTI crude oil recently reversed up with the daily Hammer from the support area lying between the pivotal support level 77.00 (which has been reversing the price from February), lower daily Bollinger Band and the 61.8% Fibonacci correction of the upward impulse from February.
The upward reversal from the support level 100.45 stopped the previous short-term ABC correction 2.
Given the still oversold daily Stochastic, WTI crude oil can be expected to rise further to the next round resistance level 80.00.
April CPI Preview: The Clock Is Ticking for a September Cut
Summary
A string of uncomfortably-hot inflation readings in the first quarter leaves a narrow window for inflation to downshift before a late summer rate cut by the Federal Open Market Committee (FOMC) is no longer on the table. We expect the April CPI report to demonstrate that while inflation is not as sticky as the Q1 pace indicated, the journey back to 2% remains slow-going.
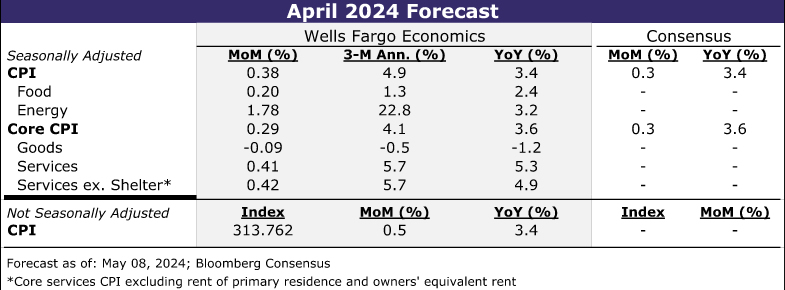
Headline CPI likely rose by 0.4% for a third consecutive month in April, which would leave overall prices running at nearly a 5% three-month annualized rate. Progress in lowering core inflation, however, likely resumed. Excluding food and energy, we estimate prices rose 0.3%, which would break the streak of 0.4% gains since January and push the year-over-year rate down to 3.6%, a three-year low. Ongoing deflation in the goods sector is expected to help keep a lid on core inflation in April, but services are likely to be the bigger driver of the softer print. We look for shelter inflation to have eased a bit further in April, and we anticipate a bigger step-down in core services ex-housing (+0.4% following a 0.6% rise in March).
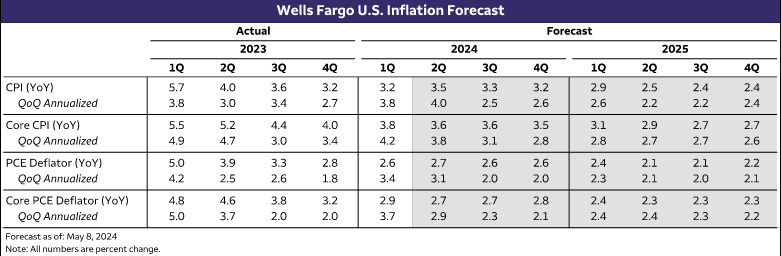
While inflation has been stubborn in recent months, we do not believe the underlying trend is re-accelerating. Supply chain pressures are not easing as rapidly as a year or two ago, but they are not building either. Shelter inflation looks set to moderate further this year, while services ex-housing inflation should benefit from tamer growth in goods-related input costs and gradual loosening in the labor market. We expect to see monthly inflation prints trend lower over the remainder of the year as a result, with the core CPI subsiding to a 2.8% annualized rate in Q4 and the core PCE easing to a 2.1% annualized rate in Q4.
Downshift Needs to Resume to Keep a September Cut on the Table
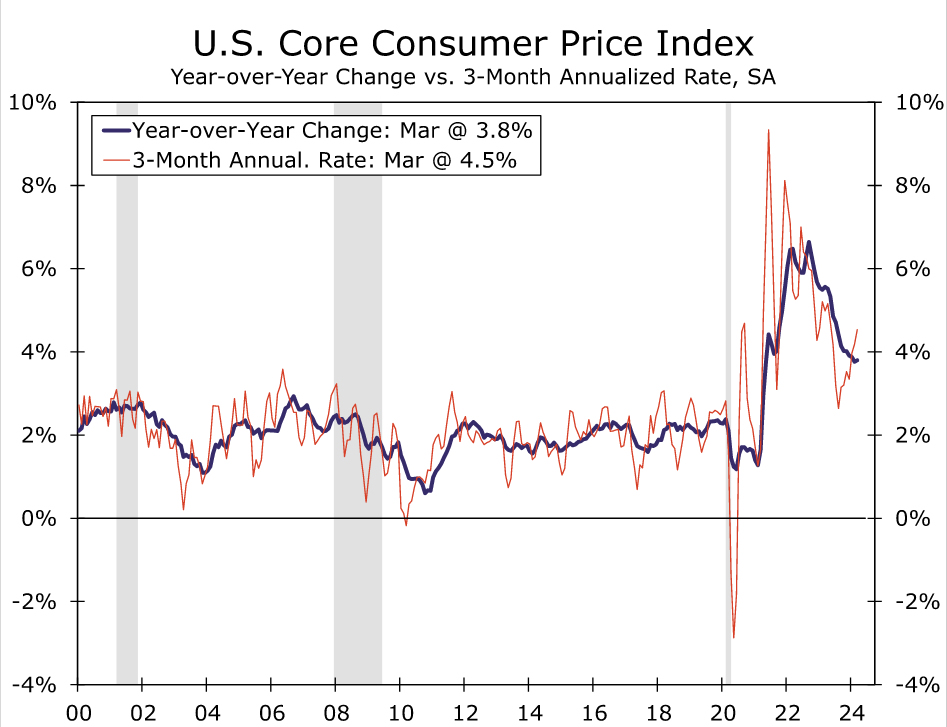
Beginning with the April Consumer Price Index, Q2 inflation data will be crucial in determining whether early-year pricing strength was a brief detour on the road to quieting inflation or if the journey has gotten significantly longer. The FOMC made clear back in January that it would need to see additional benign data to be confident that price growth is on track to return to 2% on a sustained basis before reducing the fed funds target range. However, with core CPI and core PCE in March picking up to three-month annualized rates of 4.5% and 4.4%, respectively, the sufficient confidence has yet to be built (Figure 1). We suspect the FOMC will need to see at least three benign core inflation prints, perhaps even four, before easing policy, absent a rapid deterioration in labor market conditions. Thus, time is running out on the clock for even a late summer rate cut, and it creates the need for core inflation to downshift as soon as the upcoming April CPI report.
We expect to see progress in lowering inflation with the April CPI data, although improvement will likely be slight. Headline CPI looks set for another 0.4% increase, although that should be sufficient for the year-over-year rate to edge down to 3.4%—a tick lower than last month but still above the 3.1% rate registered at the start of the year.
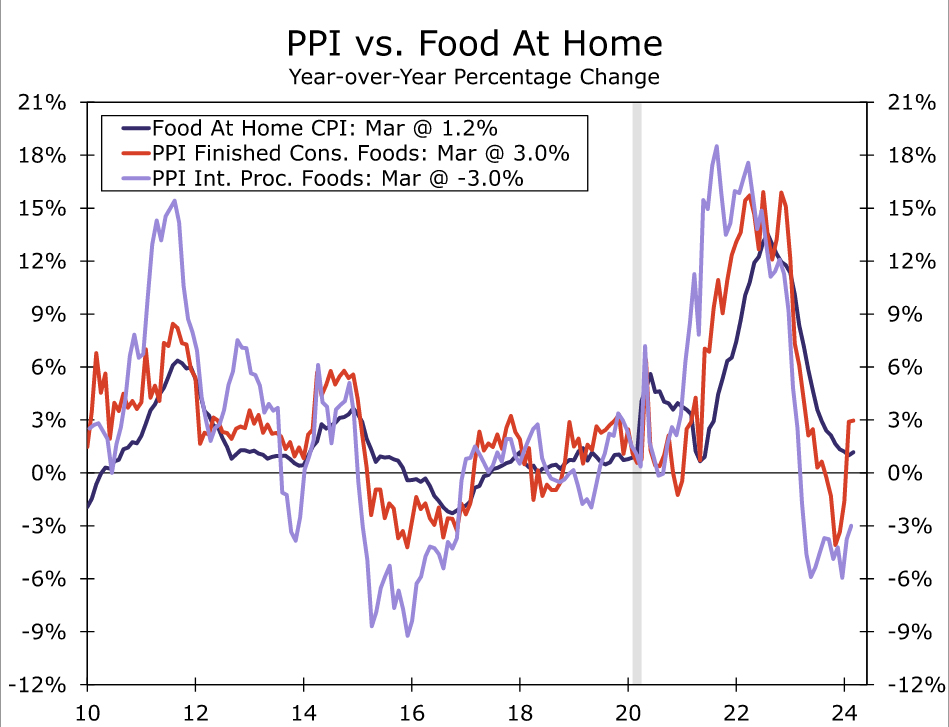
Similar to February and March, April's headline strength will be partly attributable to another jump in gasoline prices. We estimate that once adjusting for the usual rise in prices at the pump this time of year, energy goods rose 3.0% in April. Falling oil prices in recent weeks, however, are teeing up at least a partial reversal in this component in May. Food prices, meanwhile, were likely a little firmer in April. An upturn in producer prices for consumer foods suggests grocery disinflation may be close to running its course, while two months of sub-trend gains in food away from home leaves scope for some mean-reversion in April. We look for food prices to rise 0.2% after a 0.1% gain in March (Figure 2).
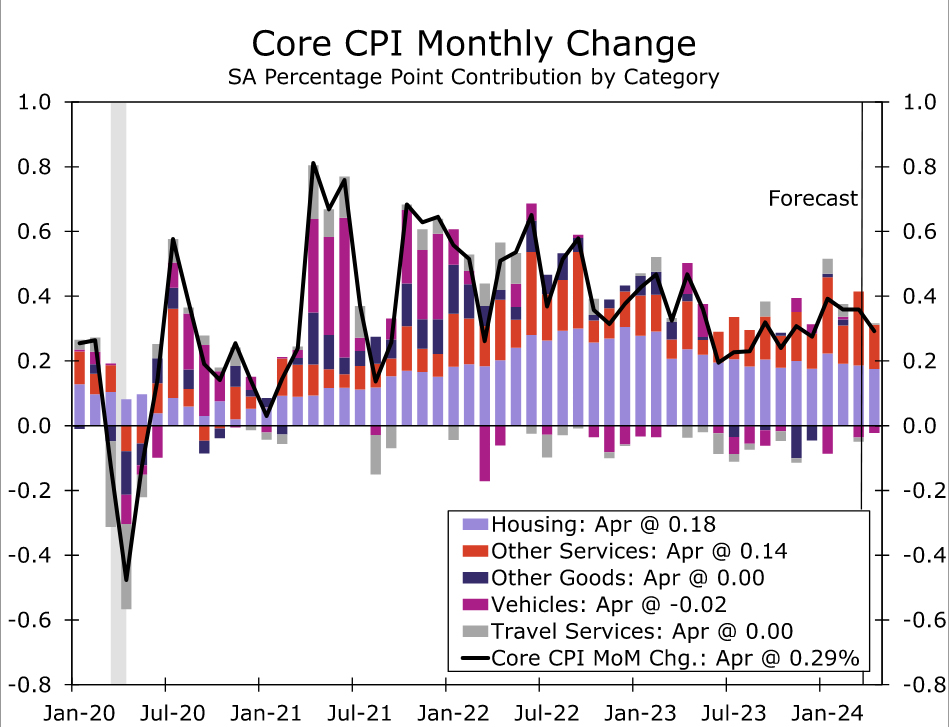
While headline inflation is likely to have remained firm in April, core inflation looks set to resume its downward trek. After three straight 0.4% monthly gains, we estimate core CPI rose 0.3% in April (Figure 3). If realized, the year-over-year rate for prices less food and energy would fall to a three-year low of 3.6%. Some additional deflation in the goods sector is expected to help core CPI slow in April. Both new and used vehicle prices look to have declined again, albeit at a more modest pace than in March. Elsewhere, goods prices were likely little changed in April, although a flat monthly reading would leave prices for core goods ex-autos down 0.8% over the past year—about double the average annual decline from 2014-2019.
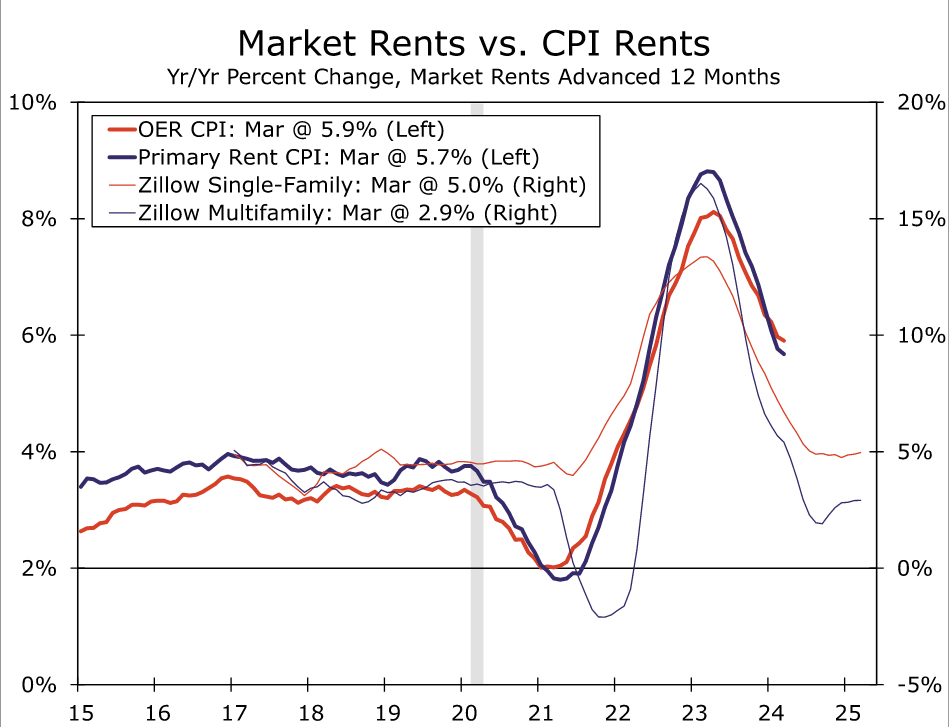
Services have been the more intractable component of inflation recently, making a downshift in this segment key to getting disinflation back on track. We estimate core services rose 0.4% in April, which would be the smallest monthly gain since December. Although the moderation in shelter inflation has unfolded slowly, the trend indicated by private rent measures as well as the CPI's New Tenant Rent Index remains down; we have penciled in a 0.41% rise in primary shelter in April versus a monthly average of 0.46% in Q1 (Figure 4).
Outside of housing, core services inflation also looks to have eased a little in April. After rising 0.6% in March, we estimate the CPI equivalent of “super core” inflation rose 0.4% last month amid smaller monthly gains in medical care, motor vehicle, internet and personal services. If realized, the three-month annualized rate of CPI core services less housing would slow from 7.6% in March to 5.7% and suggest that the PCE “super core” advanced 0.3% month-over-month in April.
Outlook: Inflation Pressures Continue to Subside
The first quarter's hotter price growth was indicative that further progress taming inflation will be slower ahead. Businesses remain more apt to raise prices than prior to the pandemic with sturdy consumer spending limiting the need to hold the line on prices. That said, we do not believe that the underlying trend in inflation is re-accelerating.
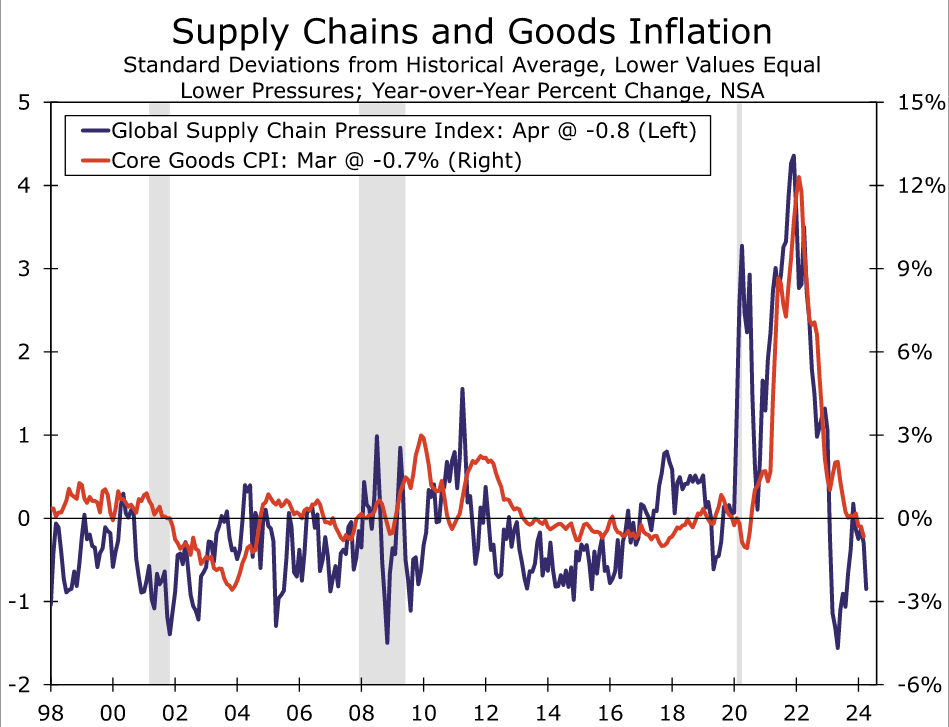
The strong disinflationary tailwinds to the goods sector over the past two years have faded, but upward pressure on goods prices remains minimal. Supply pressures are no longer easing as rapidly as in 2022 and the first half of 2023, but they are not building either (Figure 5). Margins in the goods sector also remain elevated relative to the 2010s, providing space for firms to ease up on pricing as consumers grow more discerning in their purchases. These dynamics should keep core goods in mild deflation territory in the near term. Similarly, food and energy-related commodities are not falling as sharply as over the course of mid-2022/early-2023, but range-bound levels over the past year or so mean food and energy's contribution to headline inflation is not increasing materially.
With goods inflation likely to be little changed ahead, services will need to slow further to keep overall inflation on its downward trajectory. We believe the pieces are in place for services to contribute more to disinflation (Figure 6). Shelter inflation should continue to cool as we move through the year, with apartment vacancy rates climbing and deceleration in more forward-looking spot rents. We estimate primary shelter, currently up 5.9% year-over-year, will slow to 4.1% by December before bottoming out at a little over 3% around the middle of next year.
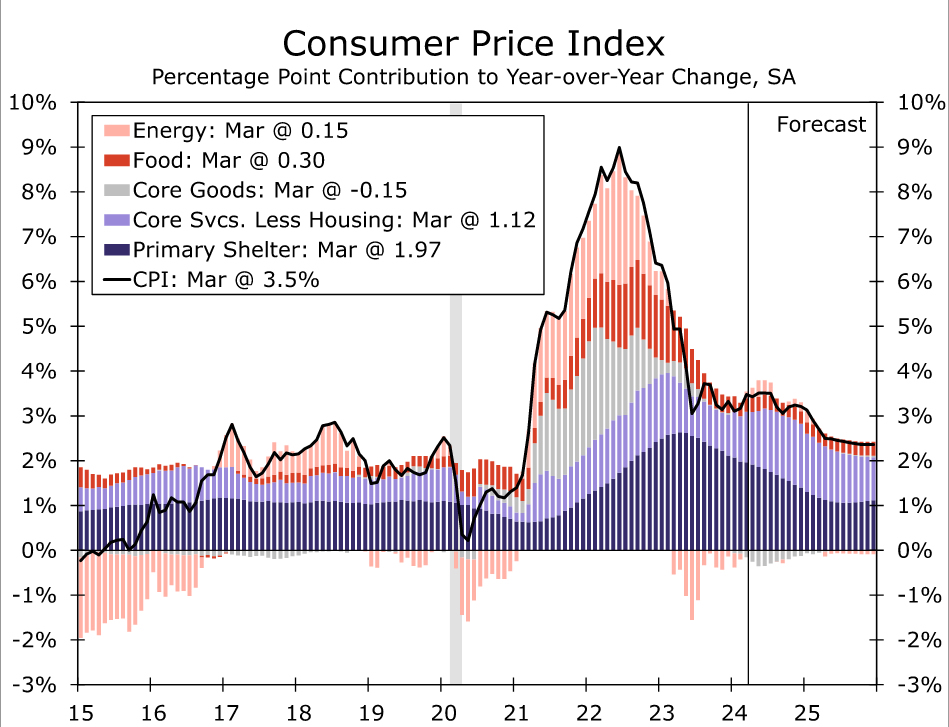
Outside of housing, upward pressure on services inflation also continues to ease. The steadier state of goods prices should usher in some relief to services inflation via tamer input costs, with motor vehicle insurance inflation likely being the most notable beneficiary of this dynamic. Meantime, the gradual loosening in the labor market is leading to slower nominal wage growth at the same time the trend in productivity has firmed. Overall, we see the still-elevated rate of services inflation early this year as largely a function of services being slower to respond to changes in the broader price environment this cycle, rather than a sign inflation is getting stuck at current levels. We look for core services to slow to 4.9% on a year-ago basis in Q4, which would help drive core inflation down to 3.5%.
Yet even as upward pressure on prices continues to subside, the first quarter flare up in consumer prices signals that inflation will likely take longer to fully stomp out than what the trend in the second half of last year implied. Progress on the Fed's preferred inflation gauge looks set to be particularly slow. Amid the greater near-term momentum indicated by Q1 data and low base readings from late last year, core PCE inflation when measured on a year-ago basis is likely to be stuck around 2.7%-2.8% through the end of the year (Figure 7). Yet we continue to expect to see price growth slow on a monthly basis, with the three-month annualized rate on core PCE inflation falling back below 2.5% this summer. With the labor market continuing to soften, we think such a pace could still be enough for the FOMC to ease at its September meeting, but a string of more benign prints will need to start with the April data.
ECB’s Holzmann decisively against quick and strong interest rate cuts
In an interview published today, ECB Governing Council member Robert Holzmann indicated that while he is open to rate cut in June, "I see absolutely no reason for us to cut key interest rates too quickly, too strongly," he said.
Holzmann also acknowledged the significant influence of Fed on ECB decision-making. He described the Fed as "the gorilla in the room," emphasizing how ECB policies are, to some extent, shaped by actions taken by the US central bank, particularly due to the dollar's pivotal role in the global economy.