Sample Category Title
USD/JPY Calm Ahead of US Nonfarm Payrolls
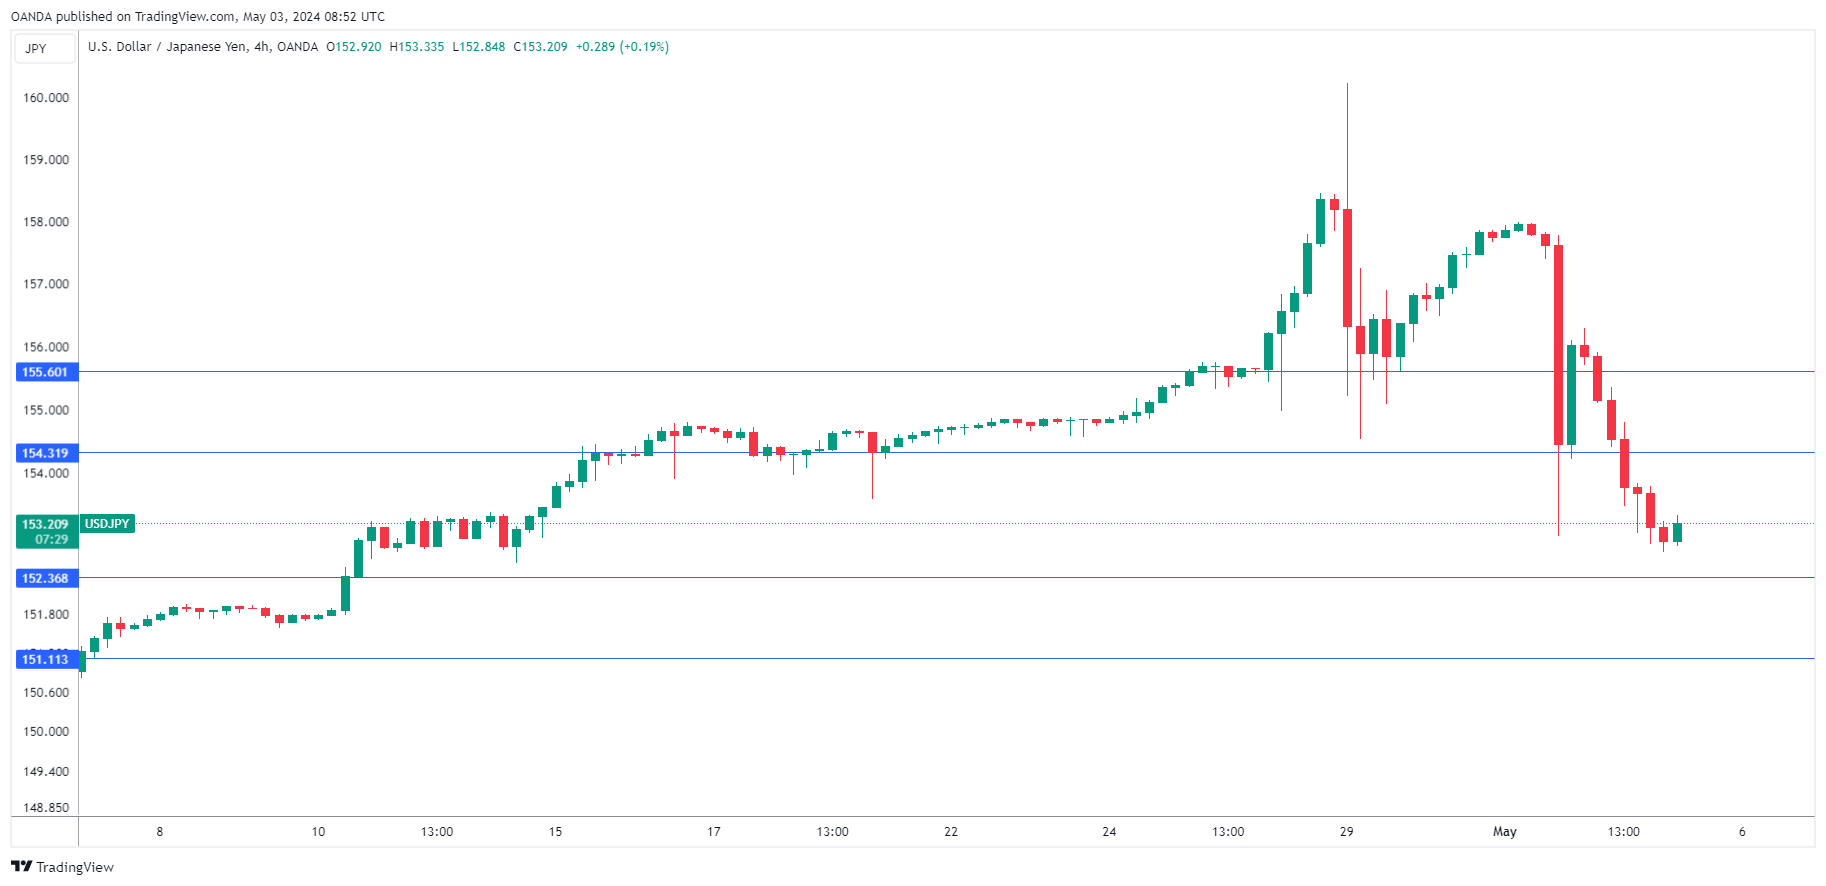
The Japanese yen has extended its gains on Friday. USD/JPY is trading at 153.26, down 0.27% at the time of writing.
It has been a week to remember as the yen has soared 3.2% against the dollar. The yen fell below the 160 level earlier in the week, setting another 34-year record. However, the Japan’s Ministry of Finance finally stepped in and intervened on Monday and Wednesday, based on Bank of Japan data. These moves have shored up the ailing yen, although previous interventions were unable to stop the yen’s descent.
The yen had been on a sharp descent before this week’s wild swings and was down over 10% since the start of the year. Last week’s BoJ meeting didn’t provide any support to the yen as the central bank maintained interest rates around zero.
Did traders miss hawkish signals from the meeting? The BoJ issued its quarterly report at the meeting and projected that inflation would be at a “level generally consistent” with its target of 2% sustainable inflation by late 2025. As well, the report said the BoJ would “adjust the degree of monetary accommodation”, which could be code for rate hikes, if the economic data and inflation meet forecasts.
The BoJ tends not to be transparent with its plans and the lack of communication may have come back to bite at the meeting, as the Bank failed to make clear that further rate hikes were on the table. Instead, the yen kept dropping, triggering this week’s dramatic interventions.
Will nonfarm payrolls remain strong?
US nonfarm payrolls are unlikely to match last month’s blowout of 303,000, but the markets are expecting strong job growth to continue. The April market estimate stands at 243,000. Wage growth, which is carefully monitored as it contributes to inflation, is expected to remain unchanged at 0.3% m/m in April. The employment report often has a significant impact on the US dollar and should be treated as a market-mover.
USD/JPY Technical
- USD/JPY faces resistance at 154.33 and 155.60
- There is support at 152.37 and 151.10
Eurozone unemployment rate unchanged at 6.5%, EU dips to 6.0%
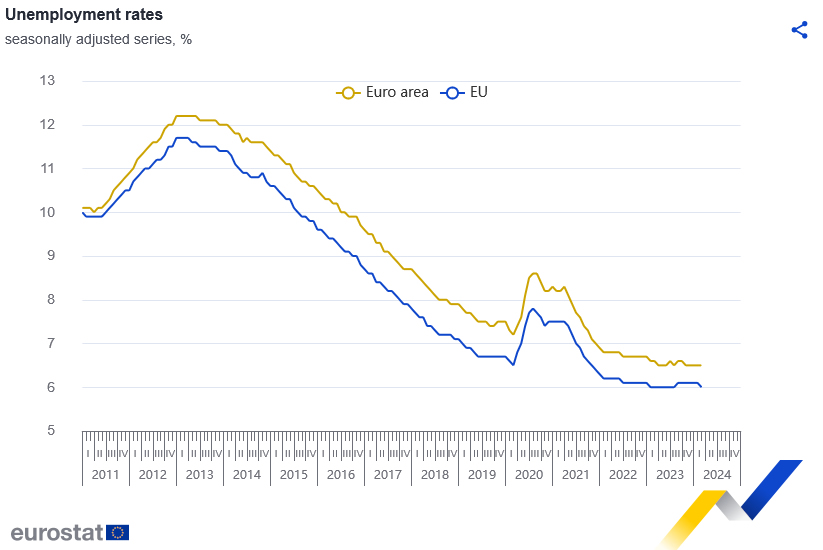
Eurozone unemployment rate was unchanged at 6.5% in March, matched expectations. EU unemployment rate fell from 6.1% to 6.0%.
Eurostat estimates that 13.258m persons in the EU, of whom 11.087m in the euro area, were unemployed in March 2024.
UK PMI services finalized at 55, indicating 0.4% quarterly GDP growth
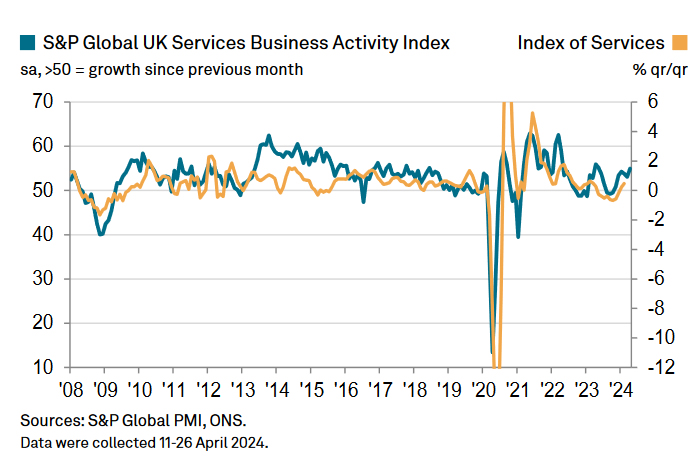
UK PMI Services was finalized at 55.0 in April, marking a significant improvement from March's 53.1 and representing the highest level since May 2023. This level of activity, the highest since May 2023, signals robust growth in the sector, with activity and new work rising at the fastest rates in 11 months. Despite these positive developments, input cost inflation remains high, reaching its peak since August 2023, though the rate of staff hiring continues to be subdued.
Tim Moore, Economics Director at S&P Global Market Intelligence, highlighted that the latest survey results suggest the UK economy is growing at a quarterly rate of 0.4%. He noted, "Prices charged inflation across the service sector eased to a three-year low in April, suggesting that the pass-through of higher costs has started to wane." This slowdown in price increases comes despite a sharp rise in business expenses driven by strong wage inflation, which continues to push up operating costs.
Bitcoin’s Downtrend, Solana and Ethereum Form Double Bottom
Market picture
Crypto market capitalisation rose 3.3% in 24 hours to $2.22 trillion. Local capitalisation bottomed near $2.10 trillion, confirming a sequence of declining local lows (2.3 in March, 2.25 in April) and highs (2.76 in mid-March, 2.67 in early April and 2.46 in late April).
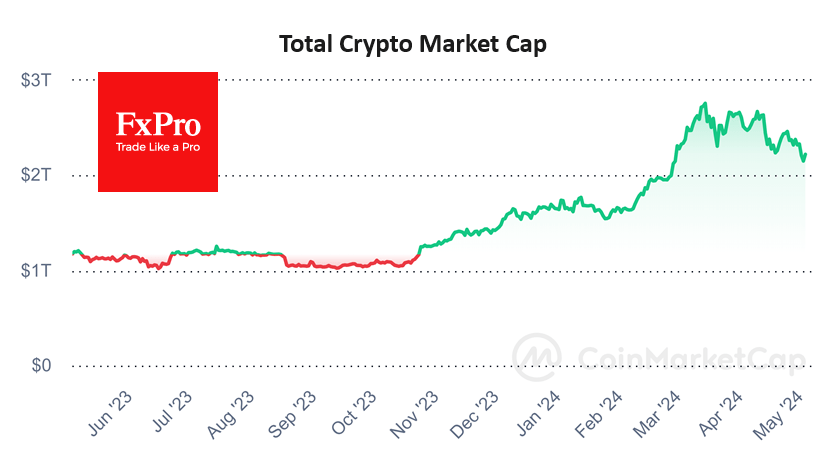
Ethereum and Solana are adding from the area of the April lows and forming a double bottom. This is a positive but not too reliable signal, as Bitcoin has been in a downtrend throughout April.
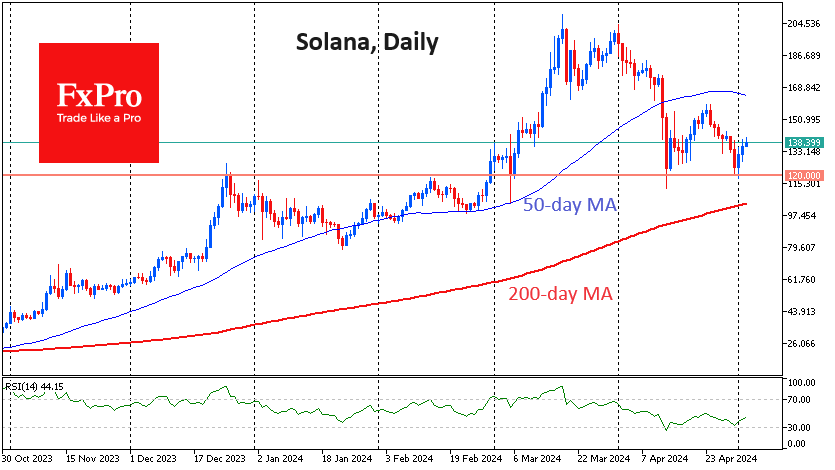
After the halving, it is logical to expect miners to increase sales from inventory, to invest in new capacity or to lock in profits. Also, the hype around spot Bitcoin ETFs is going away, which reinforces selling by speculators.
Assuming Bitcoin stays within the global growth cycle starting in 2023, we should expect further price declines in the coming weeks. The nearest likely target looks to be the $51-52K area, where growth was paused in February and where the 200-day MA will be pulled up by the end of the month.
News background
SoSoValue notes that outflows for $563.8 million from spot bitcoin-ETFs on 1st May reached their highest since product approval. Bloomberg noted the formation of IBIT and FBTC price discounts relative to net asset value (NAV).
BlackRock believes that financial institutions, including pension, endowment, and sovereign wealth funds, will enter the ETF market in the coming months.
VanEck calculated that the aggregate value of Bitcoin in the wallets of governments and companies is $175bn. That’s about 15% of the total BTC capitalisation.
Bitfinex said that Bitcoin options traders are preparing for a summer lull in the market. Summer is usually a period of low volatility in the crypto market. Cube.Exchange, on the other hand, pointed to the likelihood of increased price fluctuations in the summer against a background of low liquidity.
Toncoin (TON) resumed growth after a correction amid an investment from venture capital firm Pantera Capital with over $5bn in assets under management. ‘We believe TON has the potential to bring crypto to the masses as it is widely used in the Telegram ecosystem’, Pantera noted.
On 2nd May, TON developers announced the platform’s integration with the on-chain analytics service Arkham Intelligence. On 1st May, integration with the cross-chain platform Layerswap was implemented, which, according to its representative, will make it possible ‘to send USDC from any network and receive USDT on the TON blockchain’.
GBP/JPY Daily Outlook
Daily Pivots: (S1) 191.09; (P) 193.43; (R1) 194.99; More..
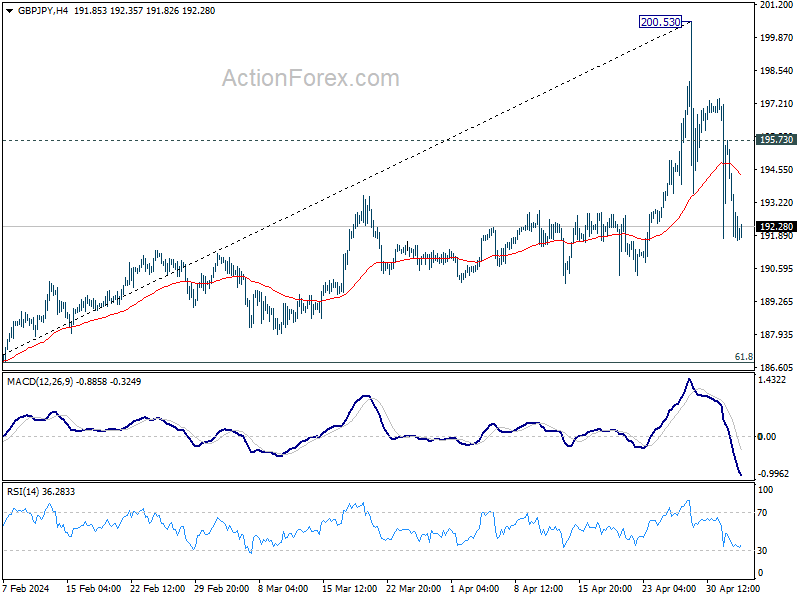
Intraday bias in GBP/JPY remains on the downside at this point. Sustained break of 55 D EMA (now at 191.42) will extend the fall from 200.53, as correction to rise from 178.32, to 61.8% retracement of 178.32 to 200.53 at 186.80. On the upside, break of 195.73 minor resistance will turn intraday bias neutral, and set up the range for sideway consolidations.
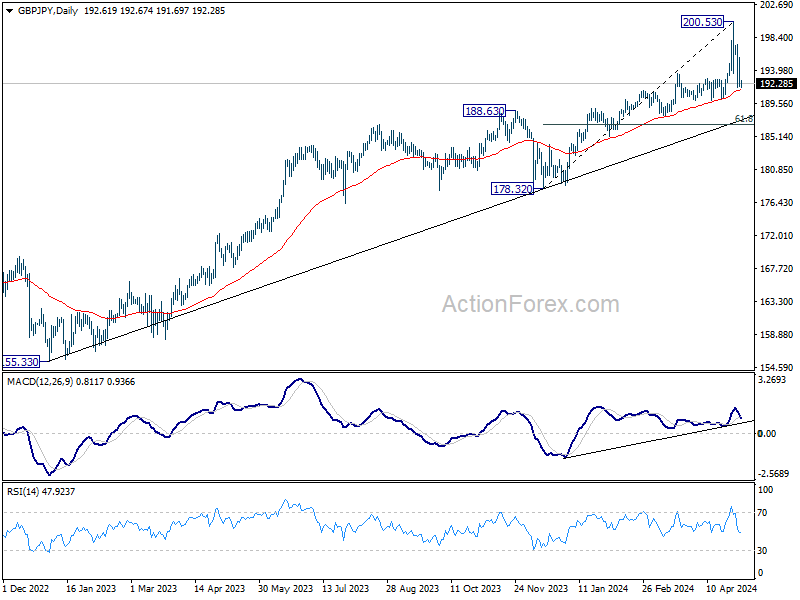
In the bigger picture, current rally is part of the up trend from 123.94 (2020 low). Sustained break of 61.8% projection of 155.33 to 188.63 from 178.32 at 198.89 will pave the way to 100% projection at 211.65. Break of 189.97 support is needed to be the first sign of medium term topping. Otherwise, outlook will remain bullish in case of retreat.
EUR/JPY Daily Outlook
Daily Pivots: (S1) 163.57; (P) 165.48; (R1) 166.73; More...
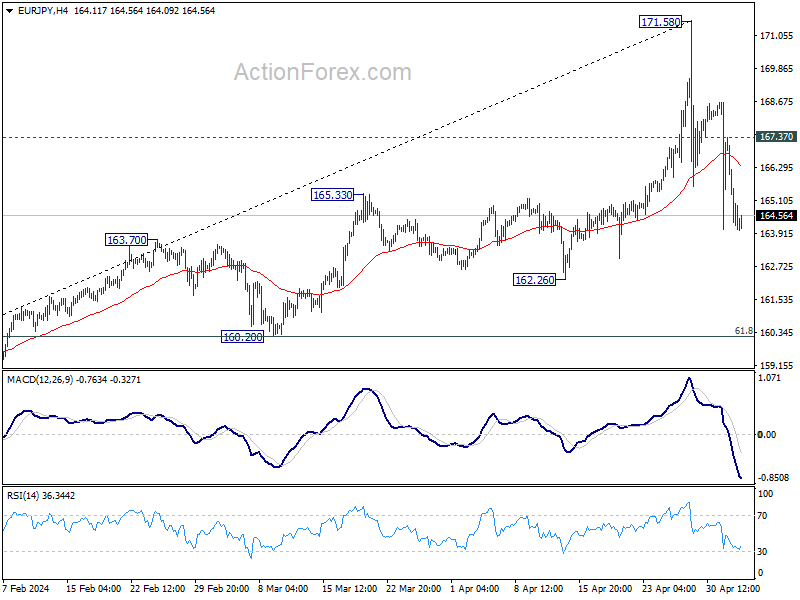
Intraday bias in EUR/JPY stays on the downside. Sustained break of 55 D EMA (now at 163.94) will extend the fall from 171.58, as a correction to rise from 153.15, to 61.8% retracement of 153.15 to 171.58 at 160.19. On the upside, above 167.37 will turn bias neutral and set up the range for sideway consolidations.
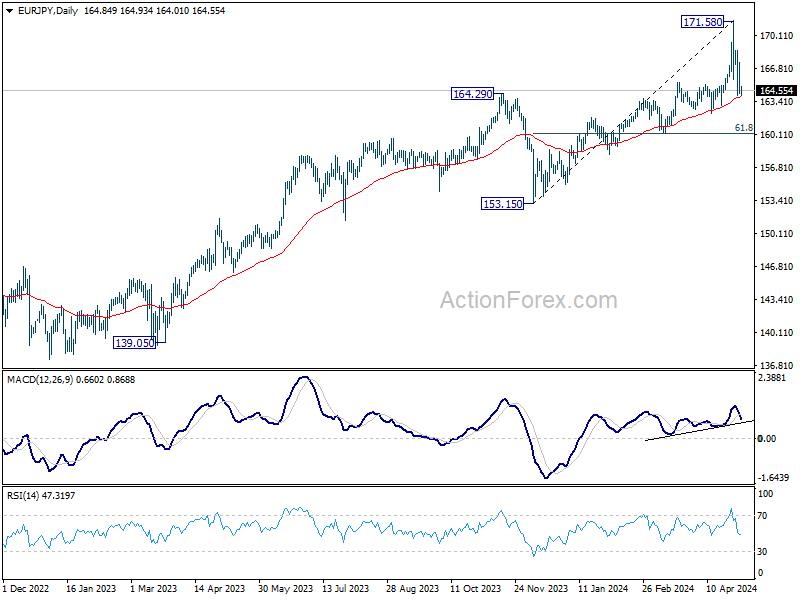
In the bigger picture, current rally is part of the up trend from 114.42 (2020 low), which is still in progress. Decisive break of 169.96 (2008 high) will pave the way to 100% projection of 139.05 to 164.29 from 153.15 at 178.39. On the downside, break of 162.26 support is needed to be the first sign of medium term topping. Otherwise, outlook will stay bullish in case of retreat.
EUR/GBP Daily Outlook
Daily Pivots: (S1) 0.8548; (P) 0.8556; (R1) 0.8566; More...
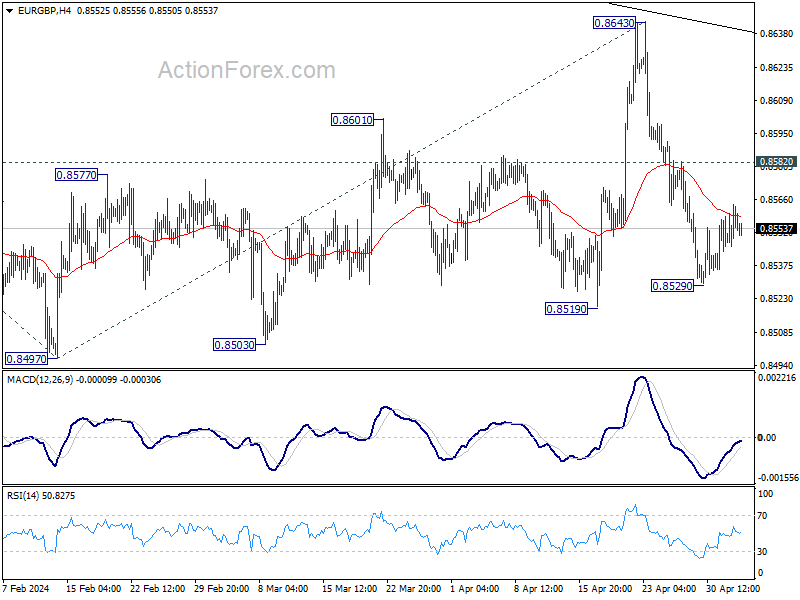
No change in EUR/GBP's outlook. Intraday bias remains neutral and more consolidations would be seen above 0.8529. But further decline is expected as long as 0.8582 resistance holds. Below 0.8529 will target 0.8491/7 support zone.
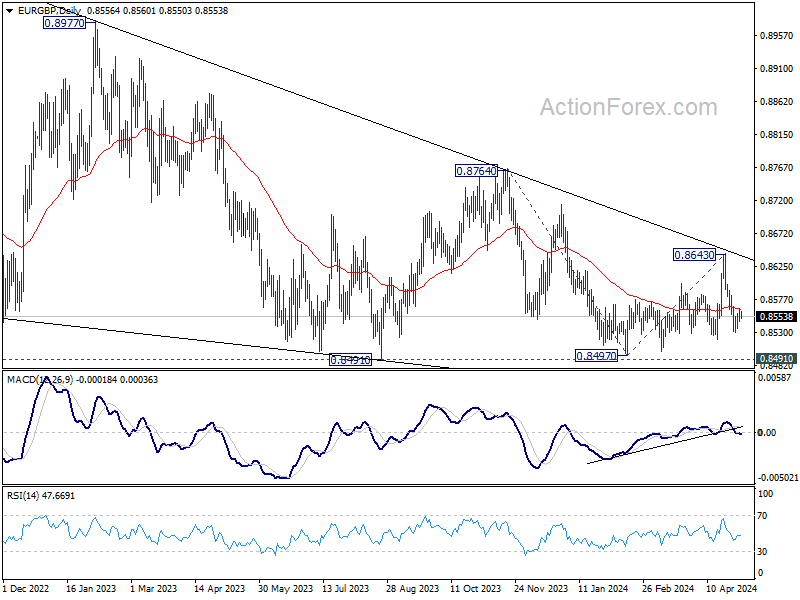
In the bigger picture, outlook remains bearish as EUR/GBP is capped below medium term falling trendline. That is, down trend from 0.9267 (2022 high) is still in progress. Firm break of 0.8491/7 will target 100% projection of 0.8764 to 0.8497 from 0.8643 at 0.8376.
EUR/AUD Daily Outlook
Daily Pivots: (S1) 1.6287; (P) 1.6371; (R1) 1.6419; More...
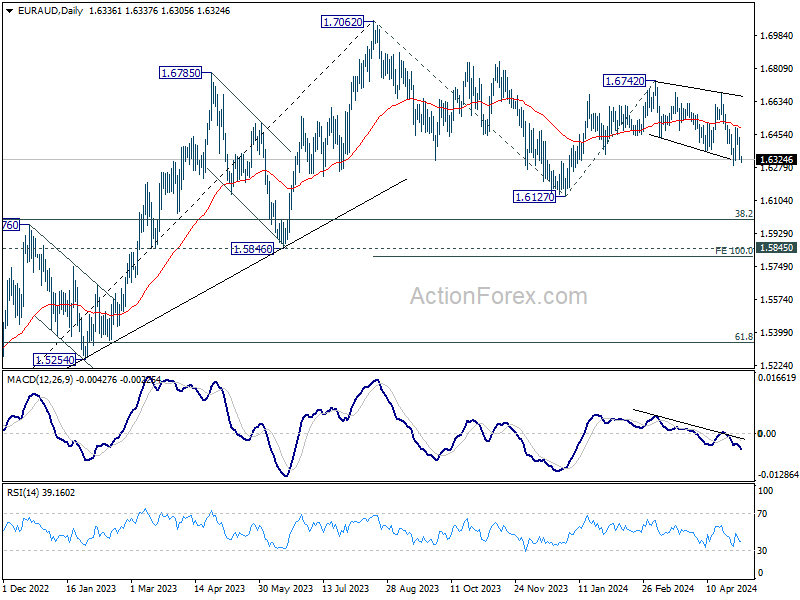
Intraday bias in EUR/AUD remains neutral at this point. Further decline is expected as long as 1.6494 resistance holds. Below 1.6288 will resume the fall from 1.6742 to 1.6127 support, or further to 100% projection of 1.7062 to 1.6127 from 1.6742 at 1.5807. However, break of 1.6494 will turn bias back to the upside for further rebound.
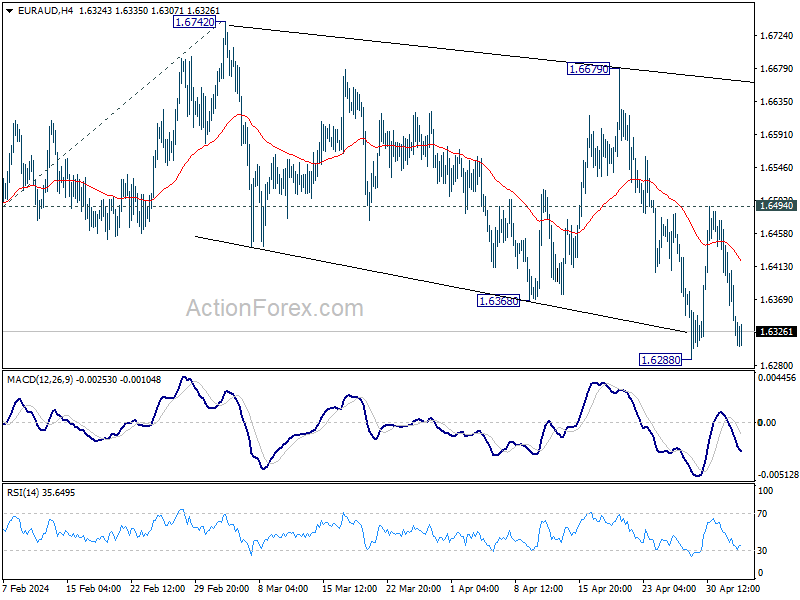
In the bigger picture, fall from 1.7062 medium term top is seen as a correction to the up trend from 1.4281 (2022 low). In case of another fall, strong support is expected around 1.5846 and 38.2% retracement of 1.4281 to 1.7062 at 1.6000 to bring rebound. Break of 1.7062 is in favor as a later stage.
EUR/CHF Daily Outlook
Daily Pivots: (S1) 0.9732; (P) 0.9781; (R1) 0.9816; More...
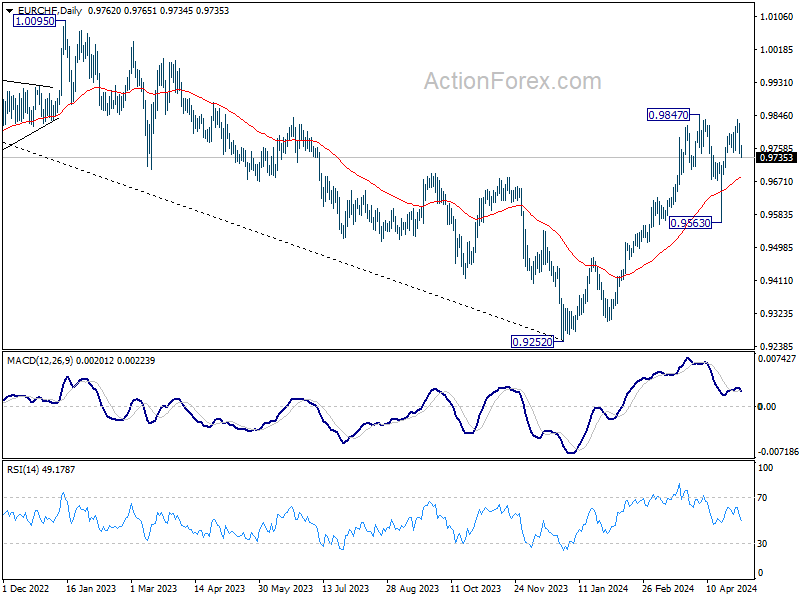
EUR/CHF's break of 0.9748 support argues that rebound from 0.9563 has completed after rejection by 0.9847 resistance. Intraday bias is back on the downside. Further fall would be seen towards 0.9563 as the third leg of the corrective pattern from 0.9847.
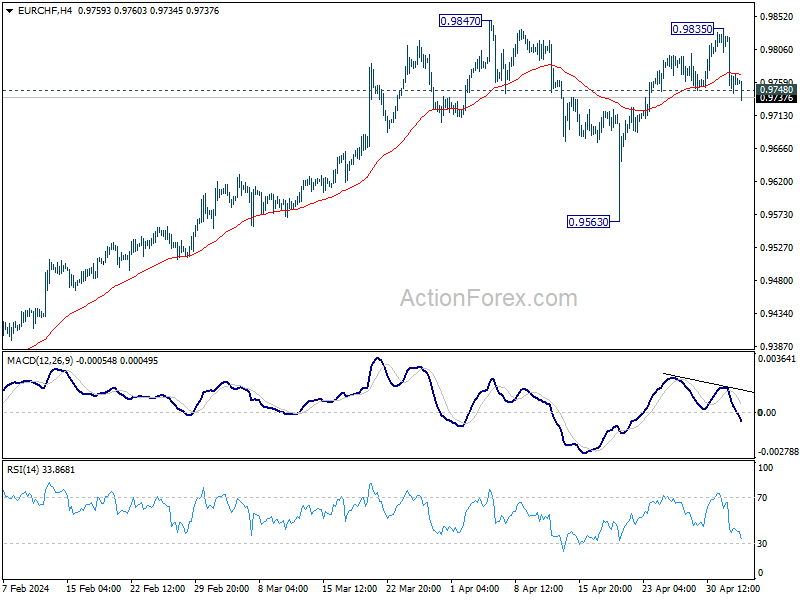
In the bigger picture, as long as 0.9563 support holds, rise from 0.9252 medium term bottom is still in favor to continue. Break of 0.9847 resistance will target 38.2% retracement of 1.2004 (2018 high) to 0.9252 (2023 low) at 1.0303, even as a correction to the down trend from 1.2004.
WTI Futures Break Below 200 Day-SMA
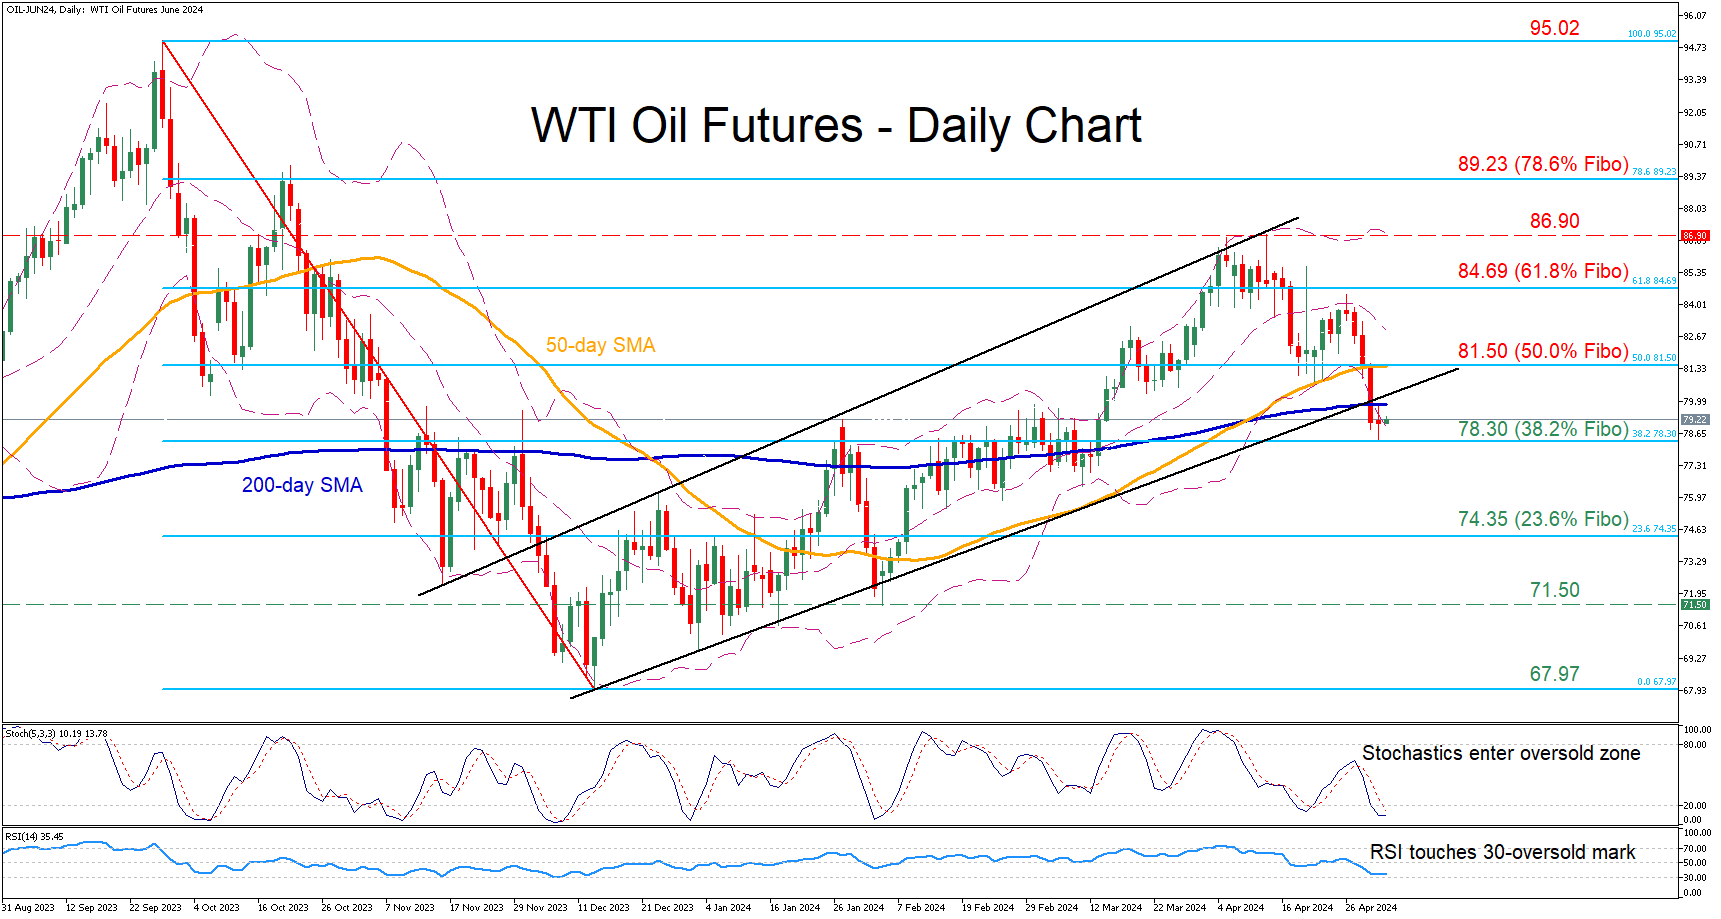
- WTI futures retreat below both 50 and 200-day SMAs
- Violate ascending channel in place since November
- Oscillators approach oversold conditions
WTI oil futures (June delivery) had been in a steady uptrend since December, posting a fresh six-month peak of 86.90 on April 12. However, the price has been undergoing a pullback since then, dropping beneath both its 50- and 200-day simple moving averages (SMAs) to a fresh one-month low on Thursday.
Should the decline resume, immediate support could be found at 78.30, which is the 38.2% Fibonacci retracement of the 95.02-67.97 downleg. Failing to halt there, the price may descend towards the 23.6% Fibo of 74.35. Even lower, the February bottom of 71.50 might prevent further retreats.
On the flipside, bullish actions could propel the price back above its 200-day SMA to challenge the 50.0% Fibo of 81.50, which overlaps with the 50-day SMA. Conquering this barricade, the bulls may attack the 61.8% Fibo of 84.69. A violation of that zone could pave the way for the recent six-month peak of 86.90.
In brief, WTI oil futures have been experiencing a strong pullback over the past three weeks, with the price falling to its lowest level since March 14. Therefore, a failure to reclaim the 200-day SMA might lead to an acceleration of the decline.