Sample Category Title
USDJPY Reaction to Fed and BoJ Decisions
- Fed and BoJ decisions have some impact on USDJPY
- Daily chart shows some weakness for the next few sessions
- But weekly chart looks strongly bullish
FOMC decision drives dollar lower
The dollar declined following the FOMC meeting on Wednesday, as Federal Reserve Chair Powell adopted a more accommodative stance. Policymakers have maintained the dot plot’s view for this year, which indicates a total of 75 basis points worth of interest rate reductions. That was sufficient to elicit a direct response in markets following the event.
Despite recent signs of persisting high inflation, Federal Reserve Chair Jerome Powell has indicated he will remain vigilant to ensure that inflation reaches the central bank's desired target of 2%. Nevertheless, he mentioned that the presence of ongoing robustness in the job market should not serve as a deterrent for reducing interest rates.
BoJ helped USDJPY to move higher
Shifting to Tuesday’s BoJ decision, the Japanese central bank has made a significant change by initiating the winddown of huge monetary stimulus that has been in place for decades. This includes ending eight years of negative interest rates and other unconventional monetary policies. The Bank increased interest rates from -0.1% to a range of between 0% and 0.1%, marking the first-rate hike since 2007. This decision concludes eight years of negative rates and comes in response to the biggest jump in salaries in three decades and the achievement of the inflation target coming withing sight.
The yen depreciated by 1% versus the dollar following the decision made by the BoJ. This decline was expected by most investors, as they had previously factored in the possibility of a change. Analysts believe that the "dovish hike" further solidified the belief that the yen carry trade is still ongoing.
USDJPY in Daily chart
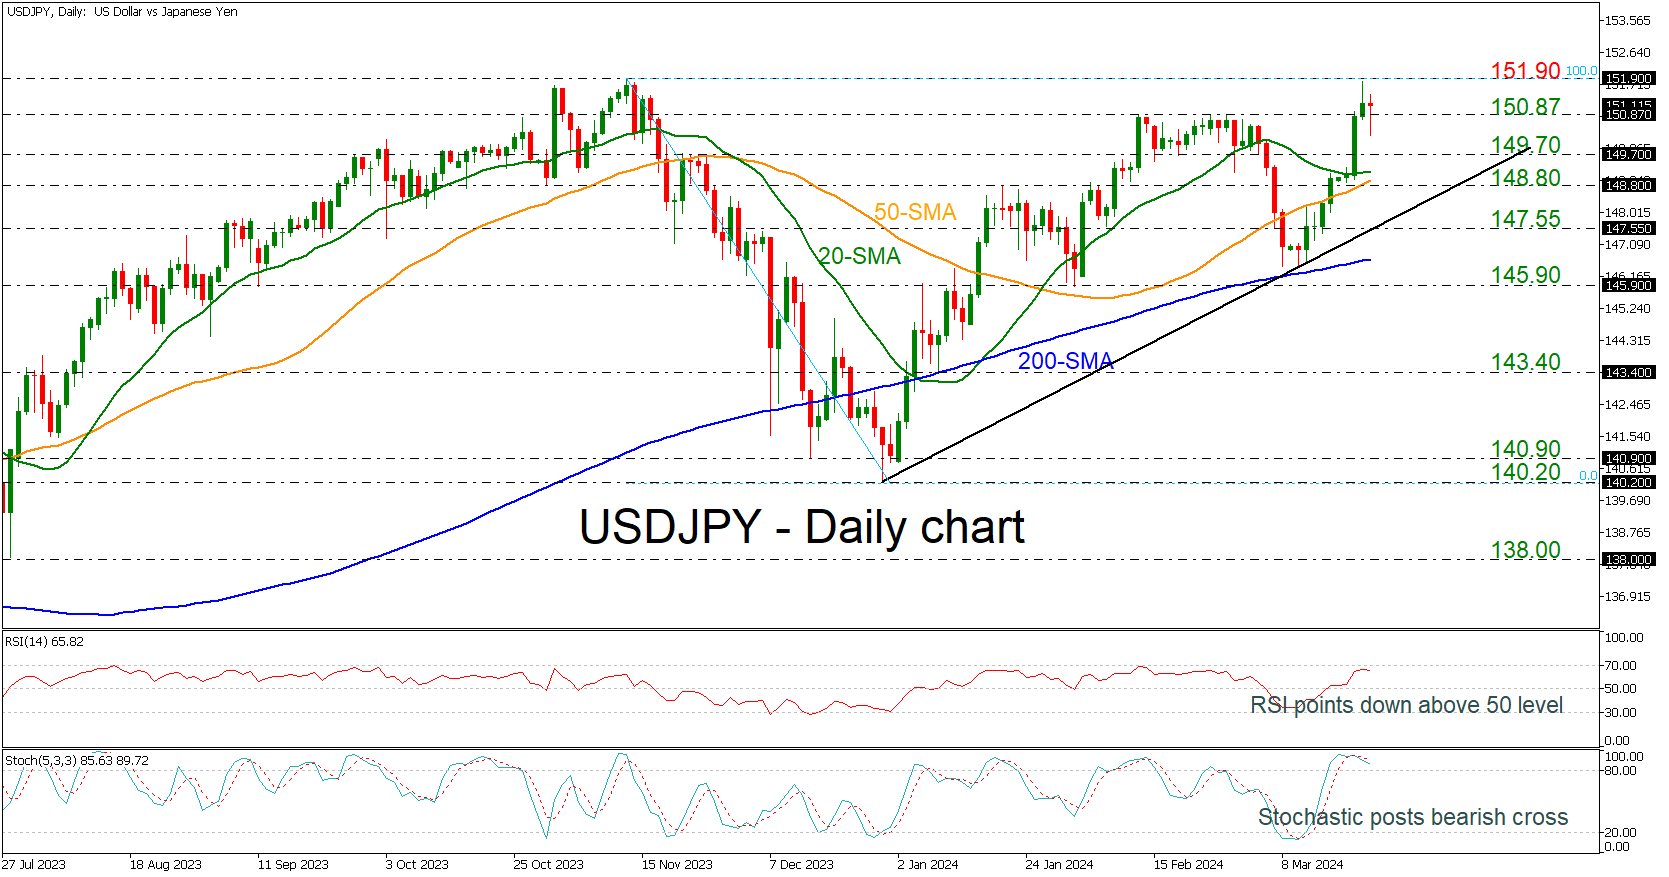
Looking the technical picture of USDJPY, the price failed to test again the previous peak of 151.90, achieved back on November 13 and some of the initial losses have been recouped. So the two policy meetings this week have had a contradicting effect on the pair. After the BoJ decision the pair reached the 150.87 resistance, extending the upside movement on Wednesday as well, until the Fed decision in the afternoon.
If the market continues the rebound off the medium-term ascending trend line, which has been drawn since December 28, then traders need to wait for a daily close above the 151.90 resistance to confirm another bullish wave. Even higher, the market may reach the next round numbers such as 153.00 and 154.00 until the 161.8% Fibonacci extension level of the down leg from 151.90 to 140.20 at 159.15.
However, a bearish retracement should not be excluded from the equation, as the technical oscillators are showing some negative signs. The RSI is pointing down, failing to climb above the 70 level, and the stochastic oscillator posted a bearish crossover within its %K and %D lines in the overbought territory, indicating a correction to the downside.
Any declines could drive the pair towards the next immediate support lines of 150.87 and 149.70 before challenging the 20- and the 50-day simple moving averages (SMAs) around the 149.00 handle. Even if the price touches the ascending trend line the broader outlook would remain positive and only a drop beneath the 200-day SMA at 146.64 may change the view to a more neutral one.
Bigger picture in weekly chart
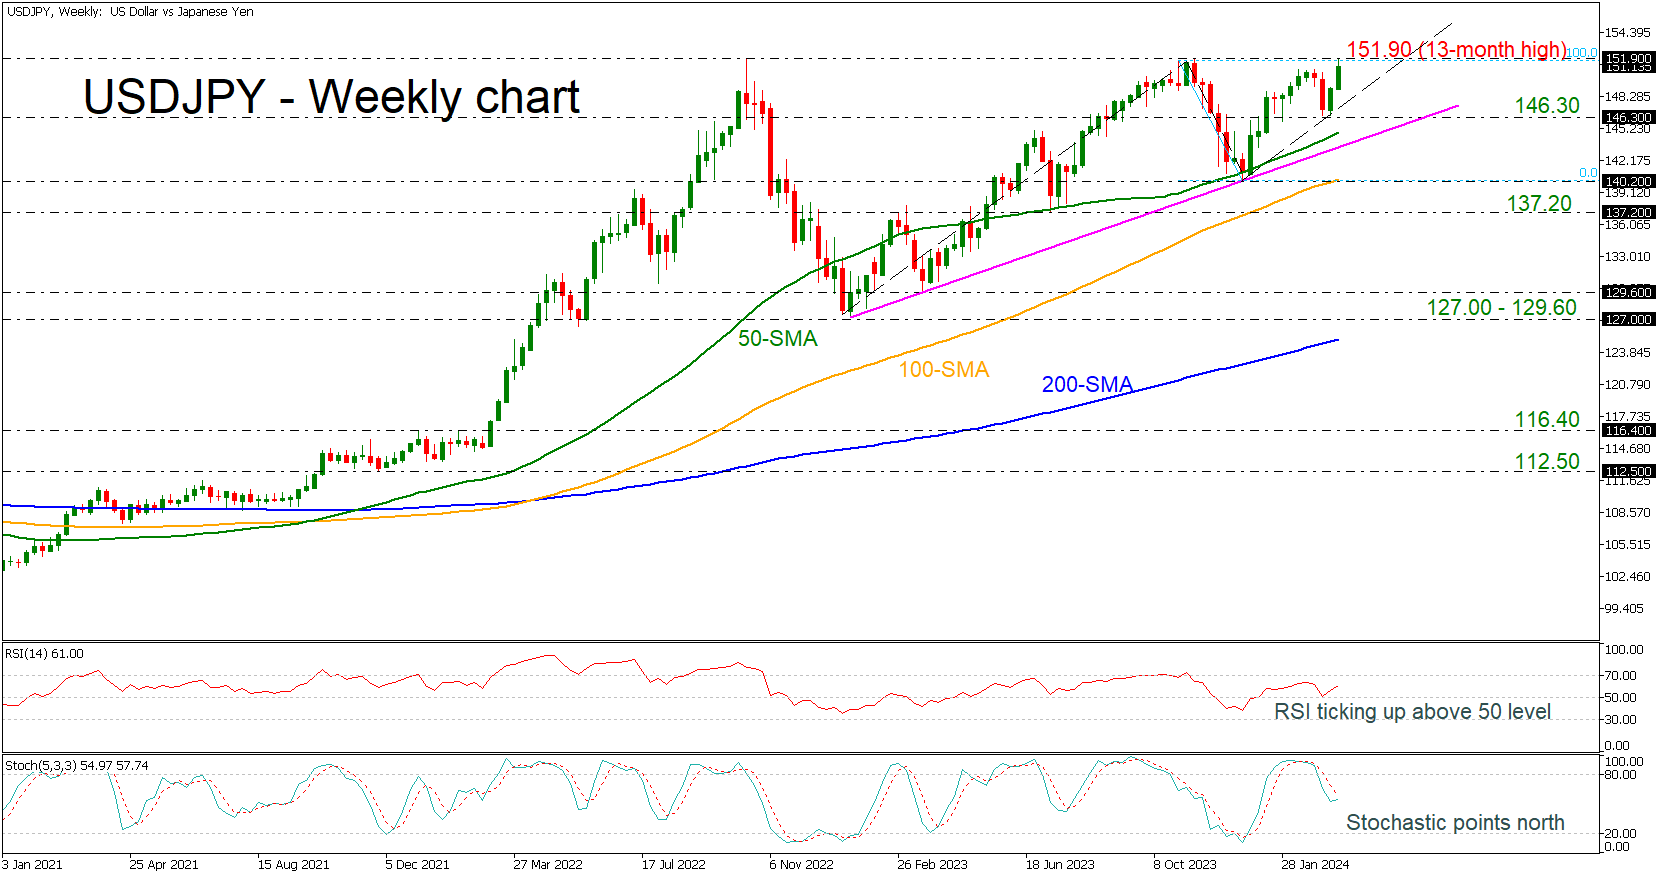
In the weekly chart, there are no signs for a downward movement and the price is still holding well above the long-term rising trend line. The RSI indicator is heading north above the neutral threshold of 50 and the stochastic is ticking higher, ready to post a bullish cross with the two lines. The SMAs are rising and following the current market reaction. In this bigger picture, a change of the outlook would come if there were fall beneath the 140.20 support line.
GBPUSD Elliott Wave : Buying The Dips At The Blue Box Area
Hello fellow traders.
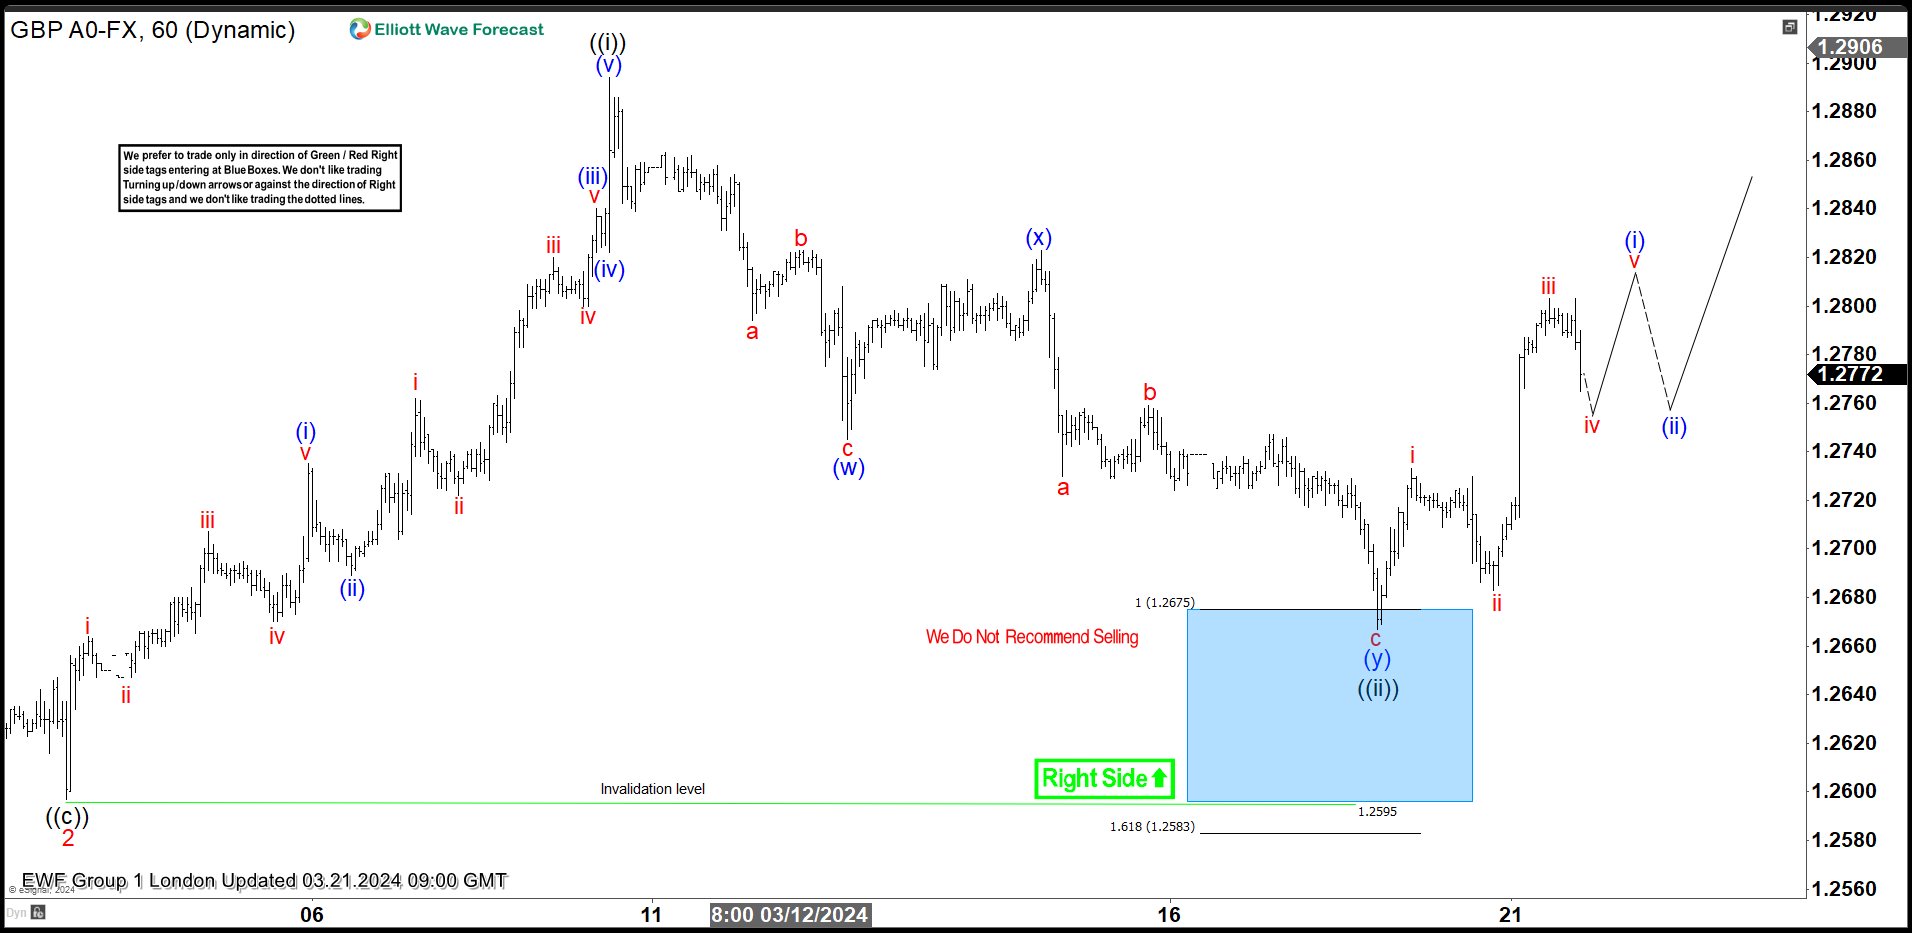
In this technical article, we’re going to take a look into the Elliott Wave charts of GBPUSD, exclusively presented in the members’ area of our website. As our members know GBPUSD has recently made pull back that made clear 3 waves down from the March 8th peak and completed correction right at the Equal Legs zone ( Blue Box Area) . In further text we’re going to explain the Elliott Wave pattern and trading setup.
GBPUSD Elliott Wave 1 Hour Chart 03.18.2024
The pair is correcting cycle from the 1.2597 low. The pull back is showing lower low sequences from March 8th peak. Current view suggests that the correction is still in progress. Our analysis forecasts further downside toward the 1.2675-1.2597 area ( blue box).
Despite the expected extension lower, we advise against selling GBPUSD. Upon reaching this blue box area, we anticipate the pair to attract buyers. We expect to se either rally towards new highs or a corrective bounce in three waves at least. Once the bounce reaches the 50% Fibonacci retracement level against the connector high, we’ll secure our position by moving the stop-loss to breakeven. To safeguard our trade, we’ll closely monitor for any break below the marked invalidation level : 1.2597.
A quick reminder:
Our charts are designed for simplicity and ease of trading:
Red bearish stamp + blue box = Selling Setup
Green bullish stamp + blue box = Buying Setup
Charts with Black stamps are deemed non-tradable. 🚫
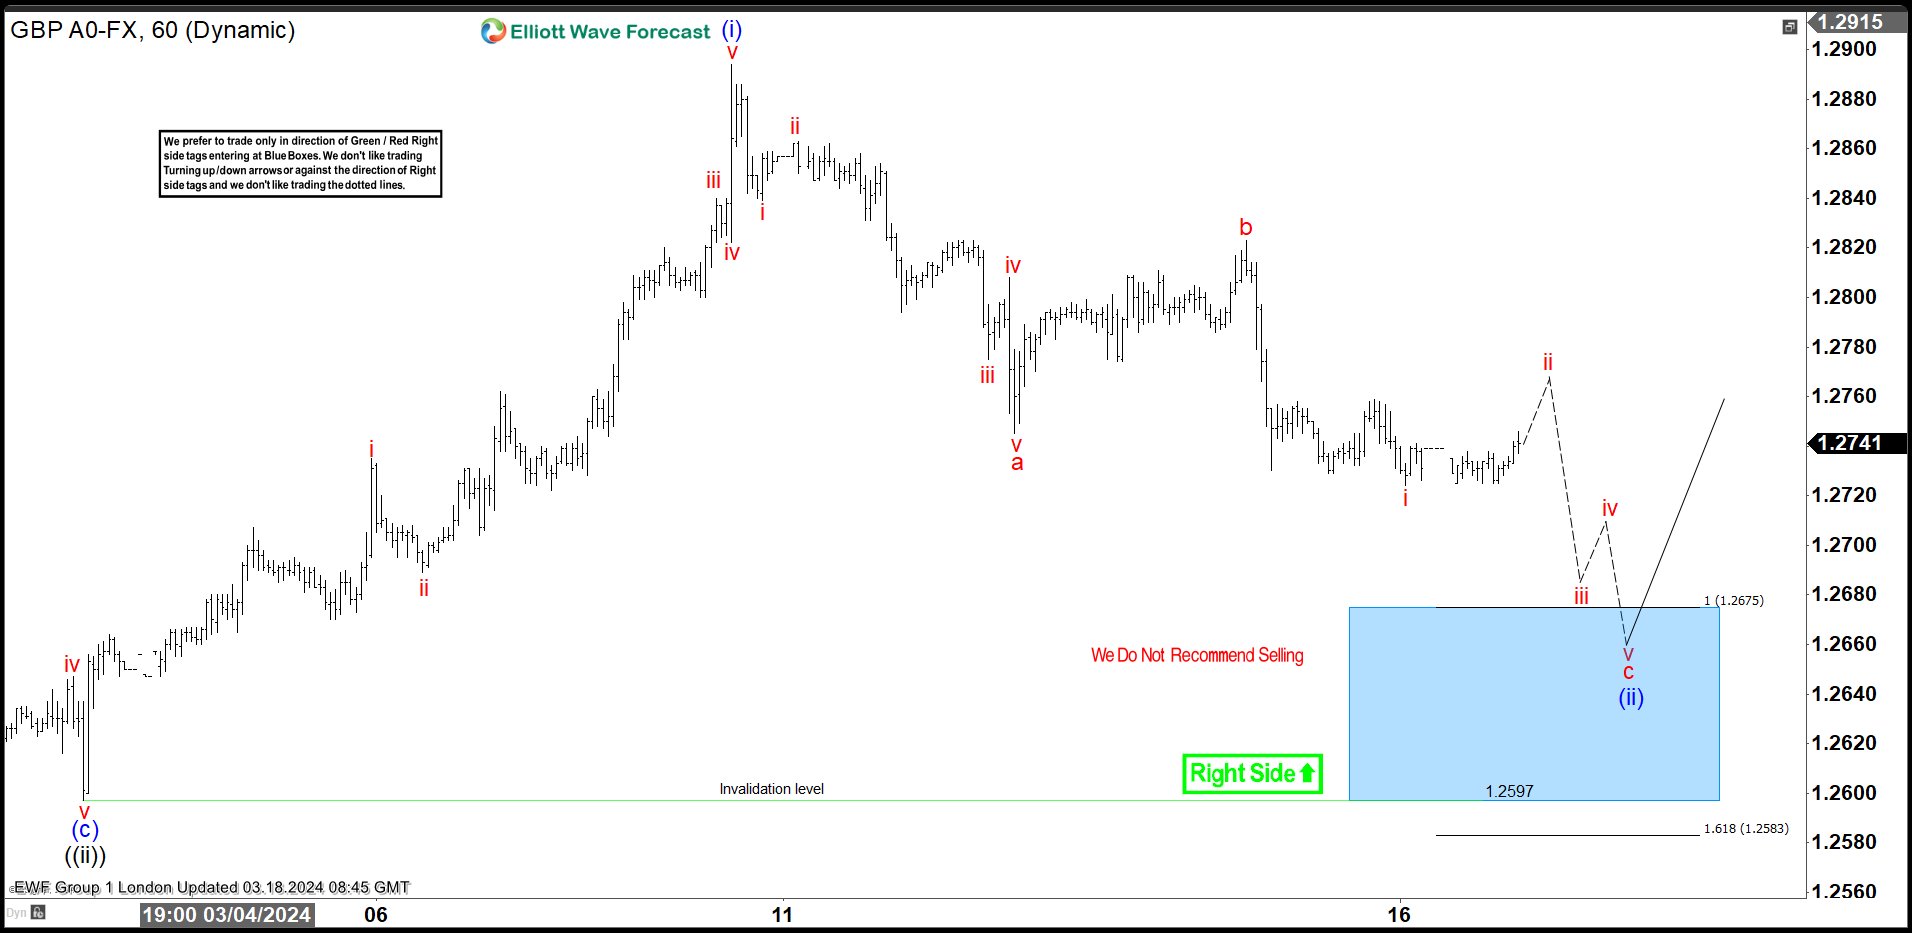
GBPUSD Elliott Wave 1 Hour Chart 03.21.2024
The pair found buyers within the Blue Box area as expected. We got a decent reaction from the 1.2667 low. As a result, traders who entered long positions are now enjoying risk-free profits. The bounce has exceeded the 50% Fibonacci retracement level against the connector peak. With the price holding above the 1.2667 low, we believe the next leg up can be in progress. For confirmation on the next leg up, we’re looking for a break above the((i)) black peak.
Crypto Finished Its Pullback Thanks to Fed
Market picture
The Fed’s comments returned risk appetite to global markets, immediately bringing buyers back to cryptocurrencies. In 24 hours, total market capitalisation rose 7.7% to $2.55 trillion. Bitcoin is showing roughly the same amplitude of growth, but Ethereum and Solana are adding around 10%.
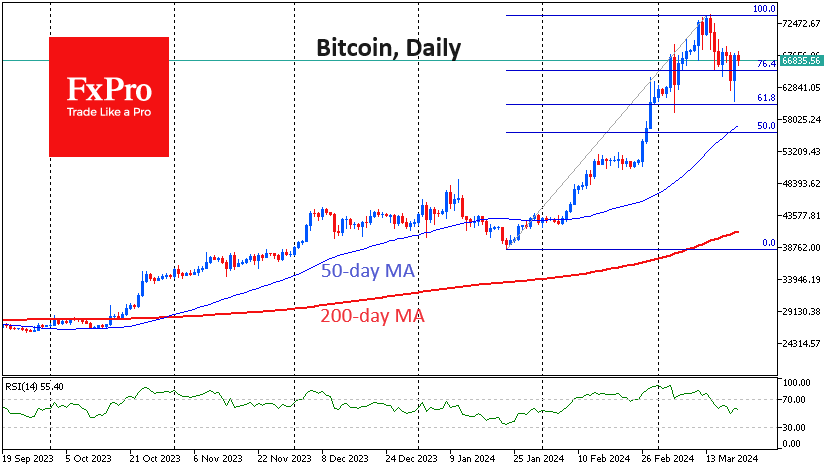
Bitcoin has held within a classic correction, never falling below 61.8% of the rally around $60.3K. If the positivity doesn’t dissipate quickly, the next major milestone will be a return to highs above $73K.
Ethereum reversed to the upside shortly after touching the 50-day moving average, confirming that this was a correction to the upside rather than a reversal to the downside. Solana lost over 22% between March 18th and 20th, from $210 to $162, and is back at $190 at the time of writing.
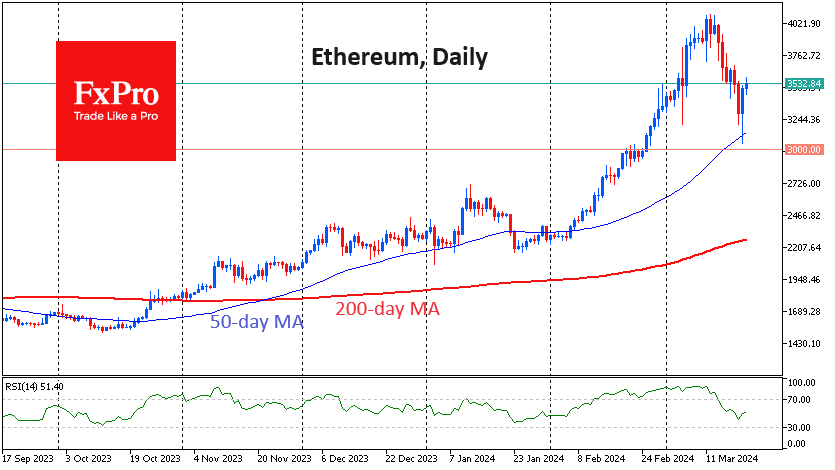
In all three cases, we have seen technical confirmation of the bullish trend and a sharp recovery from the correction. The pullback from the highs earlier in the week attracted active buyers on the back of Fed and other central bank weakness.
News Background
S&P Global Ratings released its ninth “stability assessment” of the major stablecoins. USDC, USDP and GUSD received a “strong” rating, while only Mountain Protocol’s USDM received an “adequate” rating. The USDT, DAI and FDUSD stablecoins were rated “limited”. The ratings of 4 out of 9 stablecoins were downgraded due to a lack of transparency or understanding of the risks associated with various stablecoins.
BlackRock, the largest asset management company, has filed to launch a USD Institutional Digital Liquidity Fund. This will be the company’s first fund with tokenised assets.
The SEC is seeking to designate the Ethereum cryptocurrency as a security, Fortune reported, citing unnamed US companies that have been subpoenaed by the court to provide documents needed for the investigation.
According to Bloomberg, the chances of spot Ethereum ETFs being approved in the US in May are getting slimmer. Regulators have shown little enthusiasm.
Since 12 March, the Solana ecosystem has hosted 33 pre-sale fundraising campaigns for token launches, raising a total of 796,000 SOL (~$139 million). The largest was the pre-sale of the Book of Meme (BOME) meme token, which has increased in value by around 40,000% since its launch.
USD/CHF Analysis: SNB Decision Breaks Multi-month Trend
According to Reuters, on the sidelines of the World Economic Forum in Davos in January, the head of the Swiss National Bank (SNB) Thomas Jordan told the Swiss press that the appreciation of the franc creates problems for exporters. Thus, indicating intentions to weaken the CHF.
His words in January seem to be in line with how events are developing — the franc has weakened against the US dollar by more than 6% since the start of the year.
Moreover, today, quite unexpectedly, the Swiss National Bank decided to lower the interest rate: actual = 1.50%, forecast = 1.75%, previous value = 1.75%.
The result of the decision today was a sharp weakening of the franc against other currencies, including the US dollar.
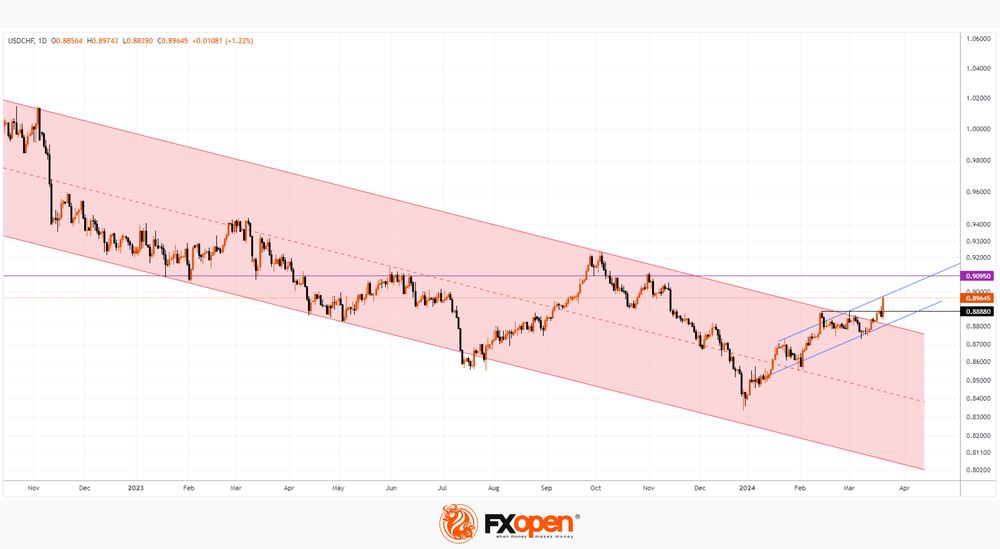
Technical analysis of the USD/CHF chart today shows that the bulls are breaking the downward trend (shown by the red channel), which dates back to the fall of 2022. Wherein:
→ the price of USD/CHF may continue to develop within the channel shown by the blue lines, including a rollback from the 4-month high;
→ in case of a rollback, the level of 0.8888 may constitute support (as a former resistance) - just like the lower blue line.
If the weakening of the franc, which is facilitated by the SNB, continues, the price of USD/CHF may reach the level of 0.9095 - near which the market has repeatedly formed reversals.
But most importantly, the easing of monetary policy by the SNB will likely serve as an example for the National Banks of other Western countries - which, in turn, will cause the emergence of new trends in the foreign exchange markets.
Trade over 50 forex markets 24 hours a day with FXOpen. Take advantage of low commissions, deep liquidity, and spreads from 0.0 pips. Open your FXOpen account now or learn more about trading forex with FXOpen.
This article represents the opinion of the Companies operating under the FXOpen brand only. It is not to be construed as an offer, solicitation, or recommendation with respect to products and services provided by the Companies operating under the FXOpen brand, nor is it to be considered financial advice.
GBPUSD Trims FOMC Rally Amid a Busy Day
- GBPUSD corrects lower after hitting resistance at 1.2800
- Technical signals weaken, but key support levels are underneath
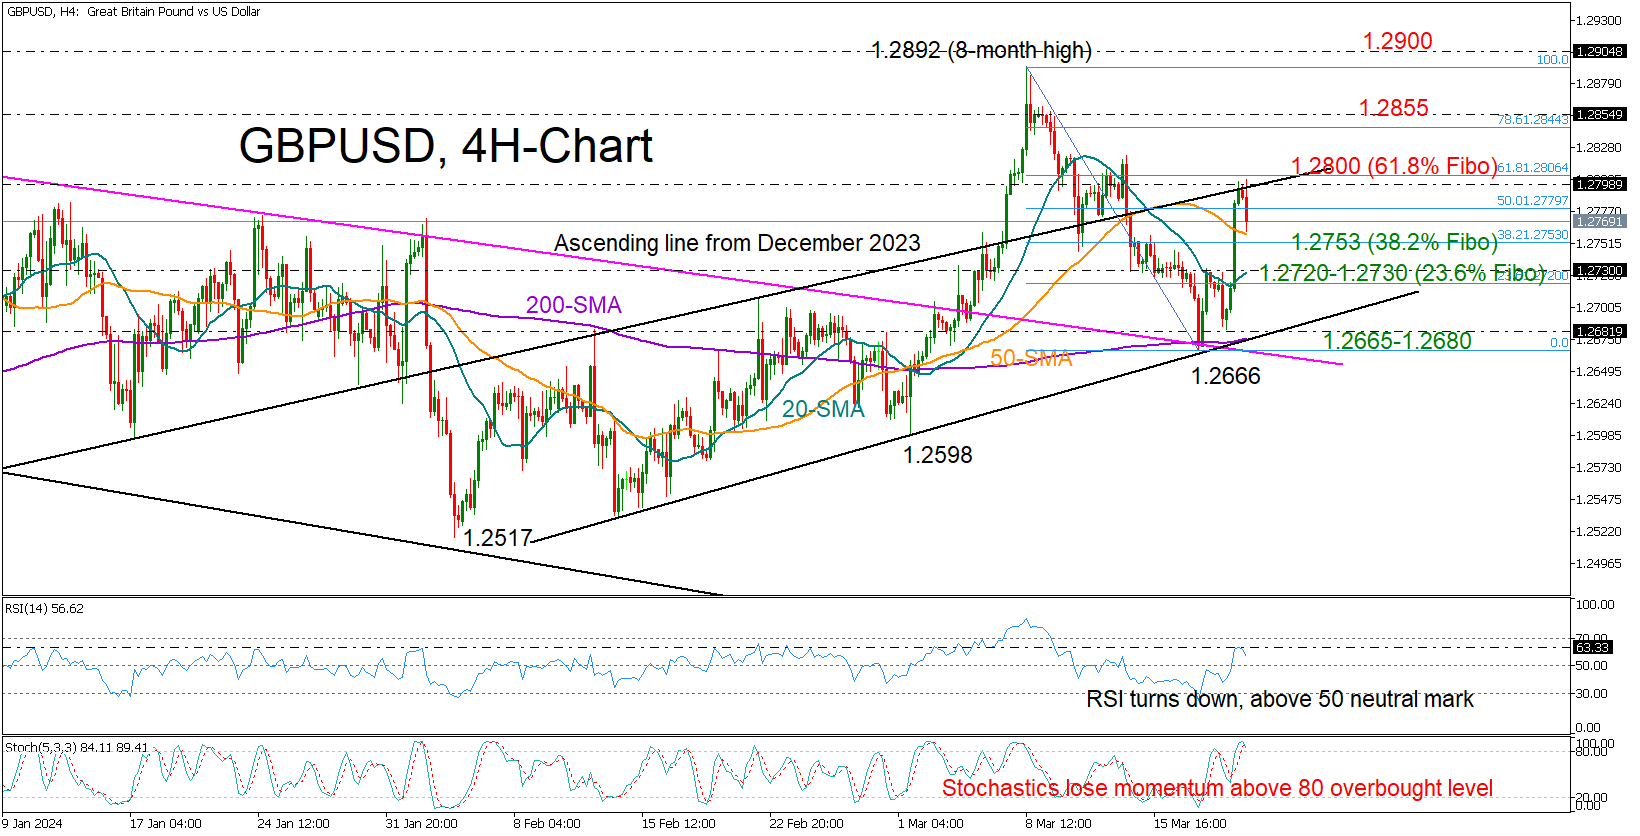
GBPUSD rose exponentially in the aftermath of the FOMC policy meeting, but the ascending line drawn from the December 2023 low interrupted the rally near the 1.2800 level and forced a new bearish move on Thursday before the BoE policy announcement due at 12:00 GMT.
On the four-hour chart, the stochastic oscillator appears to be losing momentum above its overbought level of 80, while the RSI is also decelerating after encountering a previous resistance zone, indicating a possible period of consolidation or a potential downturn.
The 50-period simple moving average (SMA) and the 38.2% Fibonacci of 1.2753 are now under the spotlight on the downside. Additional losses from there could head for the 20-period SMA and the 23.6% Fibonacci of 1.2720, a break of which could press the price into the 1.2666-1.2680 region.This is where the 200-period SMA and the support trendline from February are placed.
Otherwise, a bounce above the 1.2800 round level and the 61.8% Fibonacci mark could prompt a continuation towards the 1.2850 resistance. Running higher, the bulls could challenge the 1.2900 psychological number before making a speedy move towards the 1.2960-1.3000 constraining zone taken from July 2023.
In a nutshell, GBPUSD has entered a cautious zone as a result of the Fed boost. A decisive rebound above 1.2800 is now needed to shift the risk back to the upside.
Pound Edges Lower Ahead of BoE Meeting
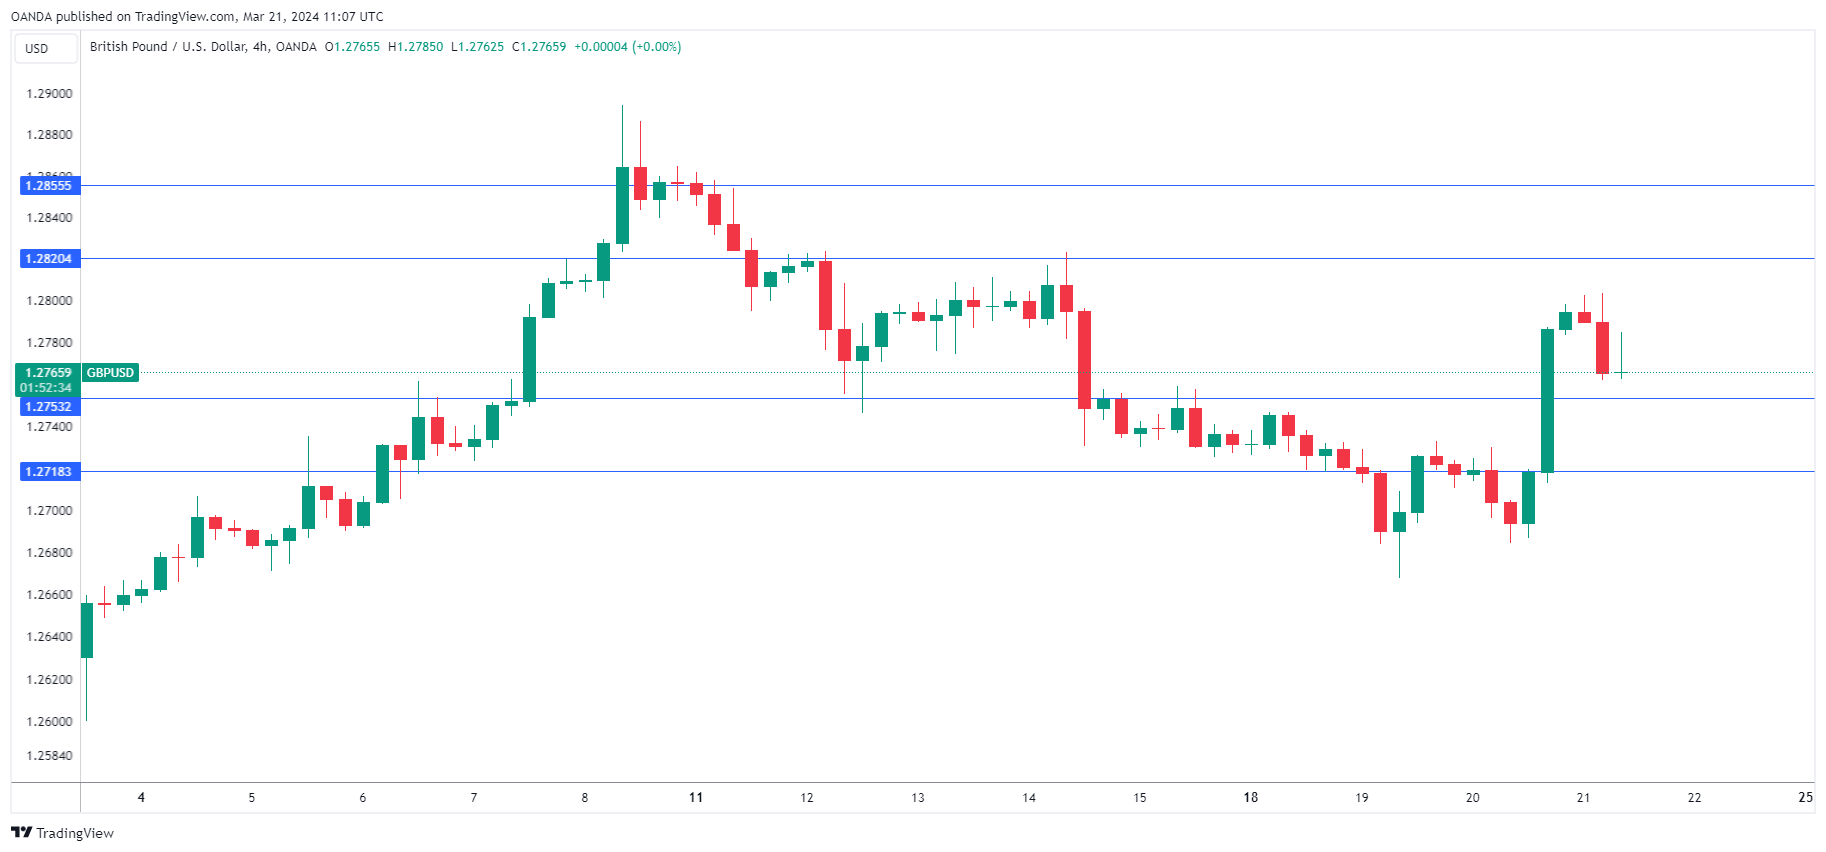
The British pound is slightly lower on Thursday. In the European session, GBP/USD is trading at 1.2766, down 0.16%.
BoE expected to hold rates
The markets will shift focus from the Federal Reserve, which maintained rates on Wednesday, to the Bank of England, which is holding its rate meeting later today.
The BoE is widely expected to maintain the cash rate at 5.25% at today’s meeting but investors will be looking for signals of a rate cut, especially after the inflation report on Wednesday, which was lower than expected.
The central bank hasn’t jumped on the rate-cut bandwagon, although the markets have priced in an initial rate cut in June. The sharp fall in both headline and core CPI for March won’t affect today’s meeting but could prod the Monetary Policy Committee to hint at a rate cut. If the MPC provides such a hint, it would likely weigh on the British pound.
It should be remembered that at the previous meeting in February, two of the nine MPC members voted for a rate increase, which shows that some policy makers are concerned that inflation could rebound if the BoE cuts rates too soon.
Federal Reserve maintain rates, remains cautious
The Federal Reserve held the benchmark rate at a target range of 5% to 5.25%, as was widely expected. The Fed maintained its projection of three rate cuts this year and revised its GDP forecast for 2024 to 2.1%, up from 1.4% in December. Fed Chair Powell acknowledged that inflation was falling and the US economy was strong, but said that the Fed would not start to cut rates until it was clear that inflation was moving sustainably towards the 2% target.
GBP/USD Technical
- GBP/USD is putting pressure on support at 1.2753. Below, there is support at 1.2718
- There is resistance at 1.2820 and 1.2855
UK PMI manufacturing hits 20-month high, services ease slightly
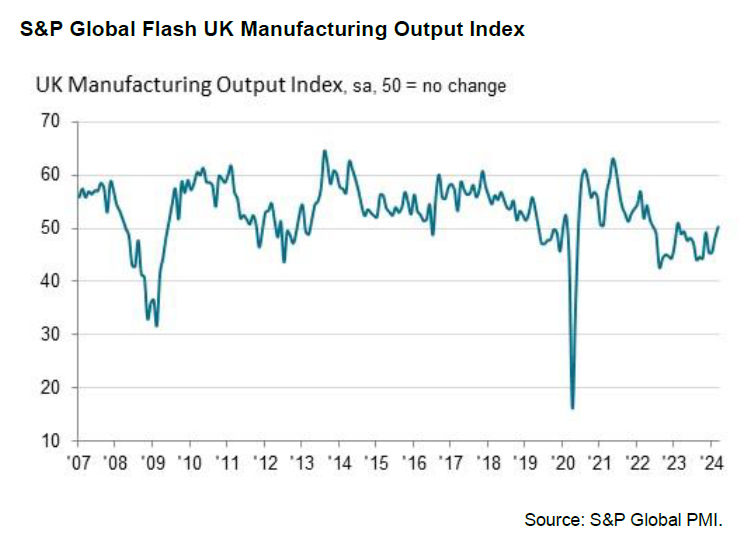
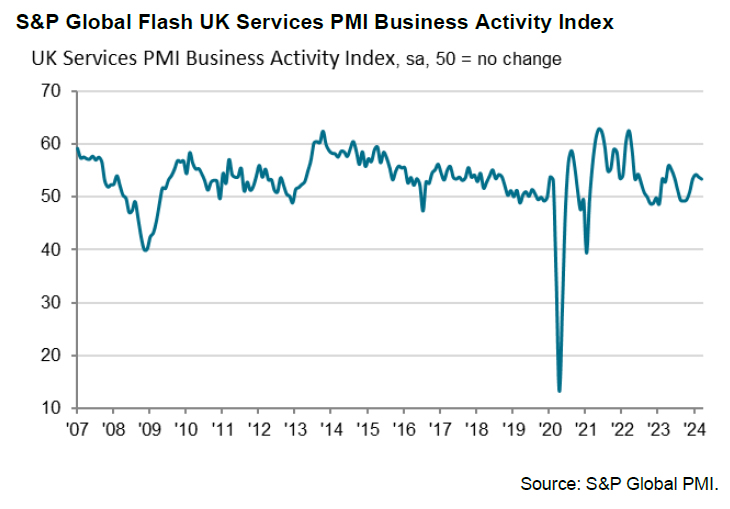
UK PMI Manufacturing rose from 47.5 to 49.9 in March, above expectation of 47.9, a 20-month high. PMI Services fell slightly from 53.8 to 53.4, below expectation of 53.8. PMI Composite ticked down from 53.0 to 52.9.
Chris Williamson, Chief Business Economist at S&P Global Market Intelligence, interprets the data as evidence of UK's recovery from the recession in the latter half of 2023. The aggregate business activity for Q1 suggests 0.25% GDP growth, marking the best quarter since mid-last year
Despite the optimistic growth indicators, inflation remains a pressing issue, particularly in the services sector, where "stubbornly sticky" inflation pressures continue. Moreover, the manufacturing sector saw "renewed inflation".
While the overall inflation rate is expected to decline in the coming months, March's PMI data point to "elevated underlying price pressures," possibly influencing BoE to exercise caution. Williamson, suggests that a decisive shift towards lower interest rates should only occur once there is clear evidence of moderating wage growth.
AUDUSD Advances Sharply in the FOMC Aftermath
- AUDUSD was in a steady retreat since early March
- But finds feet and reclaims both SMAs after dovish FOMC
- Momentum indicators improve drastically
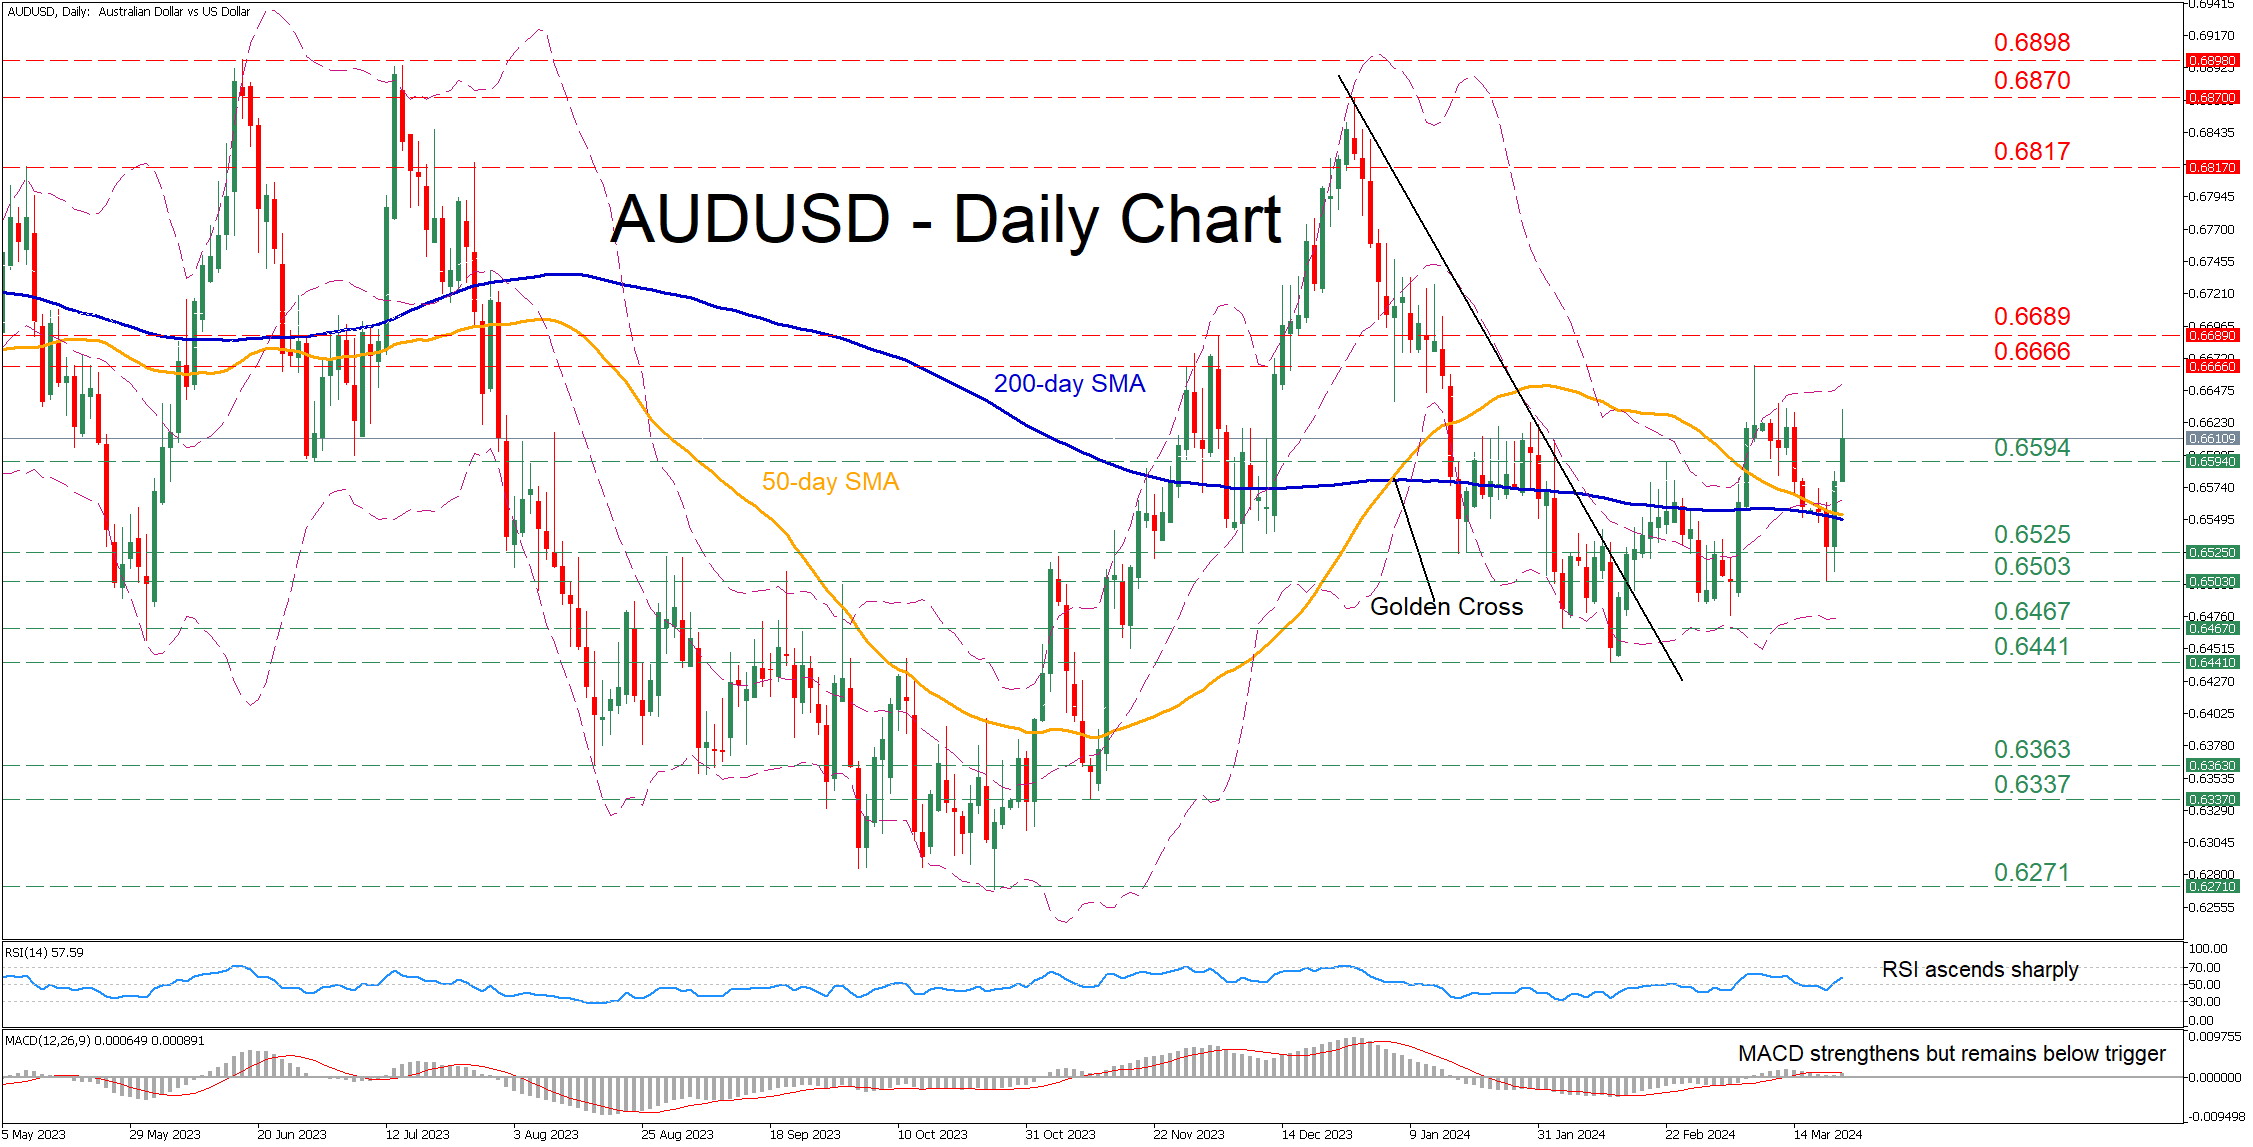
AUDUSD had been losing ground since the beginning of March, dropping below its descending 50- and 200-day simple moving averages (SMAs). However, the pair managed to pause its retreat and reverse back higher with some help from the dovish FOMC signals on Wednesday.
Should the advance resume, the price could initially test the March peak of 0.6666. Further upside attempts could then cease at the December 2023 resistance of 0.6689 ahead of the May 2023 high of 0.6817. If that hurdle also fails, the spotlight could turn to the December high of 0.6870.
On the flipside, bearish actions could send the price lower to test the recent resistance of 0.6594, which could serve as support in the future. A violation of that zone could pave the way for 0.6525, a region that provided both support and resistance in recent months. Even lower, the recent deflection point of 0.6503 could curb further declines.
In brief, AUDUSD managed to put an end to its recent slide and reclaim its converging 50- and 200-day SMAs. For the short-term picture to turn bullish though, the pair needs to jump above its March high of 0.6666.
EUR/USD Soars Following Fed’s Decision on Interest Rate Cuts
The EUR/USD pair soared to a weekly high of 1.0933 on Thursday following the Federal Reserve System's announcement of three interest rate cuts planned for 2024. These adjustments will reduce borrowing costs by 75 basis points.
The interest rate remains at 5.5% annually, its highest in 23 years, and has been unchanged for five consecutive meetings.
Federal Reserve Chair Jerome Powell noted that the regulator plans to reduce the rate this year, likely achieving a 75-basis point reduction over three stages by the end of 2024.
The Fed also continues its balance sheet contraction plan, not reinvesting proceeds from matured bonds and having no plans to sell bonds from its portfolio.
The Fed's outlook was relatively optimistic this time, expecting the American economy to grow by 2.1% quarter-on-quarter in Q1 2024. Although the Consumer Price Index is decreasing, it is still high, and the employment market is strong due to new job creation.
The Fed's inflation target remains at 2%, with risks to expectations seen as balanced.
EUR/USD technical analysis
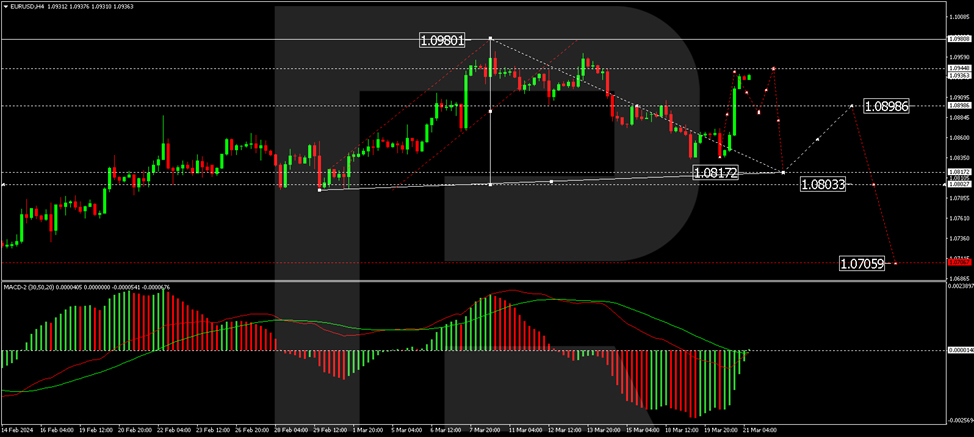
Influenced by the news, the H4 EUR/USD chart found support at 1.0836, leading to a correction. Today, the price is anticipated to reach 1.0944, followed by a subsequent downward movement targeting 1.0818. The MACD indicator supports this scenario, with its signal line below zero, indicating further declines to new lows.
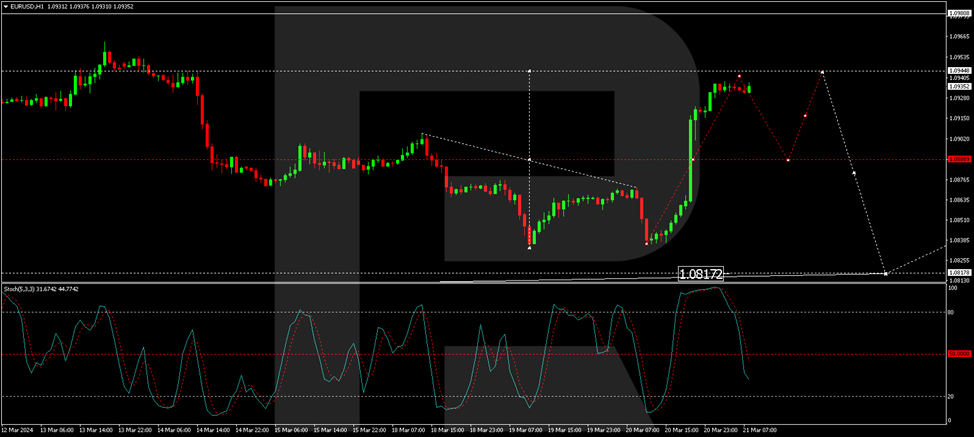
On the H1 EUR/USD chart, a corrective growth structure towards 1.0940 has formed. After reaching this level, a decline to 1.0888 is possible, followed by a potential rise to 1.0944. Then, a new downward wave to 1.0818, the first target, may begin. The Stochastic oscillator, with its signal line below 50, indicates a continuation of the decline towards 20.
Eurozone PMI composite ticks up to 49.9, price development not enough to alter ECB’s course
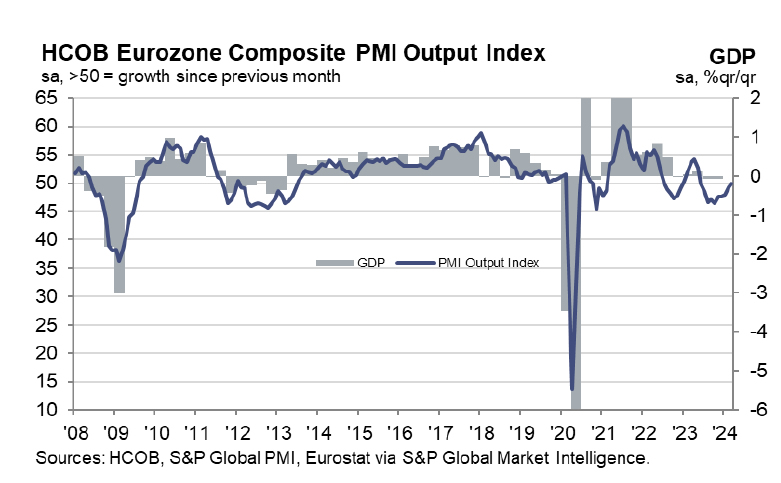
Eurozone PMI Manufacturing from 46.5 to 45.7 in March, below expectation of 47.0. PMI services, on the other hand rose from 50.2 to 51.5, above expectation of 50.5 a 9-month high. PMI Composite ticked up from 49.2 to 49.9, also a 9-month high.
Cyrus de la Rubia, Chief Economist at Hamburg Commercial Bank, highlighted the "clear weakness" in manufacturing, attributing it largely to Germany's industrial performance. On a brighter note, the further expansion in the services PMI is considered a "positive development."
From a monetary policy perspective, ECB may find some solace in the report's implications on inflationary pressures. Notably, the services sector, which is typically sensitive to wage dynamics, has not seen a further escalation in price pressures.
However, these developments, as de la Rubia notes, are "not enough" to alter the ECB's tentative plan to commence rate cuts in June, rather than an earlier move in April.
Also released, France PMI Manufacturing fell from 47.1 to 45.8. PMI Services fell from 48.4 to 47.8. PMI Composite fell from 48.1 to 47.7.
Germany PMI Manufacturing fell from 42.5 to 41.6. PMI Services rose from 48.3 to 49.8. PMI Composite rose from 46.3 to 47.4.