

Sample Category Title
CHF/JPY Technical: Potential Major Bullish Trend Exhaustion
- The recent significant increase of a total of 20 bps in the 2-year JGB yield since the start of the year has come in line with the highly anticipated rosy results of the annual wage negotiations in Japan.
- In the past week, the JPY crosses have come under downside pressure as the carry trade strategy loses its appeal.
- Watch the 168.75 key short-term resistance on the CHF/JPY.
The JPY crosses have continued to face downside pressure in the recent week ahead of key related risk events such as the release of the preliminary FY 2024/2025 wage negotiation results in Japan by the latest labour union federation, Rengo on this Friday, 15 March (see Fig1).
Expectations have been optimistic as the consensus forecast is pegged at an average pay rise of 3.85% for FY 2024/2025 (above last year’s annualized gain of 3.58%), and if It turns out as expected, it will be the largest wage increase in Japan since 1993.
JPY crosses under downside pressure as carry trade strategy loses appeal
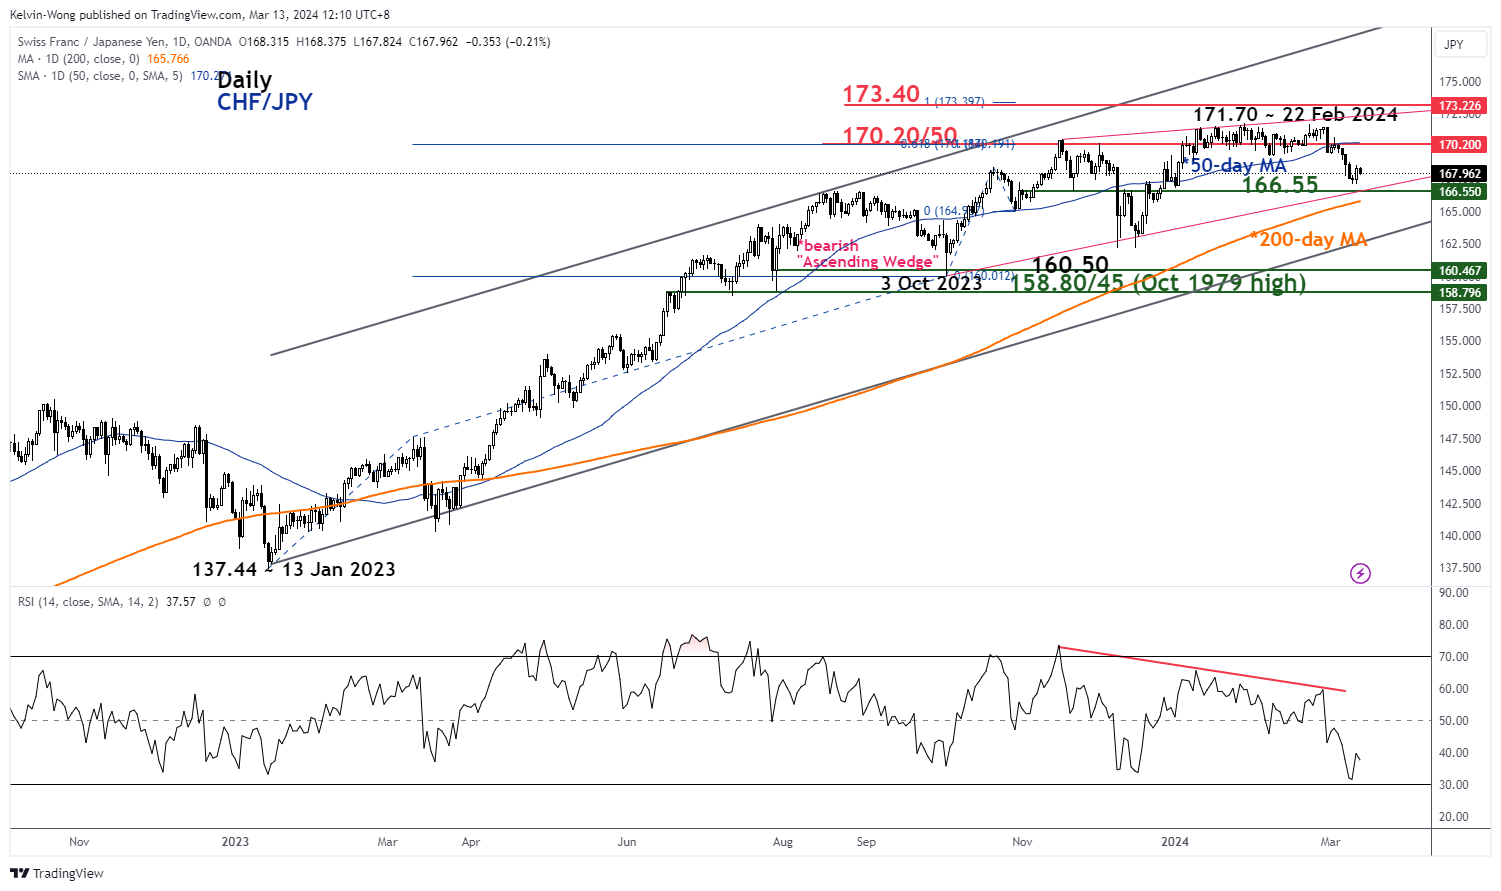
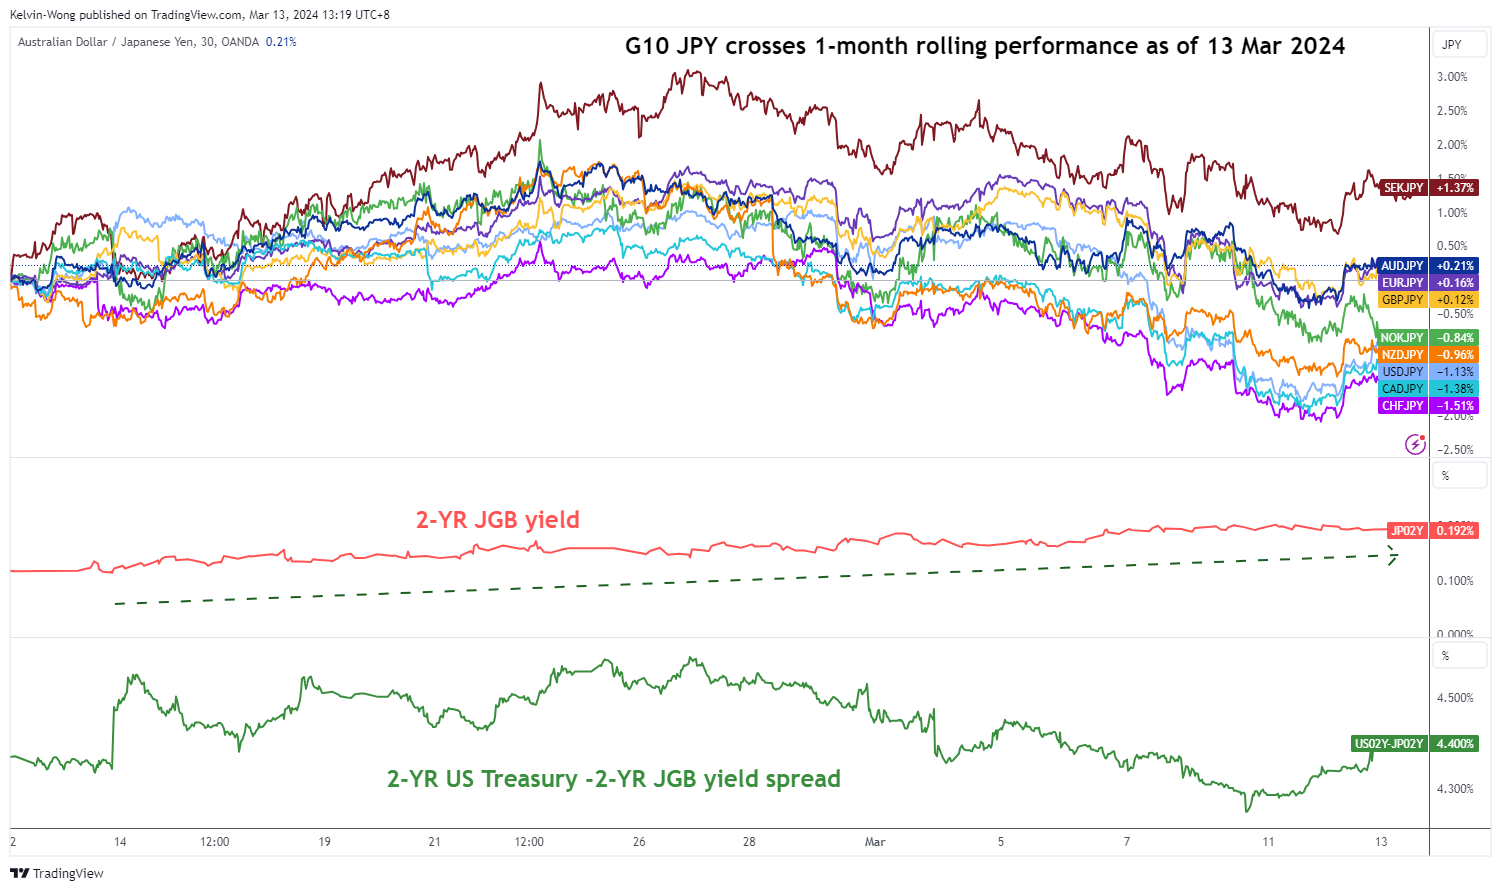
Fig 1: 1-month rolling performances of G-10 JPY crosses as of 13 Mar 2024 (Source: TradingView, click to enlarge chart)
The CHF/JPY is the worst performer among the JPY crosses as it shed -1.50% based on a one-month rolling performance basis as of today, 13 March in line with the rosy anticipated outcome of the Japanese employee’s wage negotiation results.
The primary driver of JPY strength has been the rising 2-year Japanese Government Bond (JGB) yield as it rose by a whopping 20 basis points (bps) from close to 0% at the start of January to 0.20% on 11 March as market participants have started to price in a more hawkish Bank of Japan (BoJ) going forward to either scrapped off its short-term negative interest rates policy next Tuesday, 19 March or on the 26 April monetary policy meeting.
Bearish “Ascending Wedge” detected in CHF/JPY
Fig 2: CHF/JPY major & medium-term trends as of 13 Mar 2024 (Source: TradingView, click to enlarge chart)
The major uptrend phase of CHF/JPY in place since the 13 January 2024 low of 137.44 is likely in jeopardy through the recent appearance of an impending bearish “Ascending Wedge” configuration that has taken shape from the 3 October 2023 low (see Fig 2).
The formation of the “Ascending Wedge” suggests a potential major bullish trend exhaustion condition as the magnitude of its upper boundary that connects its “higher highs” is lesser than the slope of its “lower lows” (lower boundary).
In addition, the daily RSI momentum indicator has flashed a bearish divergence condition.
Oscillating within a minor descending channel
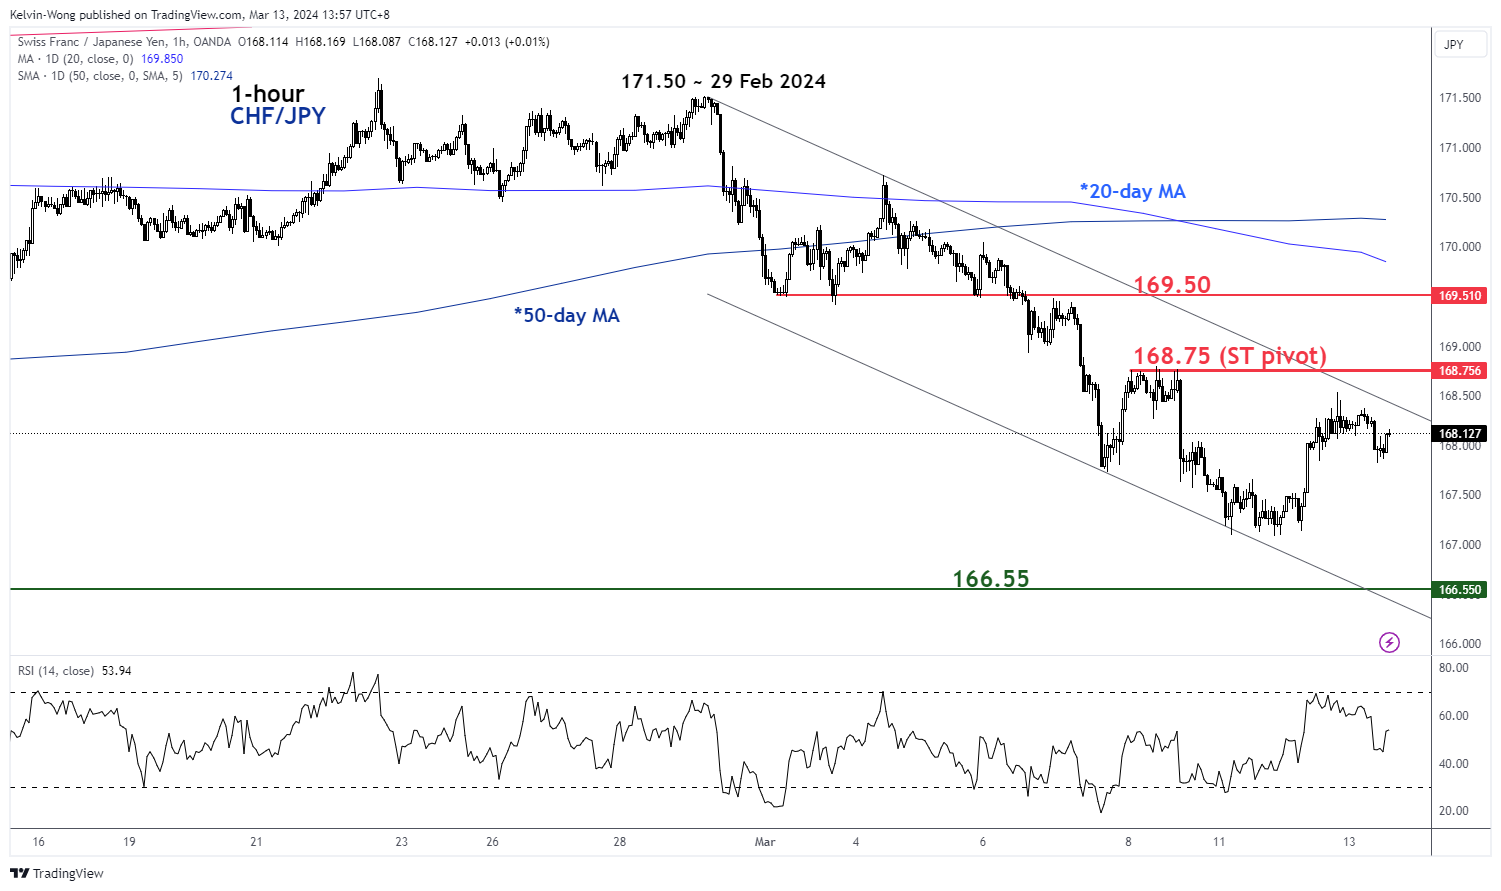
Fig 3: CHF/JPY short-term trend as of 13 Mar 2024 (Source: TradingView, click to enlarge chart)
In the shorter term as seen on its hourly chart, the price actions of CHF/JPY have started to oscillate within a minor descending channel in place since 29 February 2024 high of 171.50.
If the 168.75 short-term pivotal resistance is not surpassed to the upside, it may see further potential weakness to expose the next intermediate support at 166.55 (close to the lower boundary of the “Ascending Wedge) in the first step (see Fig 3).
On the other hand, a clearance above 168.75 negates the bearish tone for the next near-term resistance to come in at 169.50 (also the downward-sloping 20-day moving average).
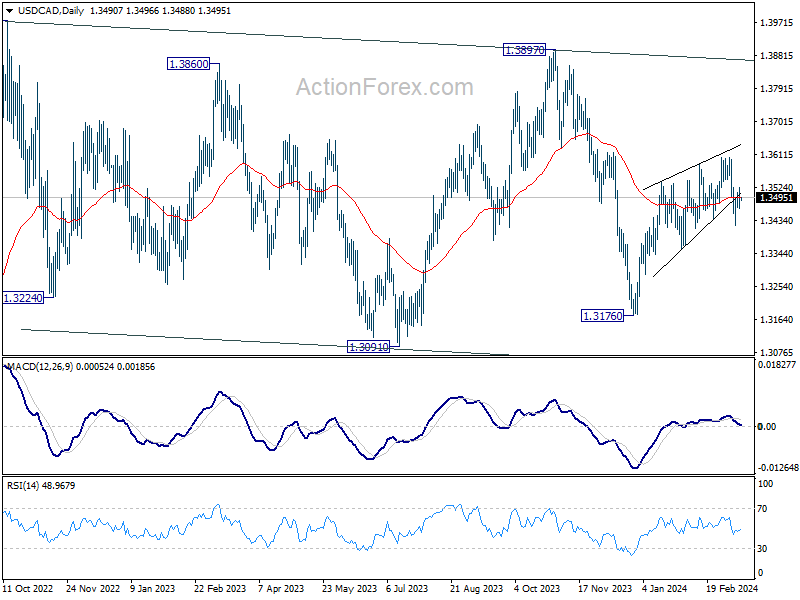
USD/CAD Daily Outlook
Daily Pivots: (S1) 1.3463; (P) 1.3495; (R1) 1.3522; More...
Intraday bias in USD/CAD remains neutral for the moment. On the downside, break of 1.3419 and sustained trading below 1.3439 support will argue that rebound from 1.3176 has completed as a corrective move to 1.3605. Near term outlook will be turned bearish for 1.3357 support first. On the upside, though, break of 1.3524 minor resistance will revive near term bullishness, and turn bias back to the upside for retesting 1.3605 resistance instead.
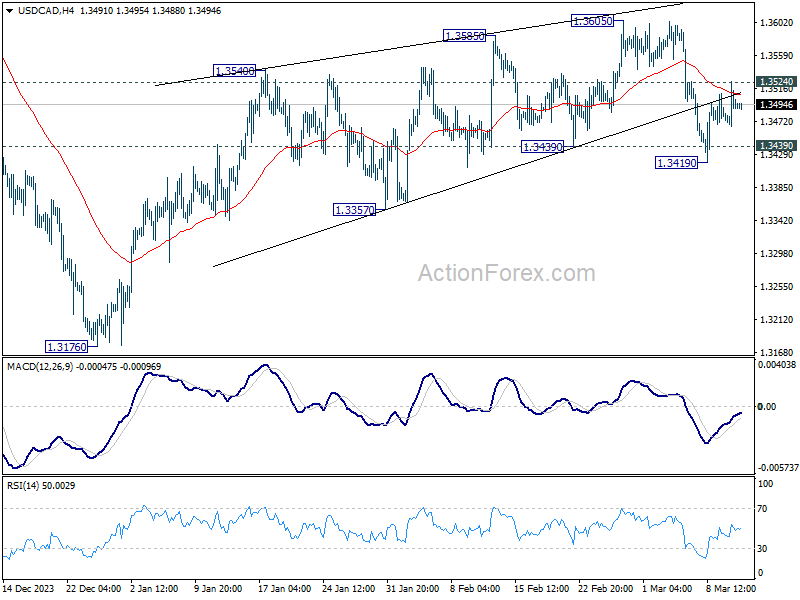
In the bigger picture, price actions from 1.3976 (2022 high) are viewed as a corrective pattern only. In case of another fall, strong support should emerge above 1.2947 resistance turned support to bring rebound. Overall, larger up trend from 1.2005 (2021 low) is still expected to resume through 1.3976 at a later stage.
AUD/USD Daily Report
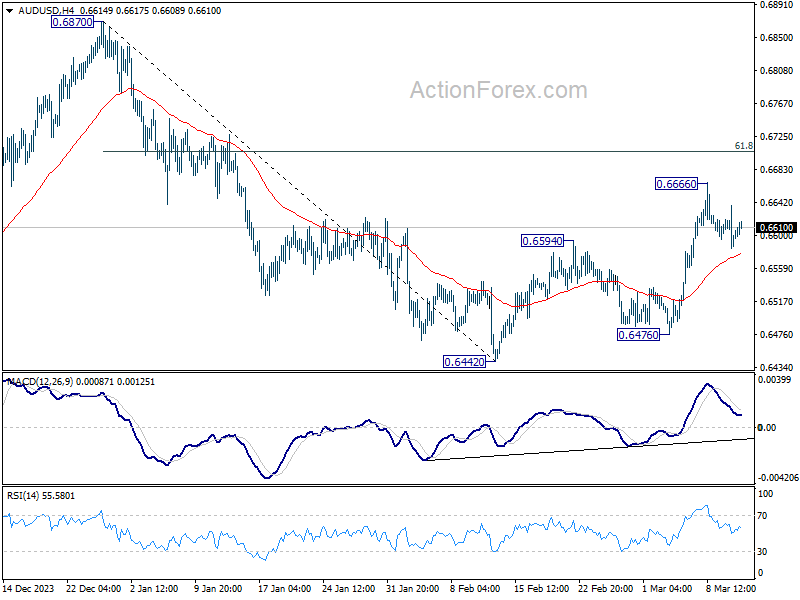
Daily Pivots: (S1) 0.6581; (P) 0.6610; (R1) 0.6635; More...
Intraday bias in AUD/USD stays neutral at this point. Another rise will be mildly in favor as long as 55 4H EMA (now at 0.6577) holds. Above 0.6666 will resume the rebound from 0.6442 to 61.8% retracement of 0.6877 to 0.6442 at 0.6707 next. Sustained trading above there will argue rise from 0.6442 is probably resuming whole rally from 0.6269. Nevertheless, sustained break of 55 4H EMA will revive near term bearishness and bring retest of 0.6442 low instead.
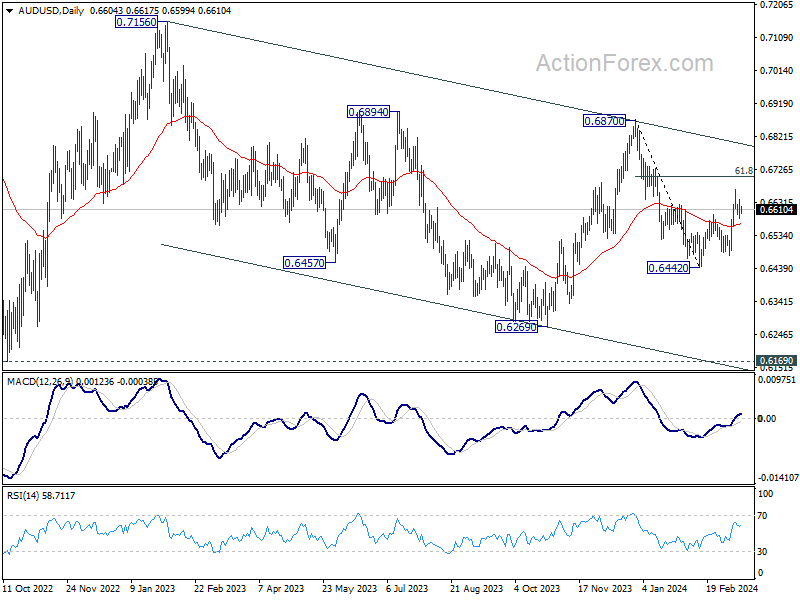
In the bigger picture, price actions from 0.6169 (2022 low) are seen as a medium term corrective pattern to the down trend from 0.8006 (2021 high). Fall from 0.7156 (2023 high) is seen as the second leg, which might still be in progress. Overall, sideway trading could continue in range of 0.6169/7156 for some more time. But as long as 0.7156 holds, an eventual downside breakout would be mildly in favor.
EUR/USD Daily Outlook
Daily Pivots: (S1) 1.0904; (P) 1.0924; (R1) 1.0946; More...
Intraday bias in EUR/USD remains neutral for the moment. Further rise is in favor as long as 55 4H EMA (now at 1.0892) holds. Above 1.0980 will resume the rally from 1.0694 to retest 1.1138 high). However, sustained break of the EMA will turn bias to the downside for 1.0797 support instead.
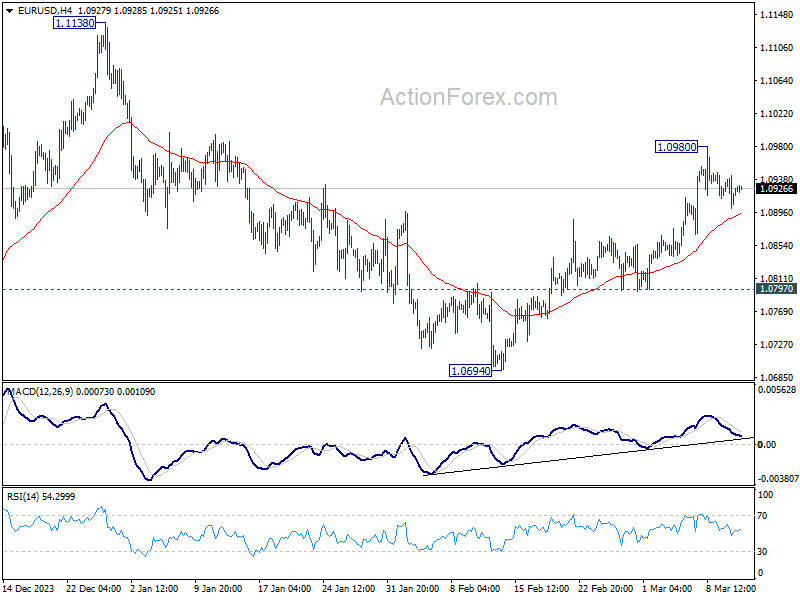
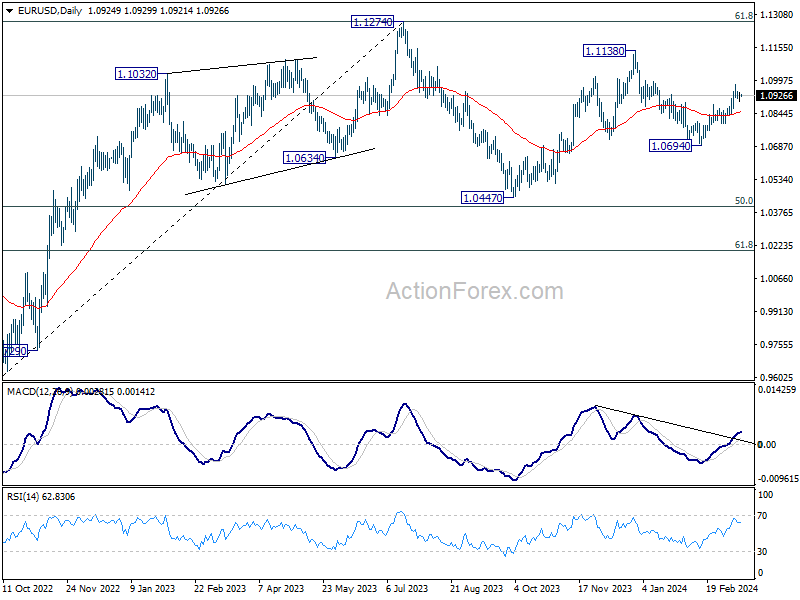
In the bigger picture, price actions from 1.1274 are viewed as a corrective pattern to rise from 0.9534 (2022 low). Rise from 1.0447 is seen as the second leg. While further rally could cannot be ruled out, upside should be limited by 1.1274 to bring the third leg of the pattern. Meanwhile, sustained break of 1.0694 support will argue that the third leg has already started for 1.0447 and possibly below.
GBP/USD Daily Outlook
Daily Pivots: (S1) 1.2751; (P) 1.2788; (R1) 1.2829; More...
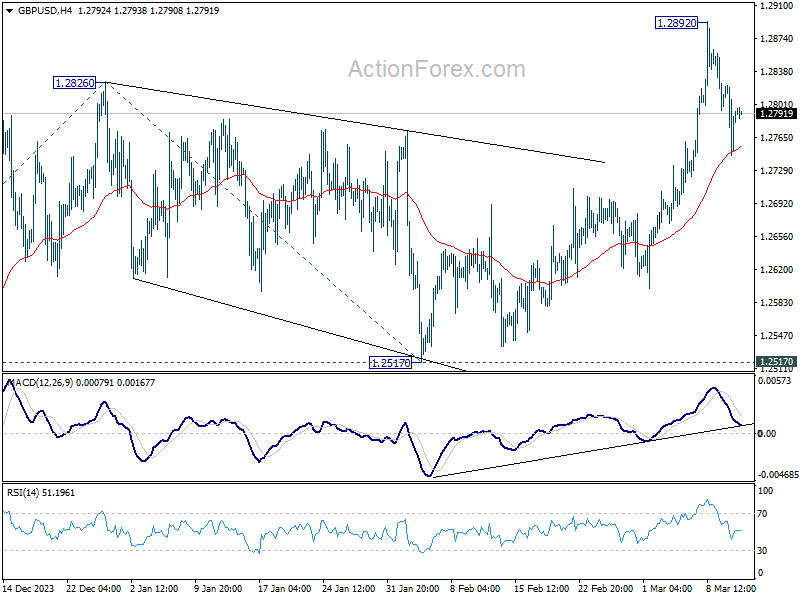
Intraday bias in GBP/USD remains neutral for the moment. Further rally will remain in favor as long as 55 4H EMA (now at 1.2755) holds. On the upside, above 1.2892 will resume larger rise from 1.2063 and target 61.8% projection of 1.2036 to 1.2826 from 1.2517 at 1.3005. However, sustained break of 55 4H EMA will bring deeper fall back towards 55 D EMA (now at 1.2662), and possibly further to 1.2517 structural support.
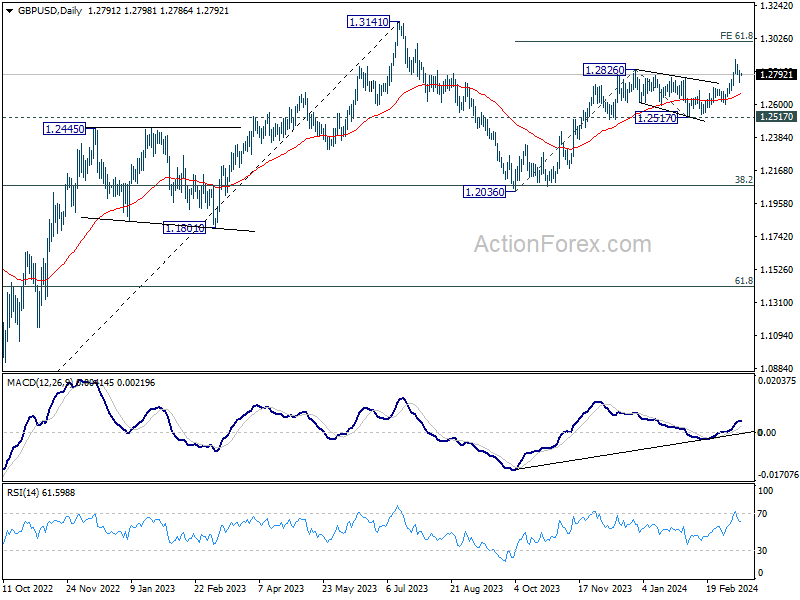
In the bigger picture, price actions from 1.3141 medium term top are seen as a corrective pattern to up trend from 1.0351 (2022 low). Rise from 1.2036 is seen as the second leg, which is still in progress. But upside should be limited by 1.3141 to bring the third leg of the pattern. Meanwhile, break of 1.2517 support will argue that the third leg has already started for 38.2% retracement of 1.0351 (2022 low) to 1.3141 at 1.2075 again.
USD/CHF Daily Outlook
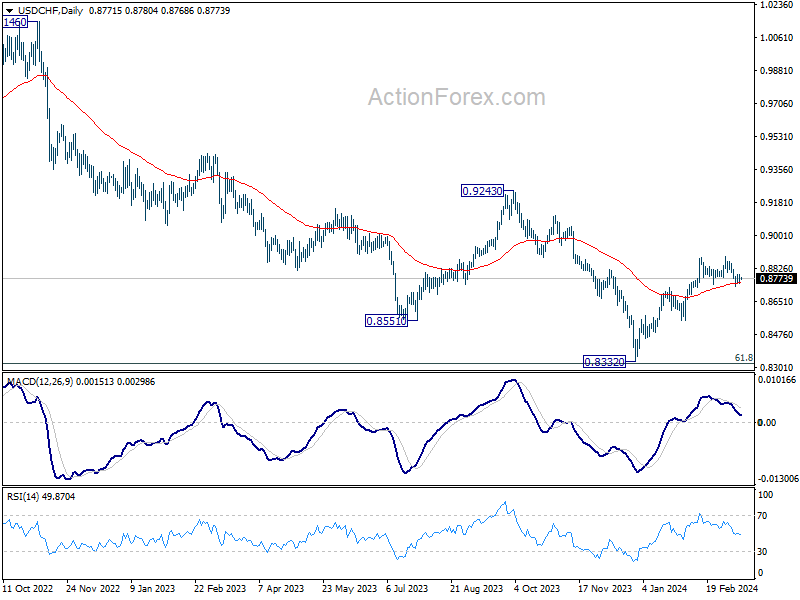
Daily Pivots: (S1) 0.8748; (P) 0.8772; (R1) 0.8796; More....
USD/CHF is staying in tight range above 0.8728 and intraday bias stays neutral. On the downside, sustained break of 0.8741 will argue that the whole rebound from 0.8332 might have completed, and bring deeper fall to 0.8550 support. Nevertheless, strong bounce from current level will retain near term bullishness. Further break of 0.8891 will resume the rise from 0.8332.
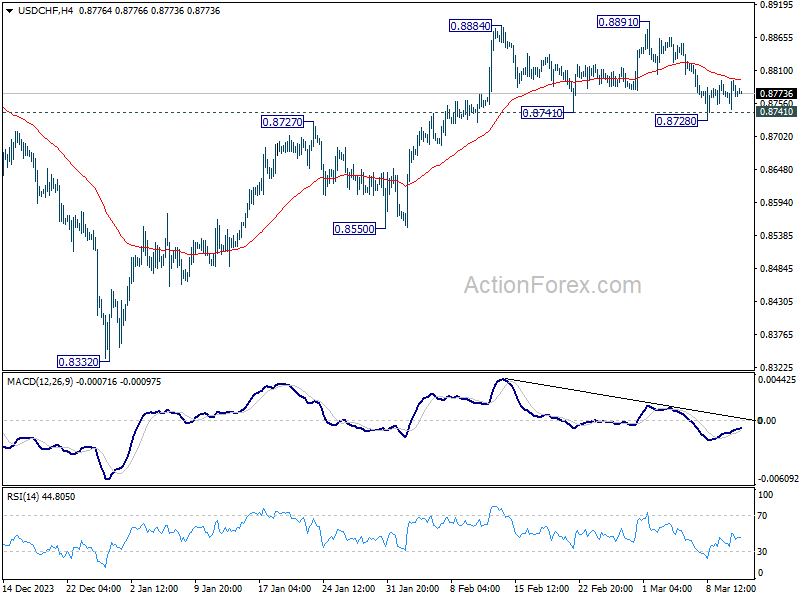
In the bigger picture, price actions from 0.8332 medium term bottom as seen as developing into a corrective pattern to the down trend from 1.0146 (2022 high). Further rise would be seen as long as 0.8555 support holds. But upside should be limited by 0.9243 resistance, at least on first attempt.
USD/JPY Daily Outlook
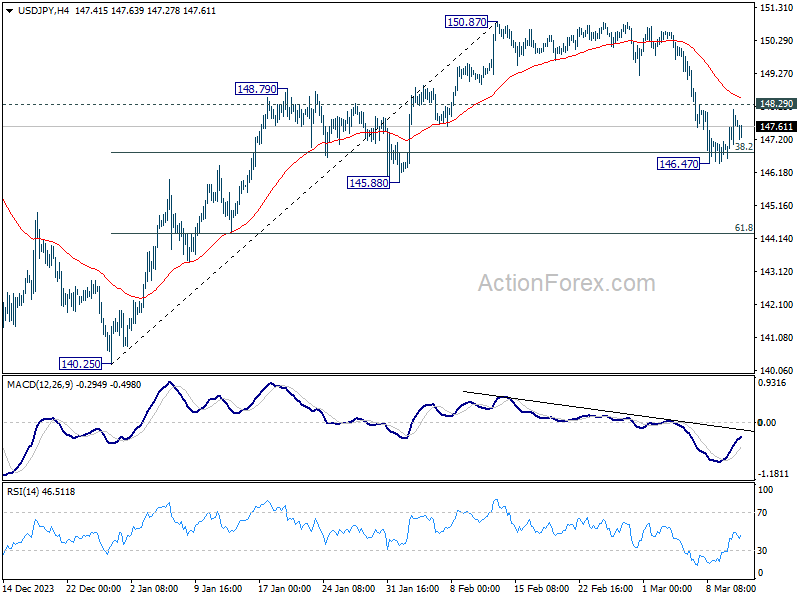
Daily Pivots: (S1) 146.85; (P) 147.44; (R1) 148.27; More...
Intraday bias in USD/JPY remains neutral for the moment, and outlook is unchanged. On the downside, sustained break of 38.2% retracement of 140.25 to 150.87 at 146.81 will argue that fall from 150.87 is reversing the whole rally from 140.25. In this case, deeper decline would be seen to 61.8% retracement at 144.30 and below. Nevertheless, strong support from 146.81, followed by break of 148.29 minor resistance resistance, will argue that fall from 150.87 is merely a correction, which has completed already. Retest of 150.87 should be seen next.
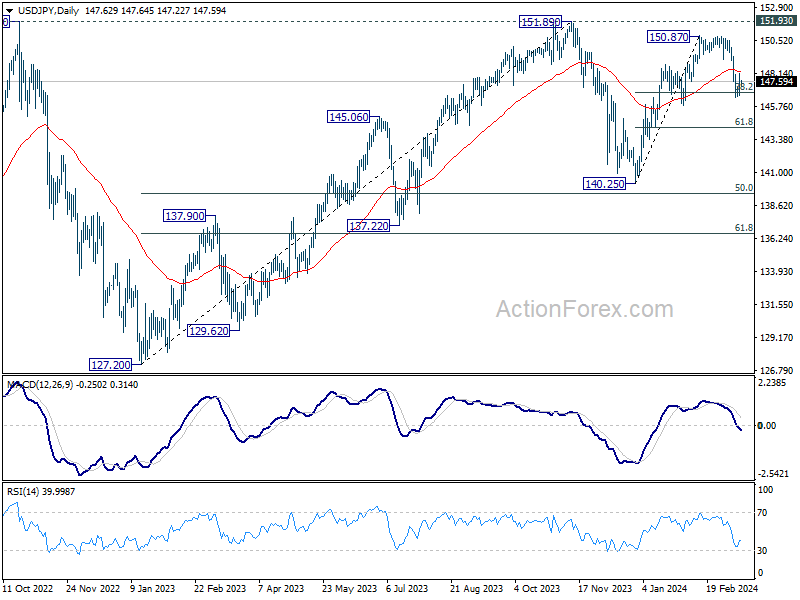
In the bigger picture, no change in the view that price action from 151.89 (2023 high) are correction to up trend from 127.20 (2023 low). The question is whether this correction has completed at 140.25, or extending with fall from 150.87 as the third leg. Sustained break of above mentioned 146.81 fibonacci level will favor the latter case. But even so, downside should be contained by 50% retracement of 127.20 to 151.89 at 139.54.
Yen Slightly Firmer on Wage Growth Prospects, Dollar Rally Capped
In today's subdued Asian session, the currency markets saw minimal movement, with most major pairs and crosses gyrating within yesterday's range. Japanese Yen managed to carve out modest gain, buoyed by optimistic remarks and tangible actions related to wage growth within the country. Chief Cabinet Secretary Yoshimasa Hayashi's commentary on seeing "strong momentum" for wage increases provides a beacon of hope for substantial wage growth, particularly among small and mid-sized firms—a crucial component for a balanced economic uplift.
This sentiment is further reinforced by landmark wage agreements by stalwarts of Japan's industrial sector, including Toyota Motor which agreed to raise workers' wages by the largest rate in 25 years. Meanwhile, Panasonic and Nissan committed to meet union demands in full.
Despite these positive developments, BoJ's stance on interest rate adjustments remains cautiously in the balance. Reports suggest that while a decision on hiking interest rates next week is nearing, it has not been conclusively reached.
Dollar's performance is mixed, failing to capitalize significantly on the post-CPI rebound. While, recovery in 10-year yield provided some support, the greenback's advances were capped by robust risk-on sentiment, evidenced by a new record close for S&P 500. The market's expectations for a Fed rate hike in June have moderated slightly from 72% to 66%, according to Fed funds futures, yet the anticipation of such a move remains a cornerstone of current market projections.
Overall in the markets, , Sterling is currently as the week's weakest link, with investors keenly awaiting today's UK GDP data for directional cues. Yen and Kiwi are the next weakest. On the other hand, Dollar is the strongest followed by Swiss Franc and Canadian. Euro and Aussie are mixed in the middle. But still, it's emphasized that all major pairs and crosses are stuck inside last week's range, suggesting that consolidative trading is still in progress.
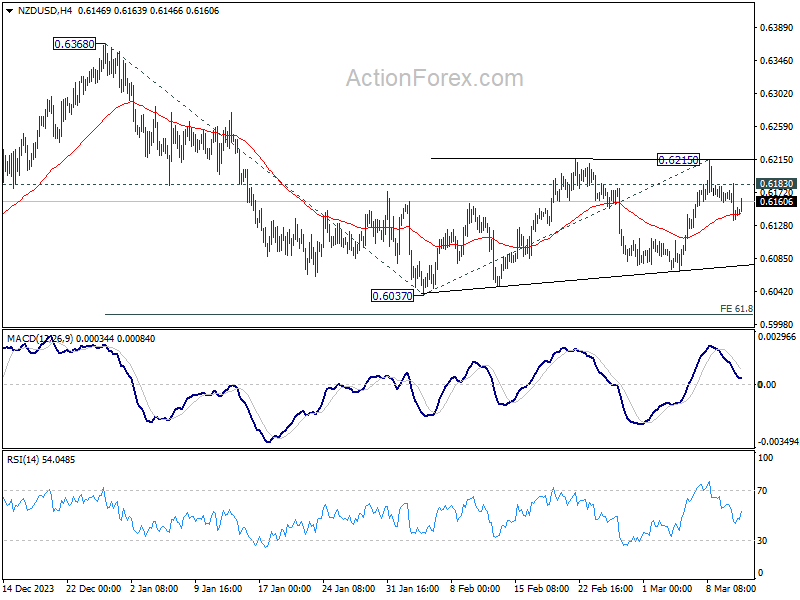
Technically, NZD/USD recovered mildly after hitting 55 4H EMA (now at 0.6143). But risk is mildly on the downside as long as 0.6183 minor resistance holds. Sustained break of the EMA will argue that corrective pattern from 0.6037 has completed with three waves to 0.6215. In this case, fall from 0.6368 would be ready to resume through 0.6037. If realized, the next down move in NZD/USD would likely be accompanied by AUD/USD's fall towards 0.6442 support.
In Asia, at the time of writing, Nikkei is down -0.17%. Hong Kong HSI is up 0.50%. China Shanghai SSE is down -0.07%. Singapore Strait Times is up 0.54%. 10-year JGB yield is down -0.0044 at 0.764. Overnight, DOW rose 0.61%. S&P 500 rose 1.12%. NASDAQ rose 1.54%. 10-year yield rose 0.051 to 4.155.
BoE's Bailey surge in unemployment unnecessary on tackling inflation
BoE Governor Andrew Bailey expressed a more positive stance on the UK's inflation scenario compared to a year ago, particularly regarding the potential for "second round effects" to drive further price surges.
At a panel discussion at the Bank of Italy Symposium, he noted there is "very limited evidence so far" that an uptick in unemployment is a prerequisite for reigning in inflationary pressures.
Bailey highlighted the UK's labor market status, pointing out that the country is near or at full employment. "It doesn't get a lot of comment, but we have seen very limited evidence so far of an increase in unemployment as a sort of necessary condition of reducing inflation," he added.
ECB's Villeroy sees broad agreement for Spring rate cut
In an interview with Le Figaro, ECB Governing Council member Francois Villeroy de Galhau revealed a "very broad agreement" within the council to initiate rate cuts in spring, with lasts until end of June.
Villeroy, who also serves as Governor of Bank of France, expressed optimism that "we're winning the battle against inflation". The bank lowered core inflation forecast for 2024 from 2.8% to 2.4%. This revision aligns with more moderate wage increases, with average salaries expected to rise by 3.2%, down from the previously predicted 4.1%.
On the growth front, Bank of France downgraded its 2024 growth projections slightly from 0.9% to 0.8%, with expectations for an acceleration to 1.5% in 2025 and 1.7% in 2026. Villeroy confidently stated, "France will avoid recession."
ECB's Wunsch: We have to make a bet at some point
ECB Governing Council member Pierre Wunsch emphasized the need for proactive stance on interest rates, acting on the fact that "inflation has gone down, is moving in the right direction".
Speaking at a news conference for the Belgian national bank's annual report, Wunsch candidly expressed that ECB is nearing a point where it must "make a bet" on cutting interest rates.
However, he was quick to temper expectations, noting that any decision to cut rates would be made carefully, with a keen eye on the persisting challenges of "service inflation and wage developments", which are "still running at levels that are ultimately not compatible with our objective"
Despite these concerns, Wunsch indicated that ECB would not delay rate cuts until wage growth falls to 3%.
Looking ahead
UK will release GDP, production and trade balance in European session. Eurozone will release industrial production. North America calendar is empty.
USD/JPY Daily Outlook
Daily Pivots: (S1) 146.85; (P) 147.44; (R1) 148.27; More...
Intraday bias in USD/JPY remains neutral for the moment, and outlook is unchanged. On the downside, sustained break of 38.2% retracement of 140.25 to 150.87 at 146.81 will argue that fall from 150.87 is reversing the whole rally from 140.25. In this case, deeper decline would be seen to 61.8% retracement at 144.30 and below. Nevertheless, strong support from 146.81, followed by break of 148.29 minor resistance resistance, will argue that fall from 150.87 is merely a correction, which has completed already. Retest of 150.87 should be seen next.
In the bigger picture, no change in the view that price action from 151.89 (2023 high) are correction to up trend from 127.20 (2023 low). The question is whether this correction has completed at 140.25, or extending with fall from 150.87 as the third leg. Sustained break of above mentioned 146.81 fibonacci level will favor the latter case. But even so, downside should be contained by 50% retracement of 127.20 to 151.89 at 139.54.
Economic Indicators Update
| GMT | Ccy | Events | Actual | Forecast | Previous | Revised |
|---|---|---|---|---|---|---|
| 07:00 | GBP | GDP M/M Jan | 0.20% | -0.10% | ||
| 07:00 | GBP | Manufacturing Production M/M Jan | 0.00% | 0.80% | ||
| 07:00 | GBP | Manufacturing Production Y/Y Jan | 2.00% | 2.30% | ||
| 07:00 | GBP | Industrial Production M/M Jan | 0.00% | 0.60% | ||
| 07:00 | GBP | Industrial Production Y/Y Jan | 0.70% | 0.60% | ||
| 07:00 | GBP | Goods Trade Balance (GBP) Jan | -15.0B | -14.0B | ||
| 10:00 | EUR | Eurozone Industrial Production M/M Jan | -1.00% | 2.60% | ||
| 13:00 | GBP | NIESR GDP Estimate (3M) Feb | -0.10% | |||
| 14:30 | USD | Crude Oil Inventories | 0.9M | 1.4M |
Technical Outlook and Review
DXY:
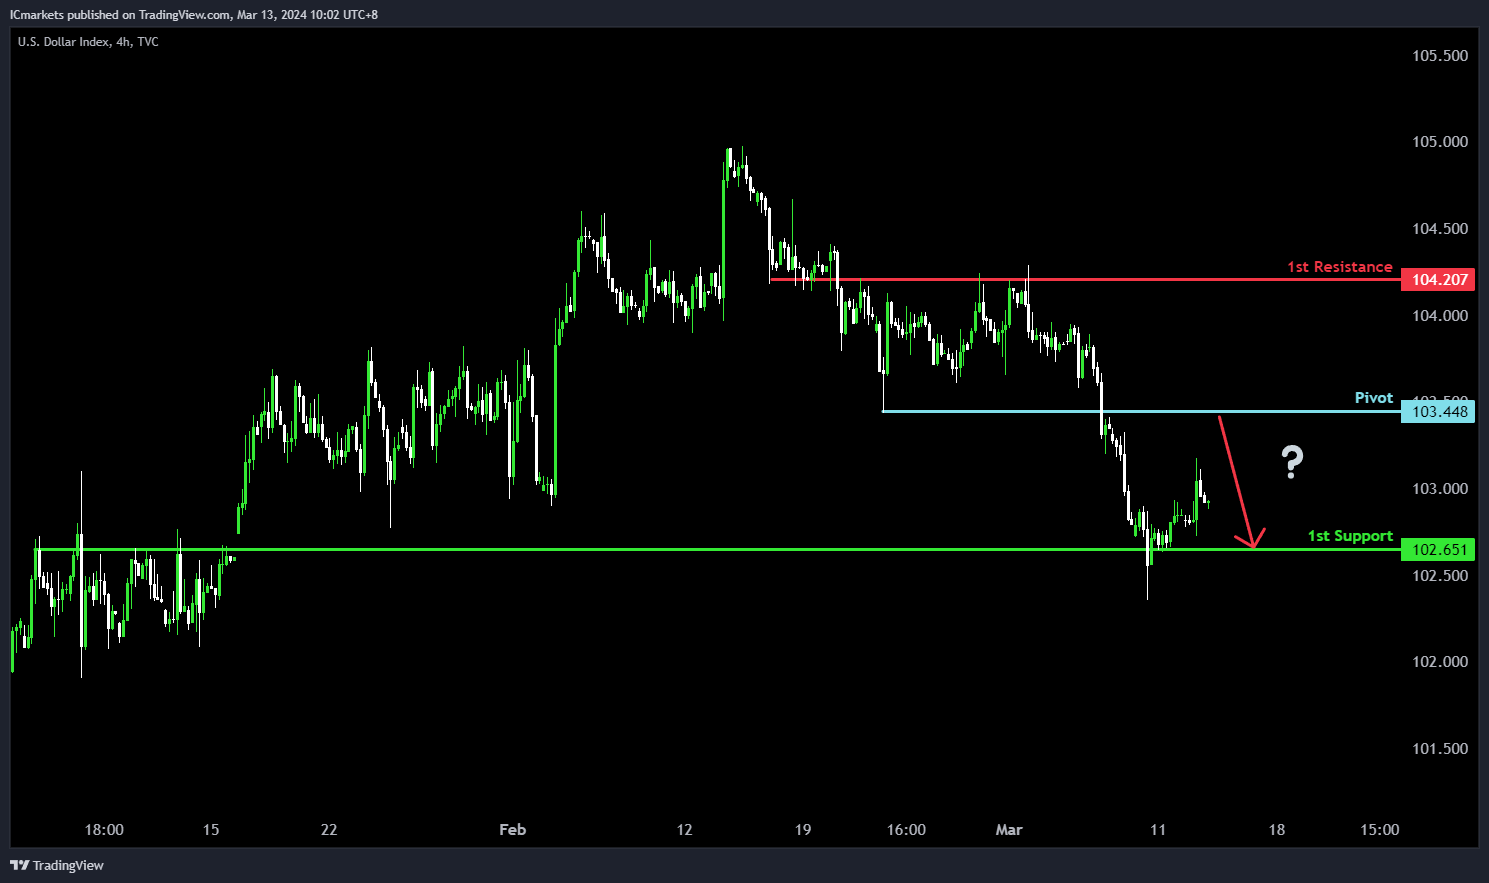
The DXY (Dollar Index) chart indicates a potential bearish movement, with a probable reaction at the pivot leading to a drop towards the 1st support. The pivot at 103.44 serves as significant pullback resistance, suggesting a potential barrier where selling pressure could intensify.
Conversely, the 1st support at 102.65 acts as crucial overlap support, potentially attracting buying interest and acting as a barrier against further downward movement.
On the resistance side, the 1st resistance at 104.20 forms a notable barrier, indicating a potential area where selling pressure may increase, potentially limiting further upward movement in the price.
EUR/USD:
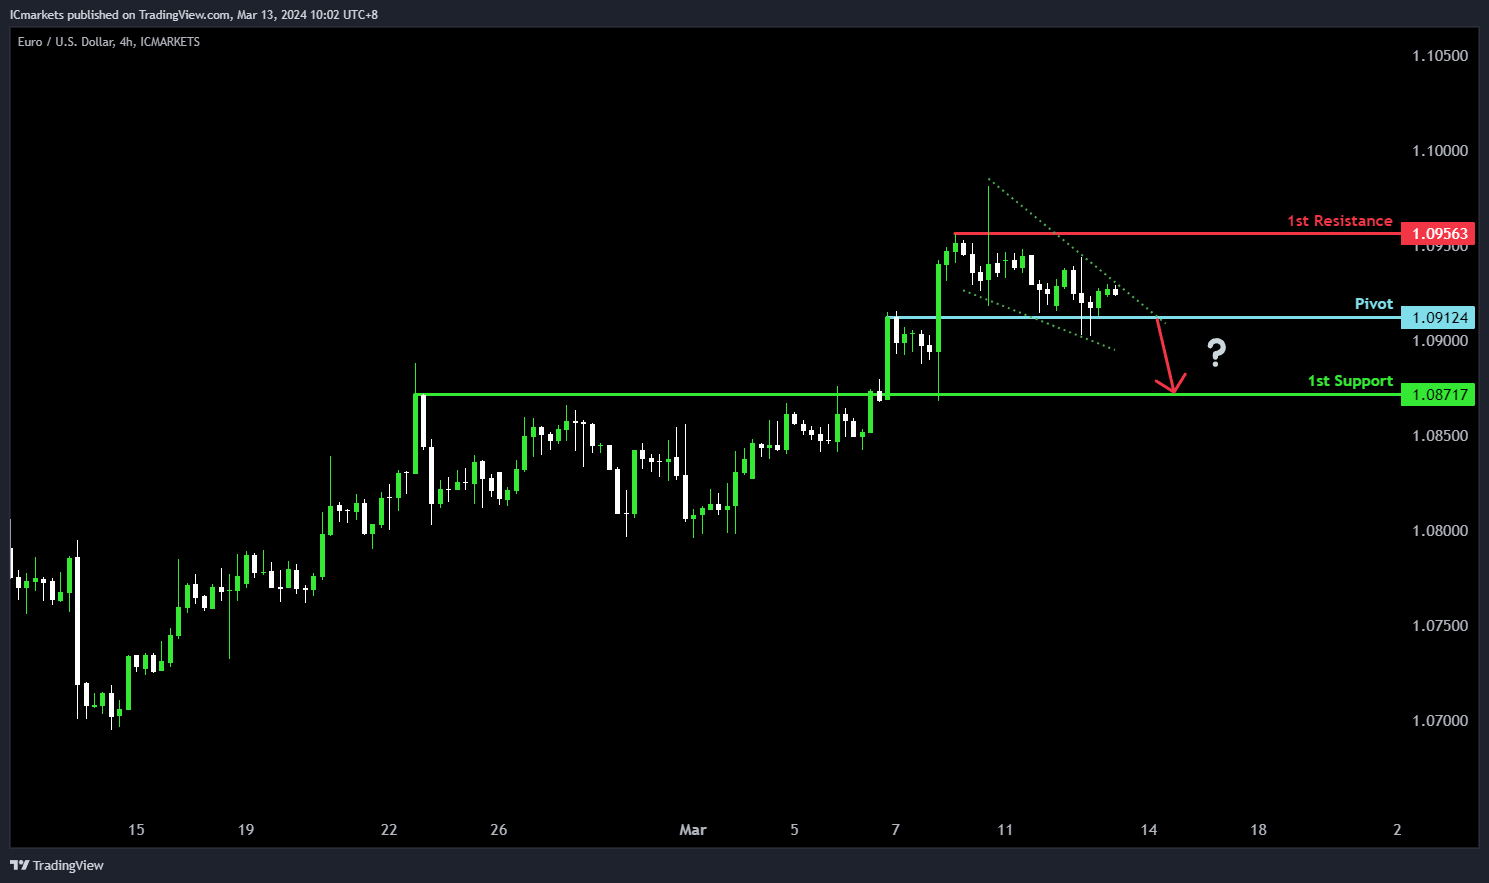
The EUR/USD pair presents a potential bearish scenario, despite the overall bullish momentum. There’s a likelihood of a bearish breakout from the pivot, with a subsequent drop towards the 1st support. The pivot level at 1.0912 acts as significant overlap support, indicating a potential area where buyers may intervene.
Moreover, the 1st support at 1.0871 reinforces this pattern, further indicating a historical area where buying interest has been observed. On the resistance side, the 1st resistance at 1.0956 forms a notable barrier, suggesting a potential area where selling pressure may increase, potentially limiting further upward movement in the price.
EUR/JPY:
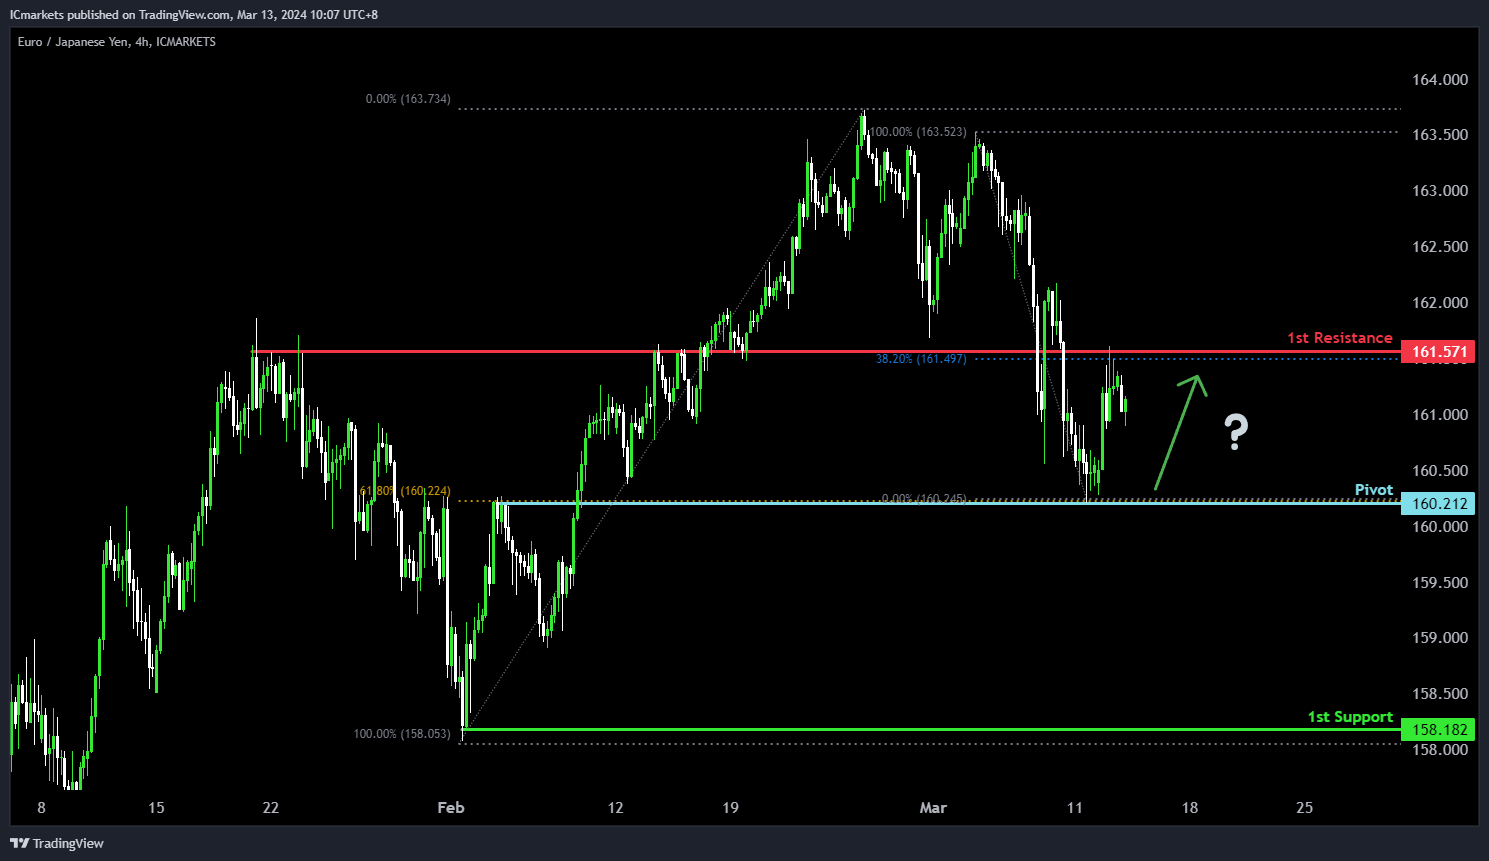
The EUR/JPY chart suggests a potential bullish direction, although the overall momentum appears bearish. Several factors contribute to this analysis.
The pivot level at 160.212 serves as an overlap support, indicating a significant historical level where buying interest may emerge. Additionally, it coincides with the 61.80% Fibonacci Retracement level, adding to its significance as a potential area of support.
Furthermore, the 1st support at 158.182 aligns with a swing low support, suggesting another level where buyers might enter the market.
On the resistance side, the 1st resistance level at 161.635 is identified as an overlap resistance, indicating a historical barrier to upward movement.
EUR/GBP:
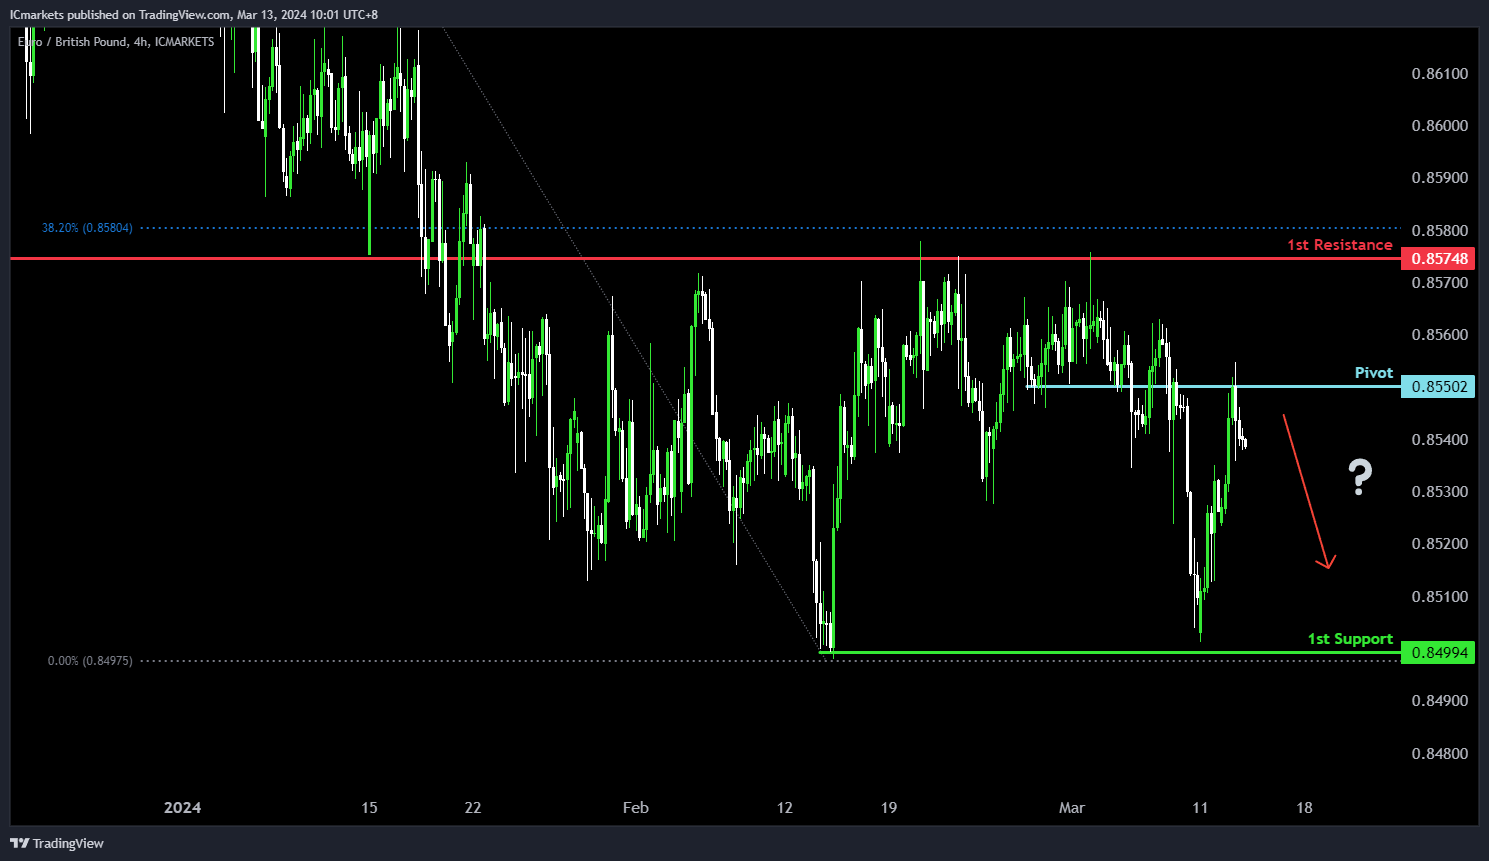
The EUR/GBP chart suggests a potential bearish direction, aligning with its overall bearish momentum. Several factors contribute to this outlook.
The pivot level at 0.85502 is identified as a point of interest, serving as a pullback resistance. This suggests a significant historical level where selling pressure may emerge.
Additionally, the 1st support level at 0.84994 corresponds to a swing low support, indicating a level where buying interest has previously emerged.
On the resistance side, the 1st resistance level at 0.85748 is notable as it aligns with an overlap resistance and coincides with the 38.20% Fibonacci Retracement level. This suggests a potential barrier to further upward movement.
GBP/USD:
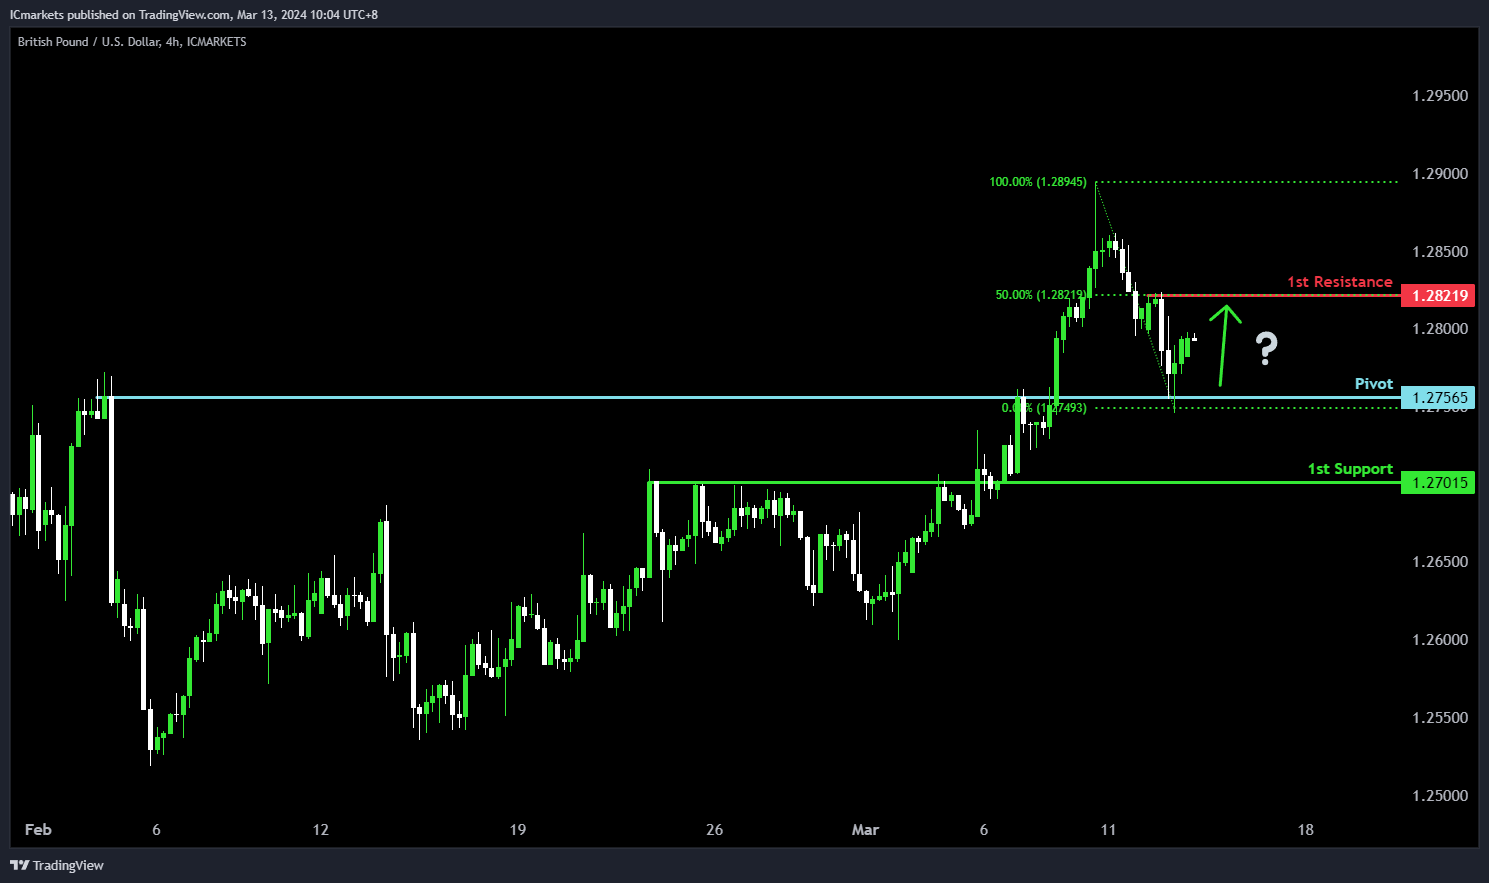
The GBP/USD pair indicates a potential bullish direction, aligning with the overall bullish momentum. There’s a possibility of a bullish continuation towards the 1st resistance level. The pivot at 1.2756 serves as significant overlap support, suggesting its importance as a level where buyers might intervene.
Additionally, the 1st support at 1.2701 reinforces this notion, indicating historical buying interest in this area. On the resistance side, the 1st resistance at 1.282 forms a notable barrier, supported by the 50% Fibonacci Retracement, indicating a potential area where selling pressure may intensify, potentially limiting further upward movement in the price.
GBP/JPY:
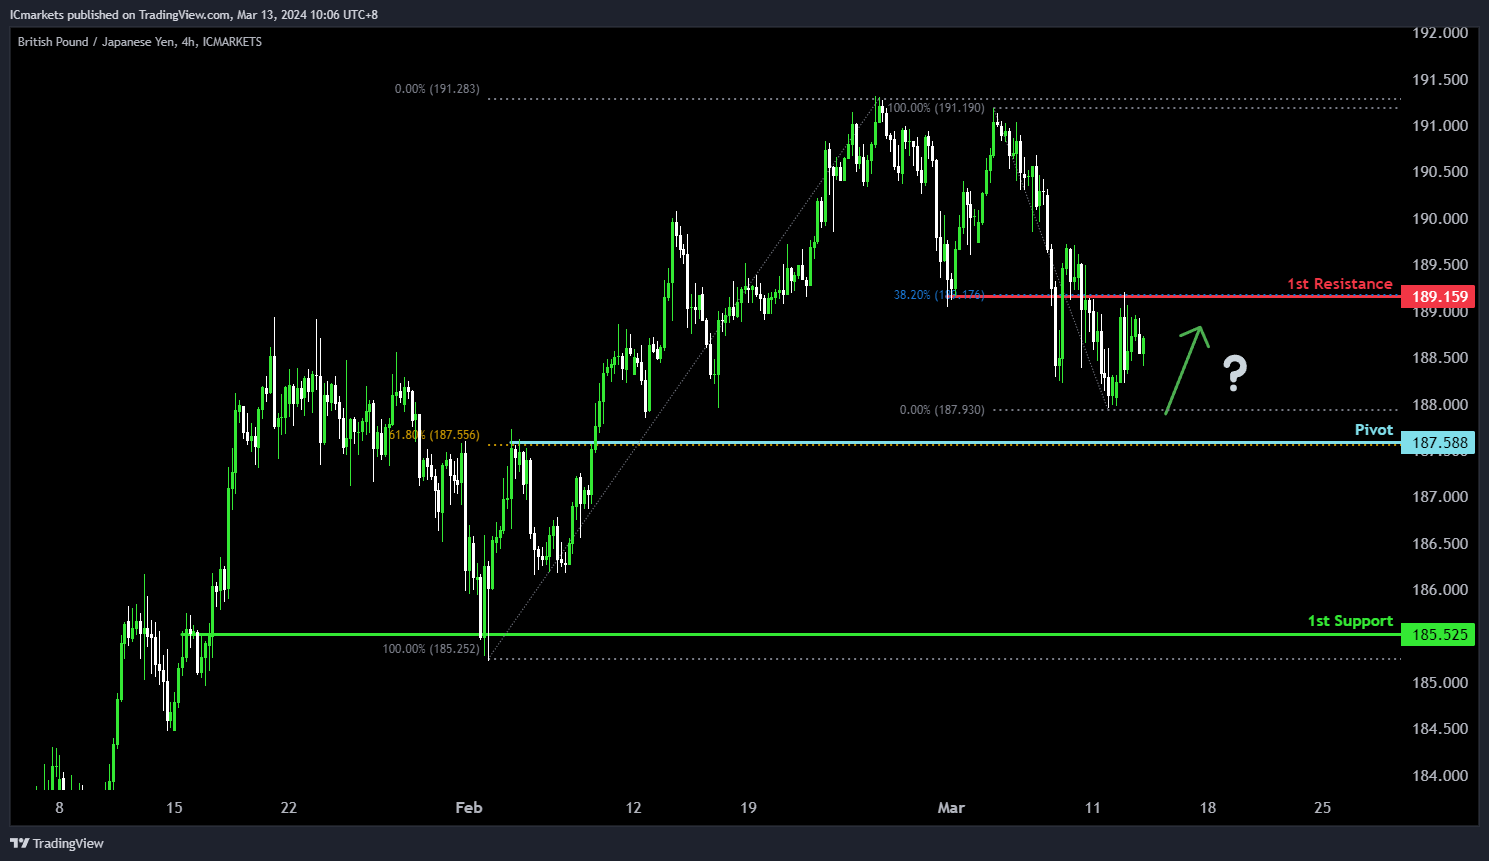
The GBP/JPY chart suggests a potential bullish direction, although the overall momentum appears bearish. Several factors contribute to this analysis.
The pivot level at 187.588 serves as a pullback support and coincides with the 61.80% Fibonacci Retracement level, indicating a significant historical level where buying interest may emerge.
Additionally, the 1st support at 185.525 aligns with another pullback support level, reinforcing its significance as a potential area where buyers might enter the market.
On the resistance side, the 1st resistance level at 189.159 is identified as an overlap resistance and coincides with the 38.20% Fibonacci Retracement level, suggesting a historical barrier to upward movement.
USD/CHF:
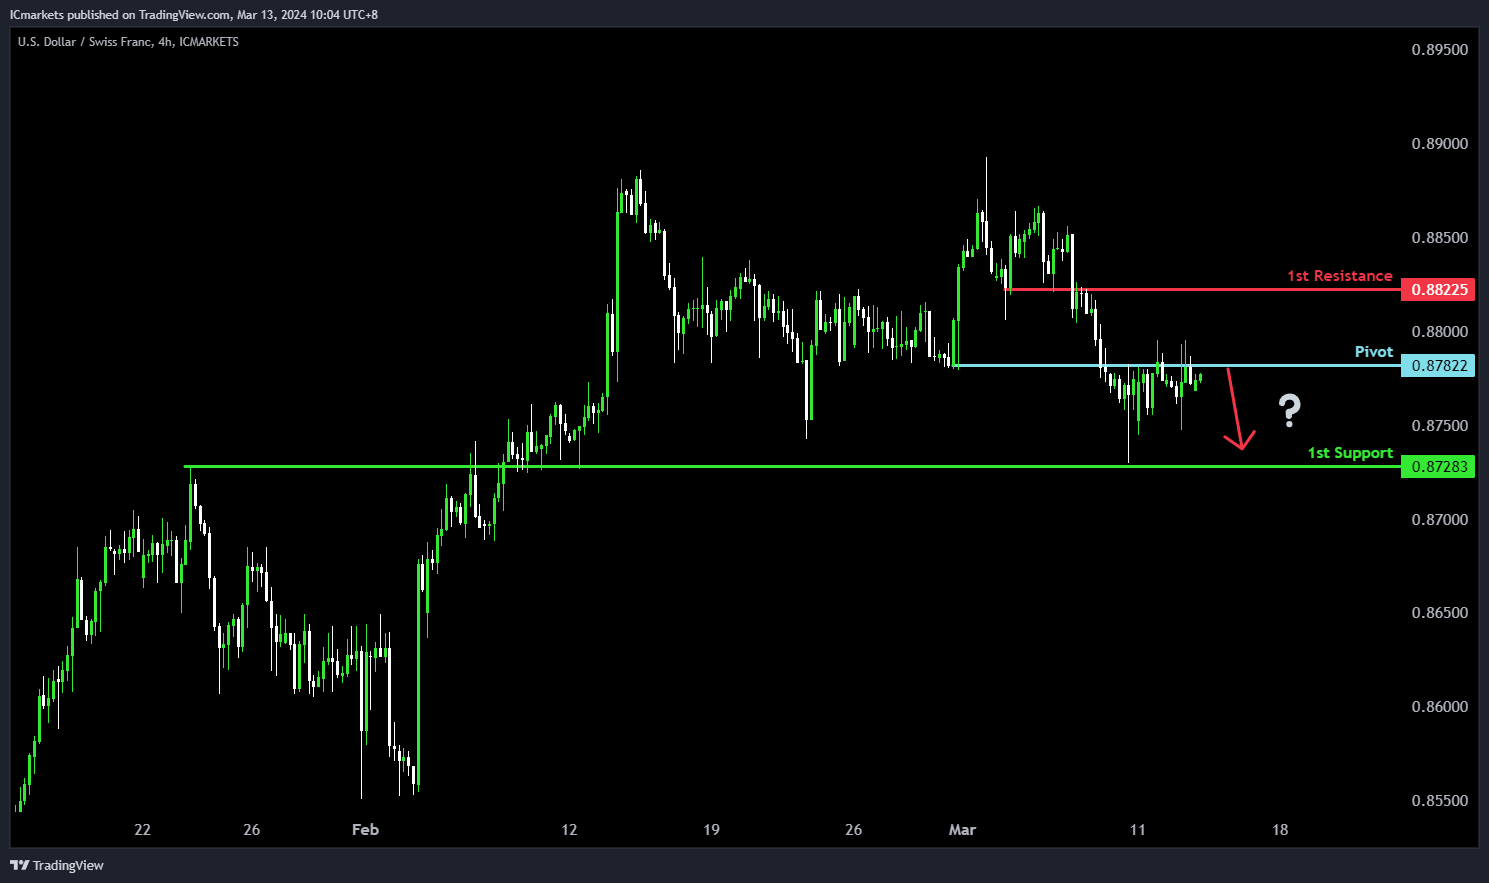
The potential direction for USD/CHF is bearish, consistent with the overall bearish momentum. There’s a likelihood of a bearish reaction from the pivot towards the 1st support level. The pivot at 0.8782 acts as a significant overlap resistance, suggesting its importance as a level where selling pressure might intensify.
Furthermore, the 1st support at 0.8728 serves as another crucial level, indicating historical buying interest. On the resistance side, the 1st resistance at 0.8822 forms a notable barrier, supported by overlap resistance, which could potentially hinder further upward movement in the price.
USD/JPY:
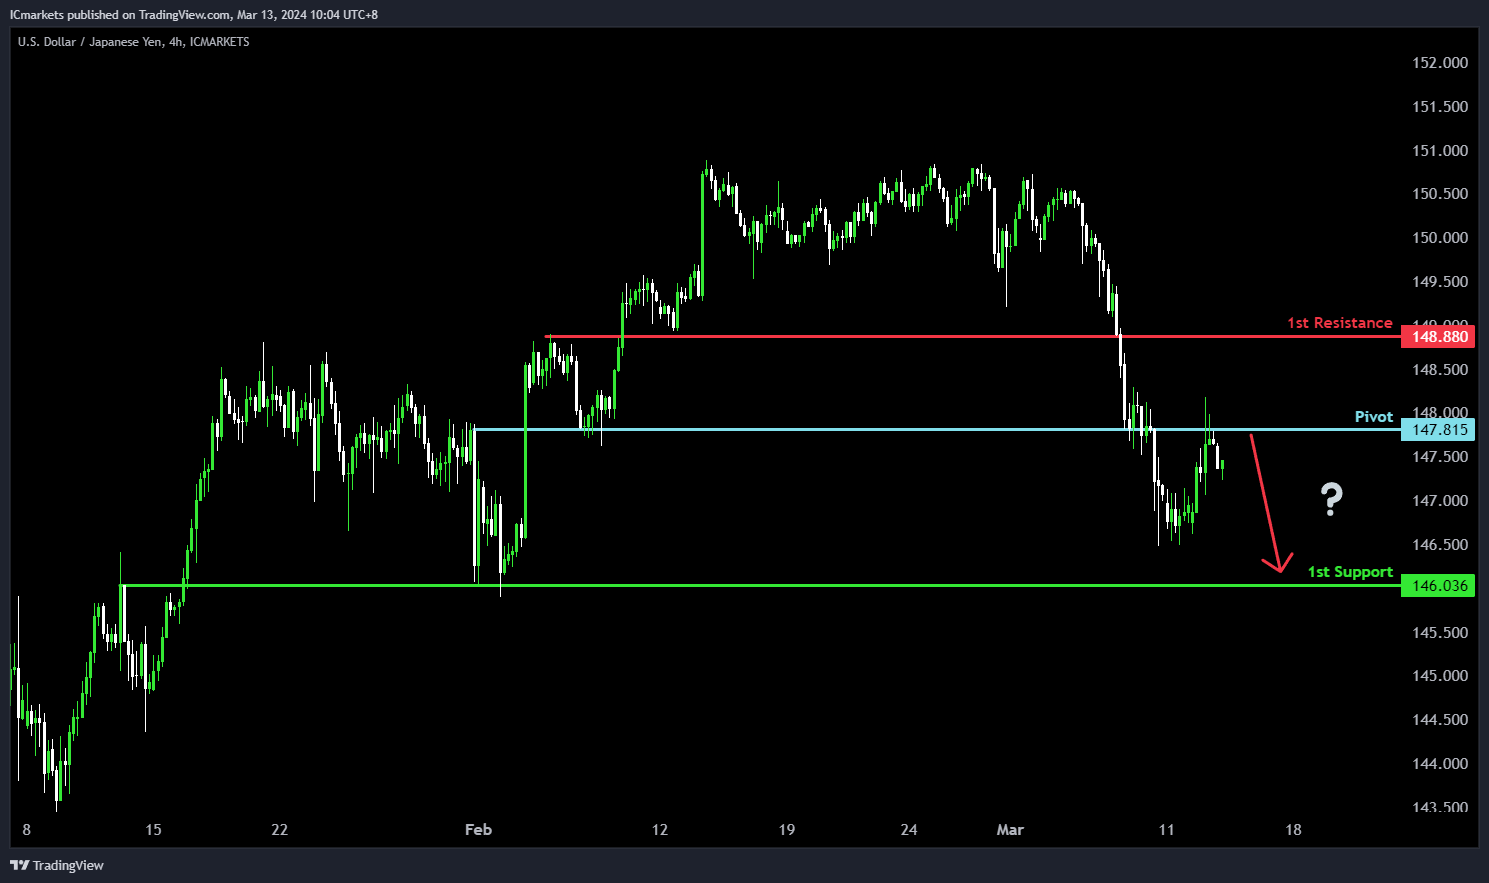
The USD/JPY, the potential direction is bearish, aligning with the prevailing bearish momentum. There’s a possibility of a bearish continuation towards the 1st support level. The pivot at 147.81 serves as a notable overlap resistance, indicating a level where selling pressure could intensify.
On the support side, the 1st support at 146.03 presents a significant level of historical buying interest, potentially acting as a support zone. Conversely, the 1st resistance at 148.88 forms a notable barrier, supported by pullback resistance, which could potentially limit further upward movement in the price.
USD/CAD:
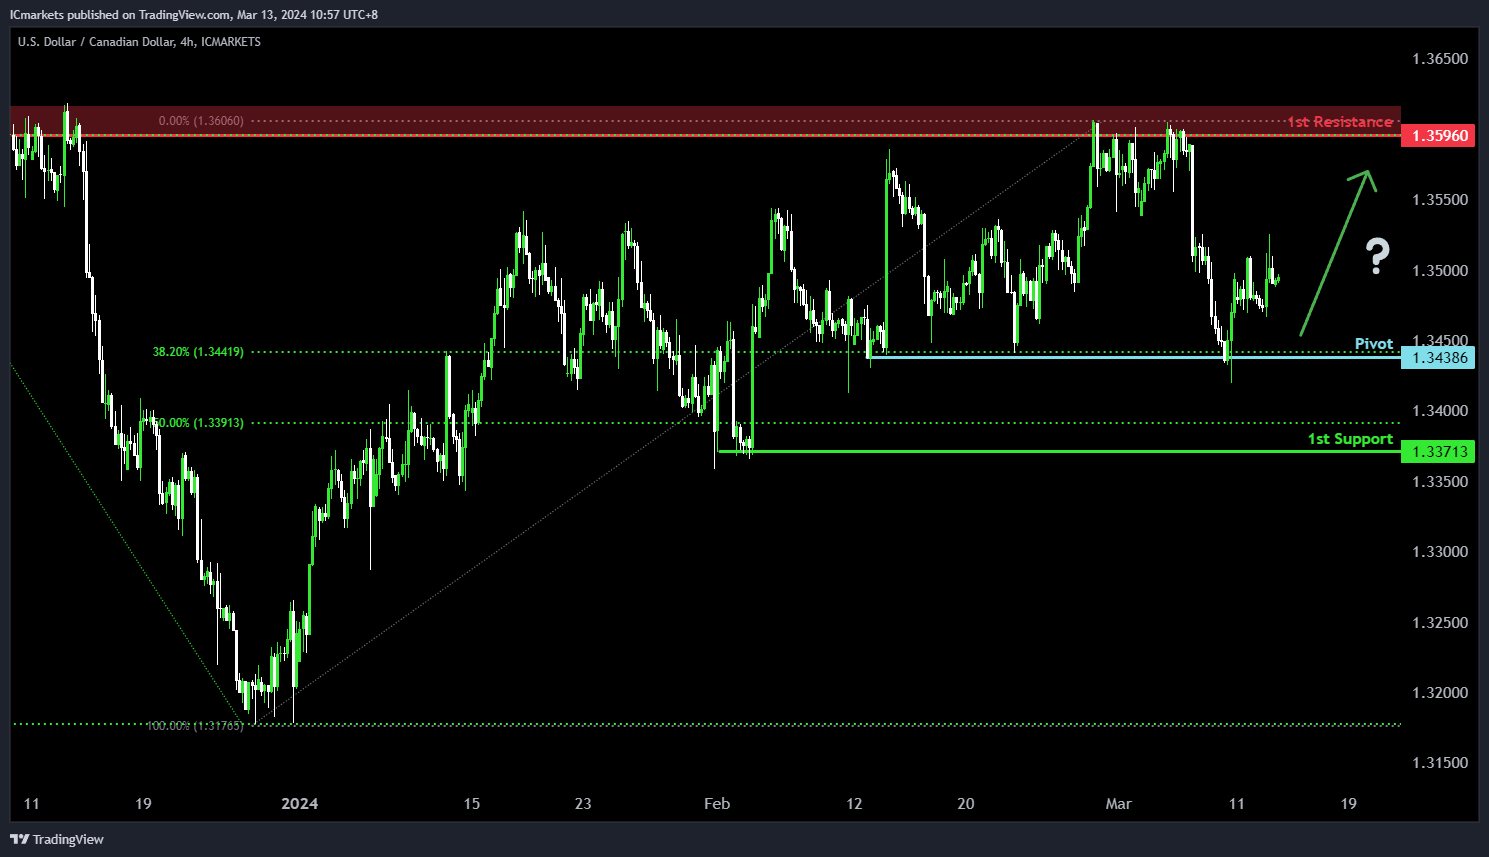
The USD/CAD chart currently demonstrates a neutral bias. In this context, there is a potential scenario for price to fluctuate between the pivot and the 1st resistance.
The pivot level at 1.3438 is identified as a pullback support that aligns with the 38.20% Fibonacci Retracement level where price could potentially bounce off to climb higher. Higher up, the 1st resistance level at 1.3596 is identified as a pullback resistance that aligns with the 61.80% Fibonacci Retracement level, further highlighting its importance as a potential resistance zone.
To the downside, the 1st support level at 1.3371 is marked as a pullback support that aligns close to the 50.00% Fibonacci Retracement level, reinforcing its significance as a key support level.
AUD/USD:
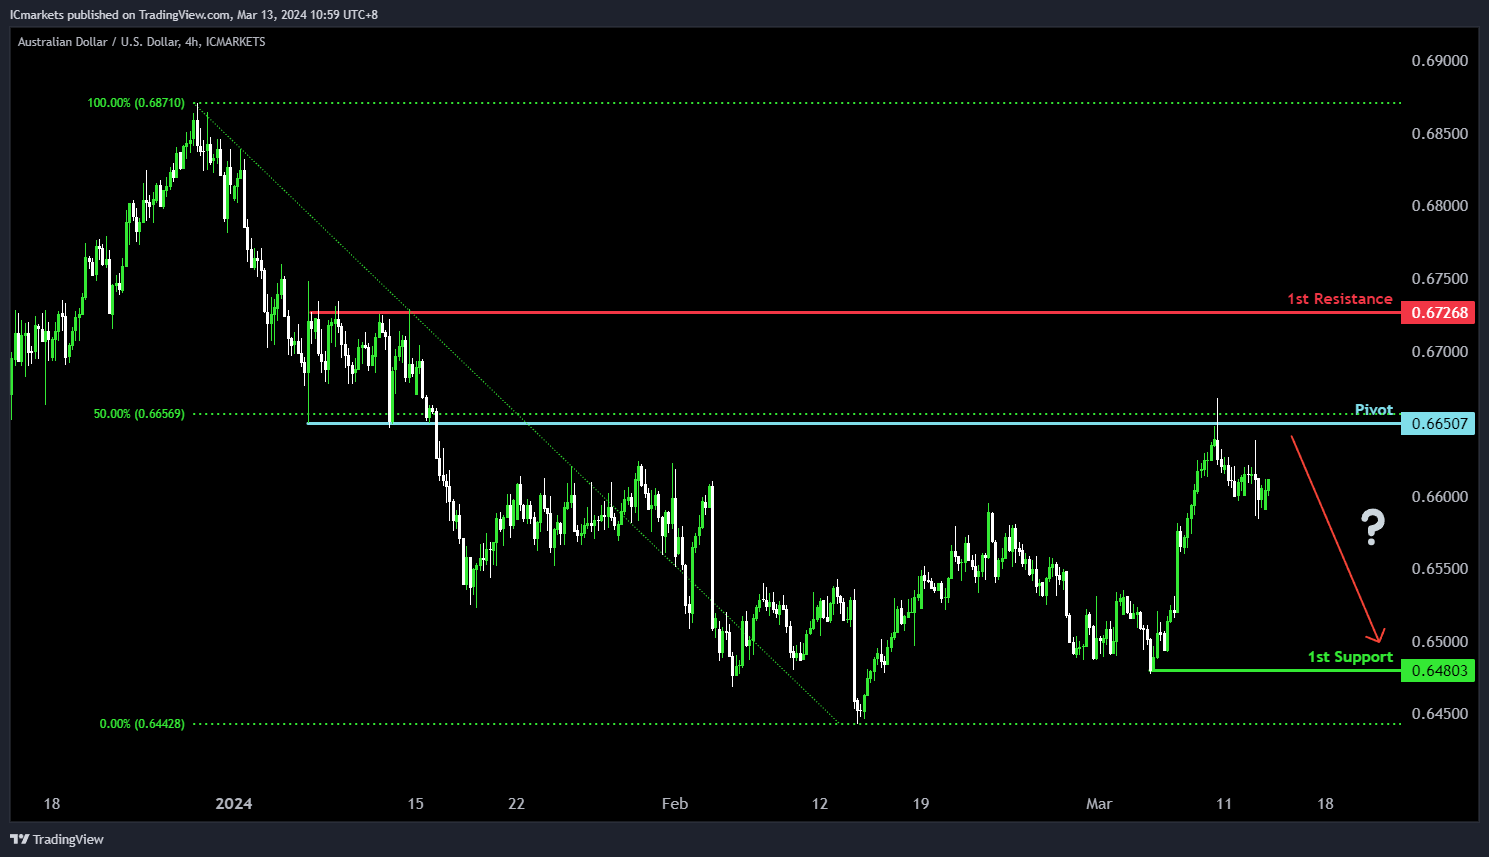
The AUD/USD chart currently demonstrates a neutral bias. In this context, there is a potential scenario for price to fluctuate between the pivot and the 1st resistance.
The pivot level at 0.6650 is identified as an overlap resistance that aligns with the 50.00% Fibonacci Retracement level where price could potentially reverse from to drop lower. The 1st support level at 0.6480 is marked as a pullback support, reinforcing its significance as a key support level.
On the resistance side, the 1st resistance level at 0.6726 is identified as a pullback resistance, potentially limiting any further upward movement.
NZD/USD
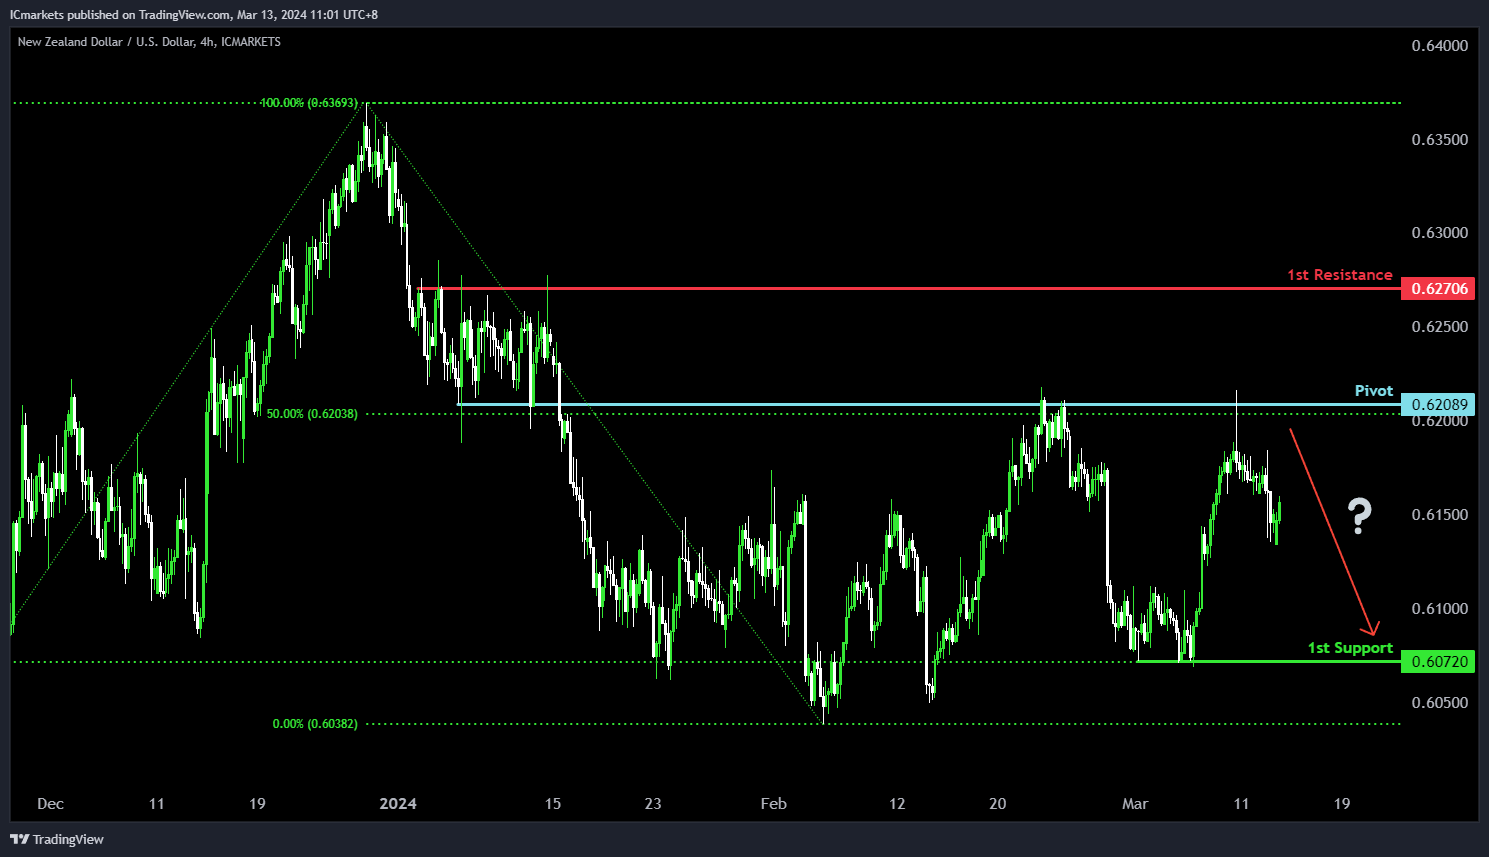
The NZD/USD chart currently demonstrates a neutral bias. In this context, there is a potential scenario for price to fluctuate between the pivot and the 1st support.
The pivot level at 0.6208 is identified as an overlap resistance that aligns with the 50.00% Fibonacci Retracement level where price could potentially reverse from to drop lower. The 1st support level at 0.6072 is marked as a pullback support, reinforcing its significance as a key support level.
On the resistance side, the 1st resistance level at 0.6270 is identified as a pullback resistance, potentially limiting any further upward movement.
DJ30:
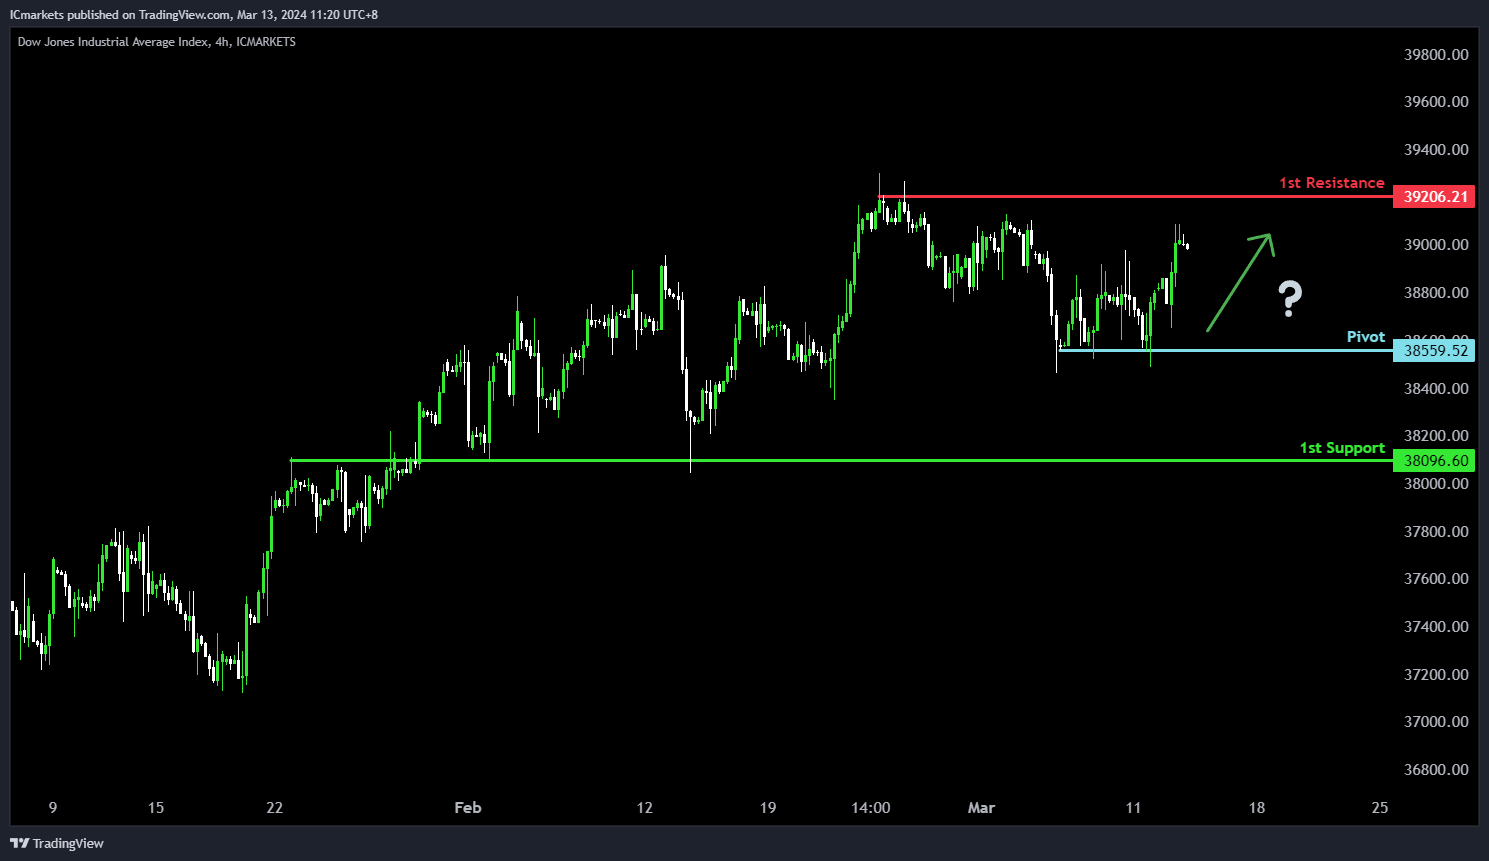
The DJ30 chart indicates a potential bullish direction, aligning with the overall bullish momentum. Several factors contribute to this analysis.
The pivot level at 38559.52 serves as a swing low support, indicating a significant historical level where buying interest has previously emerged.
Furthermore, the 1st support at 38096.60 is identified as an overlap support, reinforcing its significance as a potential area where buyers might enter the market.
On the resistance side, the 1st resistance level at 39206.21 is characterized as a swing high resistance, suggesting a historical barrier to upward movement.
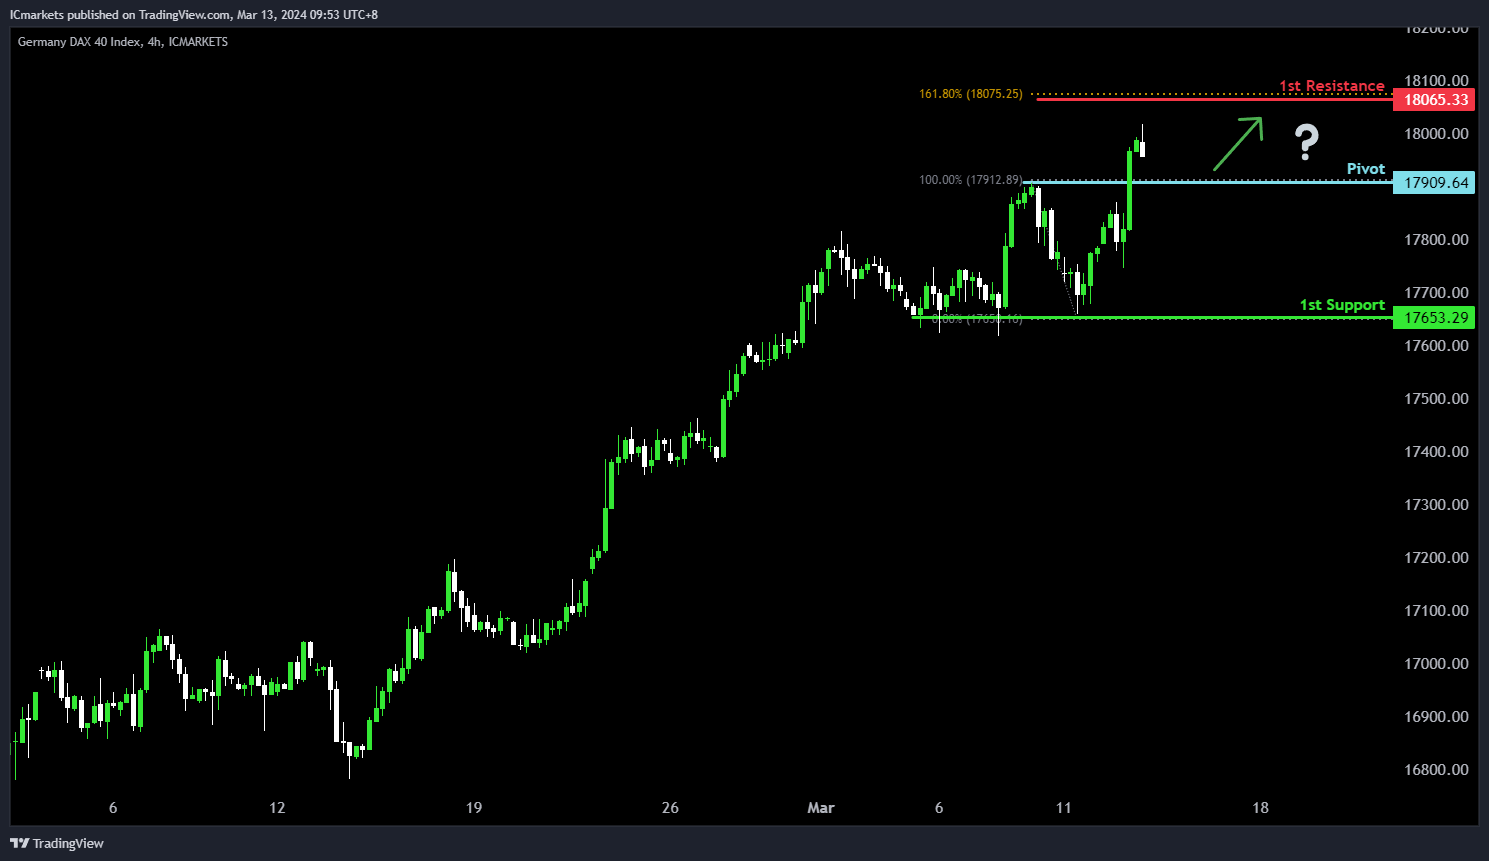
GER40:
The GER40 chart presents a bullish potential direction, aligned with its overall bullish momentum. Several factors contribute to this outlook.
The pivot level at 17909.64 is pivotal as it serves as a pullback support, indicating a significant historical level where buying interest has been observed in the past.
Furthermore, the 1st support at 17653.29 is identified as a swing low support, strengthening its significance as a potential area where buyers might step in.
On the resistance side, the 1st resistance level at 18065.33 is noteworthy as it corresponds to the 161.80% Fibonacci Extension, suggesting a potential barrier to further upward movement.
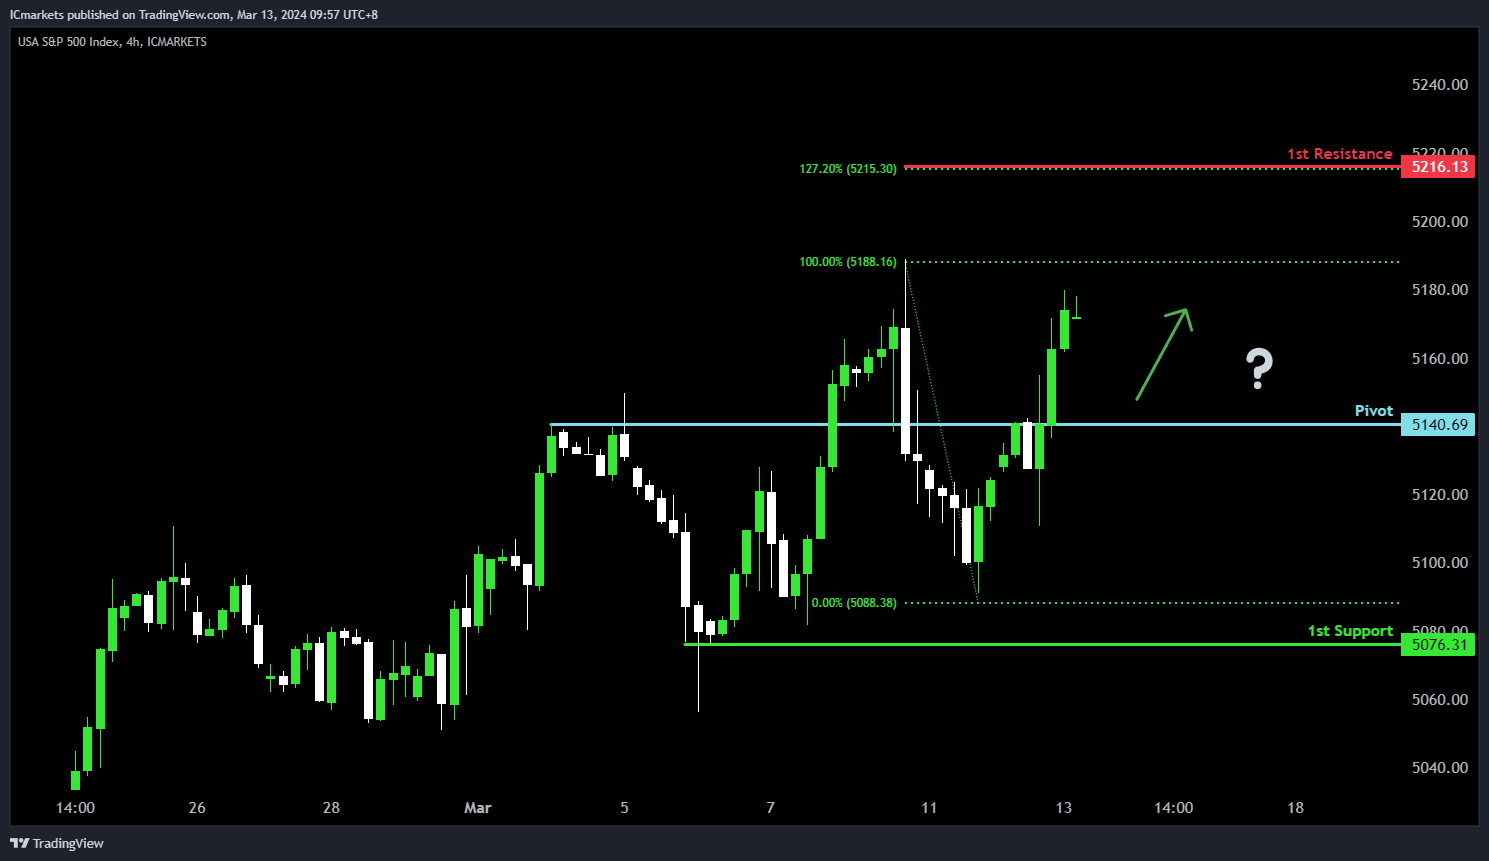
US500:
The US500 chart indicates a potential bullish direction, consistent with its overall bullish momentum. Several factors contribute to this sentiment.
The pivot level at 5140.69 serves as a crucial point of interest, functioning as a pullback support, indicating a significant historical level where buying interest has previously emerged.
Additionally, the 1st support level at 5076.31 aligns with a swing low support, further reinforcing its significance as a potential area where buyers might step in.
On the resistance side, the 1st resistance level at 5216.13 is notable as it corresponds to the 127.20% Fibonacci Extension, suggesting a potential barrier to further upward movement.
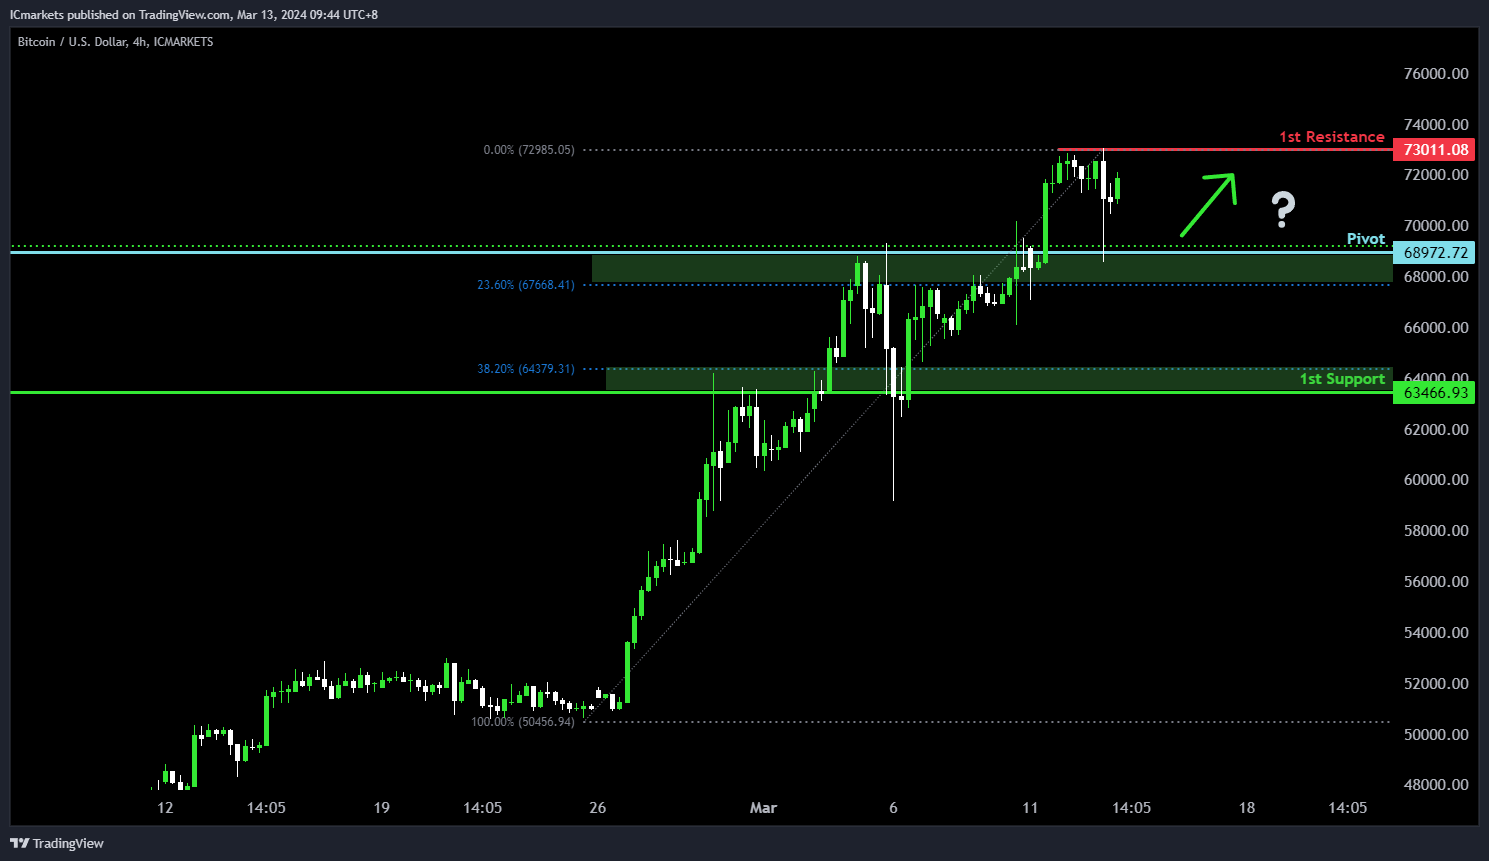
BTC/USD:
The BTC/USD chart currently exhibits a bullish overall momentum, indicating a potential continuation of the upward trend. Several factors contribute to this bullish sentiment.
The pivot level at 68972.72 serves as an overlap support and coincides with the 23.60% Fibonacci Retracement level, indicating a significant historical level where buying interest could emerge.
Additionally, the 1st support at 63466.93 aligns with another overlap support and the 38.20% Fibonacci Retracement level, further reinforcing its significance as a potential area of support.
On the resistance side, the 1st resistance level at 73011.08 is identified as a swing high resistance, suggesting a historical barrier to further upward movement.
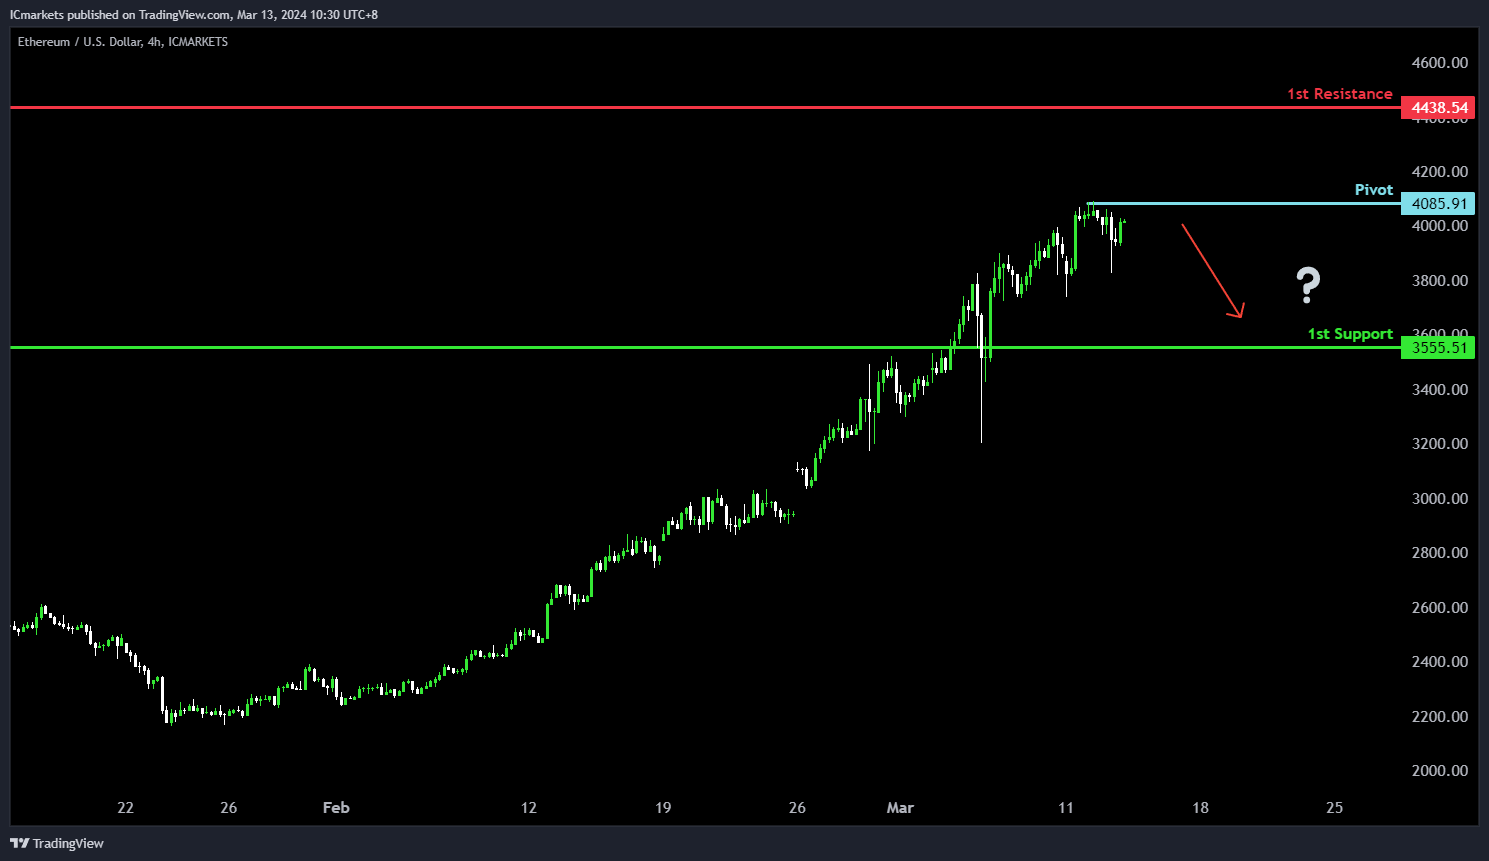
ETH/USD:
The ETH/USD chart currently exhibits a bullish overall momentum, suggesting a continuation of the upward trend. However, there’s a potential short-term bearish scenario that could unfold, as indicated by the factors contributing to the momentum.
The pivot level at 4085.91 serves as a swing high resistance, indicating a significant historical barrier to further upward movement. In the short term, the price could potentially rise towards this pivot level before reversing off it.
The 1st support at 3555.51 is identified as a pullback support, suggesting a level where buying interest may emerge if the price retraces from the pivot level.
On the resistance side, the 1st resistance level at 4438.54 is also characterized as a swing high resistance, reinforcing its significance as a barrier to further bullish movement.
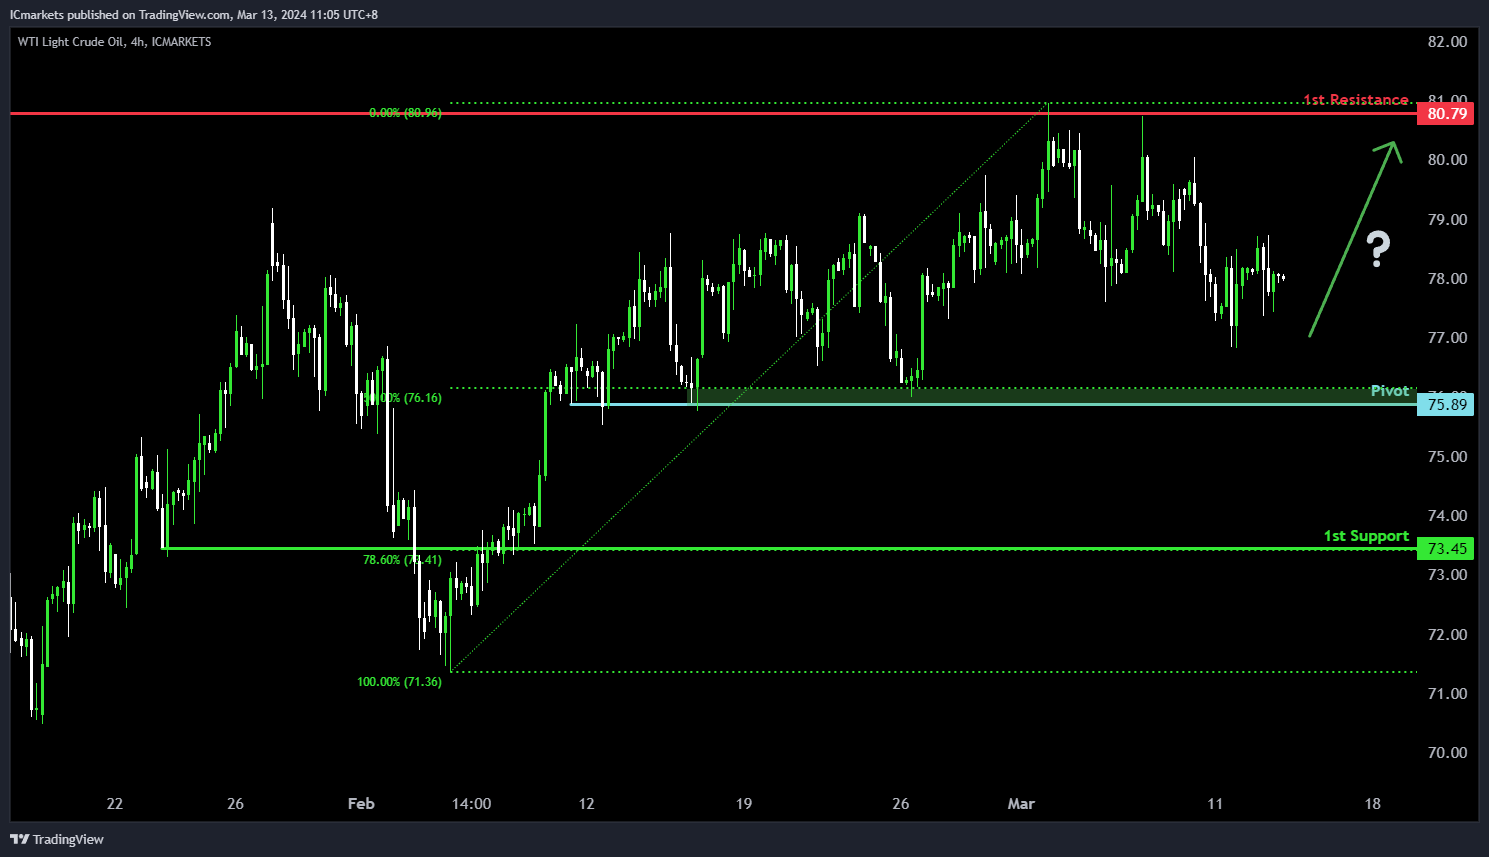
WTI/USD:
The WTI (West Texas Intermediate) chart currently demonstrates a neutral bias. In this context, there is a potential scenario for price to fluctuate between the pivot and the 1st resistance.
The pivot level at 75.89 is identified as a pullback support that aligns close to the 50.00% Fibonacci Retracement level where price could potentially reverse from to climb higher. Higher up, the 1st resistance level at 80.79 is noted as an overlap resistance, further reinforcing its significance as a potential barrier to further bullish movement.
To the downside, the 1st support level at 73.45 is marked as an overlap support that aligns with the 78.60% Fibonacci Retracement level, reinforcing its significance as a key support level.
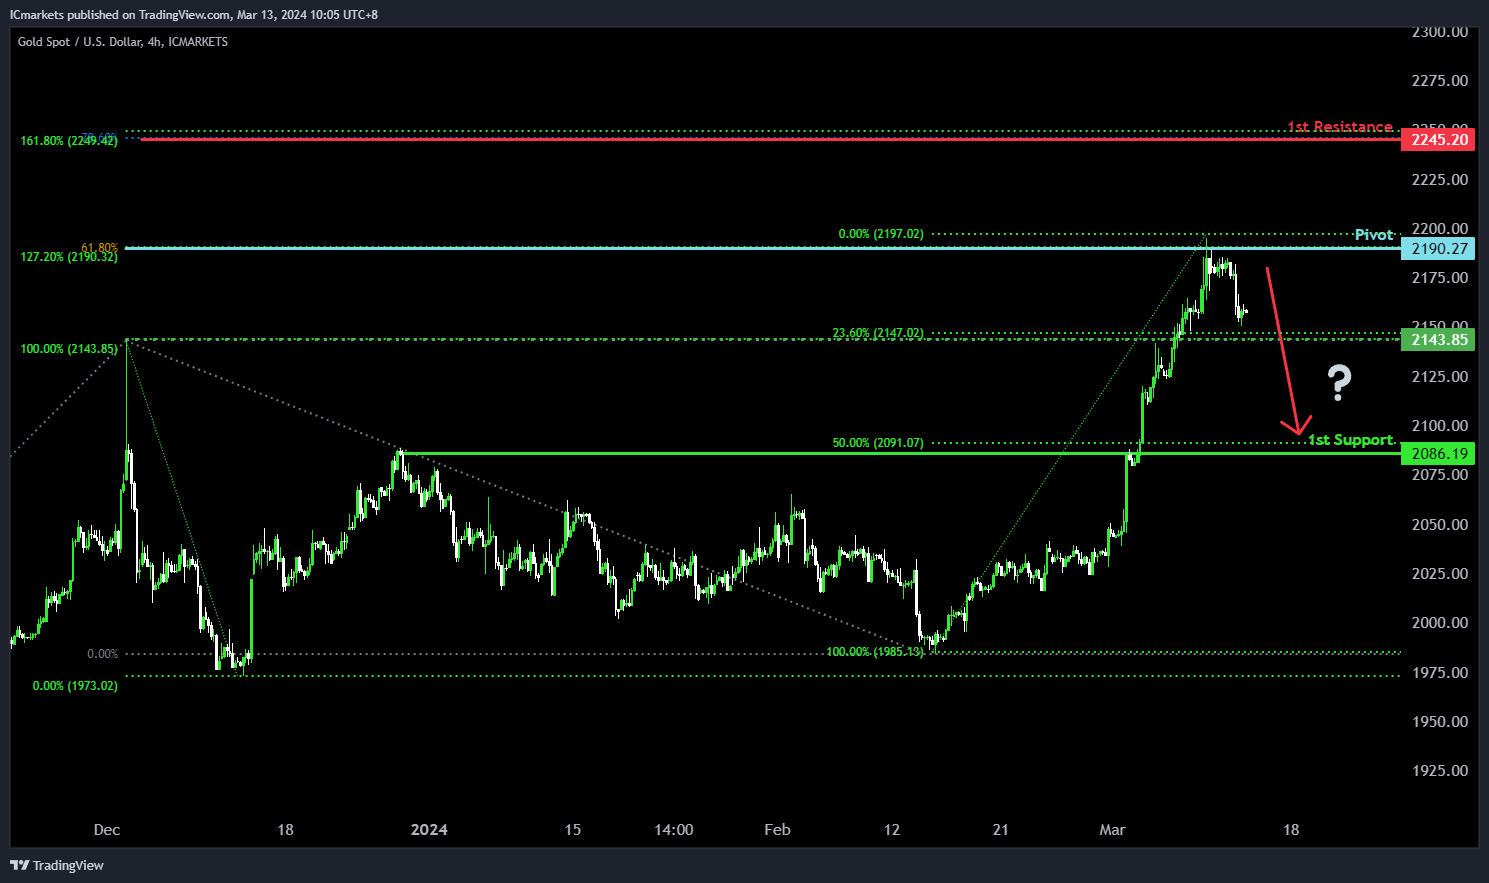
XAU/USD (GOLD):
The XAU/USD chart suggests the potential direction is bearish despite the overall bullish momentum. There’s a likelihood of a bearish continuation towards the 1st support level. The pivot at 2190.27 acts as a significant swing high resistance, supported by the 61.80% Fibonacci Projection and the 127.20% Fibonacci Extension, indicating Fibonacci confluence.
On the support side, the 1st support at 2084.19 serves as a pullback support, potentially attracting buying interest and halting the downward movement. Meanwhile, the 1st resistance at 2245.20 forms a robust barrier, reinforced by the 78.60% Fibonacci Projection and the 161.80% Fibonacci Extension, suggesting a strong resistance zone where selling pressure could intensify.
Additionally, the intermediate support at 2143.85 further reinforces the pullback support zone.
Gold Price Rally Takes Break, Dips Turn Attractive
Key Highlights
- Gold rallied above the $2,120 and $2,180 resistance levels.
- It traded below a key rising channel with support at $2,170 on the 4-hour chart.
- EUR/USD and GBP/USD started a downside correction.
- Bitcoin price extended its rally above $72,000.
Gold Price Technical Analysis
Gold prices started a fresh increase from the $2,050 support against the US Dollar. The bulls cleared the $2,120 resistance to start a strong rally.
The 4-hour chart of XAU/USD indicates that the price settled above the $2,140 level, the 100 Simple Moving Average (red, 4 hours), and the 200 Simple Moving Average (green, 4 hours).
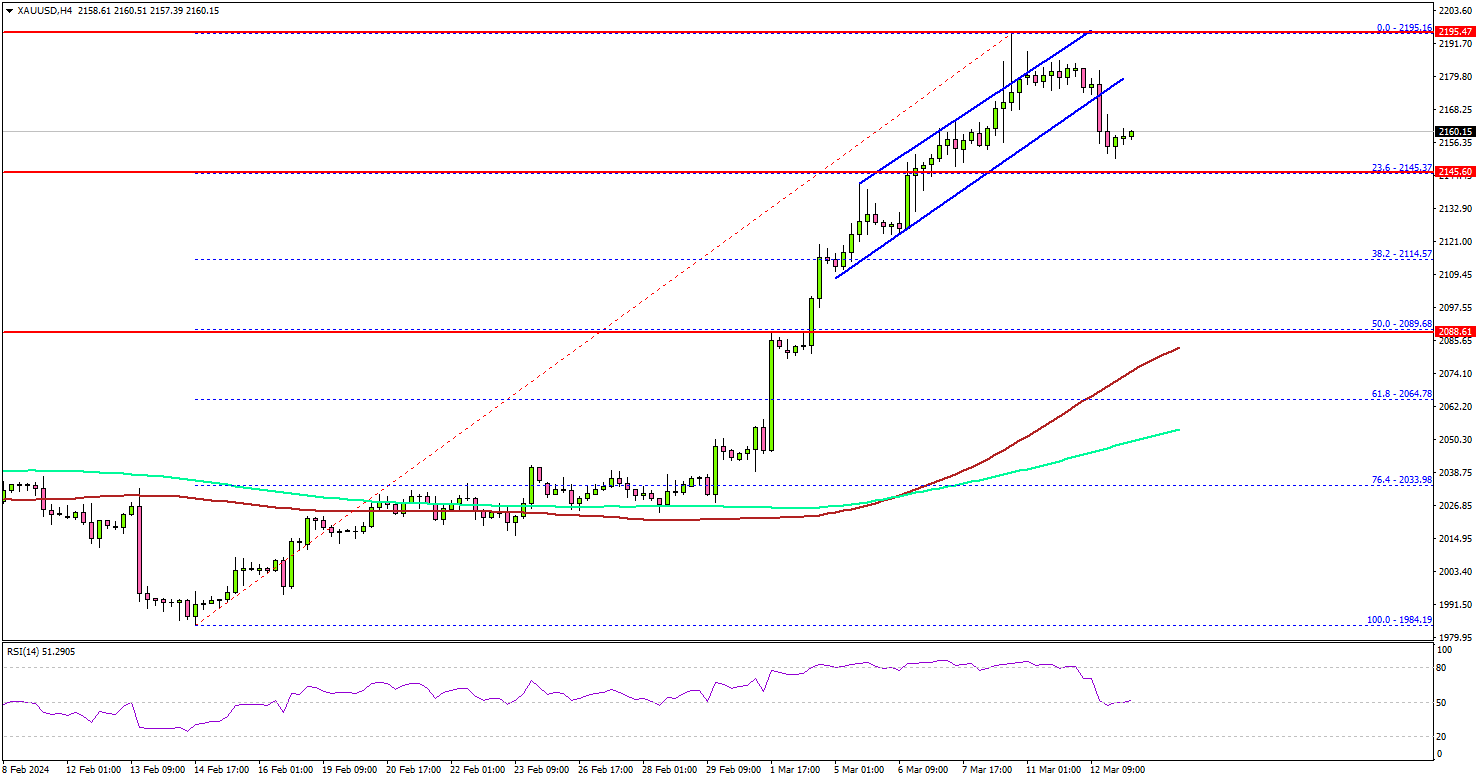
The bulls were able to pump the price above the $2,165 and $2,180 levels. Finally, the price traded close to the $2,200 level before the bears appeared. A high was formed at $2,195 and there was a minor downside correction.
There was a move below the $2,180 level. The price traded below a key rising channel with support at $2,170 on the same chart. Initial support is near the $2,145 level.
The first major support sits at $2,120. Any more losses might call for a move toward the $2,090 level or the 50% Fib retracement level of the upward move from the $1,984 swing low to the $2,195 high in the coming days.
Any more gains might open the doors for a test of $2,050. On the upside, the price might face resistance near the $2,180 level. The main resistance is now forming near $2,195 and $2,200.
Looking at Bitcoin, there was a strong upward move above the $70,000 and $72,000 levels. The next key resistance sits at $75,000.
Economic Releases to Watch Today
- UK Total Trade Balance for Jan 2024 - Forecast £-2.50B, versus £-2.603B previous.
- UK GDP for Jan 2024 (MoM) - Forecast +0.2%, versus -0.1% previous.