

Sample Category Title
Gold Price Rally Takes Break, Dips Turn Attractive
Key Highlights
- Gold rallied above the $2,120 and $2,180 resistance levels.
- It traded below a key rising channel with support at $2,170 on the 4-hour chart.
- EUR/USD and GBP/USD started a downside correction.
- Bitcoin price extended its rally above $72,000.
Gold Price Technical Analysis
Gold prices started a fresh increase from the $2,050 support against the US Dollar. The bulls cleared the $2,120 resistance to start a strong rally.
The 4-hour chart of XAU/USD indicates that the price settled above the $2,140 level, the 100 Simple Moving Average (red, 4 hours), and the 200 Simple Moving Average (green, 4 hours).
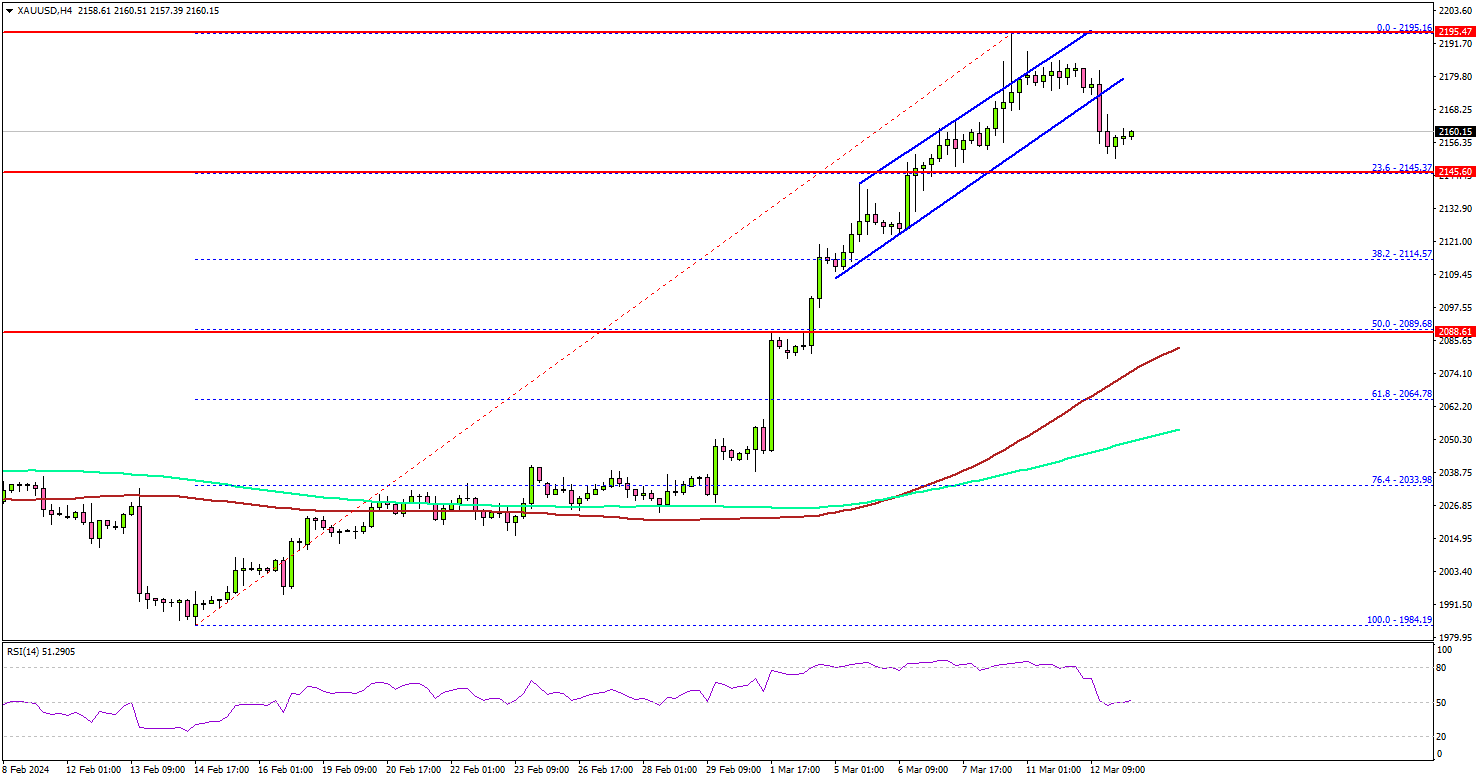
The bulls were able to pump the price above the $2,165 and $2,180 levels. Finally, the price traded close to the $2,200 level before the bears appeared. A high was formed at $2,195 and there was a minor downside correction.
There was a move below the $2,180 level. The price traded below a key rising channel with support at $2,170 on the same chart. Initial support is near the $2,145 level.
The first major support sits at $2,120. Any more losses might call for a move toward the $2,090 level or the 50% Fib retracement level of the upward move from the $1,984 swing low to the $2,195 high in the coming days.
Any more gains might open the doors for a test of $2,050. On the upside, the price might face resistance near the $2,180 level. The main resistance is now forming near $2,195 and $2,200.
Looking at Bitcoin, there was a strong upward move above the $70,000 and $72,000 levels. The next key resistance sits at $75,000.
Economic Releases to Watch Today
- UK Total Trade Balance for Jan 2024 - Forecast £-2.50B, versus £-2.603B previous.
- UK GDP for Jan 2024 (MoM) - Forecast +0.2%, versus -0.1% previous.
ECB’s Wunsch: We have to make a bet at some point
ECB Governing Council member Pierre Wunsch emphasized the need for proactive stance on interest rates, acting on the fact that "inflation has gone down, is moving in the right direction".
Speaking at a news conference for the Belgian national bank's annual report, Wunsch candidly expressed that ECB is nearing a point where it must "make a bet" on cutting interest rates.
However, he was quick to temper expectations, noting that any decision to cut rates would be made carefully, with a keen eye on the persisting challenges of "service inflation and wage developments", which are "still running at levels that are ultimately not compatible with our objective"
Despite these concerns, Wunsch indicated that ECB would not delay rate cuts until wage growth falls to 3%.
ECB’s Villeroy sees broad agreement for Spring rate cut
In an interview with Le Figaro, ECB Governing Council member Francois Villeroy de Galhau revealed a "very broad agreement" within the council to initiate rate cuts in spring, with lasts until end of June.
Villeroy, who also serves as Governor of Bank of France, expressed optimism that "we're winning the battle against inflation". The bank lowered core inflation forecast for 2024 from 2.8% to 2.4%. This revision aligns with more moderate wage increases, with average salaries expected to rise by 3.2%, down from the previously predicted 4.1%.
On the growth front, Bank of France downgraded its 2024 growth projections slightly from 0.9% to 0.8%, with expectations for an acceleration to 1.5% in 2025 and 1.7% in 2026. Villeroy confidently stated, "France will avoid recession."
BoE’s Bailey surge in unemployment unnecessary on tackling inflation
BoE Governor Andrew Bailey expressed a more positive stance on the UK's inflation scenario compared to a year ago, particularly regarding the potential for "second round effects" to drive further price surges.
At a panel discussion at the Bank of Italy Symposium, he noted there is "very limited evidence so far" that an uptick in unemployment is a prerequisite for reigning in inflationary pressures.
Bailey highlighted the UK's labor market status, pointing out that the country is near or at full employment. "It doesn't get a lot of comment, but we have seen very limited evidence so far of an increase in unemployment as a sort of necessary condition of reducing inflation," he added.
Why are Gold and Bitcoin Hitting New Records Together?
- Gold and Bitcoin cruise to new all-time highs simultaneously
- However, there are different drivers behind these rallies
- Overall, both assets might have more scope to run higher
Gold and bitcoin go through the roof
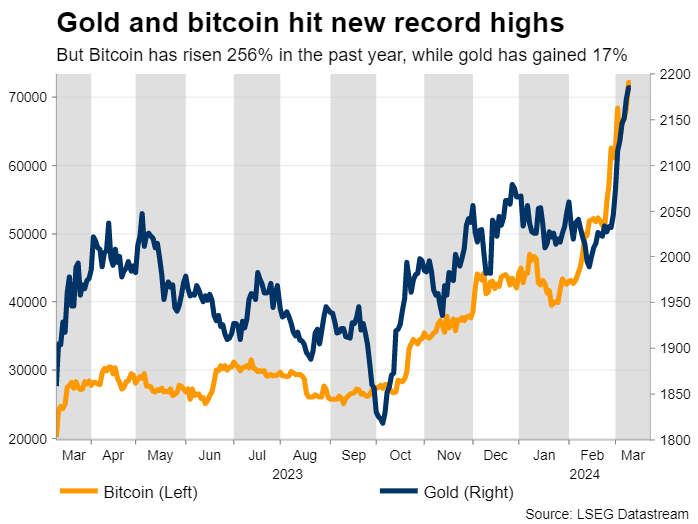
It’s pretty rare to see gold and bitcoin setting new record highs at the same time. Gold is considered the ultimate safe haven asset, while bitcoin is often viewed as one of the riskiest and most speculative plays. When both of them stage an incredible rally, it sends mixed signals about the mood in global markets.
Yet, the catalysts behind each rally are quite different. The only common characteristic is that both gold and bitcoin have benefited from speculation that the Fed is about to slash interest rates. Aside from that, each asset has been driven higher by its own unique forces.
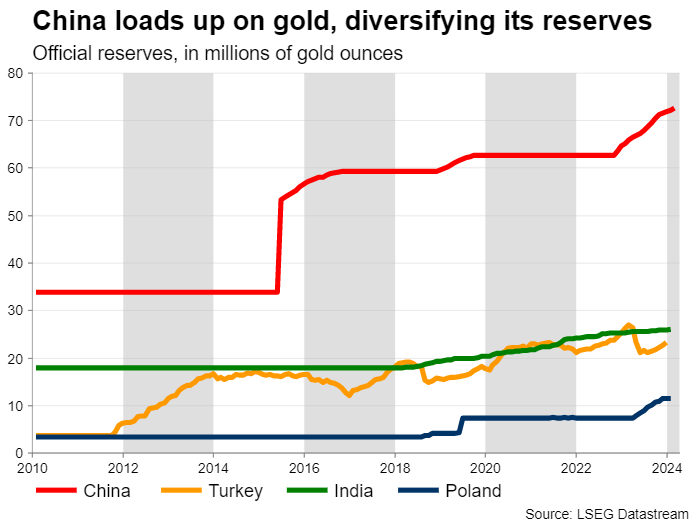
Gold has been turbocharged by direct purchases from central banks, with China leading the charge. Beijing is trying to diversify its reserves away from the US dollar, after the US weaponized the dollar in its sanctions against Russia. China is worried about suffering the same fate in case its relations with America deteriorate.
Chinese consumers have gone on a buying spree as well, searching for protection from the crash in the nation’s property and equity markets. This local demand for gold is evident when comparing prices - gold in Shanghai is trading at a significant premium over the same gold in London.
Safe haven flows have been another source of fuel for gold prices. The geopolitical landscape is unstable and some investors might also be buying gold as a hedge against a recession, as economic growth is losing steam in several regions.
What’s behind Bitcoin’s ascent?
In the crypto arena, bitcoin has enjoyed increased interest from institutional investors following the launch of spot ETFs last year. These contracts have granted the ‘big players’ easier and safer exposure to the famous coin.
One signal that bitcoin's ascent is being driven by ‘smart money’ is that smaller alternative coins are nowhere close to their own record highs. Hence, investors are displaying a clear preference for higher quality and less volatile crypto holdings, rather than simply chasing gains.
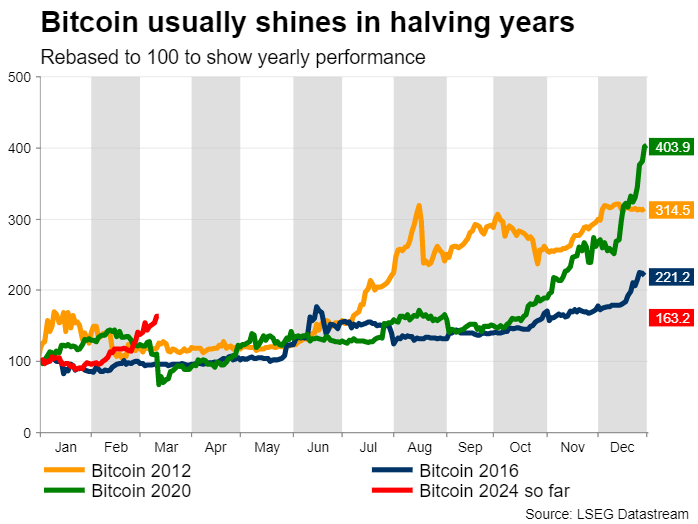
Another element behind bitcoin’s meteoric rise has been the prospect of reduced supply growth, ahead of next month’s halving event. This is a process by which the reward for mining new blocks of bitcoin is cut in half, reducing the rate at which new bitcoins are generated.
Slower supply growth often leads to higher prices. Indeed, bitcoin prices have risen in the aftermath of previous halving events, and this time around, traders seem to be frontrunning this move.
Can the rallies stretch further?
With both gold and bitcoin trading in uncharted waters, the question on everyone’s mind is whether these rallies can stretch even further. In a nutshell, the answer might be ‘yes’.
Let’s start with gold. Central banks have purchased record amounts of gold over the last couple of years, and this process will likely continue as the standoff between the United States and China heats up, especially if Donald Trump is re-elected president.
China has been loading up on gold, but gold still represents only 4.3% of the nation’s total foreign exchange reserves. Hence, there’s plenty of scope for that number to keep rising, keeping demand for bullion at elevated levels.
Similarly, gold can still draw support from interest rates falling. Speculation around rate cuts has pushed bond yields lower, which has boosted the yellow metal that pays no yield to hold. But yields are still quite high from a historical perspective, trading near their highest levels in a decade. This suggests gold can still capitalize on yields falling back to more ‘normal’ levels, particularly if the US economy weakens, forcing the Fed to slash interest rates deeper and faster.
As for bitcoin, the outlook still appears positive ahead of the halving event on April 20th, which in previous instances has benefited prices. At the same time, the king of crypto is increasingly entering institutional portfolios as an alternative asset. Even if it makes up only a tiny fraction of such portfolios, those inflows are still significant for a market as small as crypto.
That said, there might be an even stronger bull case for Ethereum, the second biggest cryptocurrency. Ethereum is still 17% below its own record highs, but with spot ETFs on the horizon, it might be only a matter of time until it attracts the same ‘smart money’ flows as bitcoin did recently.
Applications for spot Ethereum ETFs are still pending approval by US regulators, which could be granted later this year.
CADJPY Wave Analysis
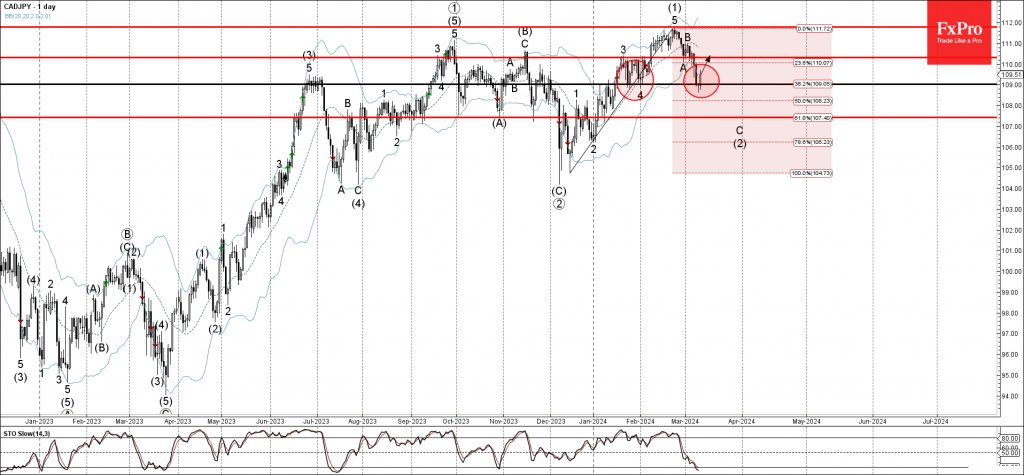
- CADJPY reversed from support level 109.00Likely to rise to resistance level 110.00d
CADJPY currency pair recently reversed up from the support level 109.00 (low of the previous correction 4) coinciding with the lower daily Bollinger Band and the 38.2% Fibonacci correction of the upward impulse (1) from December.
The upward reversal from the support level 109.00 stopped the C-wave of the active ABC correction (2) from the end of February.
Given the resumption of the yen sales and the strong daily uptrend, CADJPY currency pair can be expected to rise further toward the next resistance level 110.00 (former low of wave A).
Nasdaq-100 index Wave Analysis
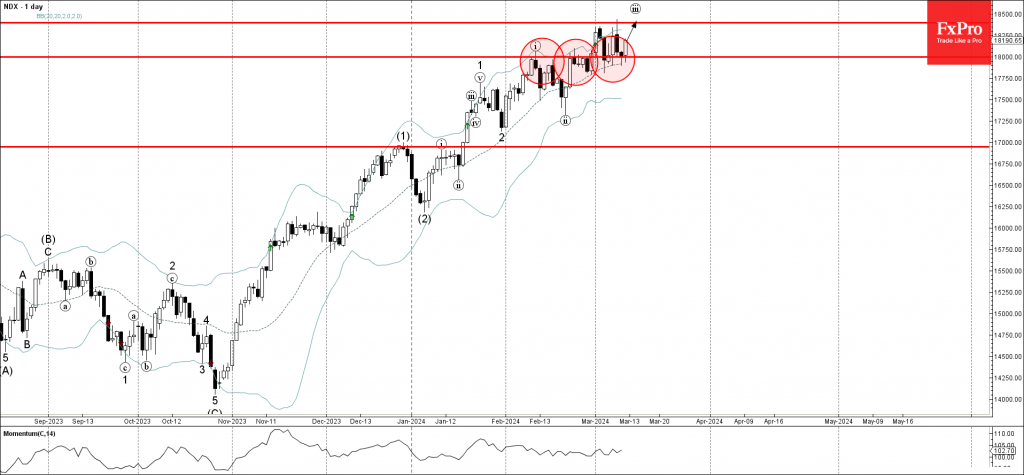
- Nasdaq-100 index reversed from key support level 18000.00
- Likely to rise to resistance level 18400.00
Nasdaq-100 index recently reversed up from the key support level 18000.00 (former strong resistance from February acting as the support after it was broken earlier) coinciding with the 20-day moving average.
The upward reversal from the support level 18000.00 continues the three of the active impulse waves iii, 3 and (3).
Given the predominant daily uptrend, Nasdaq-100 index can be expected to rise further toward the next resistance level 18400.00 (which reversed the index earlier this month).
USD: CPI Sets The Tone For Further Movements
The US Bureau of Labor Statistics (BLS) reported that the Consumer Price Index (CPI) in the US increased to 3.2% year-over-year in February from 3.1% in January. The Core CPI, which excludes volatile food and energy prices, rose 3.8% year-over-year, slightly below January's 3.9% but above market expectations of 3.7%. Both the CPI and Core CPI also rose by 0.4% on a monthly basis. The increase was mainly attributed to rising shelter and gasoline prices, which contributed over sixty percent of the monthly rise in all items. The energy index rose by 2.3% over the month, while the food index remained unchanged. In response to the CPI data, the US Dollar Index saw a slight increase, rising 0.08% on the day to 102.93.
AUDUSD - H4 Timeframe
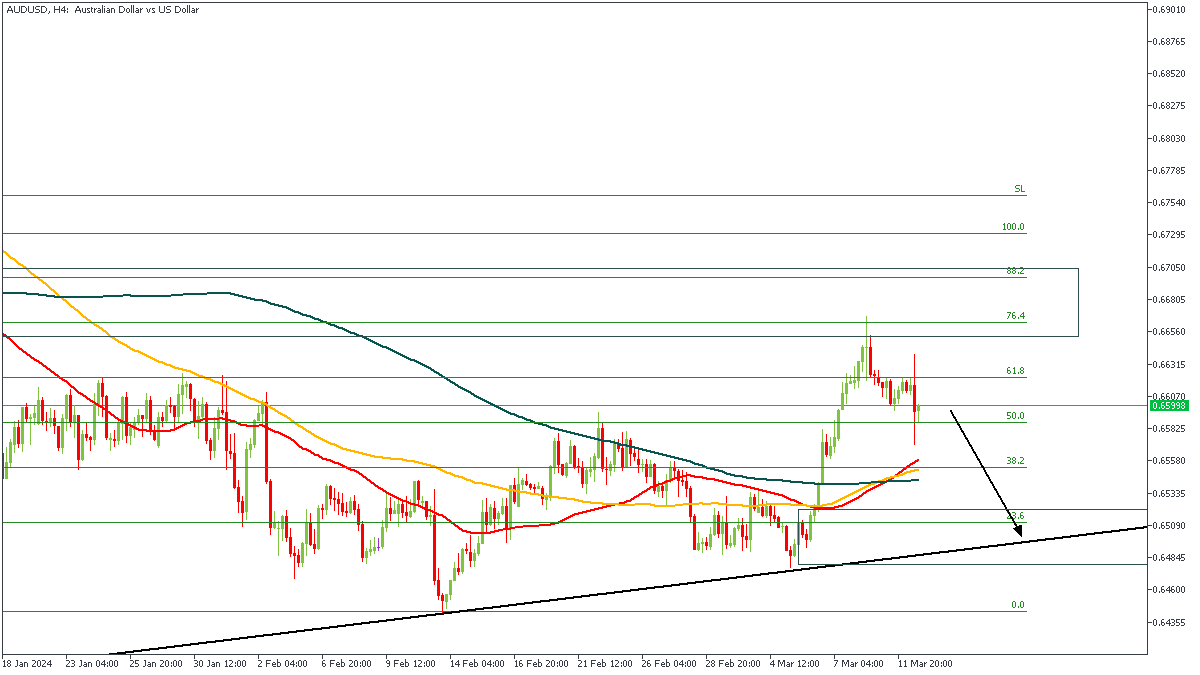
The AUDUSD chart on the 4-hour shows price currently reacting away from the supply zone, which overlaps fittingly with the 76% of the Fibonacci retracement zone. Also, we see that there is a trendline support below the current price action, as well as a demand zone. Following these confluences, I find it appropriate to maintain a bearish sentiment until price reaches the demand zone to react from.
Analyst’s Expectations:
- Direction: Bearish
- Target: 0.65216
- Invalidation: 0.66723
EURUSD - H4 Timeframe
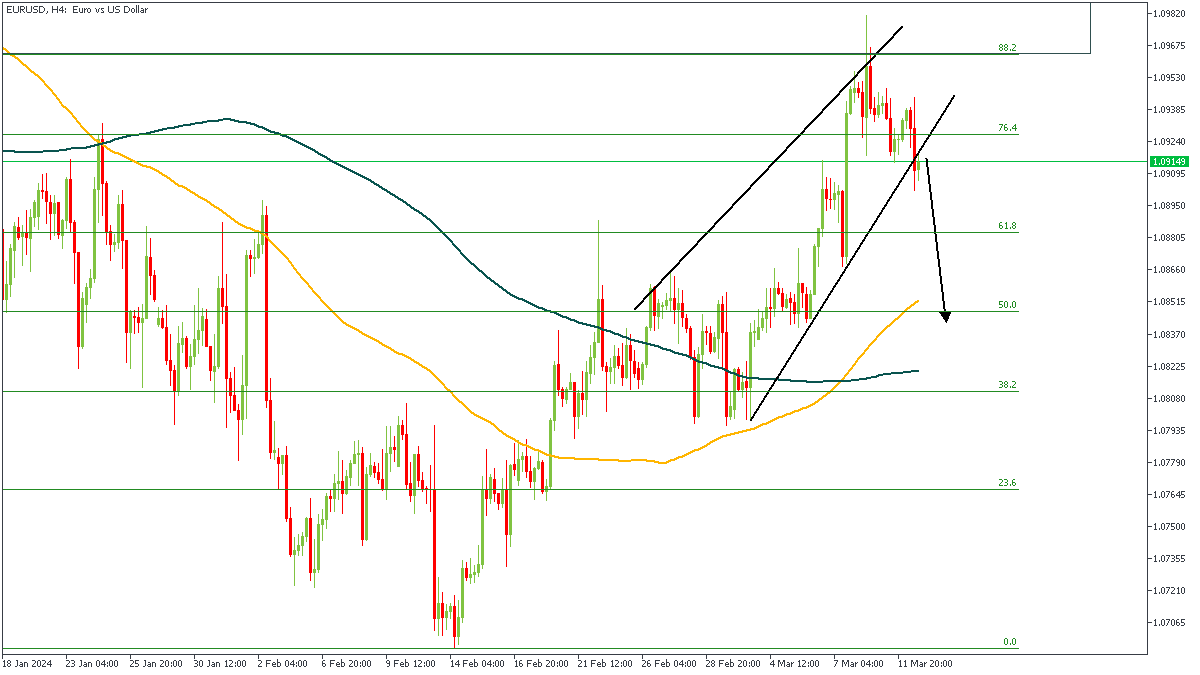
On the 4-hours timeframe, EURUSD has just broken out of the wedge consolidation pattern and could be heading towards the 200-period moving average as its initial target. In the meantime, however, I expect to see prices slide lower till it finds support from the moving averages or the Fibonacci retracement level.
Analyst’s Expectations:
- Direction: Bearish
- Target: 1.08575
- Invalidation: 1.09559
GBPUSD - H4 Timeframe
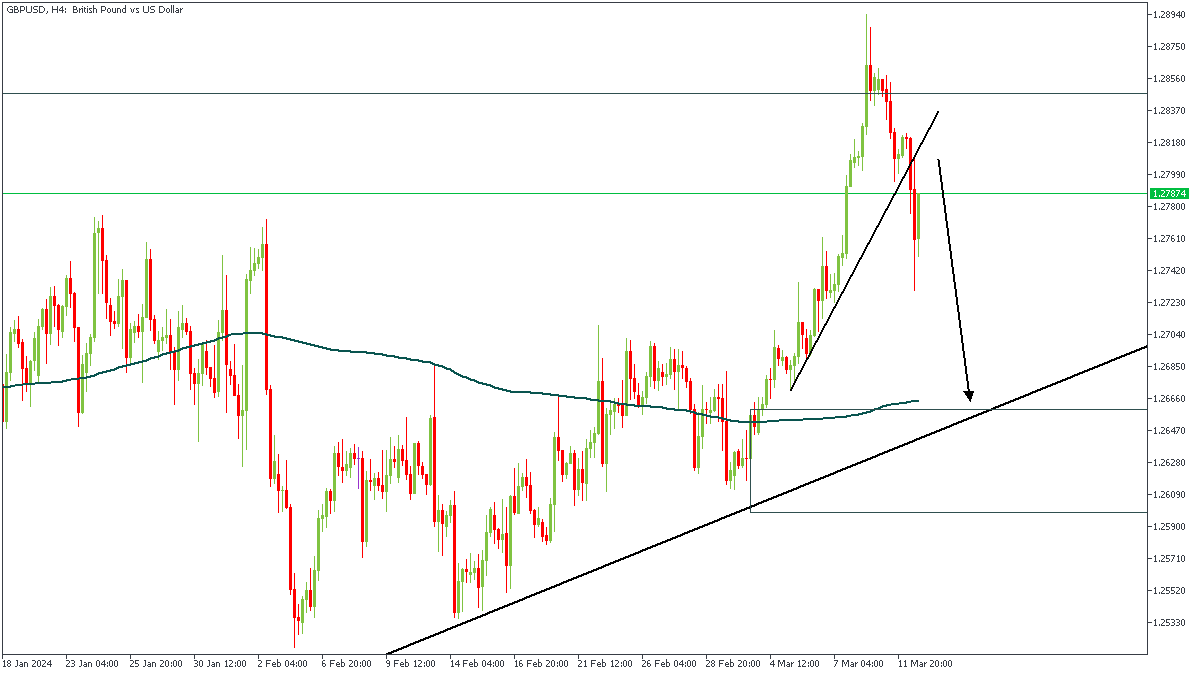
The recent rejection from the supply zone on the 4-hour timeframe of GBPUSD has been observed to break the trendline support; following this, I see the likelihood for price to continue its drop until it reaches the confluence of the trendline support and the 200-period moving average. This is my sentiment in the meantime, although the overall structure seems to have shifted.
Analyst’s Expectations:
- Direction: Bearish
- Target: 1.26870
- Invalidation: 1.28396
CONCLUSION
The trading of CFDs comes at a risk. Thus, to succeed, you have to manage risks properly. To avoid costly mistakes while you look to trade these opportunities, be sure to do your due diligence and manage your risk appropriately.
US Inflation in No Hurry to Slow, But Markets Don’t Care
US consumer inflation beat expectations for the fourth month in a row. The CPI rose 0.4% m/m. The monthly growth rate has been rising since October. The year-over-year rate climbed to 3.2%, a bit above forecasted 3.1%.
Core CPI rose 0.4% m/m for the second month. The annual growth rate slowed to 3.8%, which formally left the index on a downward trajectory.
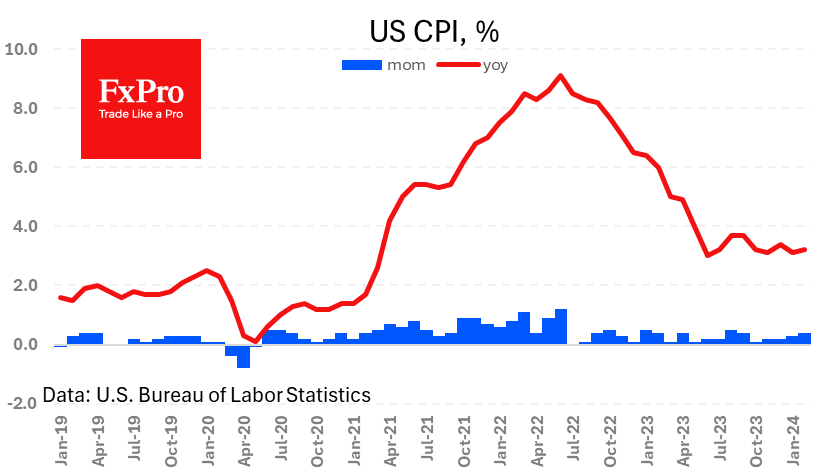
However, both the Headline and Core indices have risen over the past three months at a pace that would keep inflation well above 2% for months to come.
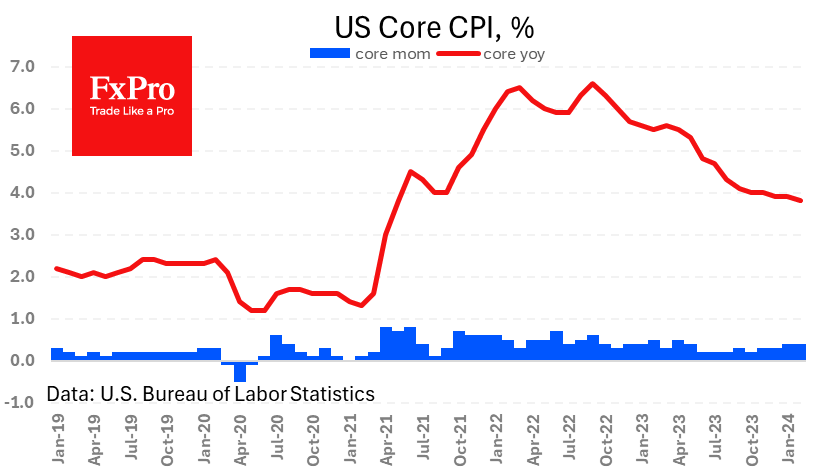
This is potentially good news for the dollar, which has been given a chance to rally after selling off since mid-February. However, we will be watching the reaction of markets, where hopes of a rate cut have not moved. The consensus still points to a cut in June with a 68% probability, down from 72% a day ago and 73% a week ago. These are not significant changes.
Clearly, the inflation surprised economists but barely market traders, and they still expect the Fed to ease policy in the middle of the year as prices have not yet risen dramatically.