

Sample Category Title
Bitcoin Fluctuates But Keeps Its Direction
Market picture
The crypto market rose another 0.5% over the past 24 hours to $2.75 trillion. The Cryptocurrency Fear and Greed Index remained at 81 (extreme greed). But the past day was not a quiet one.
Bitcoin briefly broke above $73K in a sharp move, triggering an avalanche of stop orders that drove the price down 6.5% over the next three hours to $68.6K – precisely the level from which the last rally began on Monday.
This pullback was considered an opportunity for those looking to get in at the rally, and there appear to be quite a few. The intraday nature of the move is reminiscent of the behaviour of large institutional traders, with trading algorithms intercepting the move and retail traders often joining in. Either way, the overall trend remains bullish, and Bitcoin is climbing back towards its highs as we head into early European trading.
News background
The depth of liquidity in the bitcoin market, as measured by the value of exposures in order books within 2%, reached a record $600 million, Kaiko noted. The number of bids significantly exceeded the number of asks, suggesting profit-taking by traders as historical highs were updated. The persistence of refinancing rates near the highs suggests that demand for the asset is resilient.
BTC trading volume on spot platforms reached $51 billion, surpassing the values of the 2021 bull market. At the same time, Tether’s capitalisation reached an all-time high ($100bn).
Just two months after the launch of the first spot bitcoin ETFs in the US, the assets under management at BlackRock’s IBIT fund surpassed 200,000 BTC ($14.6 billion).
Given the pace of capital inflows into spot bitcoin ETFs, there will be a shortage of BTC supply in six months, CryptoQuant estimates. Currently, there are only 1.4 million BTC available in the market for bitcoin ETFs.
Bloomberg lowered the chances of spot Ethereum ETFs launching in May to 35% from 70%. The reduced optimism is due to the SEC’s low level of involvement in negotiations with issuers. Other challenges to a favourable verdict are the PoS mechanism, the risk of price manipulation and the recognition of the asset as a security.
The non-custodial cryptocurrency wallet MetaMask has begun testing Mastercard’s payment onchain. The joint product will be “the first truly decentralised web3 payment solution”. Users will be able to spend cryptocurrency “on everyday purchases wherever cards are accepted”.
GBP/USD: Bulls Show Resilience amid Inflation and GDP News
Yesterday important data on inflation in the United States was published. It caused a significant spike in volatility in financial markets, even though the values were in line with expectations. CPI in monthly terms: actual = 0.4%, forecast = 0.4%, a month ago = 0.3%, a year ago = 0.4%.
And today news came out about UK GDP in monthly terms, which also corresponded to expectations: fact = +0.2%, forecast = +0.2%, a month ago = -0.1%.
It is noteworthy that in both cases the first reaction was a fall in the price of GBP/USD, but then a recovery followed — this is a manifestation of the stability of demand.
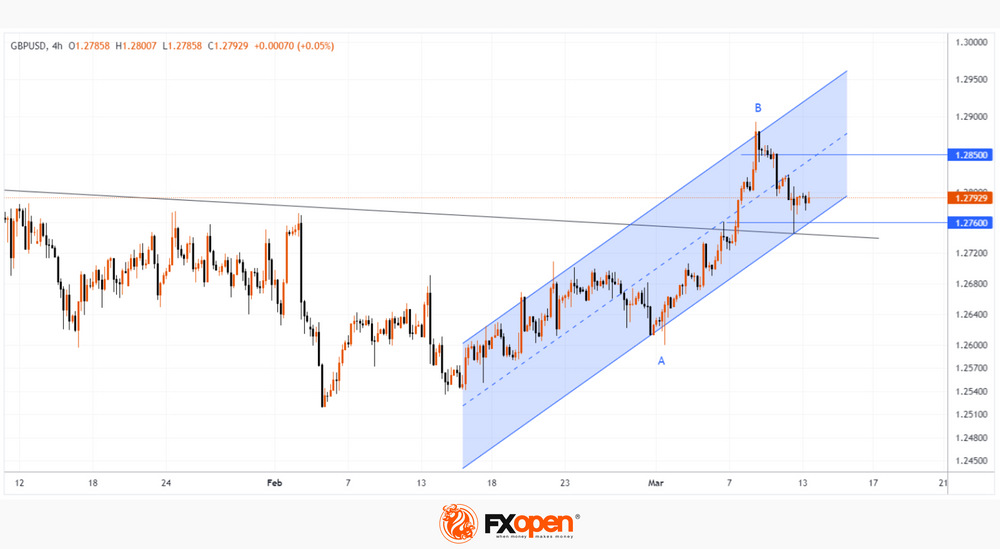
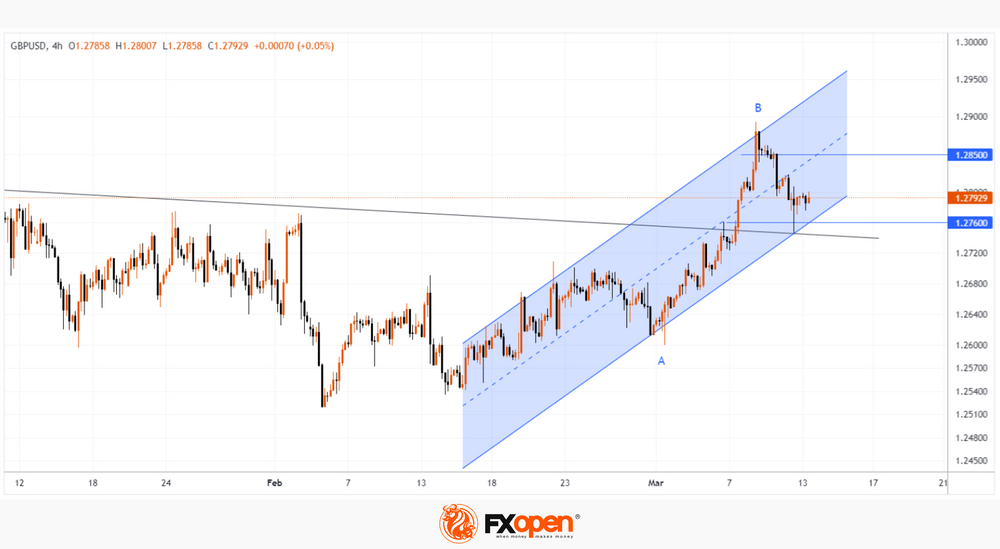
From the point of view of technical analysis of the GBP/USD chart, the market has support in the area of 1.276 from:
→ the bottom line of the ascending channel (shown in blue);
→ Fibo level 50% rollback from impulse A→B;
→ the black long-term trend line originating at the end of 2023, which previously served as resistance, but changed its role after the breakdown on March 7.
Will the bulls be able to resume the upward trend within the blue channel?
Even if attempts to implement this scenario occur, the GBP/USD chart shows that:
→ In this case, they may encounter bearish aggression, visible in sharp price declines from top B.
→ It is possible that resistance will be the level of 1.285, which served as local support on March 10-11, and in the area of which (for now) the median line of the blue ascending channel passes.
Trade over 50 forex markets 24 hours a day with FXOpen. Take advantage of low commissions, deep liquidity, and spreads from 0.0 pips. Open your FXOpen account now or learn more about trading forex with FXOpen.
This article represents the opinion of the Companies operating under the FXOpen brand only. It is not to be construed as an offer, solicitation, or recommendation with respect to products and services provided by the Companies operating under the FXOpen brand, nor is it to be considered financial advice.
Today Is an Ethereum Update. ETH/USD Is Above $4,000
An update is scheduled for the Ethereum network today, approximately at 16:55 GMT+3.
The update is called Dencun and is the biggest code change since April 2023, when the Shapella update was implemented.
Dencun aims to reduce fees on the growing array of ancillary networks running on top of Ethereum, called layer 2 (L2) “aggregates.” The changes involve “proto-dunksharding” technology, which is intended to improve the blockchain’s ability to process data from L2 networks.
It is believed that the implementation of the update will give impetus to the development of projects built on auxiliary networks. On the other hand, there is a risk of failures. Although it is worth noting that Dencun was deployed three times on test networks, and each time there were no problems.
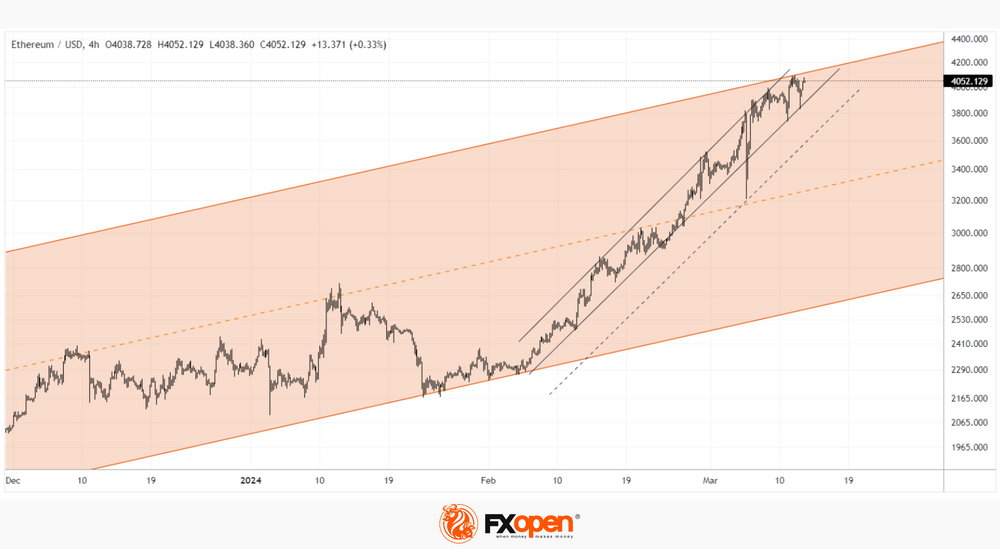
The ETH/USD chart shows that the price of Ethereum today, on the day of the update, is showing bullish behavior:
→ the price moves within the long-term ascending channel (shown in orange). Having pushed off from its lower limit in early February, the price of ETH has already reached its upper limit, which is +76% in about a month!
→ during the growth, the price formed an ascending channel (shown by black lines);
→ the price is trying to consolidate above the psychological level of USD 4,000 for Ethereum.
→ long lower shadows on the candles on March 11-12 give reason to believe that there is strong demand in the market amid news related to an important update for the development of Ethereum.
Reaching the upper boundary of the channel is an argument in favor of a consolidation scenario after a significant rally. But it is possible that using the hype, the bulls will try to storm the upper border of the channel. If successful, the area around USD 4,000 could act as an important support for ETH/USD in the future.
FXOpen offers the world's most popular cryptocurrency CFDs*, including Bitcoin and Ethereum. Floating spreads, 1:2 leverage — at your service. Open your trading account now or learn more about crypto CFD trading with FXOpen.
*At FXOpen UK and FXOpen AU, Cryptocurrency CFDs are only available for trading by those clients categorised as Professional clients under FCA Rules and Professional clients under ASIC Rules respectively. They are not available for trading by Retail clients.
This article represents the opinion of the Companies operating under the FXOpen brand only. It is not to be construed as an offer, solicitation, or recommendation with respect to products and services provided by the Companies operating under the FXOpen brand, nor is it to be considered financial advice.
ECB’s Kazaks: Inflation dragon nearly defeated, rate cuts on horizon
ECB Governing Council member Martins Kazaks likened the fight against inflation to battling a dragon, stating in a blog post, "The dragon of inflation is pinned to the ground, a little more and it will be defeated." This vivid metaphor reflects a growing confidence within ECB that the persistent inflationary pressures which have challenged Eurozone economy are finally coming under control.
Kazaks further suggested that "if the economy roughly follows" the bank's forecasts, "then the decision to start reducing interest rates could be made within the next few meetings."
Kazaks also acknowledged the delicate balance the ECB has had to maintain: the risk of premature rate cuts that could reignite inflation versus the risk of delaying rate reductions too long. However, he noted that these risks are now beginning to "level out," there is "no need to delay the rate reduction too much"
Complementing Kazaks's insights, ECB Governing Council member Francois Villeroy de Galhau told France Info radio, "We will probably cut rates in spring, and spring in Europe is from April to June 21."
"It's perhaps more probable in June — we are very pragmatic and will see depending on the data," Villeroy added.
US Dollar Strengthens Amid Inflation Data
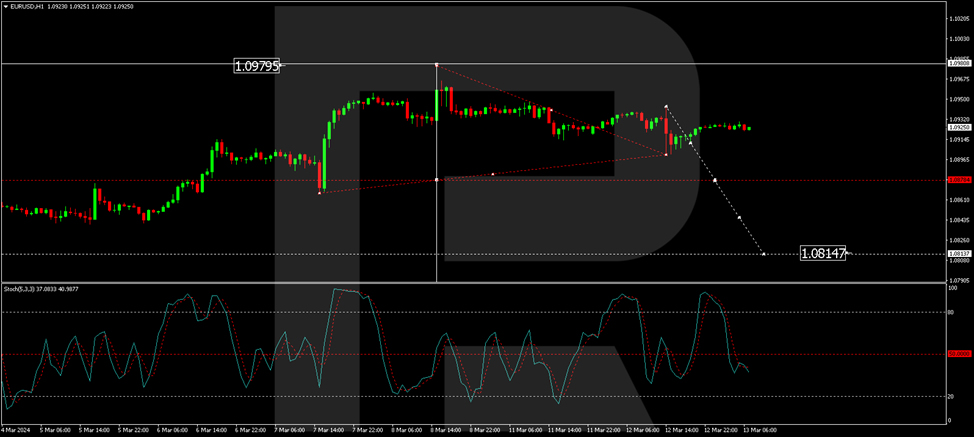
As of Wednesday, the EUR/USD pair is hovering near 1.0925 after experiencing a volatile session, with expectations for a more subdued week ahead.
Recent statistical data highlighted higher-than-expected inflation in the US for February, prompting adjustments to predictions about the easing of monetary policy by the Federal Reserve in June.
The Consumer Price Index (CPI) rose by 0.4% month-on-month last month, aligning with expectations. Year-on-year, the indicator expanded to 3.2% from 3.1%. Core inflation in the US increased by 0.4% month-on-month, surpassing the forecast of 0.3%. From year to year, the indicator rose to 3.8% from the previous 3.7%.
While these figures did not come as a "surprise," they reaffirmed that inflation is more persistent than previously thought. Specific details of the reports offer local hope for improvement, although it is clear overall that the situation could be more comfortable for the Fed to make significant decisions.
The market interpreted these developments favourably for the US dollar, shifting investor preferences towards it.
Market focus is squarely on the Fed's June meeting, with the March and May sessions attracting less interest. The Fed will likely require more statistical information by then.
As indicated by public data, investor expectations suggest a 69% chance of a rate cut in June, down from 71% earlier in the week.
In what would be the most optimistic forecast, the Fed will probably manage to cut rates only three times this year.
Technical Analysis of EUR/USD
On the H4 chart, EUR/USD is forming the first wave of decline towards 1.0777. The first structure of this wave and its correction have been completed. Today, we will consider the likelihood of breaking the minimum of the first structure and continuing the development of the wave to the local target level of 1.0815. The MACD indicator confirms this scenario, with its signal line above zero and a sharply decreasing histogram, indicating the continuation of the downtrend.
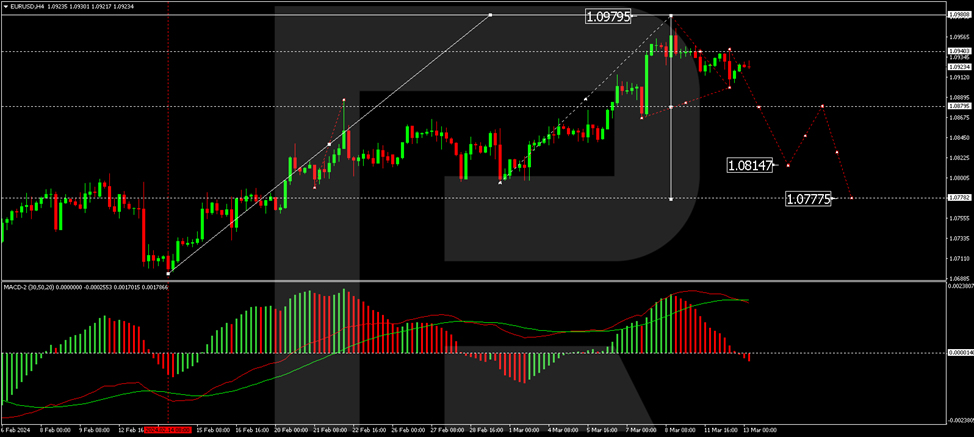
On the H1 chart, EUR/USD has formed the first wave of a decline structure to 1.0900 and a correction to 1.0939. The market has essentially delineated a consolidation range around the level of 1.0939. Today, a decline to the lower boundary of this range is expected. With a breach of 1.0900, a further decline to 1.0880 is anticipated, with the trend potentially continuing to 1.0815. The Stochastic oscillator confirms this scenario, with its signal line below the 50 mark, expecting a continuation of the decline towards 20.
GBP/USD Recovers While EUR/GBP Aims More Upsides
GBP/USD is attempting a fresh increase from the 1.2745 zone. EUR/GBP is gaining pace and might extend its rally above the 0.8550 zone.
Important Takeaways for GBP/USD and EUR/GBP Analysis Today
- The British Pound is attempting a recovery above the 1.2780 zone against the US Dollar.
- There was a break above a key bearish trend line with resistance at 1.2790 on the hourly chart of GBP/USD at FXOpen.
- EUR/GBP started a fresh increase above the 0.8535 resistance zone.
- There is a major bullish trend line forming with support near 0.8535 on the hourly chart at FXOpen.
GBP/USD Technical Analysis
On the hourly chart of GBP/USD at FXOpen, the pair started a fresh decline from the 1.2890 zone. The British Pound traded below the 1.2820 zone against the US Dollar.
A low was formed near 1.2746 and the pair is now attempting a recovery wave. There was a break above the 23.6% Fib retracement level of the downward move from the 1.2893 swing high to the 1.2746 low.
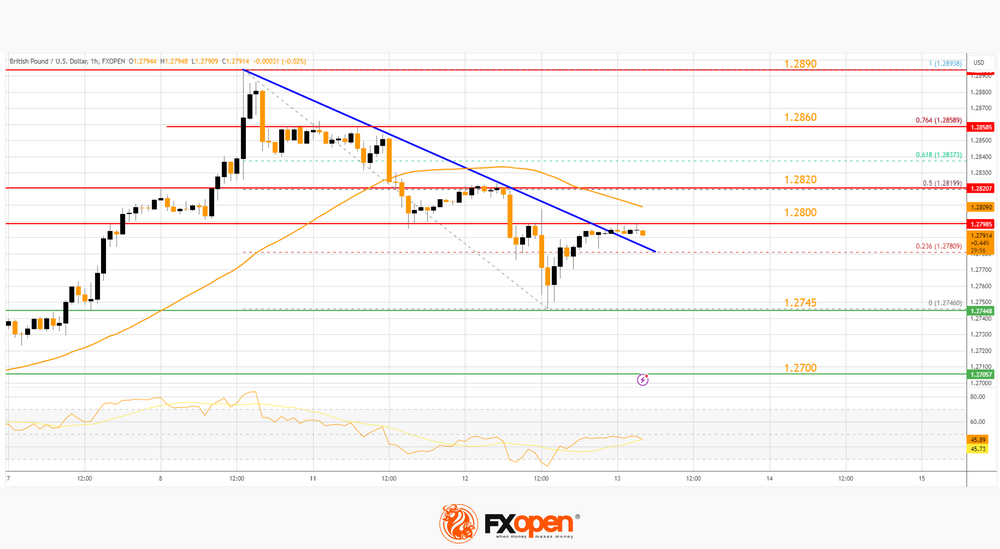
There was a break above a key bearish trend line with resistance at 1.2790, but the pair is still below the 50-hour simple moving average. On the upside, the GBP/USD chart indicates that the pair is facing resistance near 1.2800.
The next major resistance is near the 1.2820 level or the 50% Fib retracement level of the downward move from the 1.2893 swing high to the 1.2746 low. If the RSI moves above 50 and the pair climbs above 1.2820, there could be another rally. In the stated case, the pair could rise toward the 1.2890 level or even 1.2920.
On the downside, there is a major support forming near 1.2745. If there is a downside break below the 1.2745 support, the pair could accelerate lower. The next major support is near the 1.2700 zone, below which the pair could test 1.2665. Any more losses could lead the pair toward the 1.2550 support.
EUR/GBP Technical Analysis
On the hourly chart of EUR/GBP at FXOpen, the pair started a fresh increase from the 0.8500 zone. The Euro traded above the 0.8525 level to move into a positive zone against the British Pound.
The EUR/GBP chart suggests that the pair settled above the 50-hour simple moving average and 0.8535. There was a clear move above the 50% Fib retracement level of the downward move from the 0.8562 swing high to the 0.8503 low.
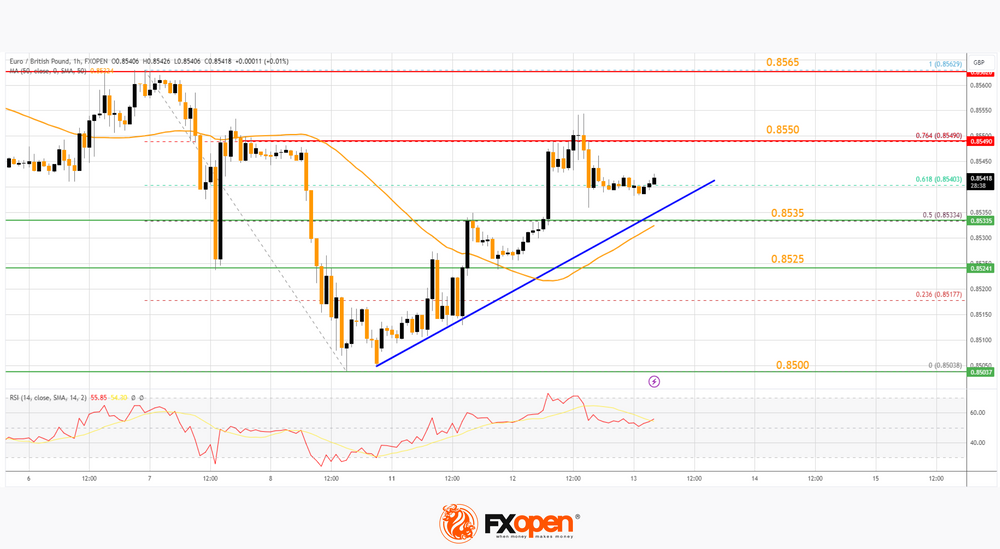
Immediate resistance is near 0.8550 or the 76.4% Fib retracement level of the downward move from the 0.8562 swing high to the 0.8503 low.
The next major resistance for the bulls is near the 0.8565 zone. A close above the 0.8565 level might accelerate gains. In the stated case, the bulls may perhaps aim for a test of 0.8600. Any more gains might send the pair toward the 0.8650 level in the coming days.
Immediate support sits near a major bullish trend line or 0.8535. The next major support is near the 0.8525 zone. A downside break below the 0.8525 support might call for more downsides.
In the stated case, the pair could drop toward the 0.8500 support level. Any more losses might send the pair toward the 0.8460 level in the near term.
Trade over 50 forex markets 24 hours a day with FXOpen. Take advantage of low commissions, deep liquidity, and spreads from 0.0 pips. Open your FXOpen account now or learn more about trading forex with FXOpen.
This article represents the opinion of the Companies operating under the FXOpen brand only. It is not to be construed as an offer, solicitation, or recommendation with respect to products and services provided by the Companies operating under the FXOpen brand, nor is it to be considered financial advice.
USDJPY Stuck Inside a Key Range
- USDJPY trades sideways in anticipation of next week’s key events
- USDJPY’s correction halted a tad above the 200-day SMA
- Momentum indicators support the bearish trend but with less conviction
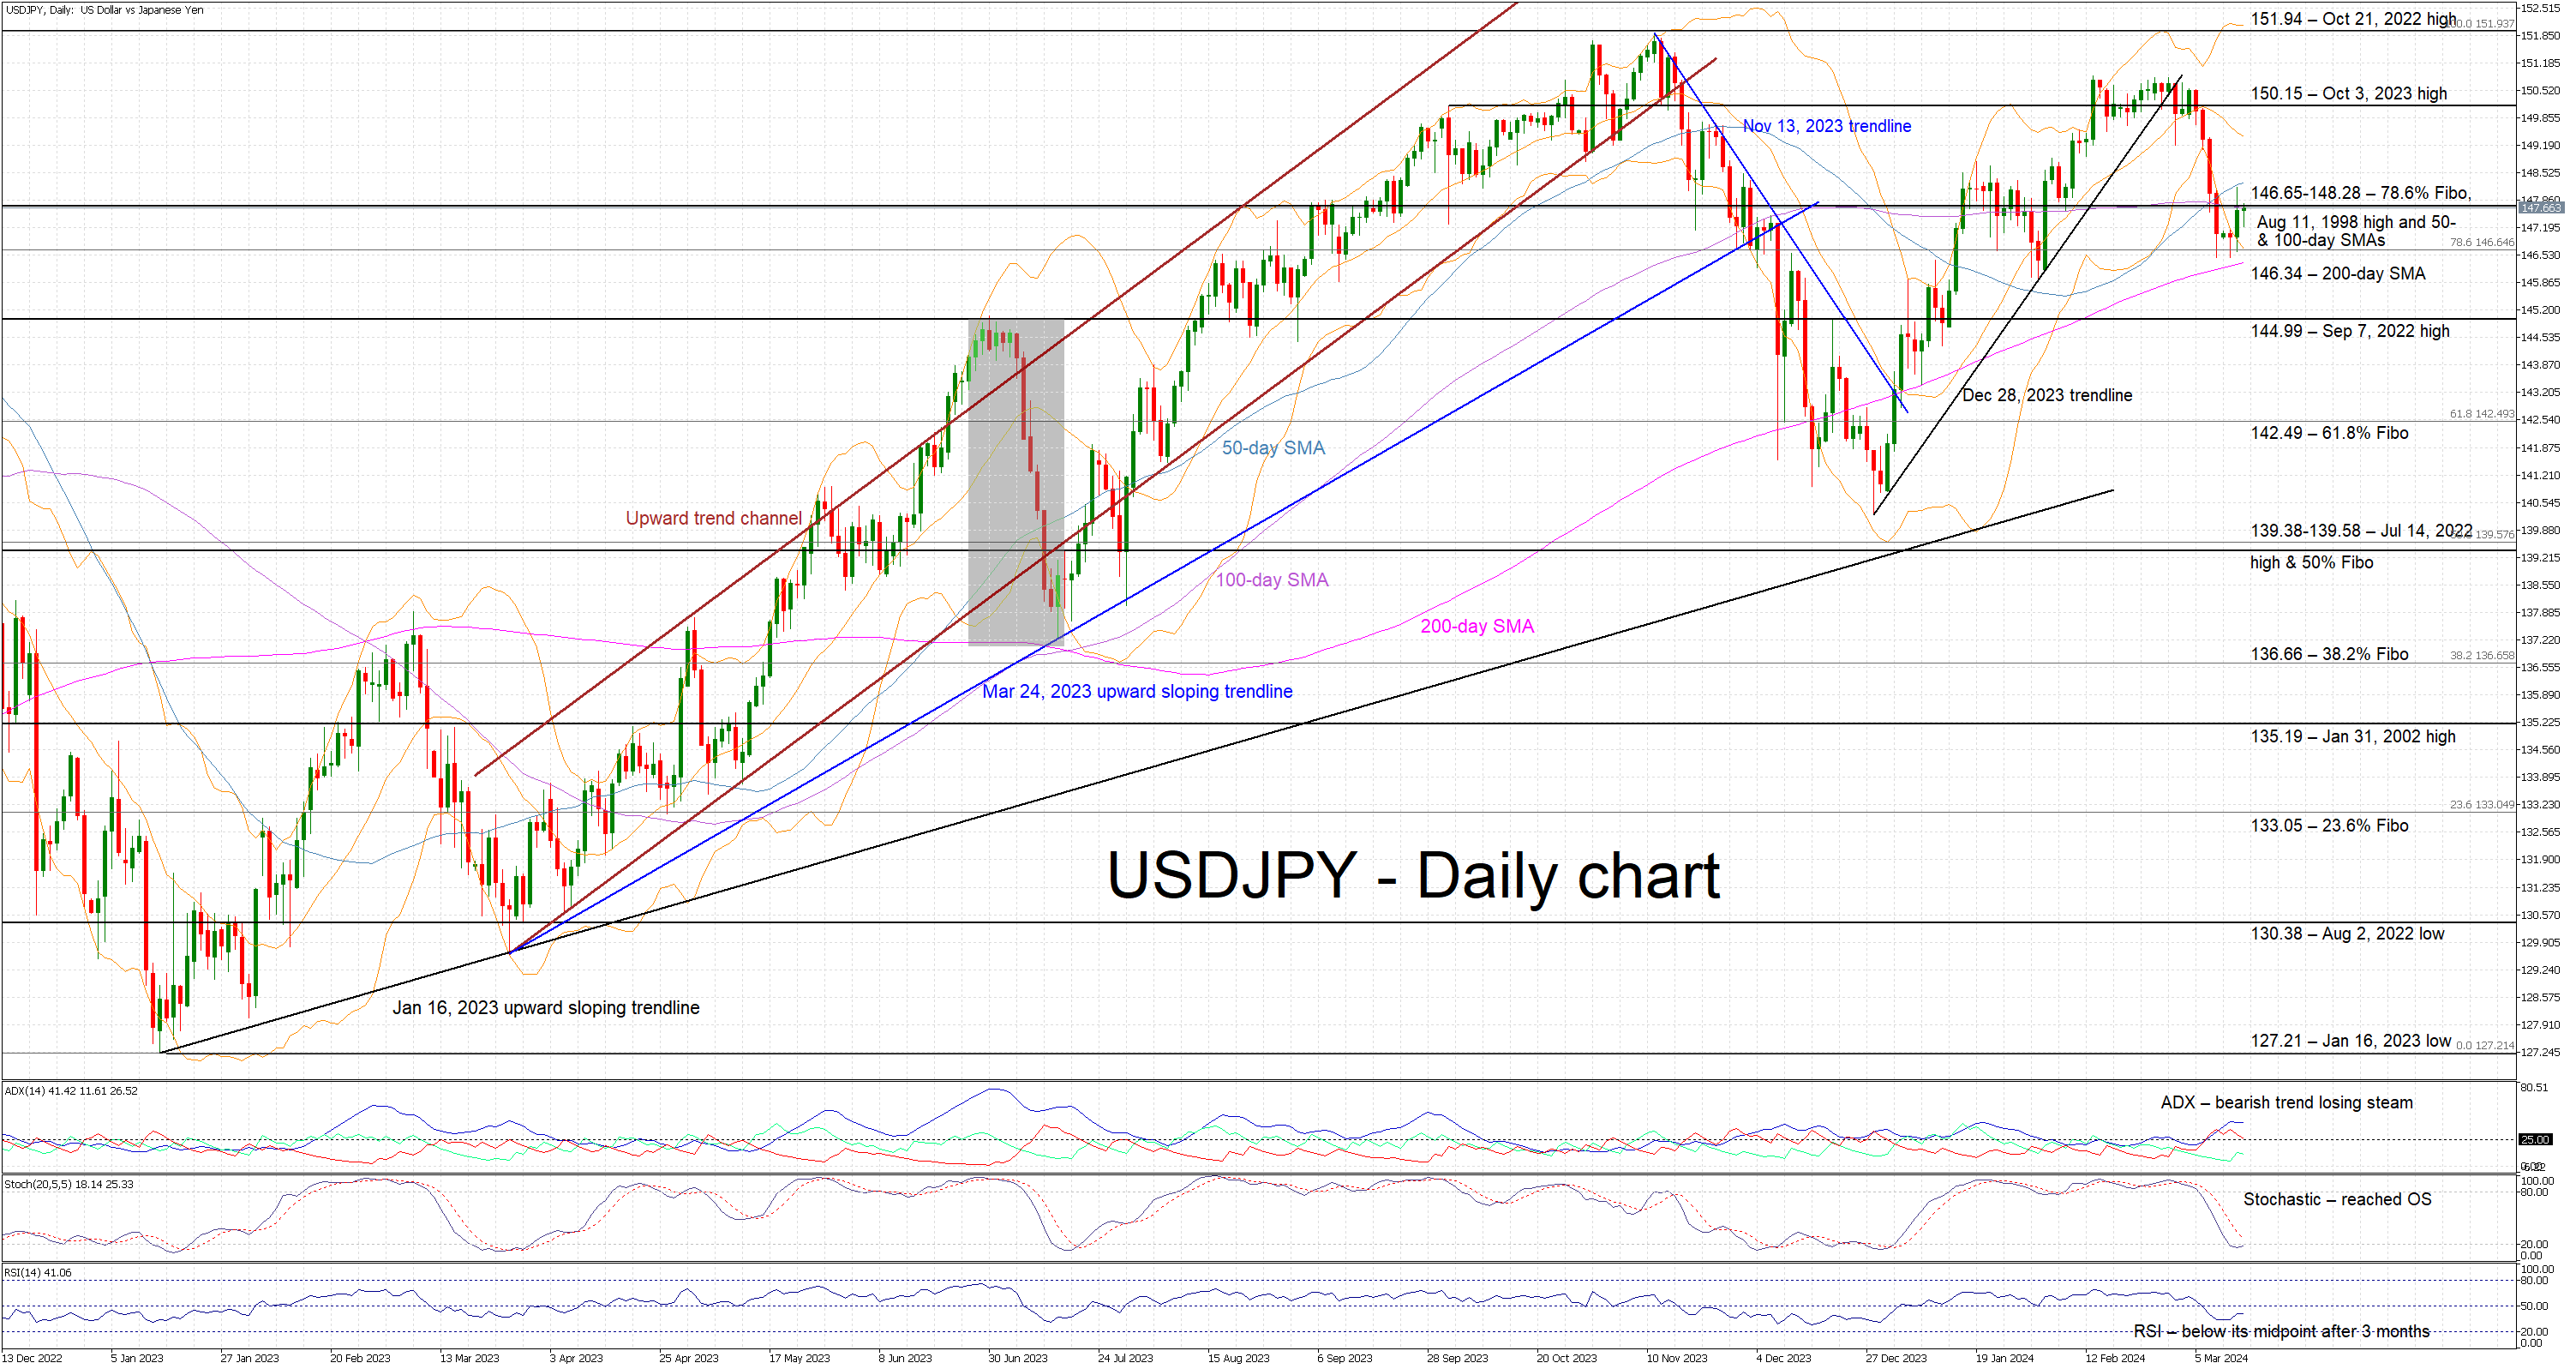
USDJPY is trying to record a green candle today as it tests the resistance set by the 146.65-148.28 range. The correction from the late February highs halted at the 200-day simple moving average (SMA) with market participants potentially positioning for the key events ahead, which include wage talk results and next week’s central bank meetings.
In the meantime, the momentum indicators remain mostly supportive of the recent correction. More specifically, the Average Directional Movement Index (ADX) is trading sideways, above the 25 threshold, and thus signalling a weakening bearish trend in USDJPY. Similarly, the RSI has dropped below its 50-midpoint for the first time in more than 3 months, but it appears unable to record a lower low. More importantly, the stochastic oscillator has reached its oversold (OS) territory and maintains a good gap from its moving average.
Should the bulls regain confidence, they could try to lead USDJPY above the 146.65-148.28 range and towards the October 3, 2023 high at 150.15. If successful, they could then stage a rally towards the October 21, 2022 high at 151.94 and gradually open the door to a new 30-year high.
On the flip side, the bears are keen to retake market control and finally break below the 146.65-148.28 area, which is populated by the 78.6% Fibonacci retracement of the October 21, 2022 - January 16, 2023 downtrend, the August 11, 1998 high, and the 50- and 100-day simple moving averages (SMAs). Even lower, the bears could push USDJPY towards the September 7, 2022 high at 144.99 level, provided they manage to overcome the support set by the 200-day SMA at 146.34.
To sum up, USDJPY bulls are attempting to recover part of their recent losses with the market’s attention firmly on the next key market events.
Gold Advances Again After Rebound Off 2,150
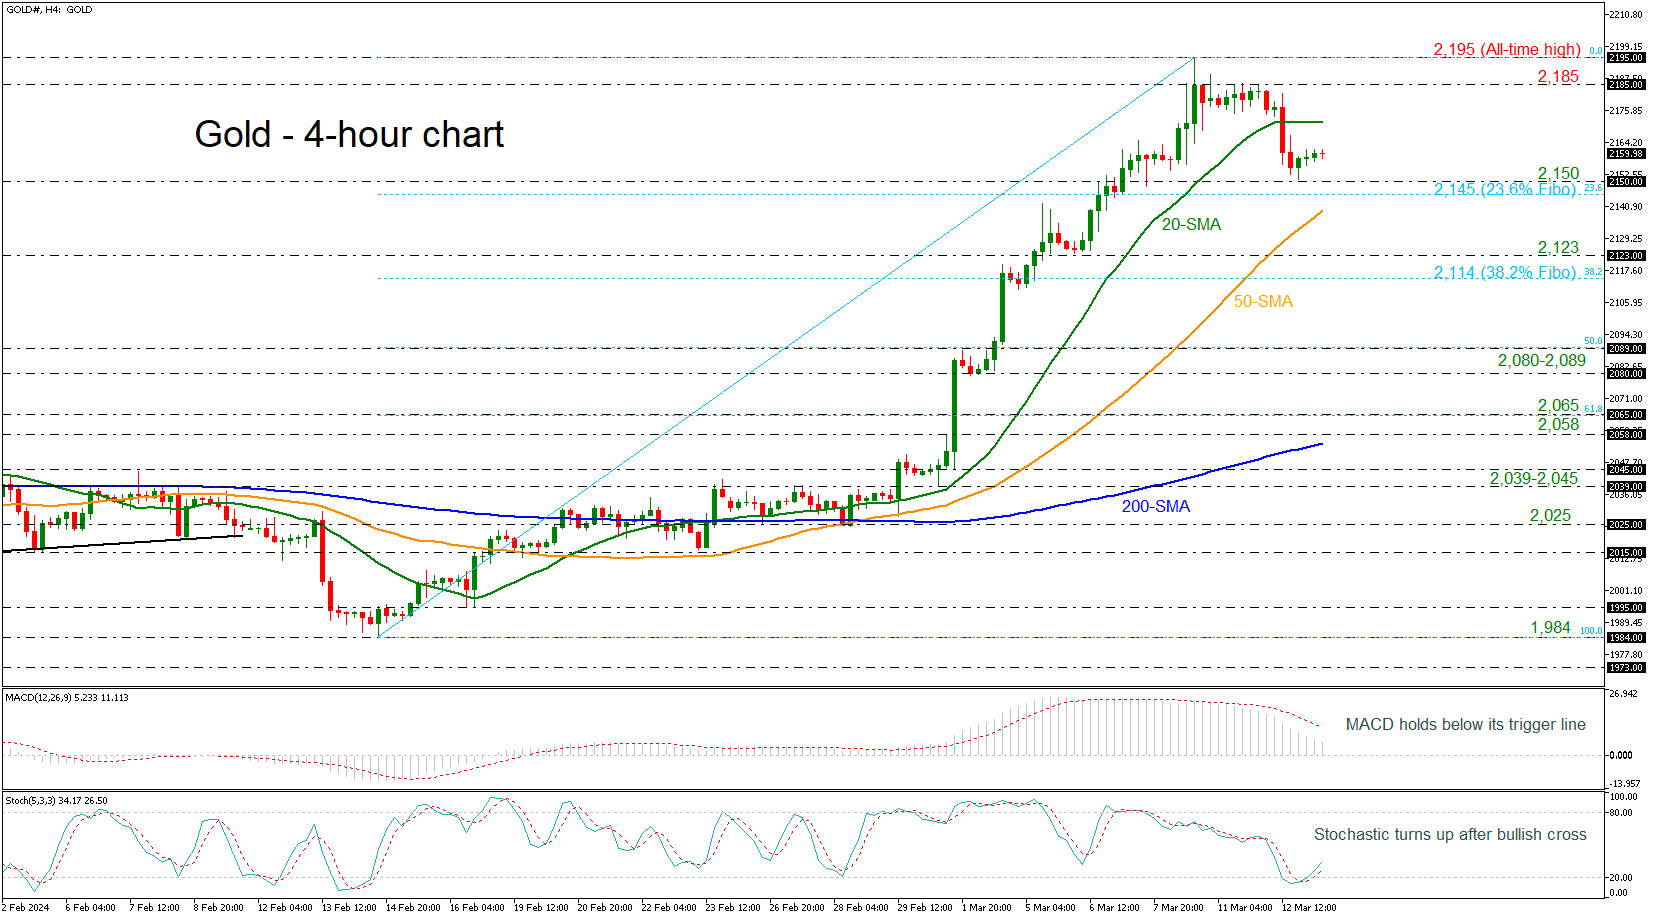
Gold prices rebounded off the 2,150 support level after creating a bearish correction from the strong rally towards the fresh all-time high of 2,195 on Friday in the 4-hour chart.
The technical oscillators are showing some contradicting signs as the MACD is losing momentum beneath its trigger line. However, the stochastic is gaining some momentum following the bullish crossover within the %K and %D lines in the oversold territory.
If the market continues to the upside, then the market could meet immediate resistance at the flat 20-period simple moving average (SMA) at 2,171 before challenging the crucial 2,185 bar. Even higher, the record peak of 2,195 may halt bullish movements.
On the flip side, a dive below the 2,150 support and the 23.6% Fibonacci retracement level of the upward wave from 1,984 to 2,195 at 2,145 could send the price until the 50-period SMA at 2,139. Steeper decreases could open the door for the 2,123 region and the 38.2% Fibonacci of 2,114.
All in all, the yellow metal is strongly bullish despite the latest downside move in the 4-hour chart. A move below the 200-period SMA may switch the outlook to a more neutral one.
Nikkei (NKD_F) Elliott Wave View: Reacted from the Blue Box
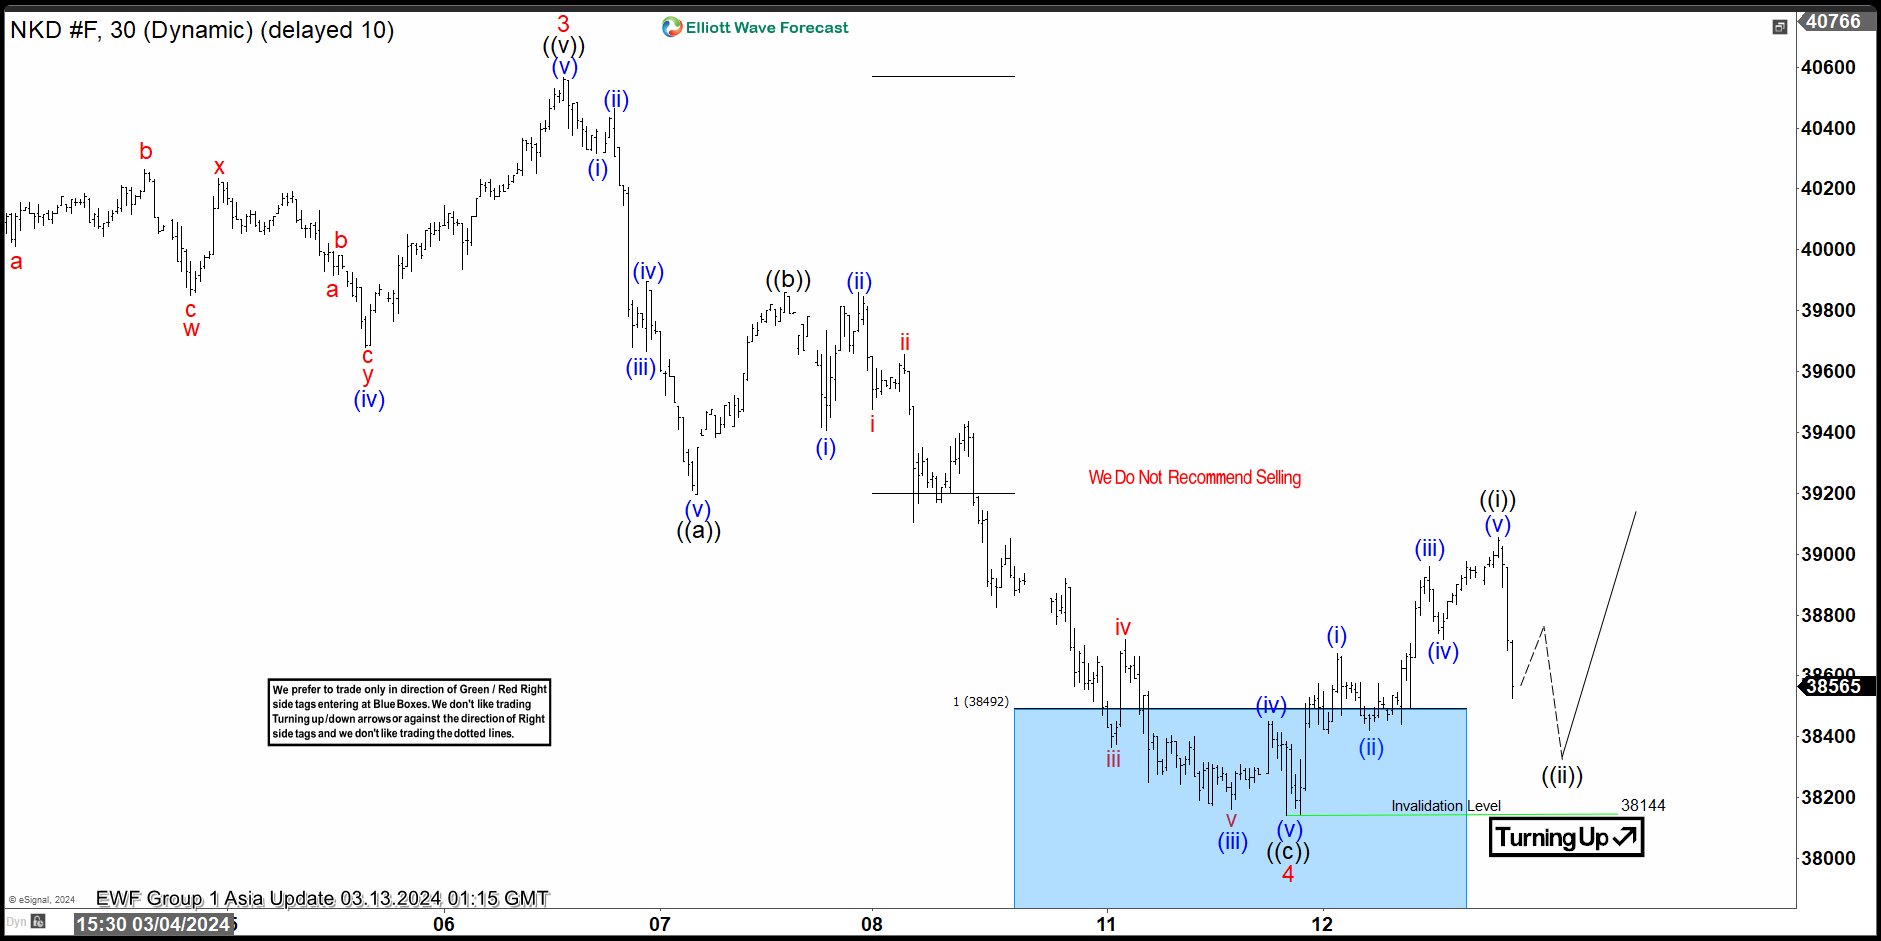
Nikkei NKD_F ended an impulse structure at 40565 high and we called wave 3 and the index started a wave 4 pullback. Down from wave 3, wave (i) ended at 40315 and wave (ii) ended at 40465. Wave (iii) lower ended at 39665. Rally in wave (iv) ended at 39895. The market resumes lower in wave (v) ended 39195 and completed wave ((a)) in higher degree. NKD did a bounce from this levels reaching at 39860 and turning down strongly. At 39860 it ended wave ((b)) correction.
Down from wave ((b)), wave (i) ended at 39405 and wave (ii) ended at 39860. Wave (iii) lower ended at 38160. Rally in wave (iv) ended at 38450. Index resumes lower into the blue box area completing wave (v) at 38140 low. Also completed wave ((c)) and wave 4 in higher degree as a zigzag Elliott Wave structure. Currently, NKD has reacted from the blue box developing an impulse as wave ((i)). As price action stays above 38140 low, we expect to end wave ((ii)) correction and then continuing with the rally or see 3 swings higher at least.
Nikkei (NKD_F) 30 Minutes Elliott Wave Chart
Nikkei (NKD_F) Elliott Wave Video
https://www.youtube.com/watch?v=e7giVP2L89k
Risks for Next Week’s FOMC Meeting Seem Tilted to the Hawkish Side
Markets
US Treasuries sold off yesterday after sticky February US CPI inflation data. Headline inflation accelerated from 0.3% M/M in January to 0.4% M/M with core inflation sticking at that 0.4% M/M pace for a second month running. The Fed’s so-called super-core inflation which zooms in on core services excluding shelter, rose by 0.5% M/M. Although down from a superhot 0.85% in January, that’s still more than double the pre-pandemic pace. Annual paces for topline, core and supercore CPI were 3.2%, 3.8% and 4.3% respectively. Yesterday’s data don’t give Fed Chair Powell the longed-for additional evidence that inflation is on a sustained path to the 2% target. The US Federal Reserve’s data-dependence even risks backfiring in coming months. Base effects make it very likely that headline inflation will return and hold near and above levels of 3.5% Y/Y until at least September. Sticky services inflation and the delayed impact on shelter costs provide a solid “floor” for core CPI. US Treasury yields rose by 5 to 6 bps across the curve yesterday with the belly underperforming the wings. They closed near intraday highs with a tailing $39bn 10-yr Note auction failing to offer some counterweight. The market implied probabilities of a 25 bps rate cut in April and June fell to 15% and 77% respectively. Risks for next week’s FOMC meeting seem tilted to the hawkish side. The dollar initially profited from the interest rate support with EUR/USD sliding from 1.0940 to 1.09. The pair eventually closed unchanged on the back of bullish risk sentiment. Another massive performance by the likes of Nvidia outweighed the inflation scare, pushing major US benchmarks to daily gains of up to 1.54% for Nasdaq.
Japanese bond futures felt some late selling pressure this morning as a wide range of labour unions announced robust pay increases. The Japanese Association of Metal, Machinery and Manufacturing Workers secured an average 5.32%. Rengo, the nation’s biggest union federation, announces first results on Friday. The Japanese yen at USD/JPY 147.70 for now fails to profit further from BoJ normalization bets. Today’s eco calendar is empty apart from a $22bn 30-yr Bond auction. We expect yesterday’s CPI-vibes to remain in play, resulting in an underperformance of US Treasuries and an advantage for the dollar. Especially as more ECB governors, including hawks like ECB Wunsch, center around a June rate cut.
News & Views
The Hungarian forint yesterday weakened to just below EUR/HUF 400. Both political tensions between the government and the central bank and ongoing discussions with the EU on the release of blocked funds are at play. With respect to the former, the Hungarian central bank repeated that new legislation to widen the Supervisory Board’s control will hurt its independence. “While on the surface the current central bank bill is about other tasks, it serves the sole purpose of influencing NBH management's decisions related to basic tasks and other decisions within the scope of NBH independence”. The government indicates that it only serves activities that are unrelated to monetary policy, including the MNB’s investments. On the second subject, a legal Committee of the European Parliament voted to take the European Commission to court as it contests the Commission’s decision in December to release €10.2bn of blocked EU funds. The EP President has the final say whether to proceed with the lawsuit.
The Bank of Spain in its quarterly update upwardly revised its growth outlook. Spanish GDP growth is now only expect to slow from 2.5% in 2023 to 1.9% this year (was 1.6%). This also brings growth more in line with the 2% forecast of the government. The upward revision of Spanish growth contrasts with the ECB last week downwardly revising 2024 EMU growth from 0.8% to 0.6%. The BoS expects 1.9% growth in 2025 and 1.7% growth in 2025. Unemployment is expected to decline further from 12.1% in 2023 to 11.6% this year and to gradually ease further to 11.3% in 2026. Inflation is set to decline over the projection horizon, falling from an average of 3.4% in 2023 to 2.7%, 1.9% and 1.7%, in 2024, 2025 and 2026. The main factors behind the revision this year are lower energy prices and the partial extension of some measures to cope with the inflationary episode. The BoS also cited the contribution of foreign workers to the labour market and European relief funds as factors supporting Spanish economic growth.