Sample Category Title
USD/CHF Daily Outlook
Daily Pivots: (S1) 0.8773; (P) 0.8782; (R1) 0.8799; More....
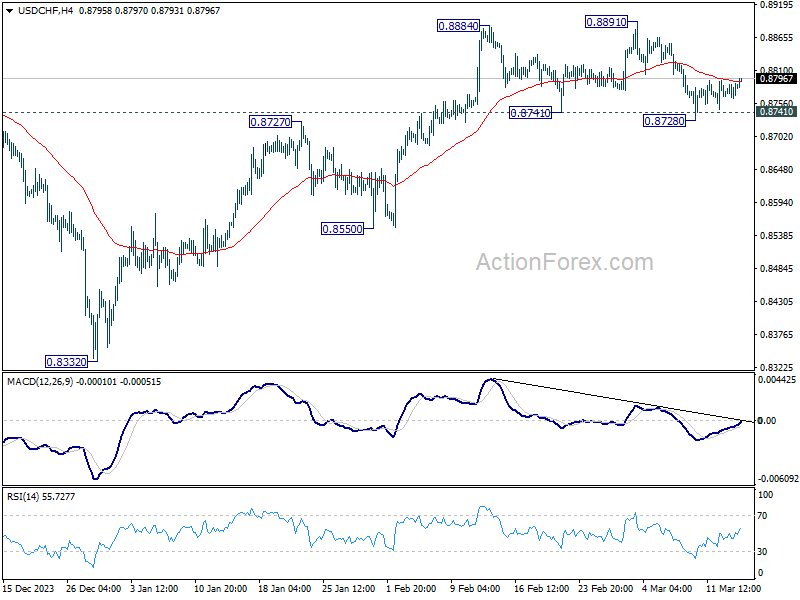
No change in USD/CHF's outlook and intraday bias stays neutral. On the downside, sustained break of 0.8741 will argue that the whole rebound from 0.8332 might have completed, and bring deeper fall to 0.8550 support. Nevertheless, strong bounce from current level will retain near term bullishness. Further break of 0.8891 will resume the rise from 0.8332.
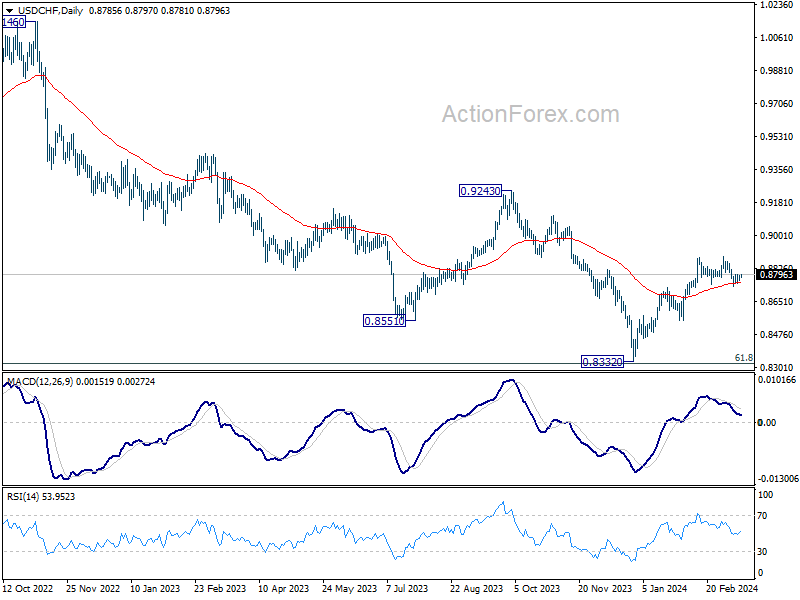
In the bigger picture, price actions from 0.8332 medium term bottom as seen as developing into a corrective pattern to the down trend from 1.0146 (2022 high). Further rise would be seen as long as 0.8555 support holds. But upside should be limited by 0.9243 resistance, at least on first attempt.
GBP/USD Daily Outlook
Daily Pivots: (S1) 1.2778; (P) 1.2794; (R1) 1.2814; More...
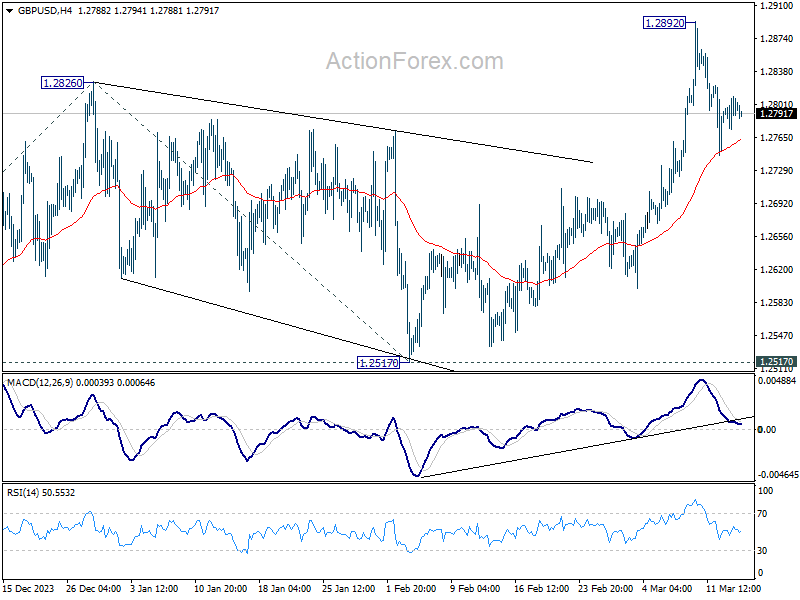
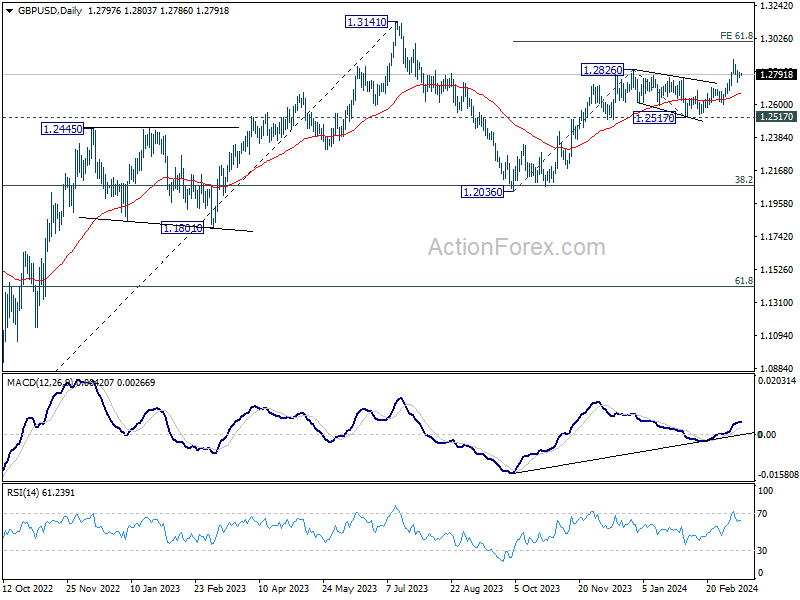
Intraday bias in GBP/USD remains neutral at this point. Further rally will remain in favor as long as 55 4H EMA (now at 1.2762) holds. On the upside, above 1.2892 will resume larger rise from 1.2063 and target 61.8% projection of 1.2036 to 1.2826 from 1.2517 at 1.3005. However, sustained break of 55 4H EMA will bring deeper fall back towards 55 D EMA (now at 1.2672), and possibly further to 1.2517 structural support.
In the bigger picture, price actions from 1.3141 medium term top are seen as a corrective pattern to up trend from 1.0351 (2022 low). Rise from 1.2036 is seen as the second leg, which is still in progress. But upside should be limited by 1.3141 to bring the third leg of the pattern. Meanwhile, break of 1.2517 support will argue that the third leg has already started for 38.2% retracement of 1.0351 (2022 low) to 1.3141 at 1.2075 again.
EUR/USD Daily Outlook
Daily Pivots: (S1) 1.0924; (P) 1.0944; (R1) 1.0968; More...
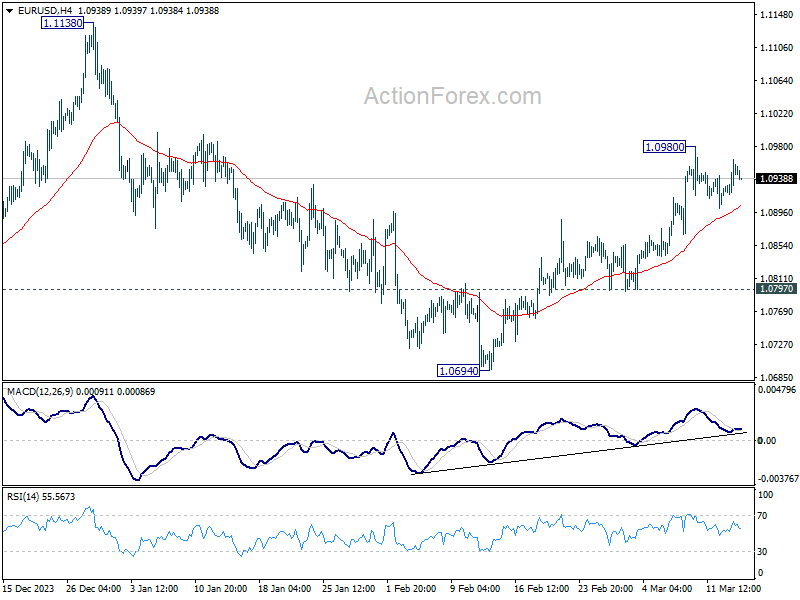
EUR/USD is still capped below 1.0980 resistance despite current recovery. Intraday bias remains neutral first. Further rise is in favor as long as 55 4H EMA (now at 1.0904) holds. Above 1.0980 will resume the rally from 1.0694 to retest 1.1138 high. However, sustained break of the EMA will turn bias to the downside for 1.0797 support instead.
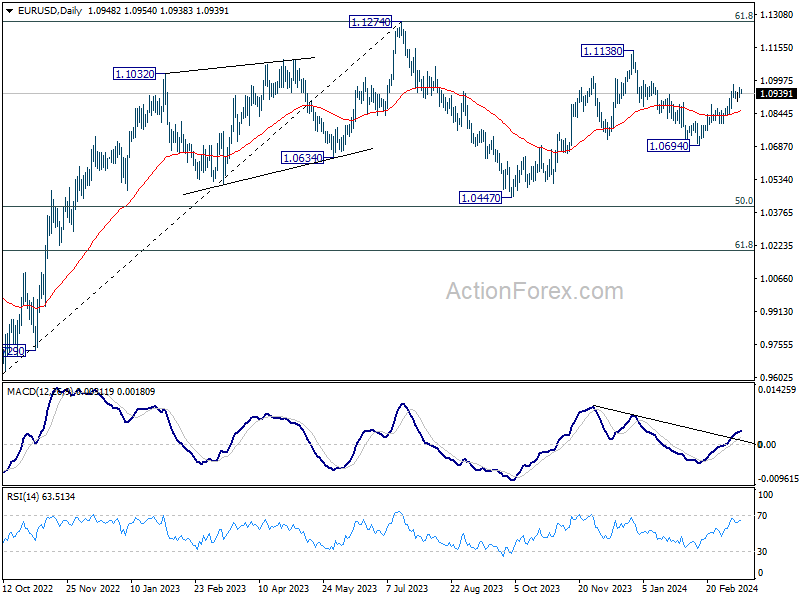
In the bigger picture, price actions from 1.1274 are viewed as a corrective pattern to rise from 0.9534 (2022 low). Rise from 1.0447 is seen as the second leg. While further rally could cannot be ruled out, upside should be limited by 1.1274 to bring the third leg of the pattern. Meanwhile, sustained break of 1.0694 support will argue that the third leg has already started for 1.0447 and possibly below.
Forex Consolidation, Metals Surge, US Retail Sales and PPI Eyed
Overall, the forex markets are still stuck in consolidative trading in Asian session, with expectations set for a subdued European session given the light economic calendar. However, anticipation builds for volatility spikes with releases of US retail sales and PPI later today. For now, Canadian Dollar is the stronger one for the week, followed by Euro and then Dollar. Yen is the weaker one, followed by Sterling and Kiwi. But overall, all major pairs and crosses are bounded inside last week's range.
In contrast, the commodities market, particularly industrial metals, showcases more dynamic price actions. Copper spiked to its highest level in nearly a year, fueled by considerations of production cuts among Chinese smelters. Silver's surge this week, driven by optimism surrounding the global economic recovery, contrasts with Gold's current stagnation. After reaching a record high last week, Gold appears to be in a consolidation phase, taking a momentary pause in the long term uptrend.
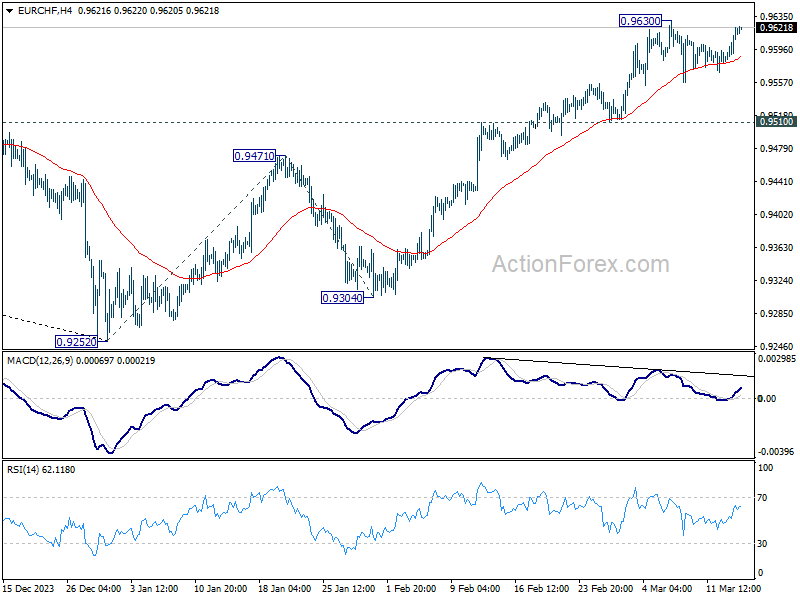
Technically, EUR/CHF might have finished the near term consolidation from 0.9630 after drawing support from 55 4H EMA. Immediate focus is now on 0.9630 resistance. Firm break there will resume whole rise from 0.9252 and target 161.8% projection of 0.9252 to 0.9471 from 0.9304 at 0.9658 next. The question is whether the upside breakout in EUR/CHF would be accompanied by break of 1.0980 resistance in EUR/USD or 0.8891 resistance in USD/CHF. This interplay between these three pairs merits close observation.
In Asia, at the time of writing, Nikkei is up 0.26%. Hong Kong HSI is down -0.78%. China Shanghai SSE is down -0.09%. Singapore Strait Times is up 0.71%. Japan 10-year JGB yield is up 0.014 at 0.775. Overnight, DOW rose 0.10%. S&P 500 fell -0.19%. NASDAQ fell -0.54%. 10-year yield rose 0.037 to 4.192.
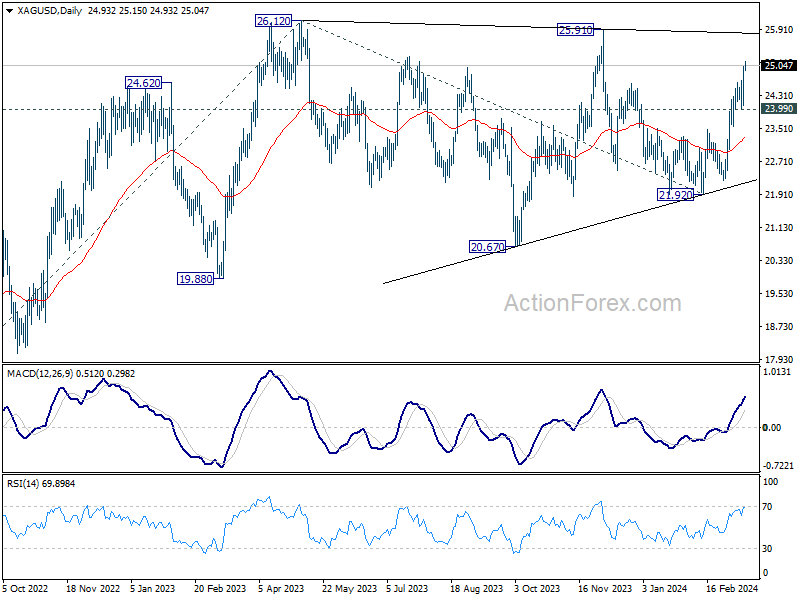
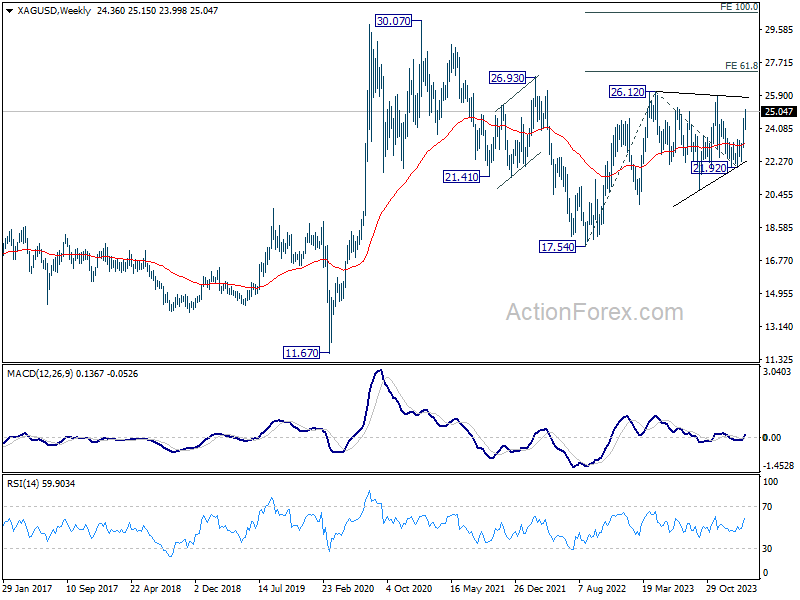
Silver targeting key resistance zone at 26 as momentum picks up
While Gold's rally stalled after hitting new record high last week, Silver is picking up momentum. Given that Silver has been clearly lagging Gold this year, there is room for Silver to catch up and outperform in Q2.
Fundamentally, both Gold and Silver as precious metal would benefit from policy loosening of major global central banks. But as additionally as an industrial metal, Silver could be benefited more with global growth and industrial demands pick up.
Yet, technically, Silver has to overcome key resistance level around 26 first. For now, near term outlook will stay bullish as long as 23.99 support holds. It's possible that consolidation pattern from 26.12 has completed with three waves to 21.92 already.
Decisive break of 26.12 will confirm resumption of whole rise from 17.54 (2022 low). In this case, the near medium term target will be 61.8% projection of 17.54 to 26.12 from 21.92 at 27.22. Firm break there will pave the way for new record high above 30 later in the year.
Nevertheless, rejection by 25.91/26.12 resistance zone, or break of 23.99 support, will delay the bullish case and extend the consolidation from 26.12 with another falling leg instead.
Ethereum's momentum wanes, Bitcoin's consolidation due soon
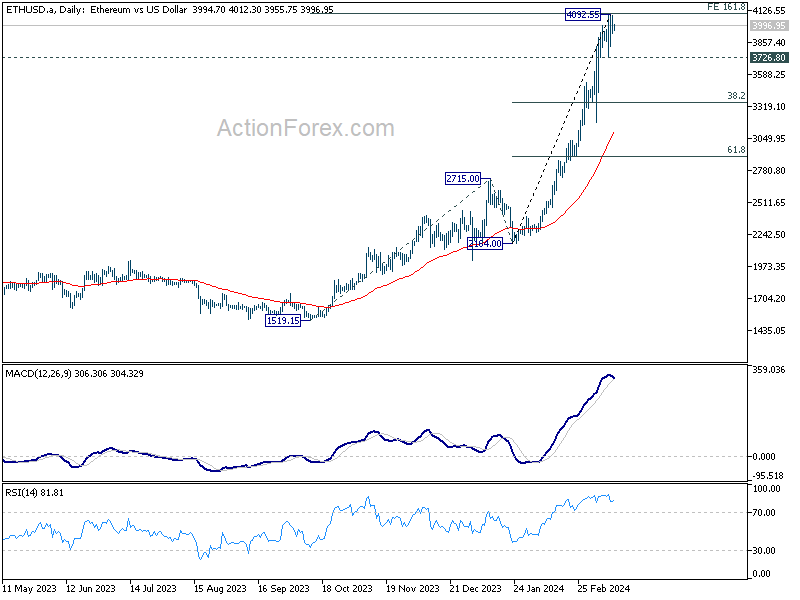
Ethereum's rally appears to be losing momentum as seen in D MACD, after accelerating to as high as 4092.5. Overbought consolidation in D RSI is probably limiting it at 161.8% projection of 1519.1 to 2715.0 from 2164.0 at 4098.6. Break of 3726.8 support will confirm short term topping, and bring correction to 38.2% retracement of 2164.0 to 4092.5 at 3355.8, and then set the range for sideway consolidations.
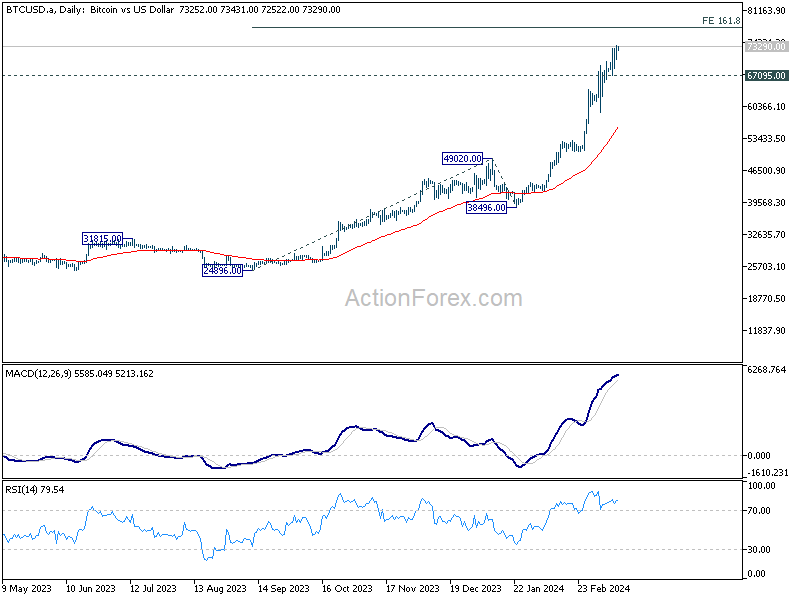
As for Bitcoin, there might still be room to extend the record run, but upside potential is limited for the near term, as some consolidations should be due after the strong rally. Upside should be limited by 161.8% projection of 24896 to 49020 from 38496 at 77528. Meanwhile, break of 67095 support will indicate that a short term top is already formed, and deeper pull back could be seen next to start a consolidation phase.
Looking ahead
Swiss PPI is the only feature in Euroepan session. Later in the day, US will release retail sales, PPI and jobless claims. Canada will release manufacturing sales.
EUR/USD Daily Outlook
Daily Pivots: (S1) 1.0924; (P) 1.0944; (R1) 1.0968; More...
EUR/USD is still capped below 1.0980 resistance despite current recovery. Intraday bias remains neutral first. Further rise is in favor as long as 55 4H EMA (now at 1.0904) holds. Above 1.0980 will resume the rally from 1.0694 to retest 1.1138 high. However, sustained break of the EMA will turn bias to the downside for 1.0797 support instead.
In the bigger picture, price actions from 1.1274 are viewed as a corrective pattern to rise from 0.9534 (2022 low). Rise from 1.0447 is seen as the second leg. While further rally could cannot be ruled out, upside should be limited by 1.1274 to bring the third leg of the pattern. Meanwhile, sustained break of 1.0694 support will argue that the third leg has already started for 1.0447 and possibly below.
Economic Indicators Update
| GMT | Ccy | Events | Actual | Forecast | Previous | Revised |
|---|---|---|---|---|---|---|
| 00:01 | GBP | RICS Housing Price Balance Feb | -10% | -10% | -18% | |
| 07:30 | CHF | PPI M/M Feb | 0.20% | -0.50% | ||
| 07:30 | CHF | PPI Y/Y Feb | -2.30% | |||
| 12:30 | CAD | Manufacturing Sales M/M Jan | 0.30% | -0.70% | ||
| 12:30 | USD | Retail Sales M/M Feb | 0.50% | -0.80% | ||
| 12:30 | USD | Retail Sales ex Autos M/M Feb | 0.40% | -0.60% | ||
| 12:30 | USD | PPI M/M Feb | 0.30% | 0.30% | ||
| 12:30 | USD | PPI Y/Y Feb | 1.10% | 0.90% | ||
| 12:30 | USD | PPI Core M/M Feb | 0.20% | 0.50% | ||
| 12:30 | USD | PPI Core Y/Y Feb | 2.00% | 2.00% | ||
| 12:30 | USD | Initial Jobless Claims (Mar 8) | 218K | 217K | ||
| 14:00 | USD | Business Inventories Jan | 0.30% | 0.40% | ||
| 14:30 | USD | Natural Gas Storage | -3B | -40B |
Technical Outlook and Review
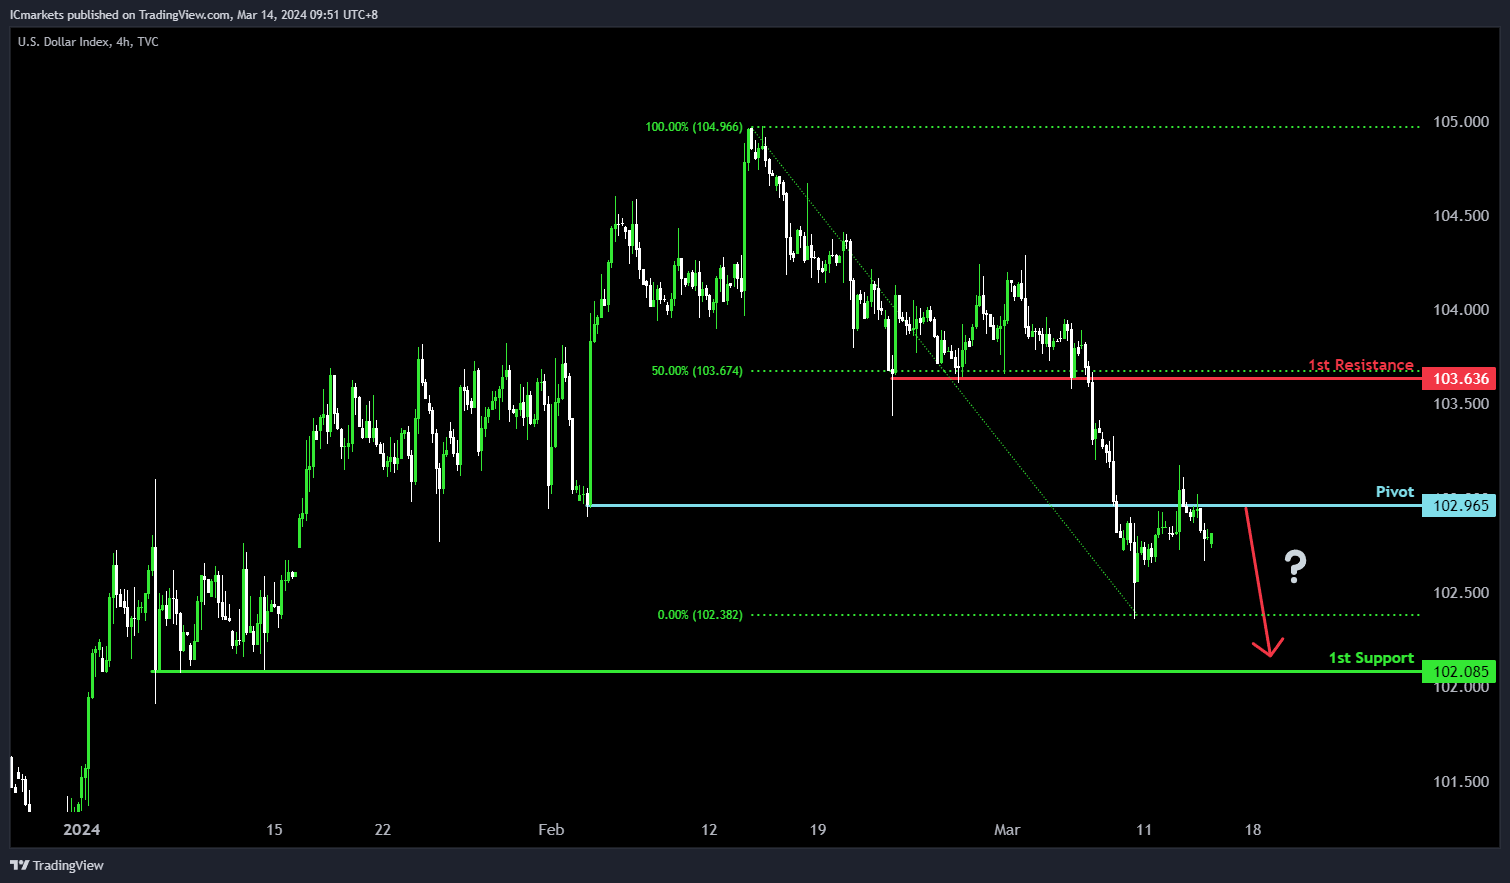
DXY:
For DXY, the potential direction is bearish, aligning with the overall momentum of the chart. There’s a likelihood of a bearish continuation towards the 1st support level. The pivot at 103.44 acts as a significant overlap resistance, indicating a potential barrier where selling pressure may intensify.
On the support side, the 1st support at 102.08 is identified as a multi-swing low support, suggesting its significance as a level where buying interest has historically emerged. Conversely, the 1st resistance at 103.63 serves as a pullback resistance, potentially limiting further upward movement in the price, particularly reinforced by the 50% Fibonacci Retracement level.
EUR/USD:
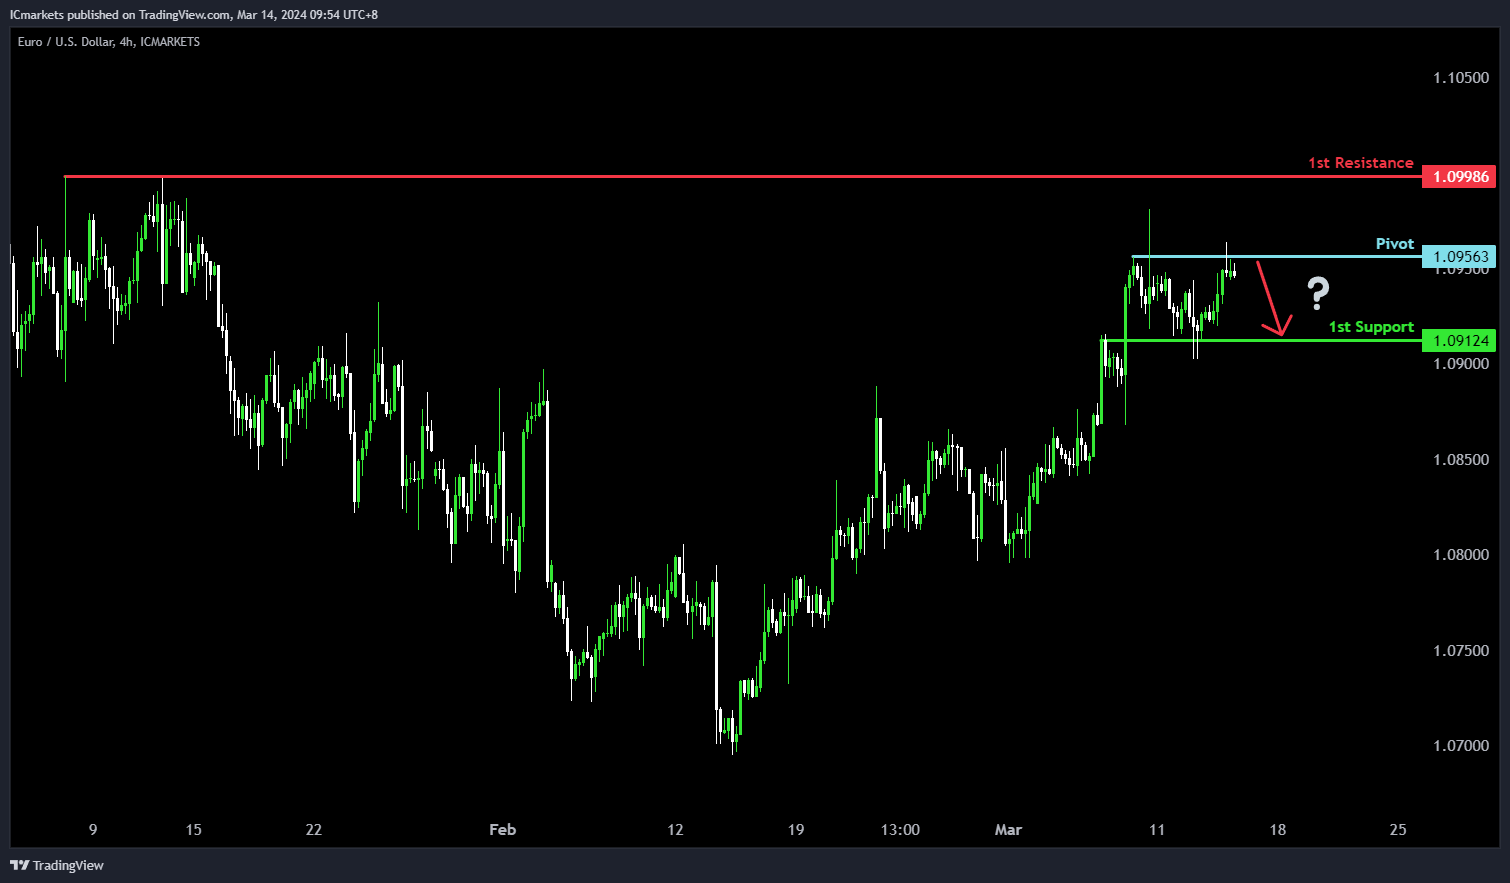
For EUR/USD, the potential direction is bearish, despite the overall bullish momentum of the chart. There’s a possibility of a bearish reaction off the pivot level, leading to a drop towards the 1st support.
The pivot at 1.0956 is significant as multi-swing high resistance, suggesting a potential barrier where selling pressure might increase. The 1st support at 1.0912, on the other hand, is identified as an overlap support, indicating its historical significance as a level where buying interest has emerged.
Conversely, the 1st resistance at 1.0998 serves as swing high resistance, potentially limiting further upward movement in the price
EUR/JPY:
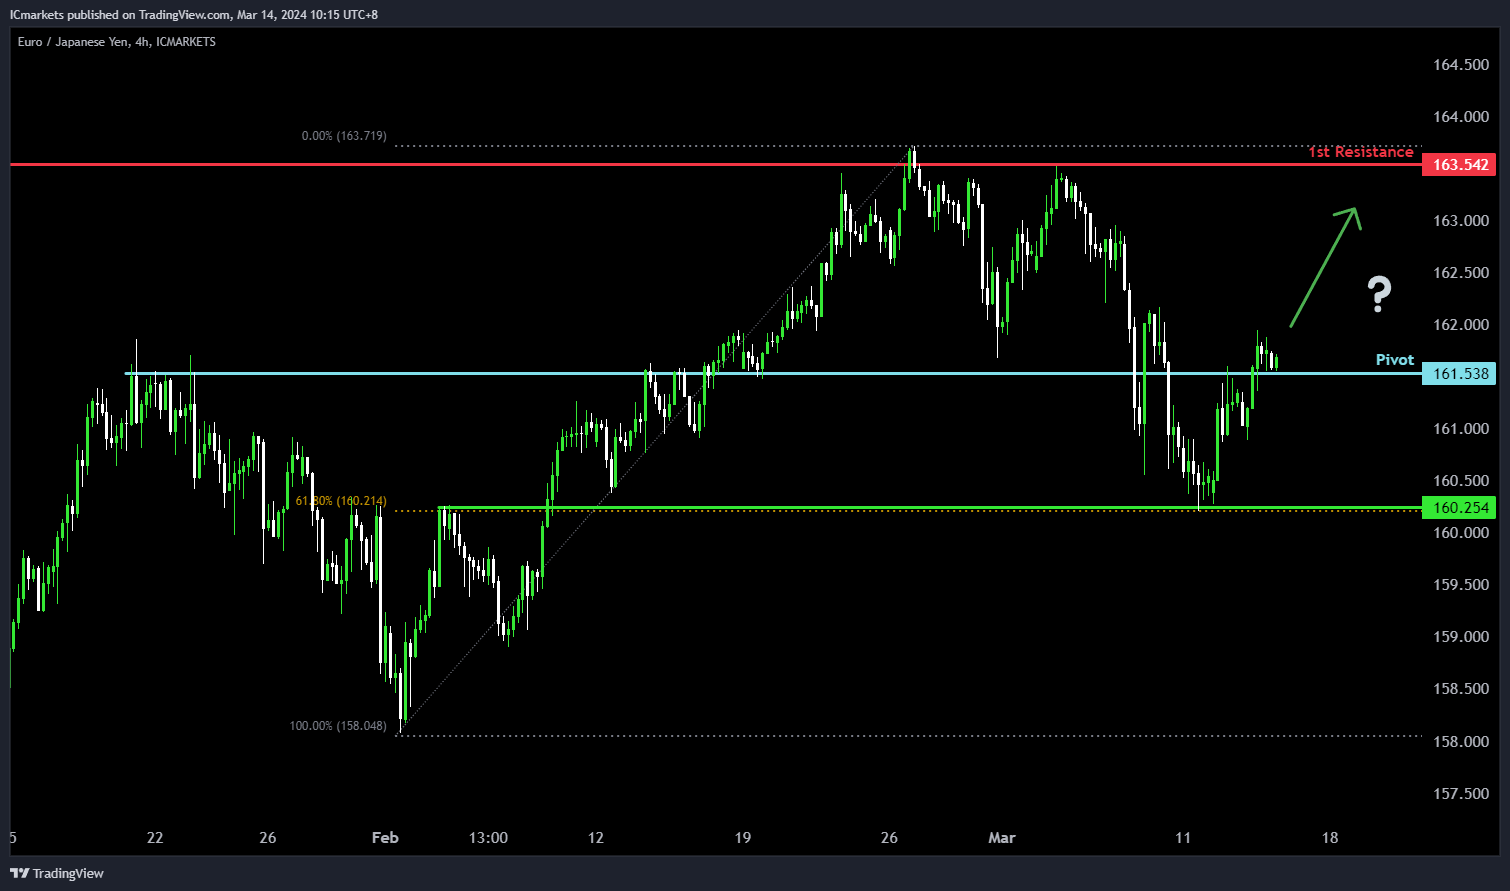
The EUR/JPY chart suggests a potential bullish direction despite the prevailing bearish momentum. Several factors contribute to this analysis.
The pivot level at 161.538 is notable as it coincides with pullback support, indicating a significant historical level where buying interest may emerge.
Additionally, the 1st support level at 160.254 aligns with an overlap support and the 61.80% Fibonacci Retracement level, further reinforcing its significance as a potential area of support.
On the resistance side, the 1st resistance level at 163.542 is identified as a swing high resistance, representing a historical barrier to upward movement.
EUR/GBP:
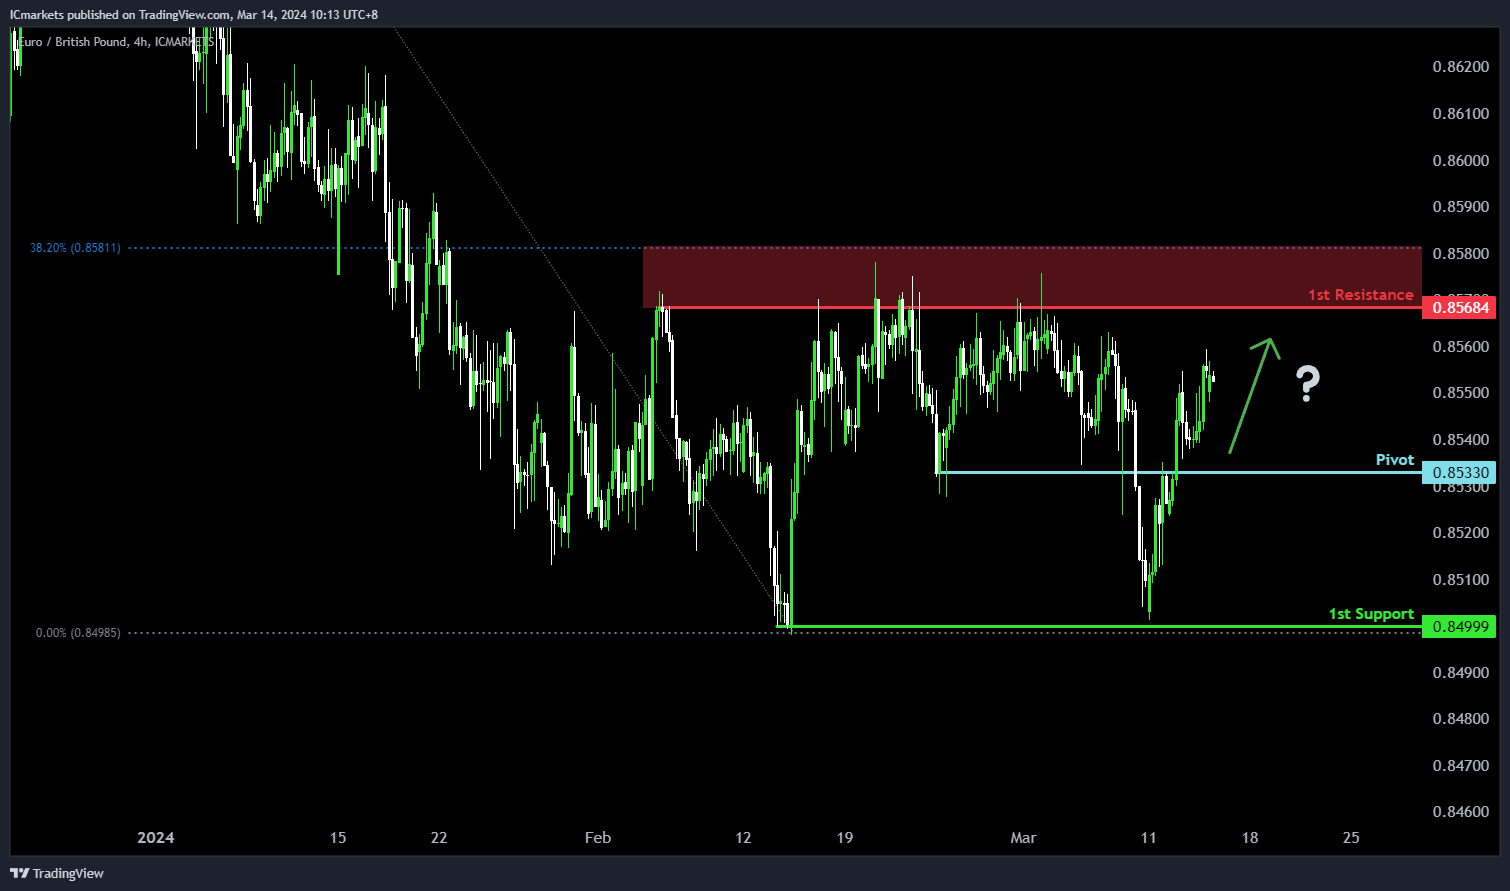
The EUR/GBP chart suggests a potential bullish direction despite the prevailing bearish momentum. Several factors contribute to this analysis.
The pivot level at 0.85330 is significant as it serves as pullback support, indicating a historical level where buying interest may emerge.
Furthermore, the 1st support level at 0.84999 aligns with a swing low support, further reinforcing its significance as a potential area where buyers might enter the market.
On the resistance side, the 1st resistance level at 0.85684 is identified as a swing high resistance and coincides with the 38.20% Fibonacci Retracement level, suggesting a historical barrier to upward movement.
GBP/USD:
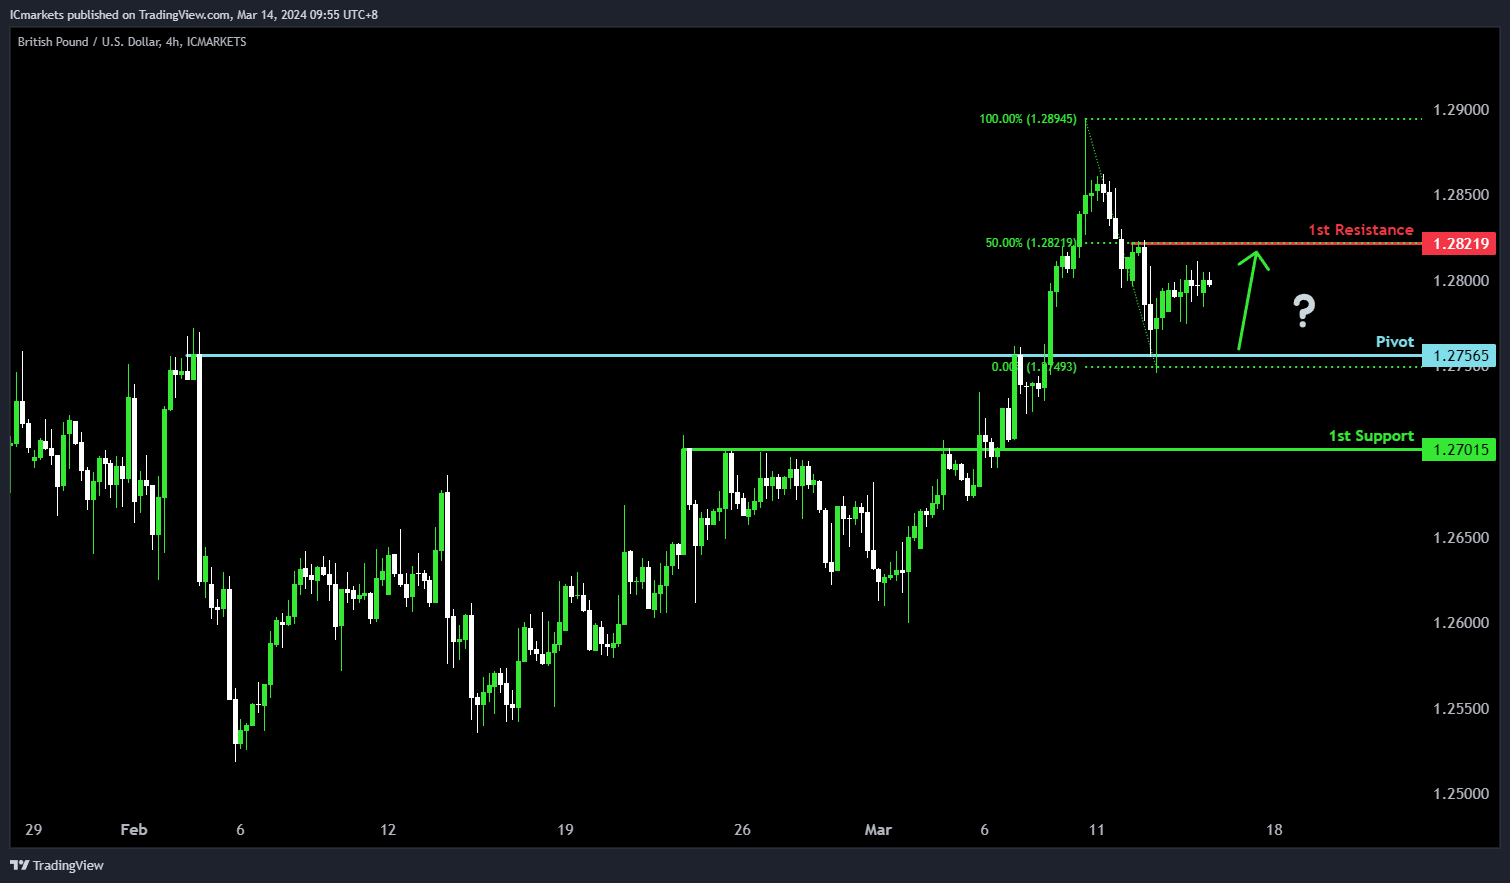
For GBP/USD, the potential direction is bullish, aligning with the overall bullish momentum of the chart. There’s a likelihood of a bullish bounce off the pivot level, signaling a move towards the 1st resistance.
The pivot at 1.2756 acts as an overlap support, suggesting its significance as a level where buyers may intervene to support the price. Additionally, the 1st support at 1.2701 reinforces this pattern as another overlap support, further indicating its historical importance.
On the resistance side, the 1st resistance at 1.2821 is identified as swing high resistance, potentially impeding further upward movement. The presence of the 50% Fibonacci Retracement adds to its significance as a potential barrier where selling pressure could increase.
GBP/JPY:
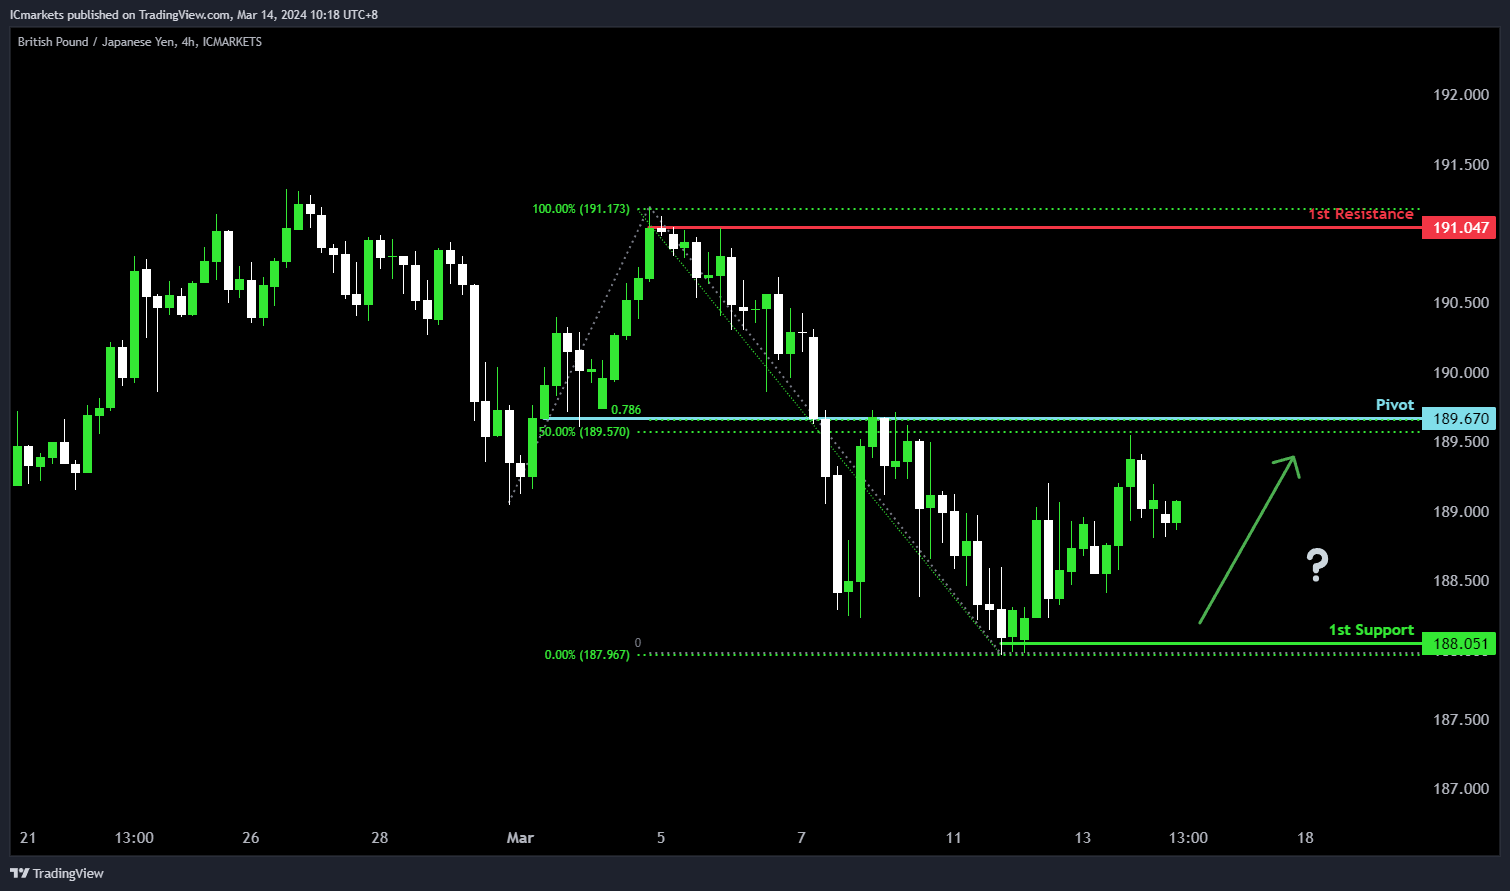
The GBP/JPY chart suggests a potential bullish direction despite the prevailing bearish momentum. Several factors contribute to this analysis.
The pivot level at 189.670 is significant as it coincides with pullback resistance, the 50% Fibonacci Retracement level, and the 78.60% Fibonacci Projection. This convergence of indicators highlights a crucial area where price might find resistance but could also serve as a potential turning point for a bullish reversal.
Additionally, the 1st support level at 188.051 corresponds to a swing low support, indicating historical buying interest in this region.
On the resistance side, the 1st resistance level at 191.047 is identified as a swing high resistance, representing a historical barrier to upward movement.
USD/CHF:
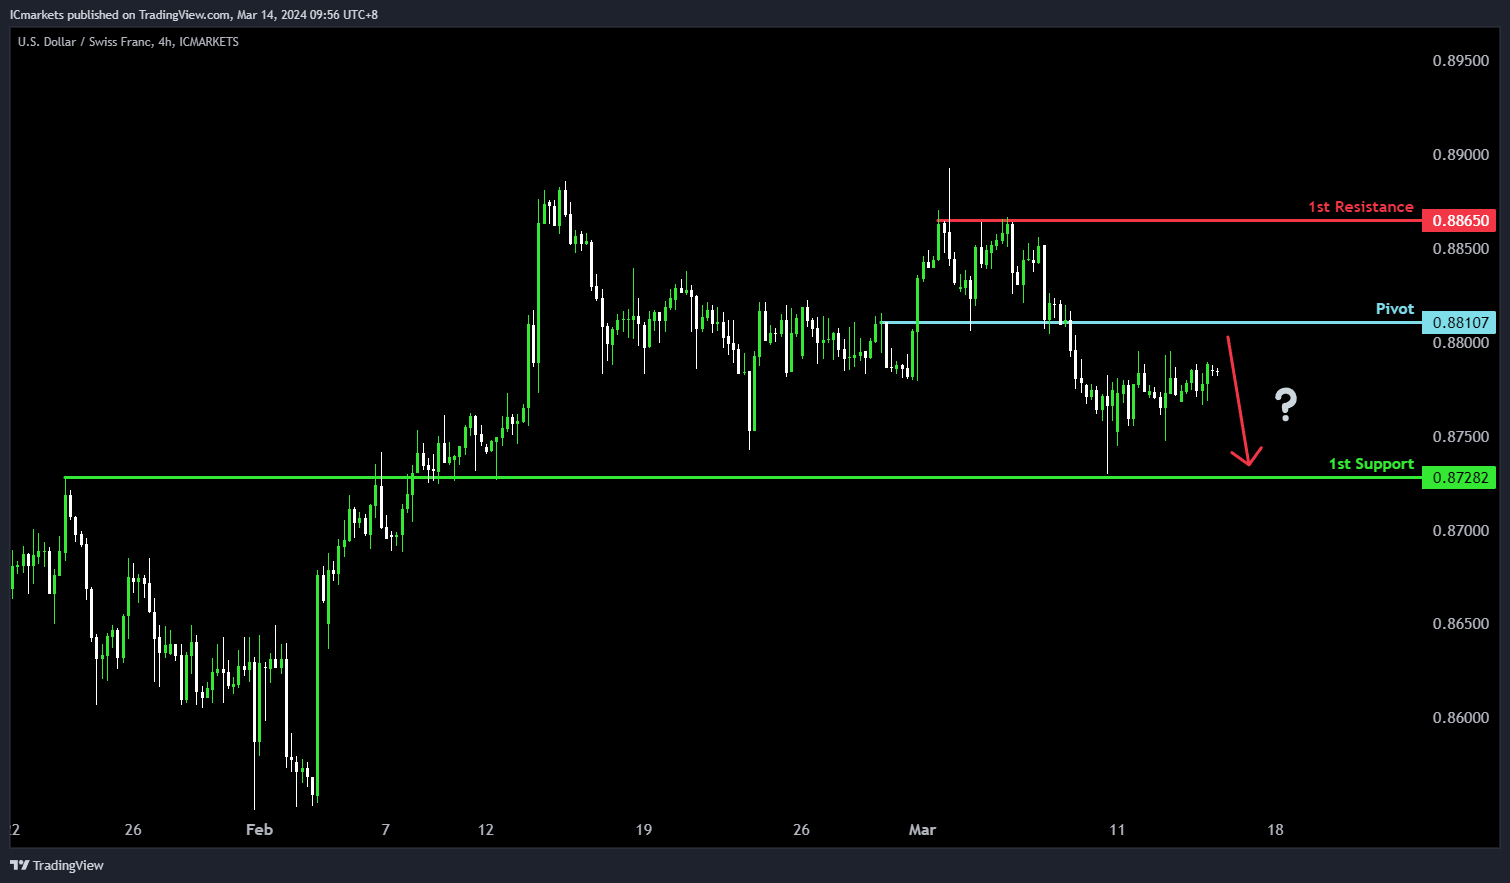
For USD/CHF, the potential direction is bearish, aligning with the overall bearish momentum of the chart. There’s a possibility of a bearish reaction off the pivot level, leading to a drop towards the 1st support.
The pivot at 0.8810 serves as a point of pullback resistance, indicating its significance as a level where selling pressure may increase. In contrast, the 1st support at 0.8728 acts as an overlap support, suggesting historical buying interest in that area.
On the resistance side, the 1st resistance at 0.8865 is identified as multi-swing high resistance, potentially hindering further upward movement.
USD/JPY:
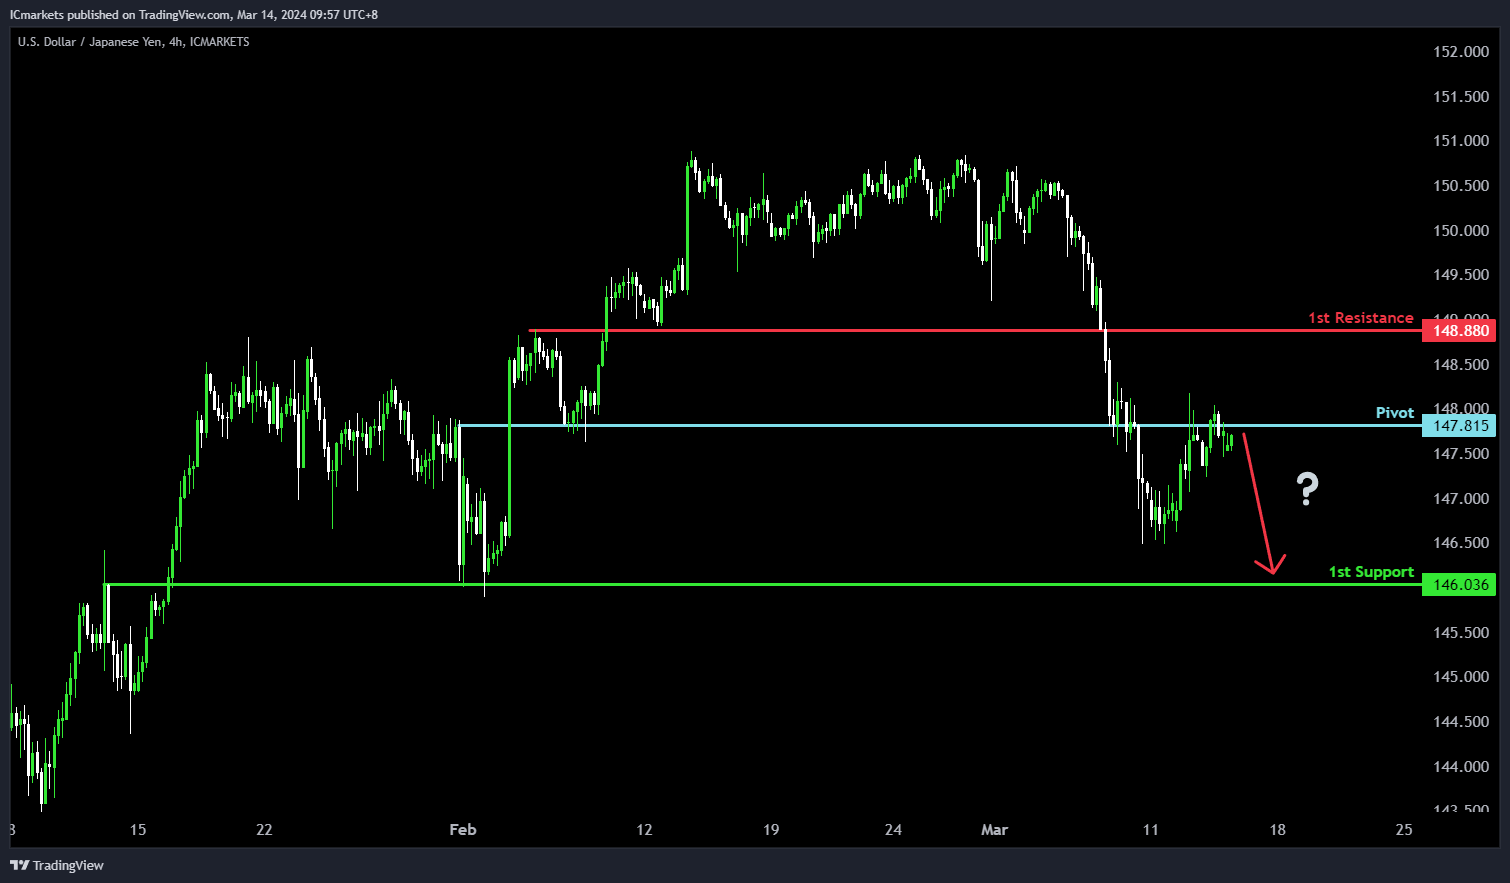
For USD/JPY, the potential direction is bearish, reflecting the overall bearish momentum of the chart. There’s a likelihood of a bearish reaction off the pivot level, leading to a decline towards the 1st support.
The pivot at 147.81 acts as an overlap resistance, indicating its historical significance as a level where selling pressure may intensify. Conversely, the 1st support at 146.03 serves as an overlap support, suggesting a historical area where buying interest has emerged.
On the resistance side, the 1st resistance at 148.88 is identified as a pullback resistance, potentially limiting further upward movement
USD/CAD:
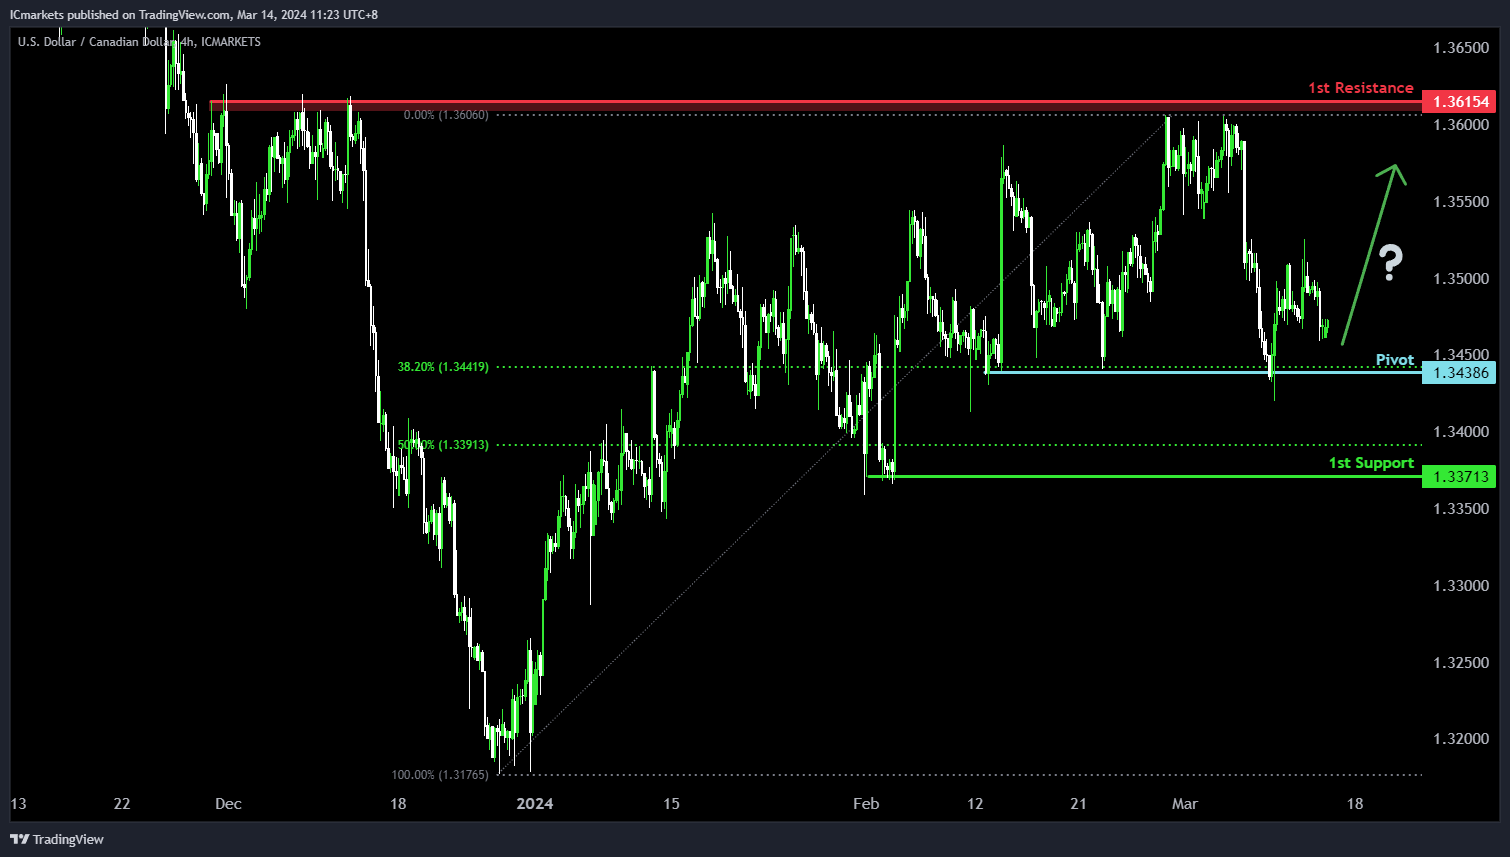
The USD/CAD chart currently demonstrates a neutral bias. In this context, there is a potential scenario for price to fluctuate between the pivot and the 1st resistance.
The pivot level at 1.3438 is identified as a pullback support that aligns with the 38.20% Fibonacci Retracement level where price could potentially bounce off to climb higher. Higher up, the 1st resistance level at 1.3615 is noted as a pullback resistance, further highlighting its importance as a potential resistance zone.
To the downside, the 1st support level at 1.3371 is marked as a pullback support that aligns close to the 50.00% Fibonacci Retracement level, reinforcing its significance as a key support level.
AUD/USD:
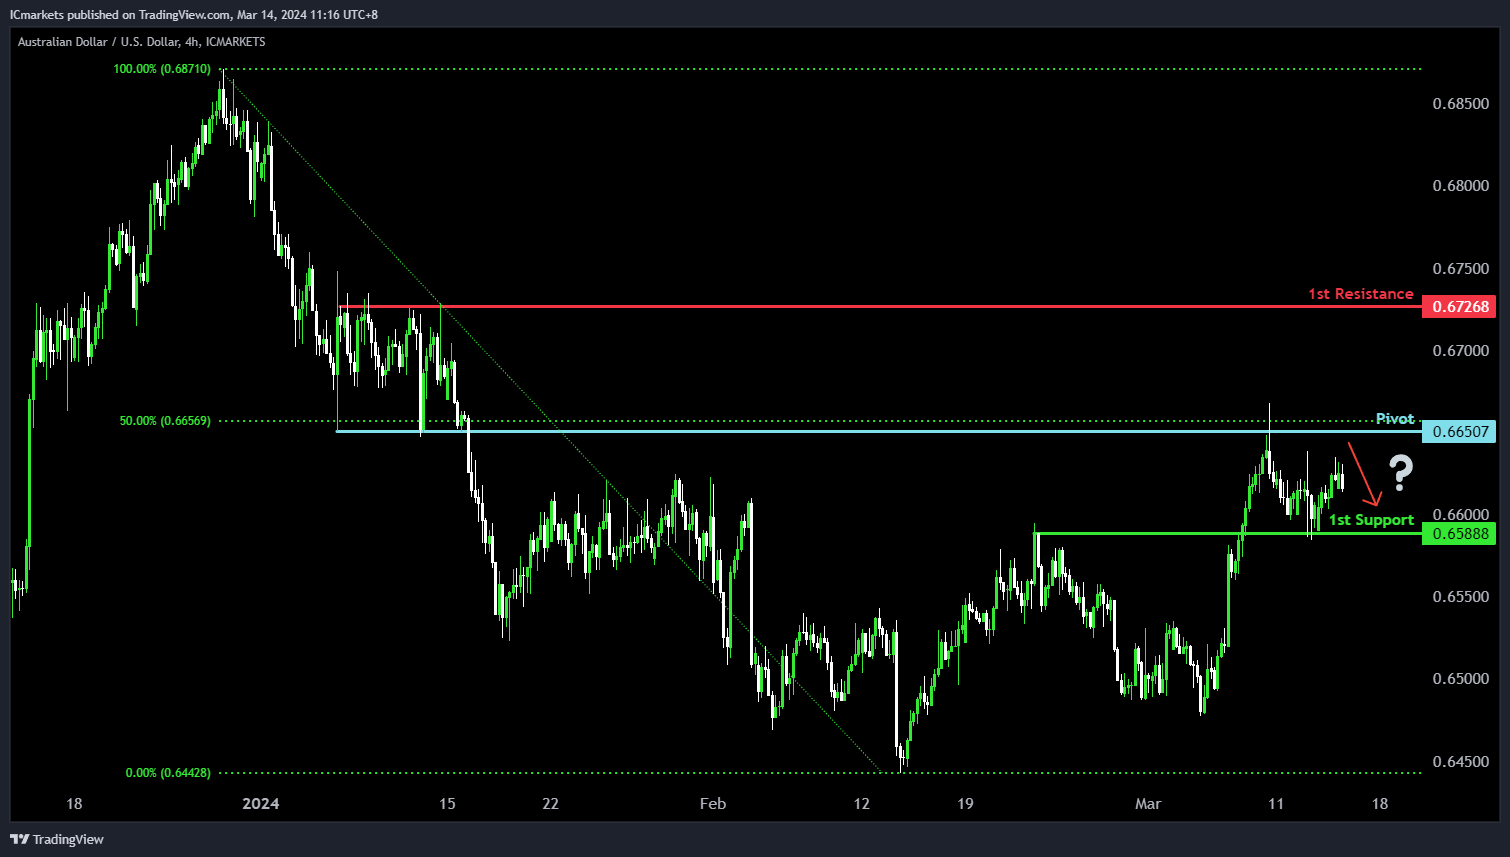
The AUD/USD chart currently demonstrates a neutral bias. In this context, there is a potential scenario for price to fluctuate between the pivot and the 1st support.
The pivot level at 0.6650 is identified as an overlap resistance that aligns with the 50.00% Fibonacci Retracement level where price could potentially reverse from to drop lower. The 1st support level at 0.6588 is marked as an overlap support, reinforcing its significance as a key support level.
On the resistance side, the 1st resistance level at 0.6726 is noted as a pullback resistance, potentially limiting any further upward movement.
NZD/USD
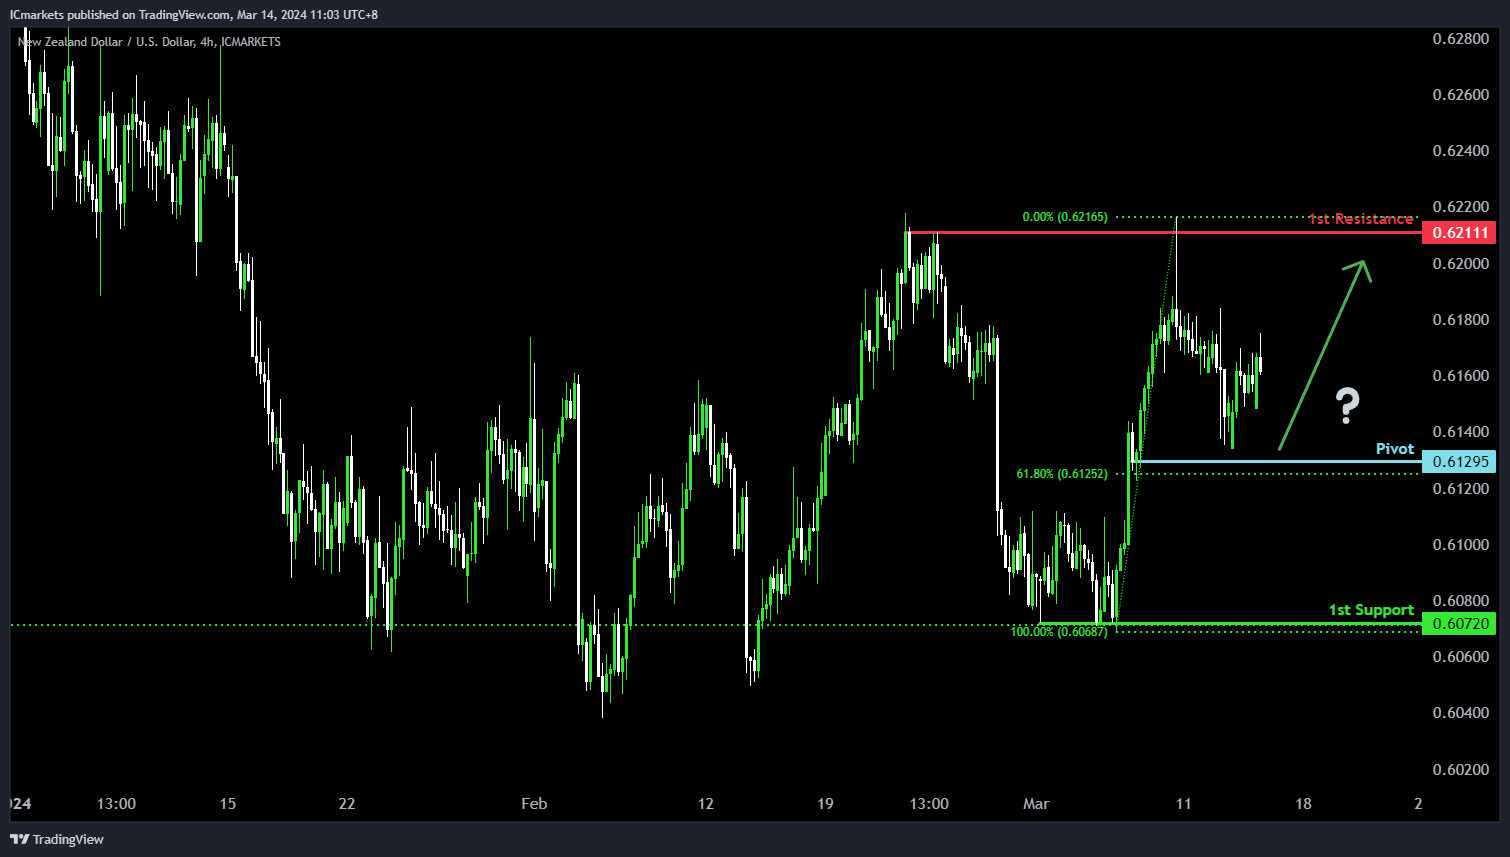
The NZD/USD chart currently demonstrates a neutral bias. In this context, there is a potential scenario for price to fluctuate between the pivot and the 1st resistance.
The pivot level at 0.6129 is identified as a pullback support that aligns close to the 61.80% Fibonacci Retracement level where price could potentially reverse from to climb higher. The 1st resistance level at 0.6211 is identified as a multi-swing-high resistance, potentially limiting any further upward movement.
On the support side, the 1st support level at 0.6072 is marked as a pullback support, reinforcing its significance as a key support level.
DJ30:
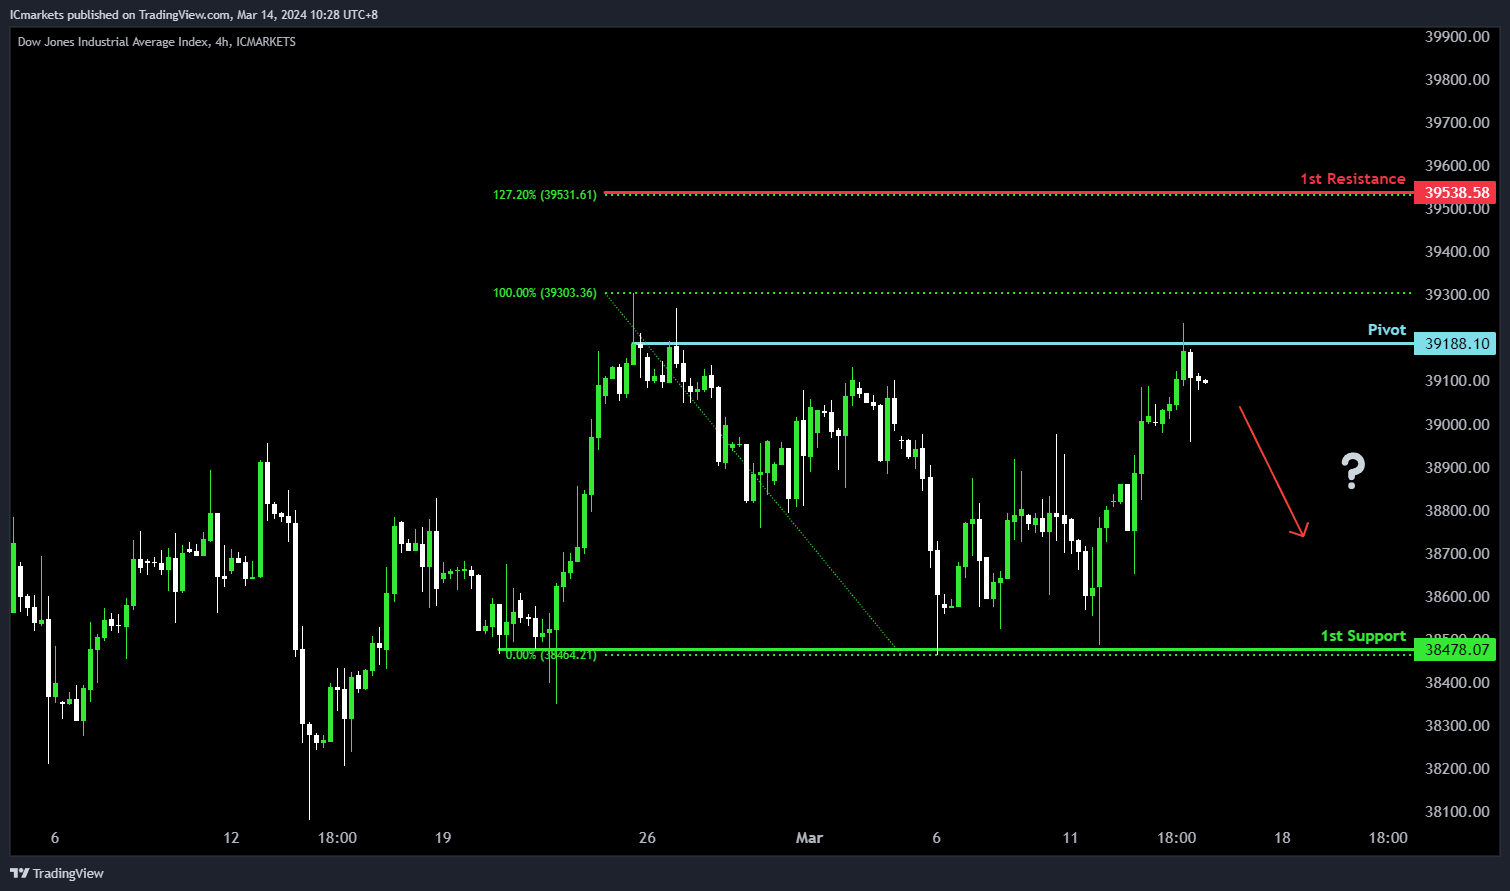
The DJ30 chart currently indicates a potential bearish direction, despite the prevailing bullish momentum. Several factors contribute to this analysis.
The pivot level at 39178.61 is significant as it serves as a swing high resistance, suggesting a historical level where selling pressure may emerge.
Furthermore, the 1st support level at 38478.07 aligns with a swing low support, reinforcing its significance as a potential area where buyers might step in.
On the resistance side, the 1st resistance level at 39538.58 is identified as a significant level, marked by the 127.20% Fibonacci Extension, indicating a potential barrier to further bullish movement.
GER40:
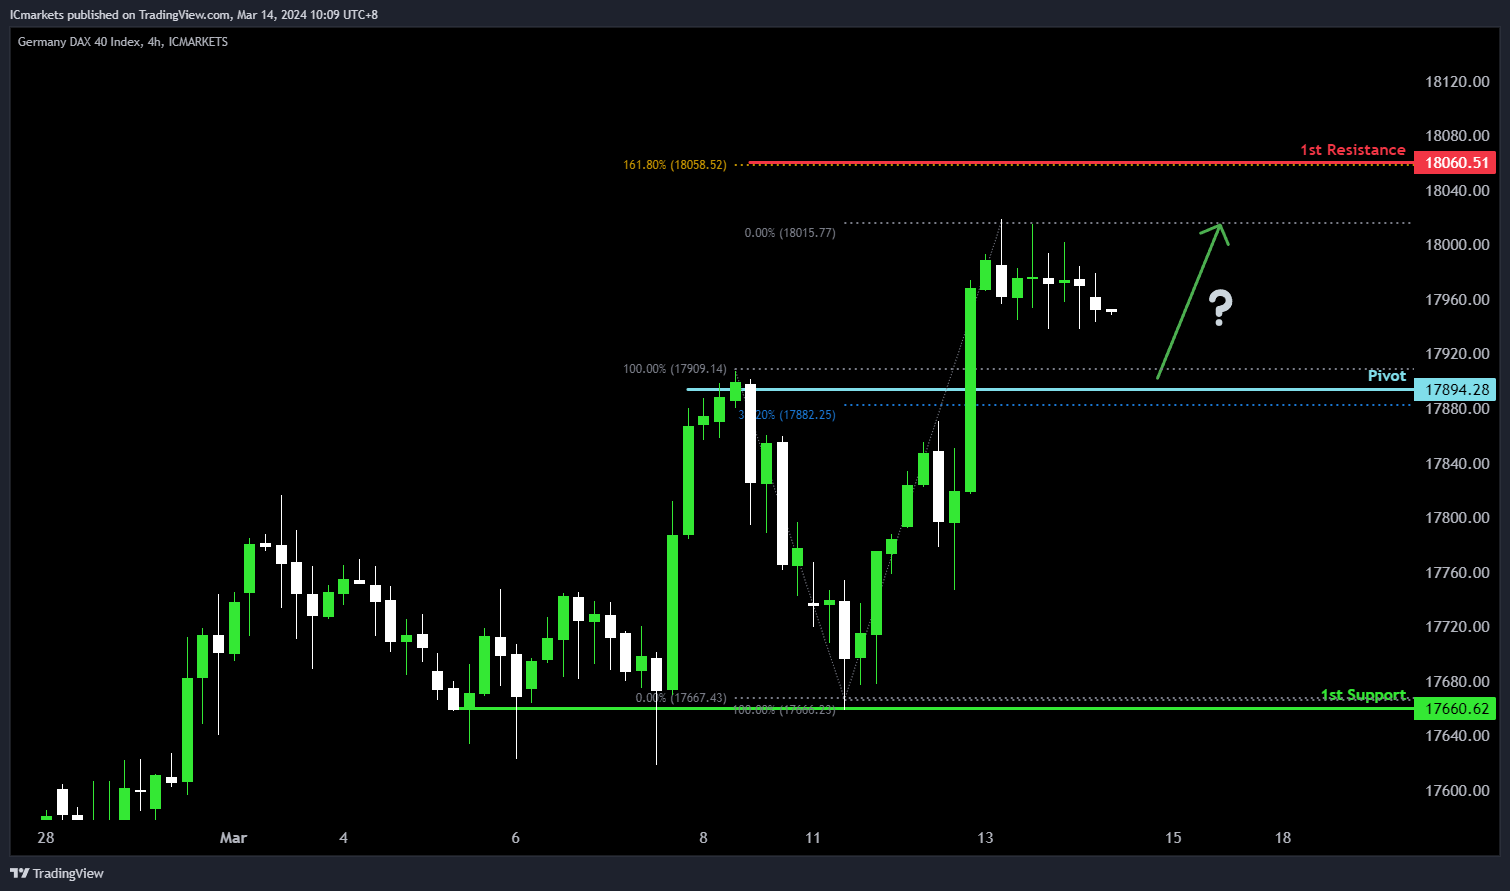
The GER40 chart indicates a potential bullish direction, aligning with the overall bullish momentum. Several factors contribute to this analysis.
The pivot level at 17894.28 serves as a pullback support and coincides with the 38.20% Fibonacci Retracement, indicating a significant historical level where buying interest may emerge.
Furthermore, the 1st support level at 17660.62 aligns with a swing low support, reinforcing its significance as a potential area where buyers might enter the market.
On the resistance side, the 1st resistance level at 18060.51 is identified as significant, marked by the 161.80% Fibonacci Extension, suggesting a potential barrier to further bullish movement.
US500:
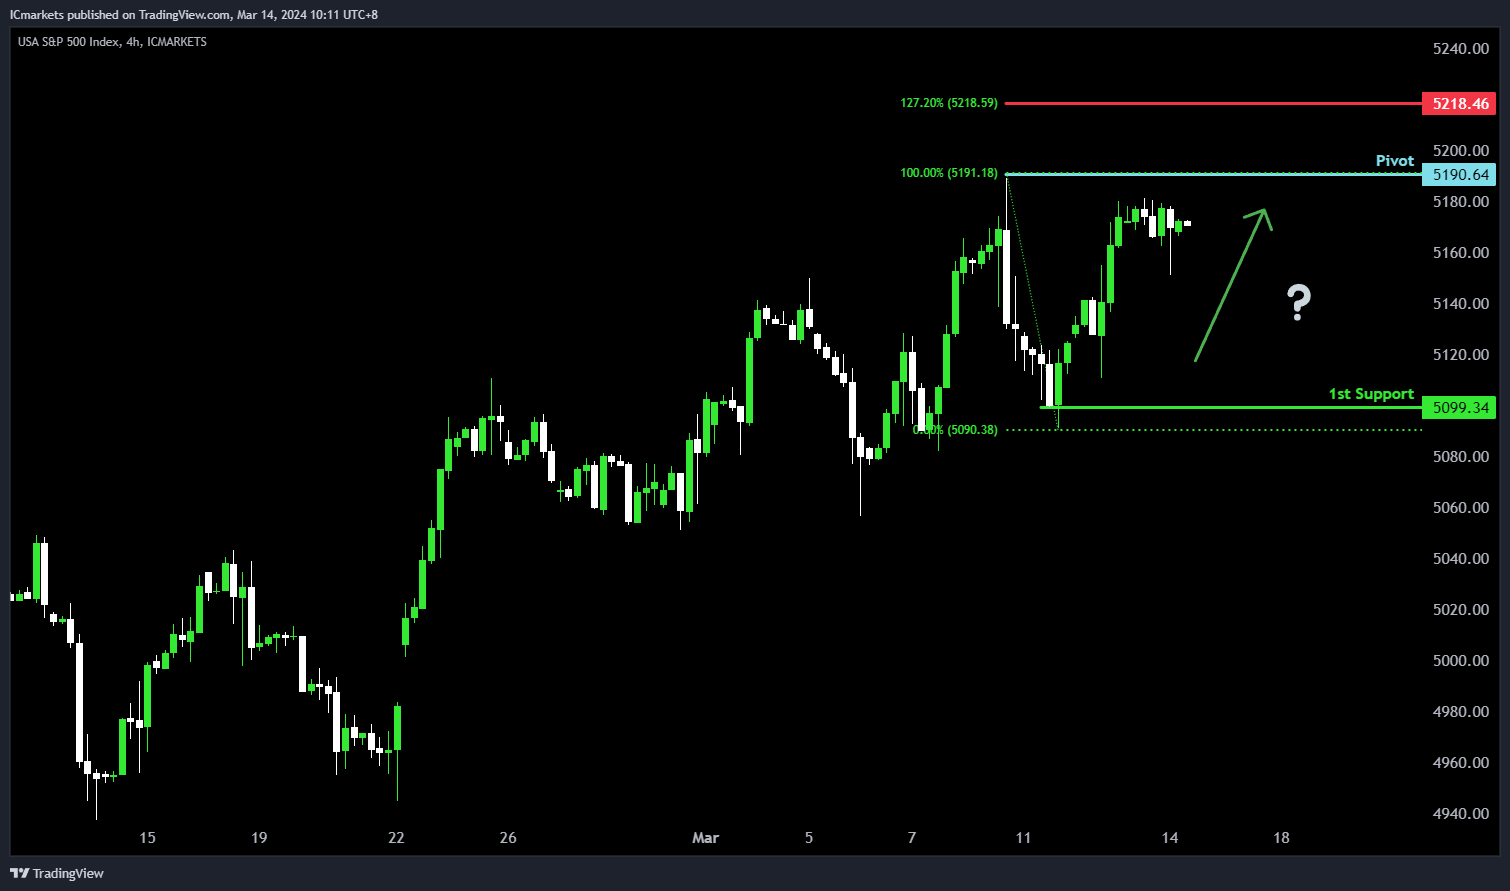
The US500 chart indicates a potential bullish direction, consistent with the overall bullish momentum. Several factors contribute to this analysis.
The pivot level at 5190.64 is significant as it represents a swing high resistance, suggesting a historical barrier to upward movement.
Additionally, the 1st support level at 5099.34 corresponds to a swing low support, indicating a significant historical level where buying interest has previously emerged.
On the resistance side, the 1st resistance level at 5218.46 is marked by the 127.20% Fibonacci Extension, further reinforcing its significance as a potential barrier to further bullish movement.
BTC/USD:
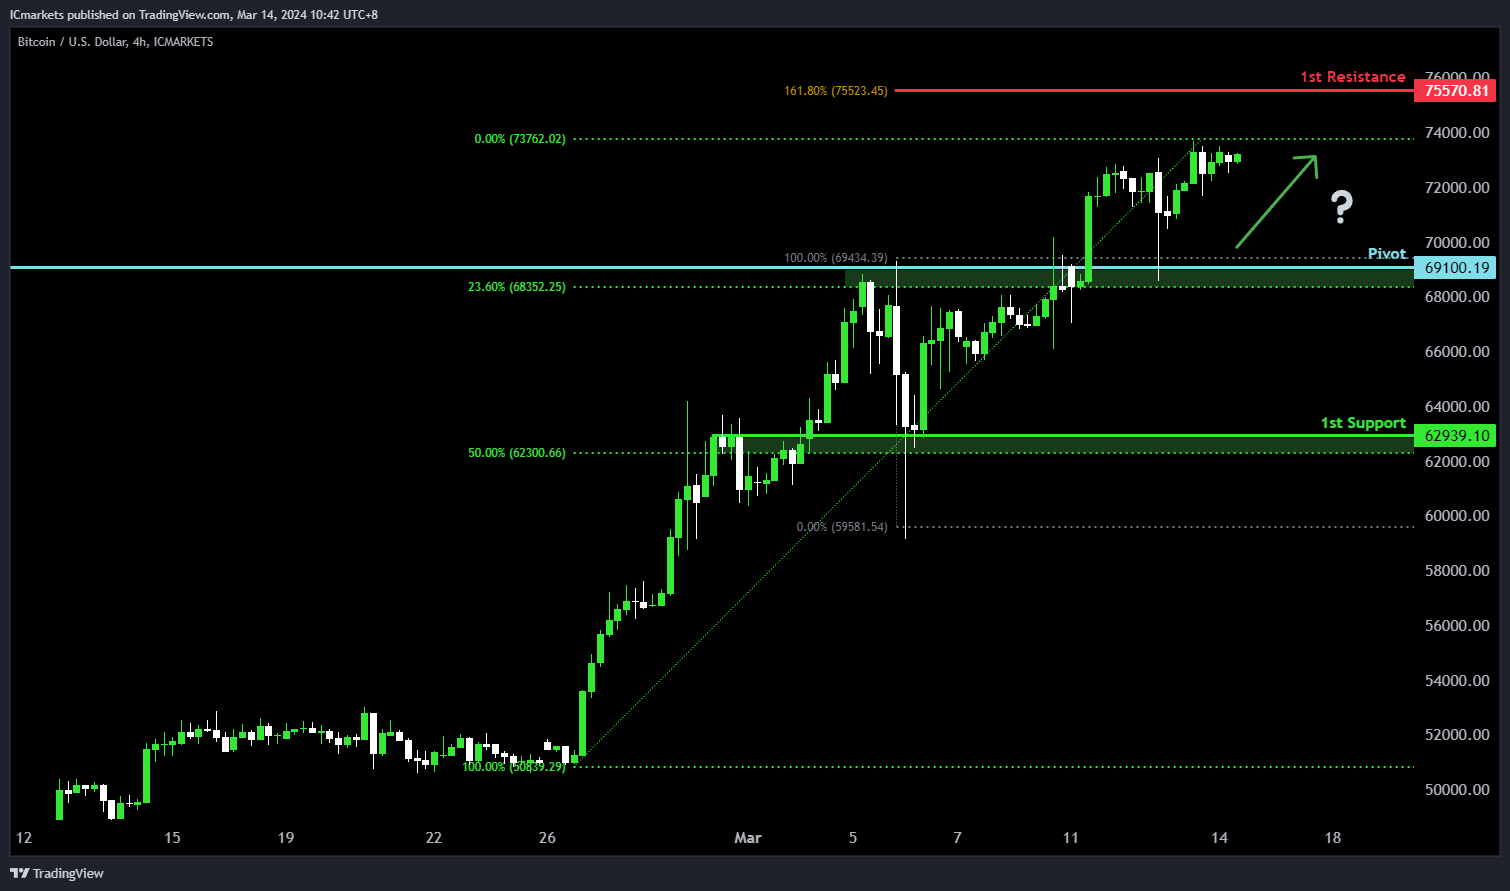
The BTC/USD chart indicates a potential bullish direction, in line with the overall bullish momentum. Several factors contribute to this analysis.
The pivot level at 69100.19 serves as a pullback support and coincides with the 23.60% Fibonacci Retracement, highlighting its significance as a potential area where buying interest might emerge.
Furthermore, the 1st support at 62939.10 aligns with a swing low support and corresponds to the 50% Fibonacci Retracement level, further reinforcing its importance as a potential area where buyers could enter the market.
On the resistance side, the 1st resistance level at 75570.81 is identified by the 161.80% Fibonacci Extension, indicating a significant barrier to further bullish movement.
ETH/USD:
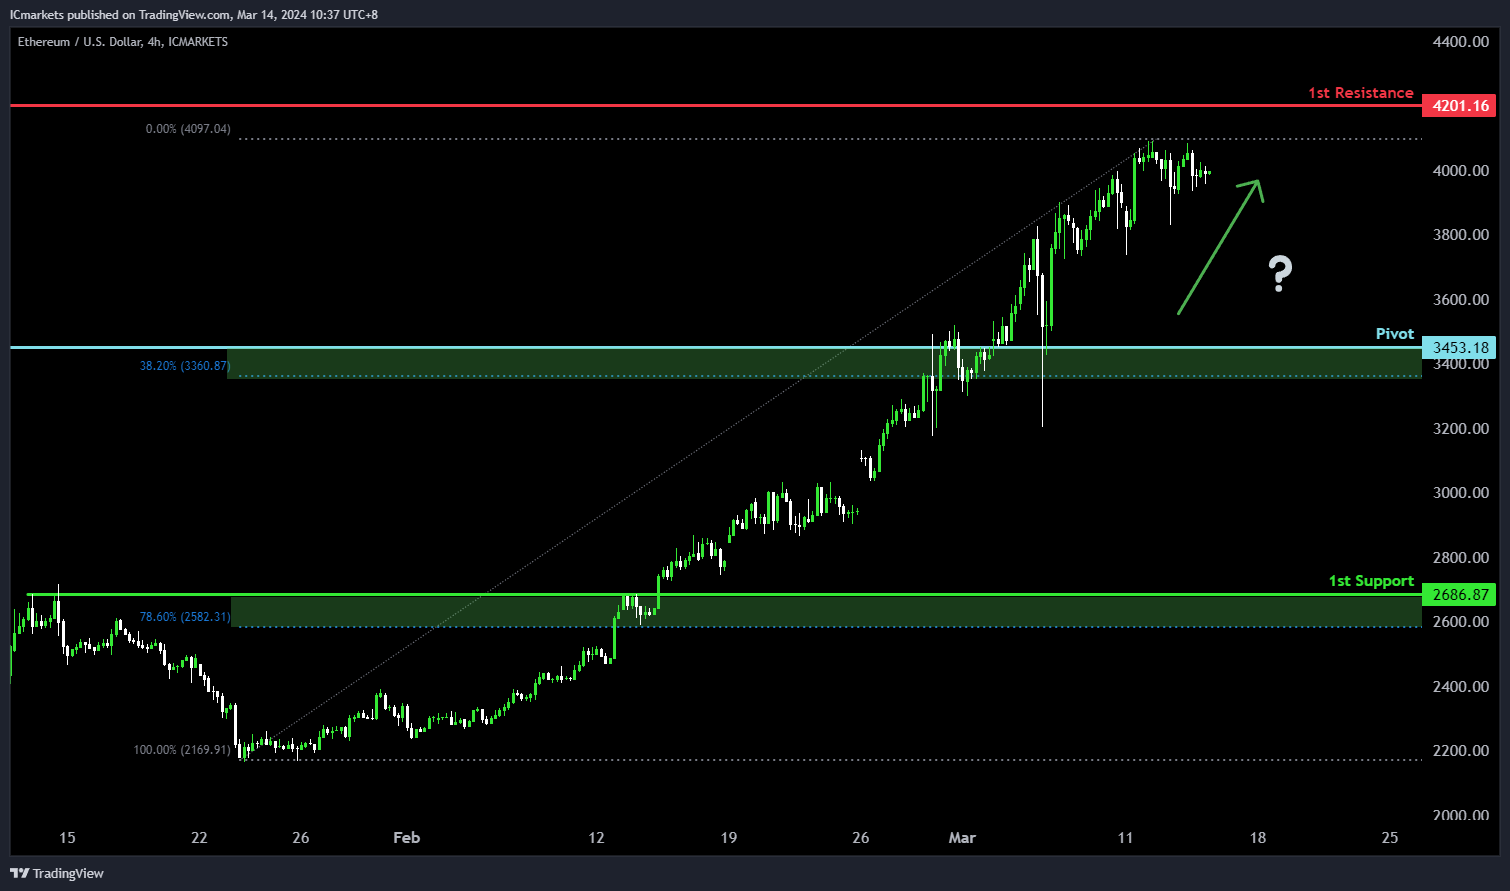
The ETH/USD chart suggests a bullish potential direction, reflecting the overall bullish momentum. Several factors contribute to this analysis.
The pivot level at 3453.18 serves as a pullback support and coincides with the 38.20% Fibonacci Retracement, indicating a significant historical level where buying interest may emerge.
Furthermore, the 1st support at 2686.87 aligns with a swing low support and corresponds to the 78.60% Fibonacci Retracement level, further reinforcing its significance as a potential area where buyers might enter the market.
On the resistance side, the 1st resistance level at 4201.16 is identified as an overlap resistance, suggesting a historical barrier to further upward movement.
WTI/USD:
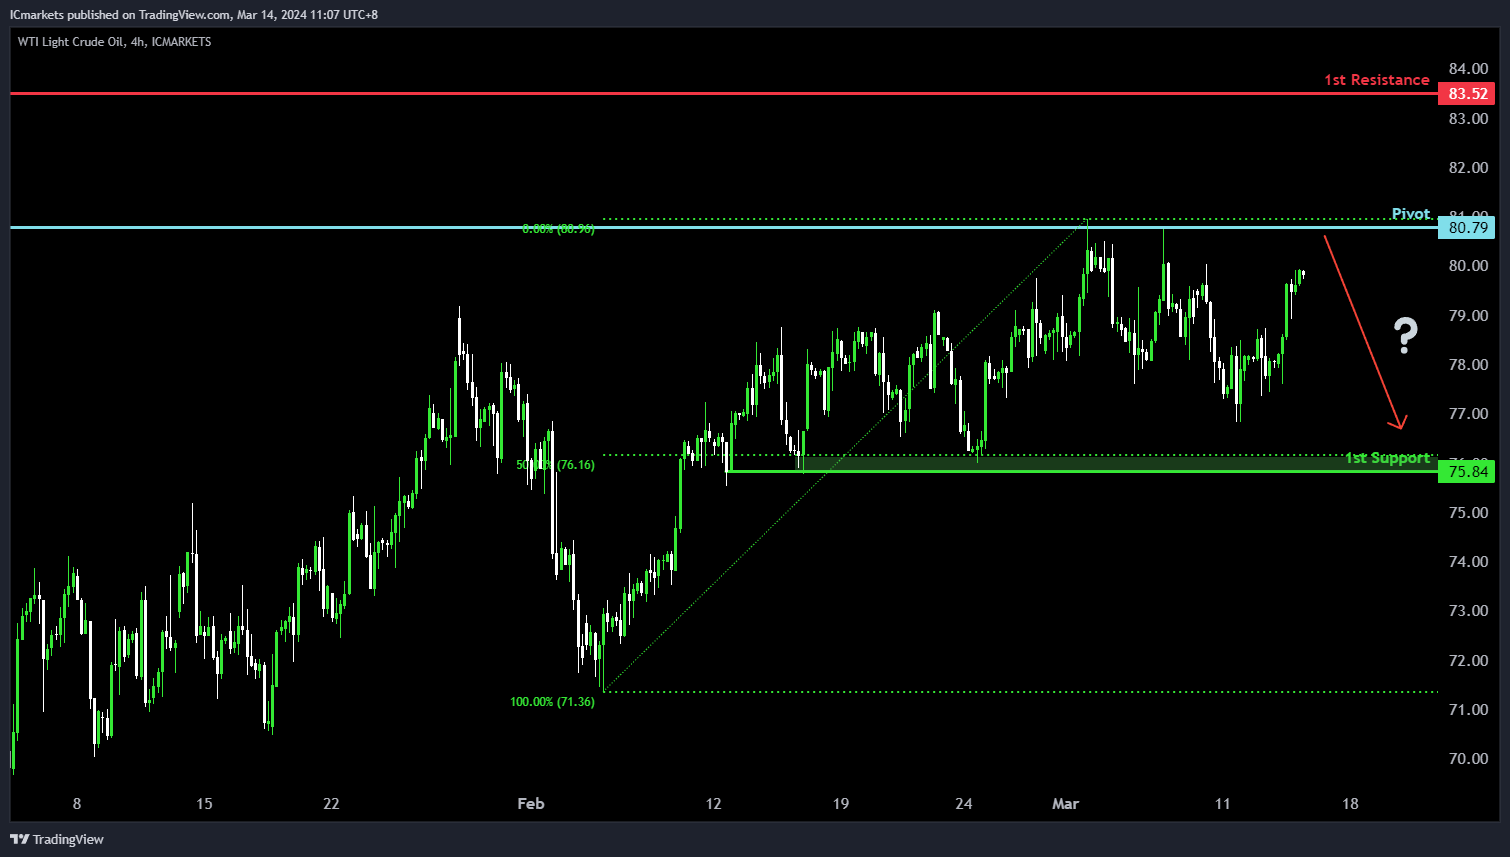
The WTI (West Texas Intermediate) chart currently demonstrates a neutral bias. In this context, there is a potential scenario for price to fluctuate between the pivot and the 1st support.
The pivot level at 80.79 is identified as an overlap resistance where price could potentially reverse from to drop lower. Further below, the 1st support level at 75.84 is marked as a pullback support that aligns close to the 50.00% Fibonacci Retracement level, reinforcing its significance as a key support level.
To the upside, the 1st resistance level at 83.52 is noted as a pullback, further reinforcing its significance as a potential barrier to further bullish movement.
XAU/USD (GOLD):
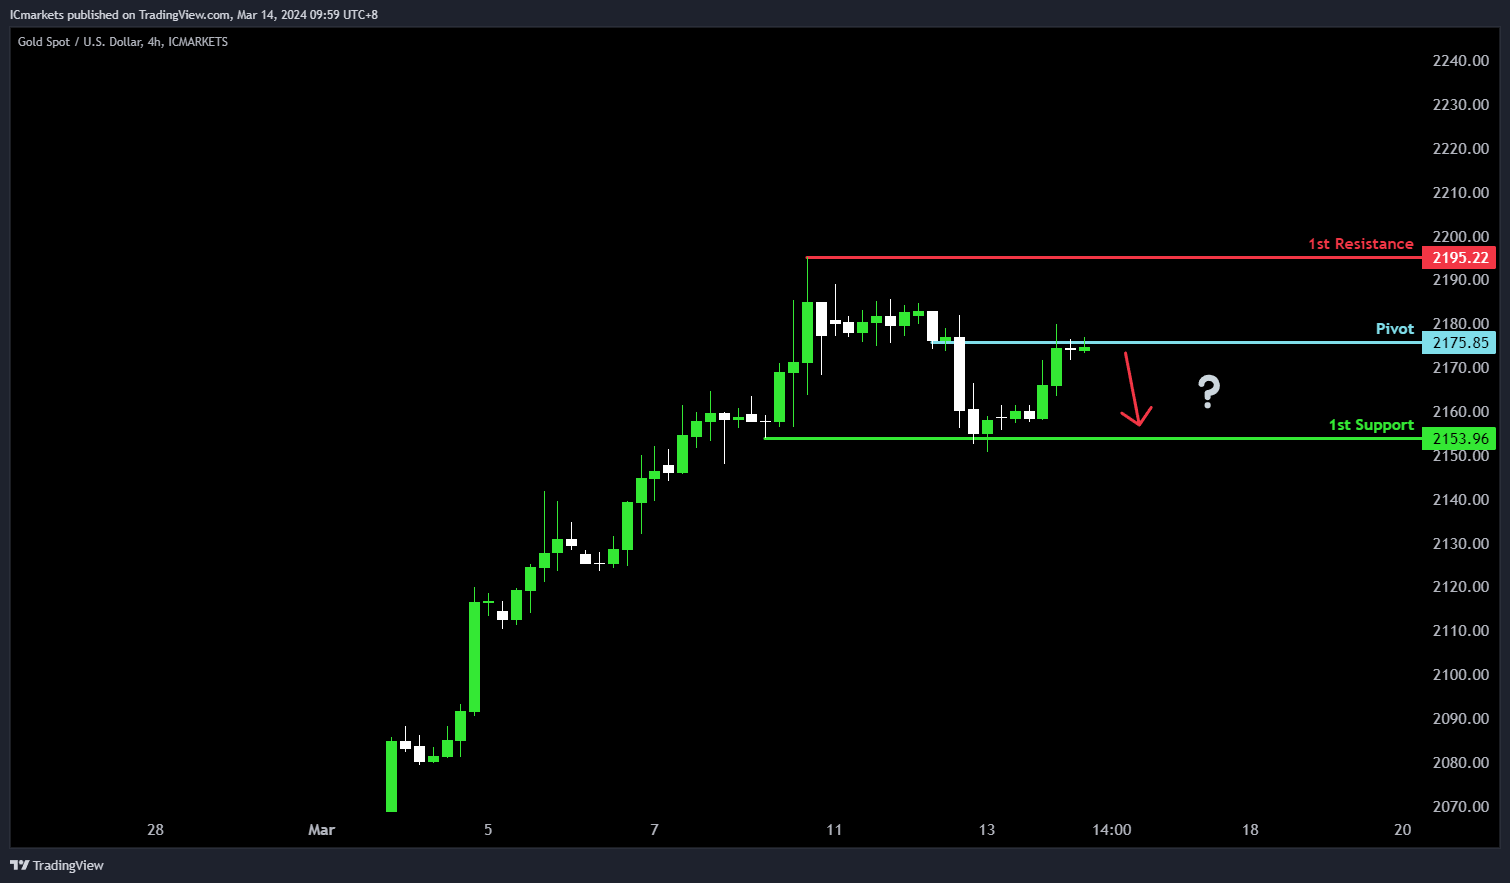
For XAU/USD, the potential direction is bearish, despite the overall bullish momentum of the chart. There’s a possibility of a bearish reaction off the pivot level, leading to a decline towards the 1st support.
The pivot at 2175.85 is considered an overlap resistance, indicating its historical significance as a level where selling pressure may increase. Conversely, the 1st support at 2153.96 is identified as a multi-swing low support, suggesting it could attract buying interest and potentially halt the downward movement.
On the resistance side, the 1st resistance at 2195.22 is noted as a swing high resistance, indicating its historical significance as a level where selling pressure has previously emerged, potentially limiting further upward movement.
Ethereum’s momentum wanes, Bitcoin’s consolidation due soon
Ethereum's rally appears to be losing momentum as seen in D MACD, after accelerating to as high as 4092.5. Overbought consolidation in D RSI is probably limiting it at 161.8% projection of 1519.1 to 2715.0 from 2164.0 at 4098.6. Break of 3726.8 support will confirm short term topping, and bring correction to 38.2% retracement of 2164.0 to 4092.5 at 3355.8, and then set the range for sideway consolidations.
As for Bitcoin, there might still be room to extend the record run, but upside potential is limited for the near term, as some consolidations should be due after the strong rally. Upside should be limited by 161.8% projection of 24896 to 49020 from 38496 at 77528. Meanwhile, break of 67095 support will indicate that a short term top is already formed, and deeper pull back could be seen next to start a consolidation phase.
Silver targeting key resistance zone at 26 as momentum picks up
While Gold's rally stalled after hitting new record high last week, Silver is picking up momentum. Given that Silver has been clearly lagging Gold this year, there is room for Silver to catch up and outperform in Q2.
Fundamentally, both Gold and Silver as precious metal would benefit from policy loosening of major global central banks. But as additionally as an industrial metal, Silver could be benefited more with global growth and industrial demands pick up.
Yet, technically, Silver has to overcome key resistance level around 26 first. For now, near term outlook will stay bullish as long as 23.99 support holds. It's possible that consolidation pattern from 26.12 has completed with three waves to 21.92 already.
Decisive break of 26.12 will confirm resumption of whole rise from 17.54 (2022 low). In this case, the near medium term target will be 61.8% projection of 17.54 to 26.12 from 21.92 at 27.22. Firm break there will pave the way for new record high above 30 later in the year.
Nevertheless, rejection by 25.91/26.12 resistance zone, or break of 23.99 support, will delay the bullish case and extend the consolidation from 26.12 with another falling leg instead.
GBP/USD Eyes Fresh Increase, Gold Could Rally Further
Key Highlights
- GBP/USD started a decent increase above the 1.2800 resistance.
- A major bullish trend line is forming with support at 1.2790 on the 4-hour chart.
- Gold prices could accelerate further higher above the $2,180 resistance zone.
- Bitcoin price seems to be setting up for more upsides above $73,000.
GBP/USD Technical Analysis
The British Pound started a fresh increase above the 1.2650 level against the US Dollar. GBP/USD broke the 1.2740 level to move into a positive zone.
Looking at the 4-hour chart, the pair settled above the 1.2750 level, the 100 simple moving average (red, 4-hour), and the 200 simple moving average (green, 4-hour). It also traded above the 1.2800 level before the bears appeared.
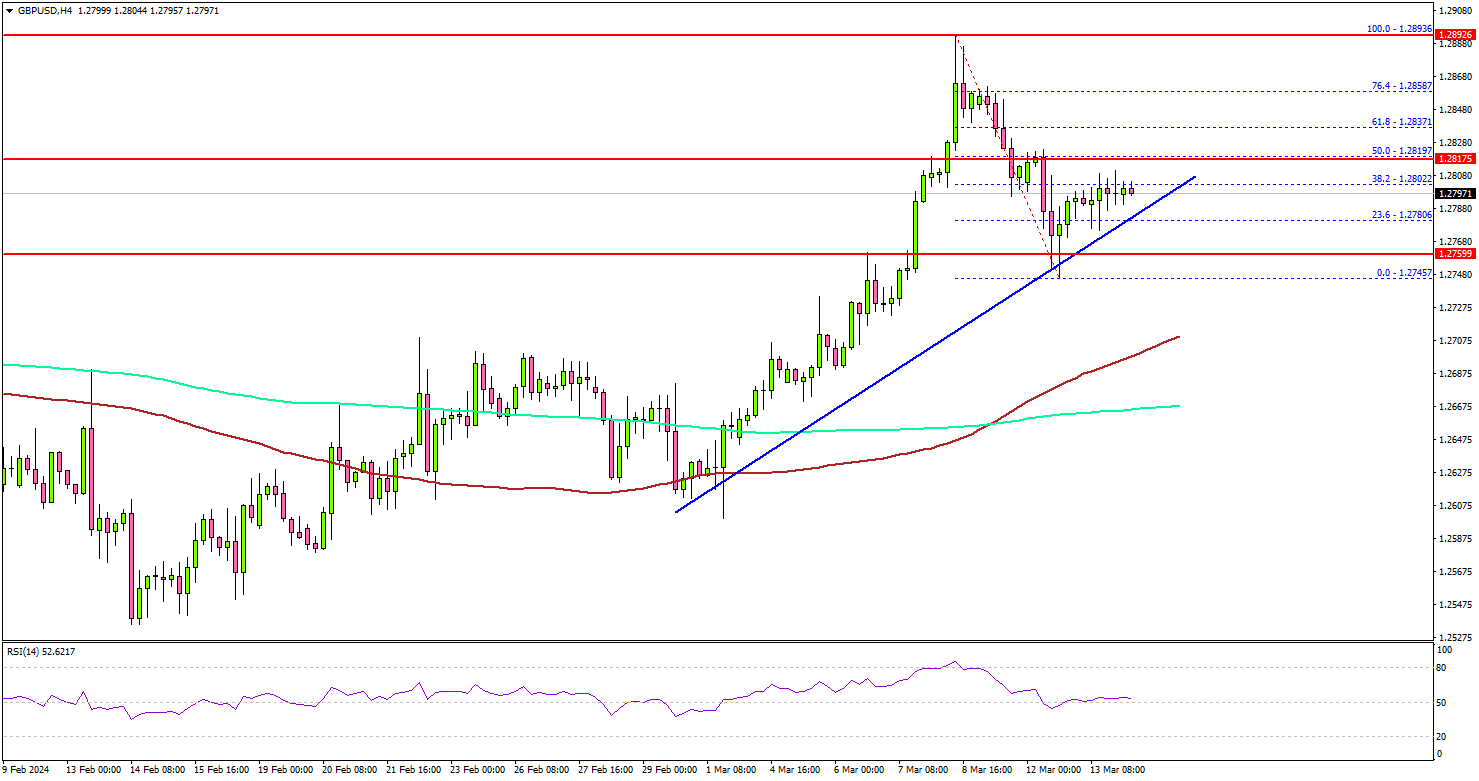
A high was formed at 1.2893 before the pair corrected lower. There was a move below the 1.2800 level. It tested the 1.2750 zone and is now attempting a fresh increase.
The pair is trading above the 1.2780 level. There is also a major bullish trend line forming with support at 1.2790 on the same chart. On the upside, the pair could face resistance near the 1.2820 level.
The first major resistance is now forming near 1.2840. The main resistance is near 1.2880. A close above the 1.2880 zone could open the doors for more upsides. The next stop for the bulls might be 1.2950.
Immediate support is near the 1.2780 level. The next major support is at 1.2740. If there is a downside break below the 1.2740 support, the pair could decline toward the 1.2650 support.
Looking at Gold, there was a strong increase above the $2,150 resistance and the bulls might aim for a move toward $2,250.
Economic Releases
- US Initial Jobless Claims - Forecast 218K, versus 217K previous.
- US Retail Sales for Feb 2024 (MoM) – Forecast +0.1%, versus -0.4% previous.
In Wage Growth the BoJ Hopes
The spring wage decision will reflect cyclical factors rather than a structural shift leaving little reason for the BoJ to consider contractionary action.
The Bank of Japan and financial markets are eagerly awaiting the Shunto wage decision for Japan’s largest trade confederation RENGO, which is due in. In our view, the result will likely be more of a reflection of near-term cyclicality than structural strength in the economy. It is therefore unlikely to justify a material policy shift by the Bank of Japan (BoJ).
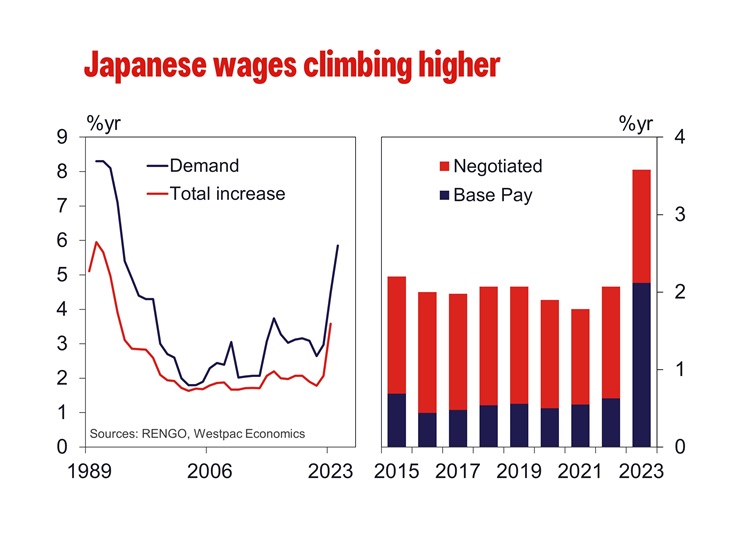
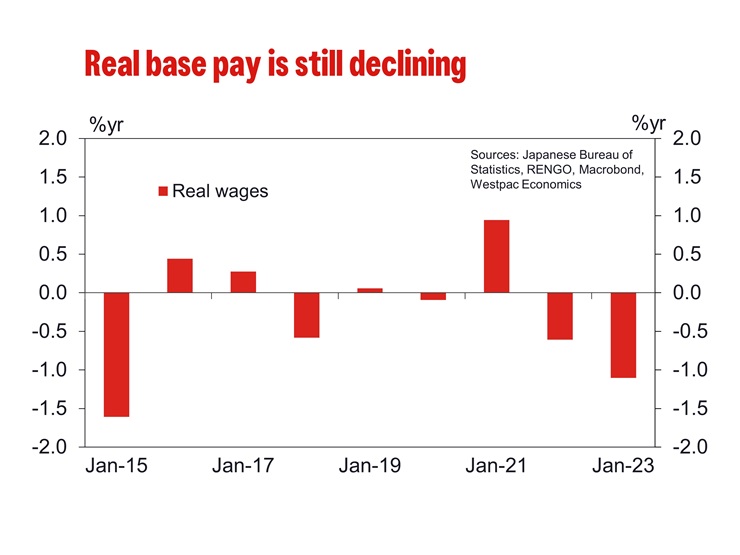
Japan’s recent strong wage growth reflects the lagged effect of cyclical momentum in the economy. RENGO wages rose 3.6% in 2023 after averaging 2% between 2014 and 2022. Base pay, which goes to all employees, rose 2% trumping the average 0.6% rise since 2015. In justifying their decision, RENGO drew attention to higher cost of living. Inflation rose 4% through 2022, well above the 0.5%yr average between 2010 and 2019. Inflation subsequently eased to 2.6%yr during 2023, following the global disinflationary pulse, and is expected to ease further hence.
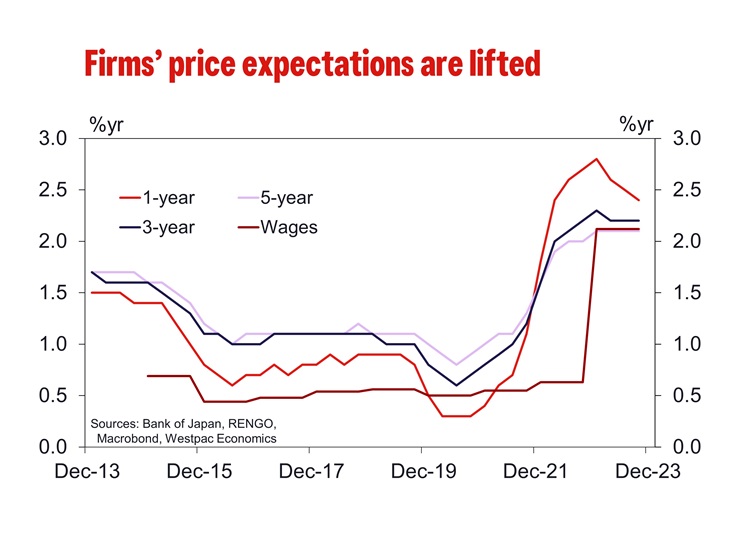
As of 2023 Q4, the inflation outlook for 1, 3 and 5 years came to 2.4%, 2.2% and 2.1% respectively. While still above the circa 1% average for all three time periods 2014 to 2019, it is also materially below where inflation has been. Still-elevated current inflation expectations may support wage growth in the near-term, but this effect looks set to dissipate as actual inflation prints come in weaker.
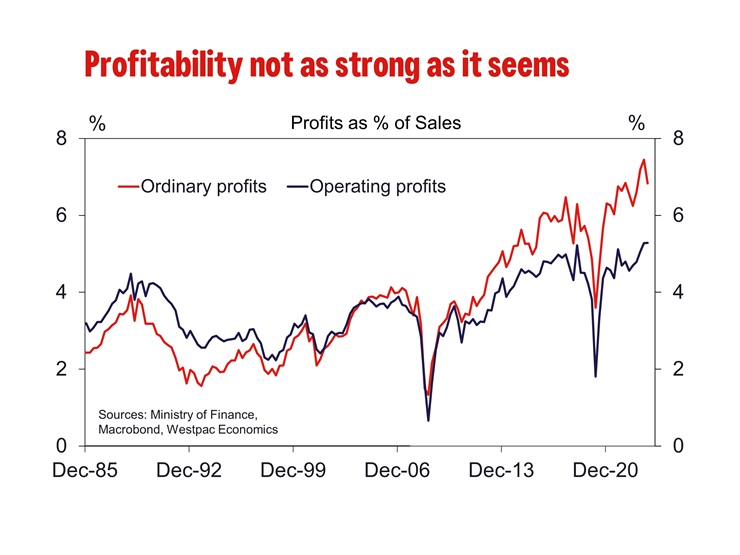
Rising profitability has also been used to argue for stronger wage growth in 2024 with a focus on strength in ordinary profits. However, operating profits are only slightly above the pre-COVID peak and below the 10-year pre-COVID trend. Operating profit as a share of sales are also relatively unimpressive, hovering around pre-COVID rates. The disparity between operating profits, which do not include investment-related income, and ordinary profits implies profitability is being flattered by financial investment returns not firms’ underlying profitability. It is only the latter that would given businesses confidence to increase wages at or above the rate of inflation.
Rather than being a support for wage growth, beyond 2024, we expect structural factors to act at a headwind for sustained wages growth. In Japan, wage increases depend on seniority, so job mobility is low and companies typically find it unnecessary to raise wages to retain staff. This also disincentivises employees from reskilling or making career changes into higher growth areas. In 2016, then Govenor Kuroda outlined low job mobility as a key challenge for the labour market and the country’s growth potential.
Further, participation has recently been rising thanks to a growing cohort of part-time workers, primarily women and those aged 65 and above. Wage growth is slower for part time workers, and the loss of tax and social benefits for secondary income earners dissaude many from labour market and the country's growth potential.
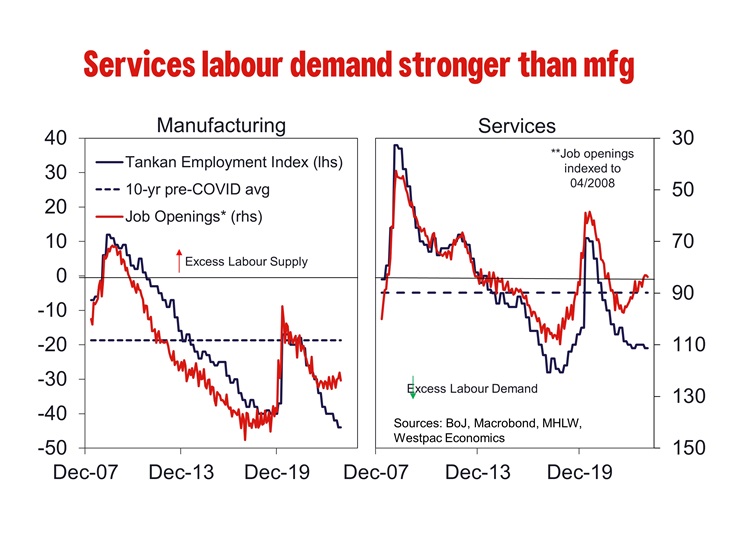
While some large companies such as Suntory and Nomura have publicly committed to raising salaries by 7-16%, many others will hold back believing the labour they will require will remain available. According to the Tankan survey, firms are reporting labour shortages as less severe than pre-COVID in manufacturing; while shortages in services persist to what was seen in the early 1990s. The number of new job openings in the services sector are also settling below the pre-COVID peak while new openings in manufacturing continue to decline. Part of this reflects a structural decline in manufacturing jobs, with south-east Asia providing attractive alternative locations for facilities and automation also limiting labour demand. Given manufacturing employs around 15% of the labour force, weaker demand will act as a drag on aggregate wages. This points to a softening labour market overall but also diverging outcomes for services and manufacturing.
Small businesses have been particularly unenthusiastic about raising wages. As an example, a survey completed by Johnan Shinkin Bank and the Tokyo Shimbun daily reported 72.8% of small and medium-sized businesses in the Tokyo metropolitan area said they ” have no plans to raise wages this year”. Smaller employers tend to make up the bulk of employers and so can have a significant effect on aggregate outcomes. Their reluctance is arguably principally due to an inability to pass on higher costs to consumers, particularly when households are price sensitive as they are now, but also as they are much less able to scale up and therefore benefit from efficiency and large markets.
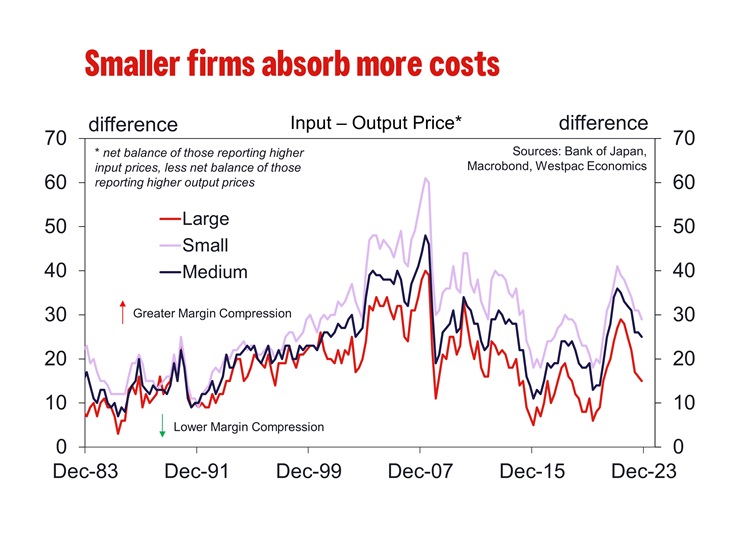
One segment of the labour market that is showing increasing wages is younger Japanese workers. They are more likely to have in demand skills, particularly for high-skill work, and are also more likely to job hop being early in their careers. As such, wage gains are thought to be skewed towards younger workers. BoJ research also shows that wages for high skill workers are increasing. However given Japan’s ageing population and weak immigration program, young people make up a small fraction of the labour force, so wage gains in this cohort is unlikely to drive aggregate wage gains or consumption.
Looking beyond 2024, both cyclical and structural factors are likely to limit wage gains and thereby keep a lid on domestic inflation pressures. While the second estimate for GDP has revised away recession, the economy remains weak and at risk of global developments. All this points to an absence of demand-side inflation pressures necessary to justify a tightening cycle of scale. While the BoJ can likely justify the end of negative rates in coming months, moving the policy materially above zero is unwarranted and potentially a decision that would put at risk all the work undertaken in recent years to aim to achieve the inflation target on a sustainable basis. All considered, the shunto wage outcome is unlikely to be the opportunity markets are hoping for a generational change in monetary policy.
AUDJPY Wave Analysis
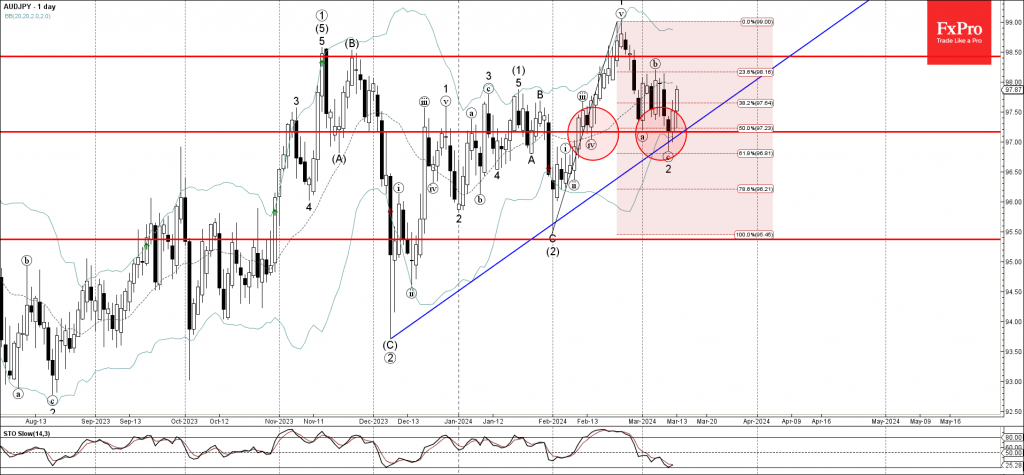
- AUDJPY reversed from key support level 97.20
- Likely to rise to resistance level 98.50
AUDJPY currency pair recently reversed up from the key support level 97.20 (which stopped the previous minor corrections iv and a, as can be seen below) coinciding with the lower daily Bollinger Band.
The support level 97.20 was strengthened by the 50% Fibonacci correction of the upward impulse 1 from the start of February and by the support trendline from December.
Given the clear daily uptrend and the bearish yen sentiment, AUDJPY currency pair can be expected to rise further toward the next resistance level 98.50.