Sample Category Title
USD/CHF Mid-Day Outlook
Daily Pivots: (S1) 0.8773; (P) 0.8782; (R1) 0.8799; More....
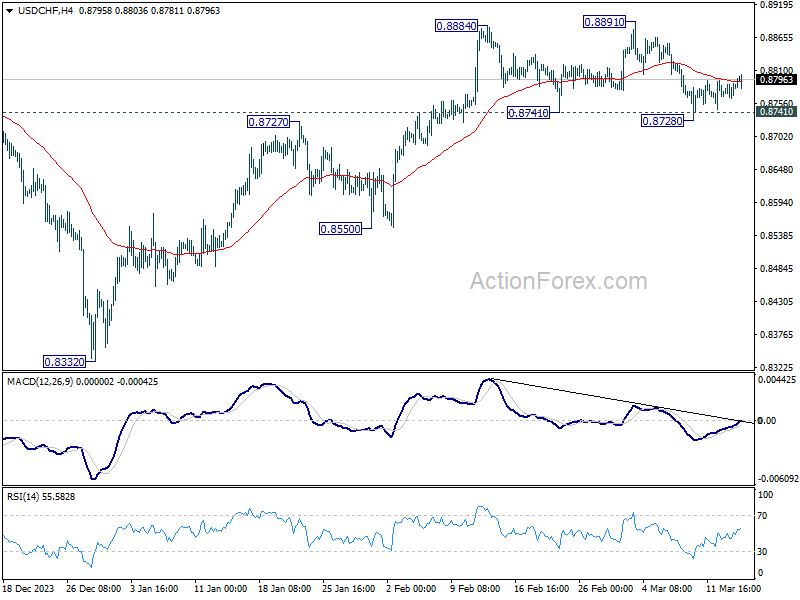
Intraday bias in USD/CHF remains neutral at this point. On the downside, sustained break of 0.8741 will argue that the whole rebound from 0.8332 might have completed, and bring deeper fall to 0.8550 support. Nevertheless, strong bounce from current level will retain near term bullishness. Further break of 0.8891 will resume the rise from 0.8332.
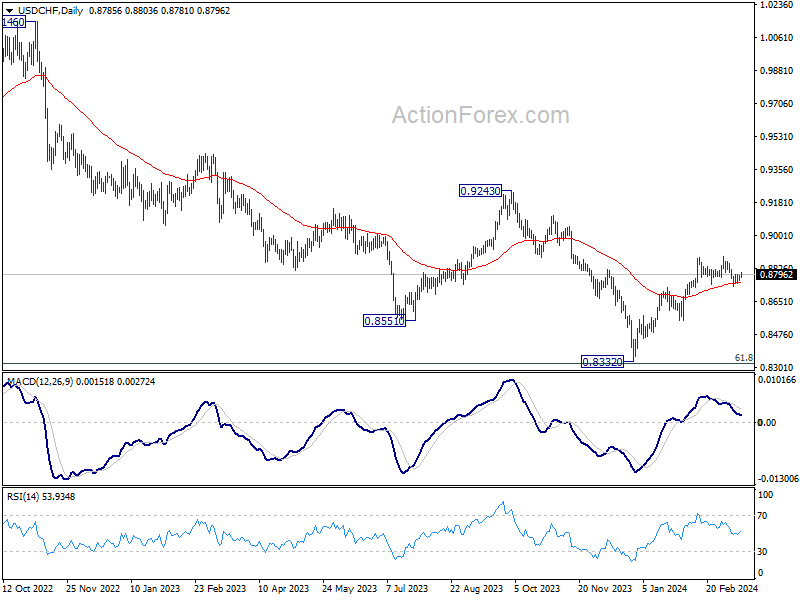
In the bigger picture, price actions from 0.8332 medium term bottom as seen as developing into a corrective pattern to the down trend from 1.0146 (2022 high). Further rise would be seen as long as 0.8555 support holds. But upside should be limited by 0.9243 resistance, at least on first attempt.
EUR/USD Mid-Day Outlook
Daily Pivots: (S1) 1.0924; (P) 1.0944; (R1) 1.0968; More...
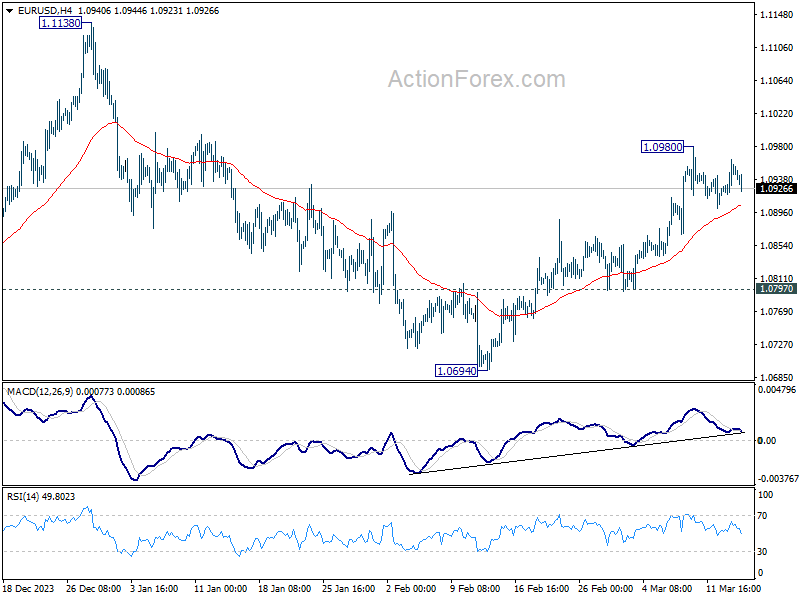
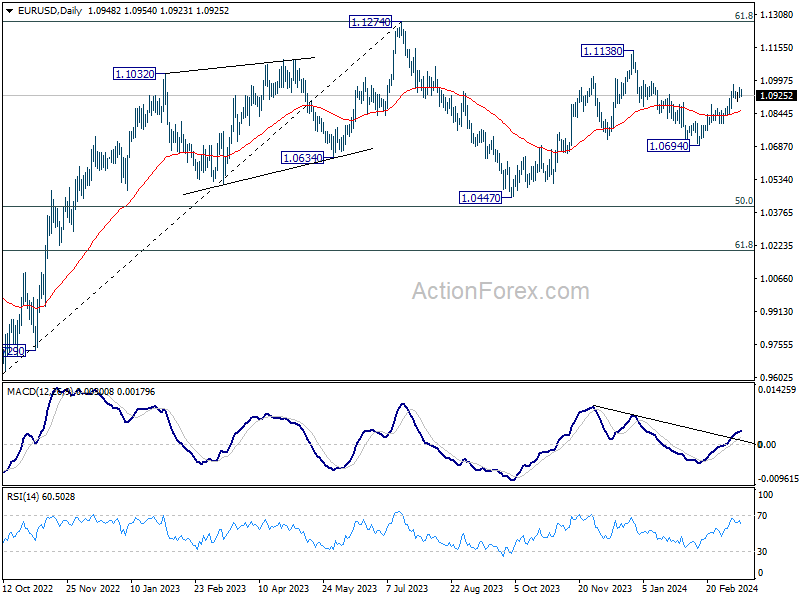
Intraday bias in EUR/USD remains neutral for the moment. Further rise is in favor as long as 55 4H EMA (now at 1.0904) holds. Above 1.0980 will resume the rally from 1.0694 to retest 1.1138 high. However, sustained break of the EMA will turn bias to the downside for 1.0797 support instead.
In the bigger picture, price actions from 1.1274 are viewed as a corrective pattern to rise from 0.9534 (2022 low). Rise from 1.0447 is seen as the second leg. While further rally could cannot be ruled out, upside should be limited by 1.1274 to bring the third leg of the pattern. Meanwhile, sustained break of 1.0694 support will argue that the third leg has already started for 1.0447 and possibly below.
GBP/USD Mid-Day Outlook
Daily Pivots: (S1) 1.2778; (P) 1.2794; (R1) 1.2814; More...
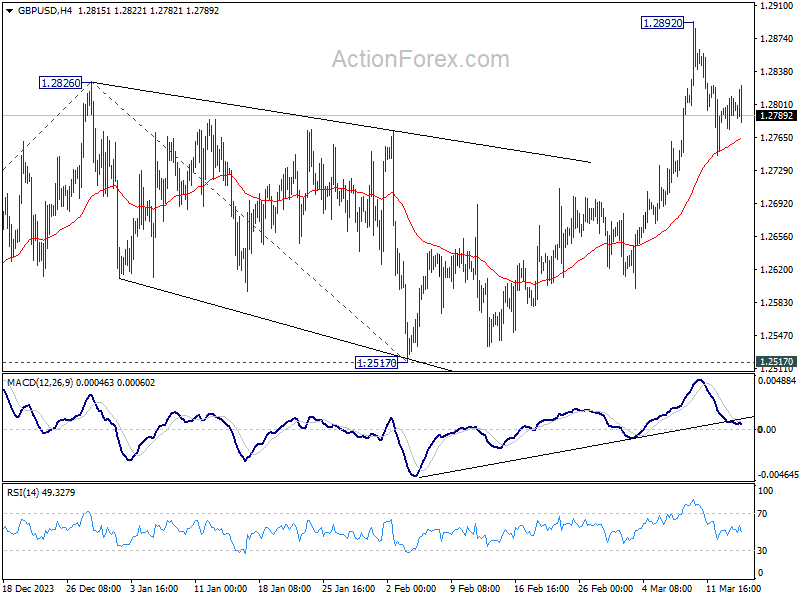
Intraday bias in GBP/USD remains neutral and outlook is unchanged. Further rally will remain in favor as long as 55 4H EMA (now at 1.2764) holds. On the upside, above 1.2892 will resume larger rise from 1.2063 and target 61.8% projection of 1.2036 to 1.2826 from 1.2517 at 1.3005. However, sustained break of 55 4H EMA will bring deeper fall back towards 55 D EMA (now at 1.2672), and possibly further to 1.2517 structural support.
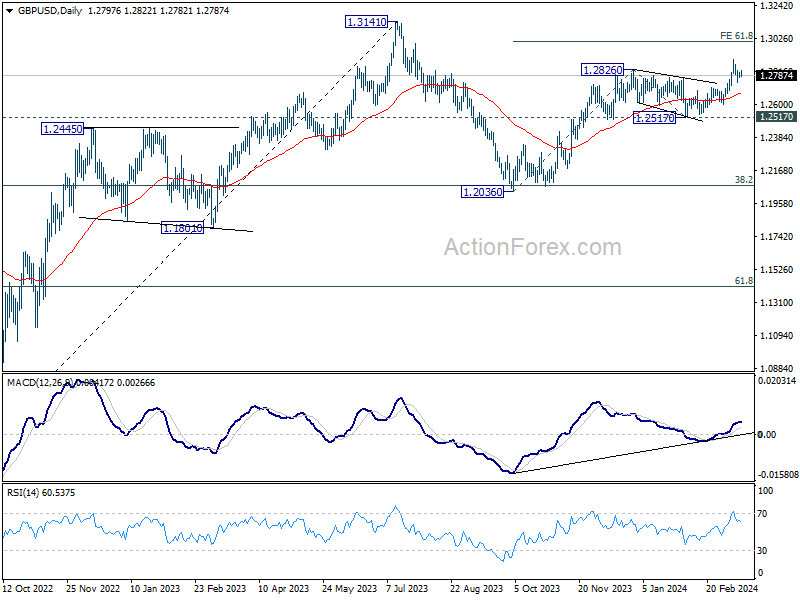
In the bigger picture, price actions from 1.3141 medium term top are seen as a corrective pattern to up trend from 1.0351 (2022 low). Rise from 1.2036 is seen as the second leg, which is still in progress. But upside should be limited by 1.3141 to bring the third leg of the pattern. Meanwhile, break of 1.2517 support will argue that the third leg has already started for 38.2% retracement of 1.0351 (2022 low) to 1.3141 at 1.2075 again.
Consolidation Persists Amid Indecision and Anticipation
Consolidative trading continues in the forex markets in general. There is little reaction to the batch of economic data released from there US. Comments from ECB officials were also largely ignored. For now, commodity currencies are the stronger ones for the week, as led by Canadian Dollar, while Euro is also firm. Sterling and Swiss Franc are on the softer side together with Yen. Dollar is mixed in the mixed. Despite these fluctuations, it's noteworthy that all major currency pairs and crosses have remained within last week's range, signaling a market characterized by indecision and anticipation.
This collective pause among traders and investors can be attributed to good reasons. The upcoming week is poised to be a pivotal one for global financial markets, with a slew of central banks, including BoJ, RBA, Fed, SNB, and BoE, all set to announce their monetary policy decisions. This upcoming "central bank bonanza" is expected to inject a significant dose of volatility and directional movement into the forex markets.
Particularly, BoJ's upcoming decision is garnering heightened attention, with speculation that the central bank may finally opt to raise interest rates, a move that could have far-reaching implications for Yen and broader market sentiment. Similarly, Fed's announcement is eagerly awaited, especially given that it will be accompanied by new economic projections and updated dot plots, which could provide fresh insights into the central bank's outlook on the economy and future policy oath.
In Europe, at the time of writing, FTSE is down -0.06%. DAX is up 0.22%. CAC is up 0.77%. UK 10-year yield is up 0.004 at 4.125. Germany 10-year yield is up 0.0181 at 2.385. Earlier in Asia, Nikkei rose 0.29%. Hong Kong HSI fell -0.71%. China Shanghai SSE fell -0.18%. Singapore Strait Times rose 0.81%. Japan 10-year JGB yield rose 0.0147 to 0.776.
US retail sales rises 0.6% mom in Feb, ex-auto sales up 0.3% mom
US retail sales grew 0.6% mom to USD 700.7B in February, above expectation of 0.5% mom. Ex-auto sales rose 0.3% mom to USD 566.8B, below expectation of 0.4% mom. Ex-gasoline sales rose 0.6% mom to USD 647.7B. Ex-auto & gasoline sales rose 0.3% mom to USD 513.7B.
In the three months to February, sales were up 2.1% from the same period a year ago.
US PPI up 0.6% mom, 1.6% yoy in Feb
US PPI rose 0.6% mom in February above expectation of 0.3% mom. PPI goods rose 1.2% while PPI services rose 0.3% mom. PPI ex-food, energy and trade services rose 0.4% mom.
For the 12-month period, PPI rose 1.6% yoy, above expectation of 1.1% yoy. That's the highest level since September 2023. PPI ex-food, energy and trade services rose 2.8% yoy.
US initial jobless claims falls to 209k vs exp 218k
US initial jobless claims fell -1k to 209k in the week ending March 9, below expectation of 218k. Four-week moving average of initial claims fell -500 to 208k.
Continuing claims rose 17k to 1811k in the week ending March 2. Four-week moving average of continuing claims rose 2k to 1799k.
ECB's Knot pencils in for Jun rate cut, eyes Sep and Dec meetings too
ECB Governing Council member Klaas Knot told reporter today that he has "pencilled in June for a first rate cut". After that, Know said the subsequent path would be "data-dependent".
Highlighting the significance of ECB's meetings in September and December, which will include new economic projections, Knot positions these gatherings as crucial junctures for assessing and adjusting the bank's monetary policy strategy.
Moreover, Knot opens the door for action outside the traditional schedule of projection-inclusive meetings. "But if incoming data tells us we can do more, the interim meetings should also be available," he stated.
ECB's Stournaras advocates two rate cuts by summer break, four throughout the year
ECB Governing Council member Yannis Stournara, a known dove, proposed two rate reductions "before the summer break" and a total of four throughout the year. This strategy, he argues, is essential to ensure that ECB's monetary policy "does not become too restrictive" in the face of current economic challenges.
In an interview, Stournaras emphasizes the urgency of beginning these rate cuts soon, but not in April, as there will be "only little new information" available before then.
The rationale behind Stournaras's push for rate cuts stems from his observations on Eurozone's economy is "much weaker than expected," with risks skewed to the downside. Meanwhile, inflation, although significantly reduced, presents a balanced risk profile.
Addressing concerns about risk of "wage-price spiral," Stournaras argued that wages are merely "catching up, not leading inflation." He also highlights the moderating trend in nominal wage growth and the capacity of profits to absorb part of the pay increases, suggesting that fears of a wage-driven inflationary loop may be overstated.
Looking ahead, Stournaras envisions the deposit rate gradually decreasing to 2% by the end of 2025 or the beginning of 2026. However, he draws a line at this level, suggesting that rates should not fall below the pre-pandemic levels of 2%.
GBP/USD Mid-Day Outlook
Daily Pivots: (S1) 1.2778; (P) 1.2794; (R1) 1.2814; More...
Intraday bias in GBP/USD remains neutral and outlook is unchanged. Further rally will remain in favor as long as 55 4H EMA (now at 1.2764) holds. On the upside, above 1.2892 will resume larger rise from 1.2063 and target 61.8% projection of 1.2036 to 1.2826 from 1.2517 at 1.3005. However, sustained break of 55 4H EMA will bring deeper fall back towards 55 D EMA (now at 1.2672), and possibly further to 1.2517 structural support.
In the bigger picture, price actions from 1.3141 medium term top are seen as a corrective pattern to up trend from 1.0351 (2022 low). Rise from 1.2036 is seen as the second leg, which is still in progress. But upside should be limited by 1.3141 to bring the third leg of the pattern. Meanwhile, break of 1.2517 support will argue that the third leg has already started for 38.2% retracement of 1.0351 (2022 low) to 1.3141 at 1.2075 again.
Economic Indicators Update
| GMT | Ccy | Events | Actual | Forecast | Previous | Revised |
|---|---|---|---|---|---|---|
| 00:01 | GBP | RICS Housing Price Balance Feb | -10% | -10% | -18% | |
| 07:30 | CHF | PPI M/M Feb | 0.10% | 0.20% | -0.50% | |
| 07:30 | CHF | PPI Y/Y Feb | -2.00% | -2.30% | ||
| 12:30 | CAD | Manufacturing Sales M/M Jan | 0.20% | 0.30% | -0.70% | |
| 12:30 | USD | Retail Sales M/M Feb | 0.60% | 0.50% | -0.80% | |
| 12:30 | USD | Retail Sales ex Autos M/M Feb | 0.30% | 0.40% | -0.60% | |
| 12:30 | USD | PPI M/M Feb | 0.60% | 0.30% | 0.30% | |
| 12:30 | USD | PPI Y/Y Feb | 1.60% | 1.10% | 0.90% | 1.00% |
| 12:30 | USD | PPI Core M/M Feb | 0.30% | 0.20% | 0.50% | |
| 12:30 | USD | PPI Core Y/Y Feb | 2.00% | 2.00% | 2.00% | |
| 12:30 | USD | Initial Jobless Claims (Mar 8) | 209K | 218K | 217K | 210K |
| 14:00 | USD | Business Inventories Jan | 0.30% | 0.40% | ||
| 14:30 | USD | Natural Gas Storage | -3B | -40B |
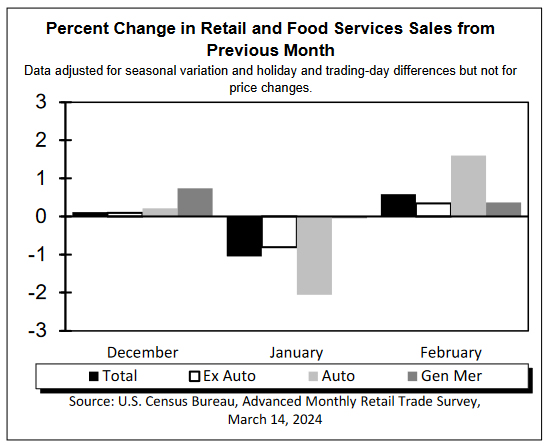
US initial jobless claims falls to 209k vs exp 218k
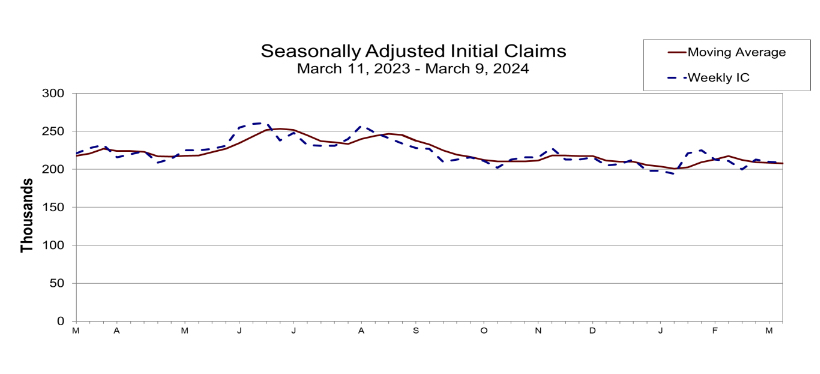
US initial jobless claims fell -1k to 209k in the week ending March 9, below expectation of 218k. Four-week moving average of initial claims fell -500 to 208k.
Continuing claims rose 17k to 1811k in the week ending March 2. Four-week moving average of continuing claims rose 2k to 1799k.
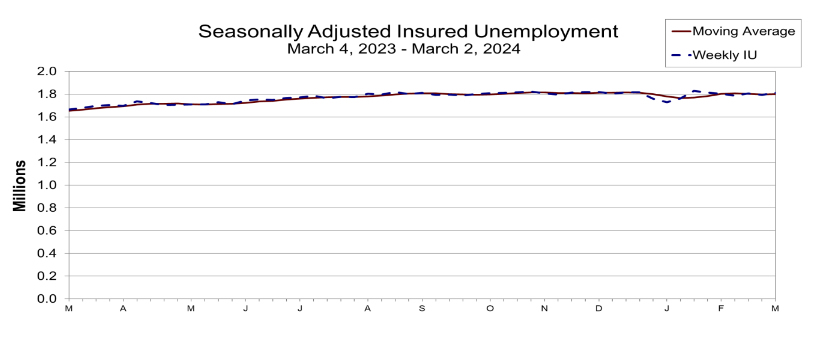
US PPI up 0.6% mom, 1.6% yoy in Feb
US PPI rose 0.6% mom in February above expectation of 0.3% mom. PPI goods rose 1.2% while PPI services rose 0.3% mom. PPI ex-food, energy and trade services rose 0.4% mom.
For the 12-month period, PPI rose 1.6% yoy, above expectation of 1.1% yoy. That's the highest level since September 2023. PPI ex-food, energy and trade services rose 2.8% yoy.
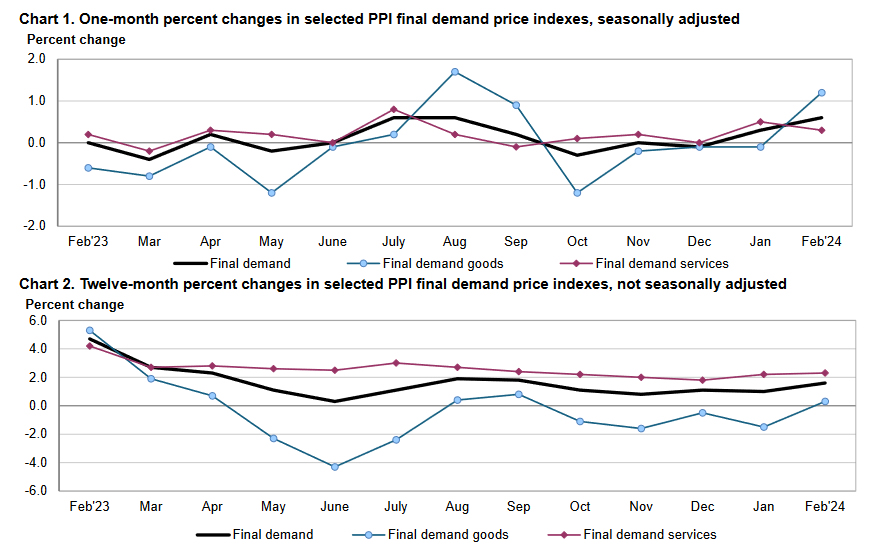
US retail sales rises 0.6% mom in Feb, ex-auto sales up 0.3% mom
US retail sales grew 0.6% mom to USD 700.7B in February, above expectation of 0.5% mom. Ex-auto sales rose 0.3% mom to USD 566.8B, below expecetation of 0.4% mom. Ex-gasoline sales rose 0.6% mom to USD 647.7B. Ex-auto & gasoline sales rose 0.3% mom to USD 513.7B.
In the three months to February, sales were up 2.1% from the same period a year ago.
ECB’s Knot pencils in for Jun rate cut, eyes Sep and Dec meetings too
ECB Governing Council member Klaas Knot told reporter today that he has "pencilled in June for a first rate cut". After that, Know said the subsequent path would be "data-dependent".
Highlighting the significance of ECB's meetings in September and December, which will include new economic projections, Knot positions these gatherings as crucial junctures for assessing and adjusting the bank's monetary policy strategy.
Moreover, Knot opens the door for action outside the traditional schedule of projection-inclusive meetings. "But if incoming data tells us we can do more, the interim meetings should also be available," he stated.
OIL (CL_F) Elliott Wave: Buying The Dips At The Blue Box
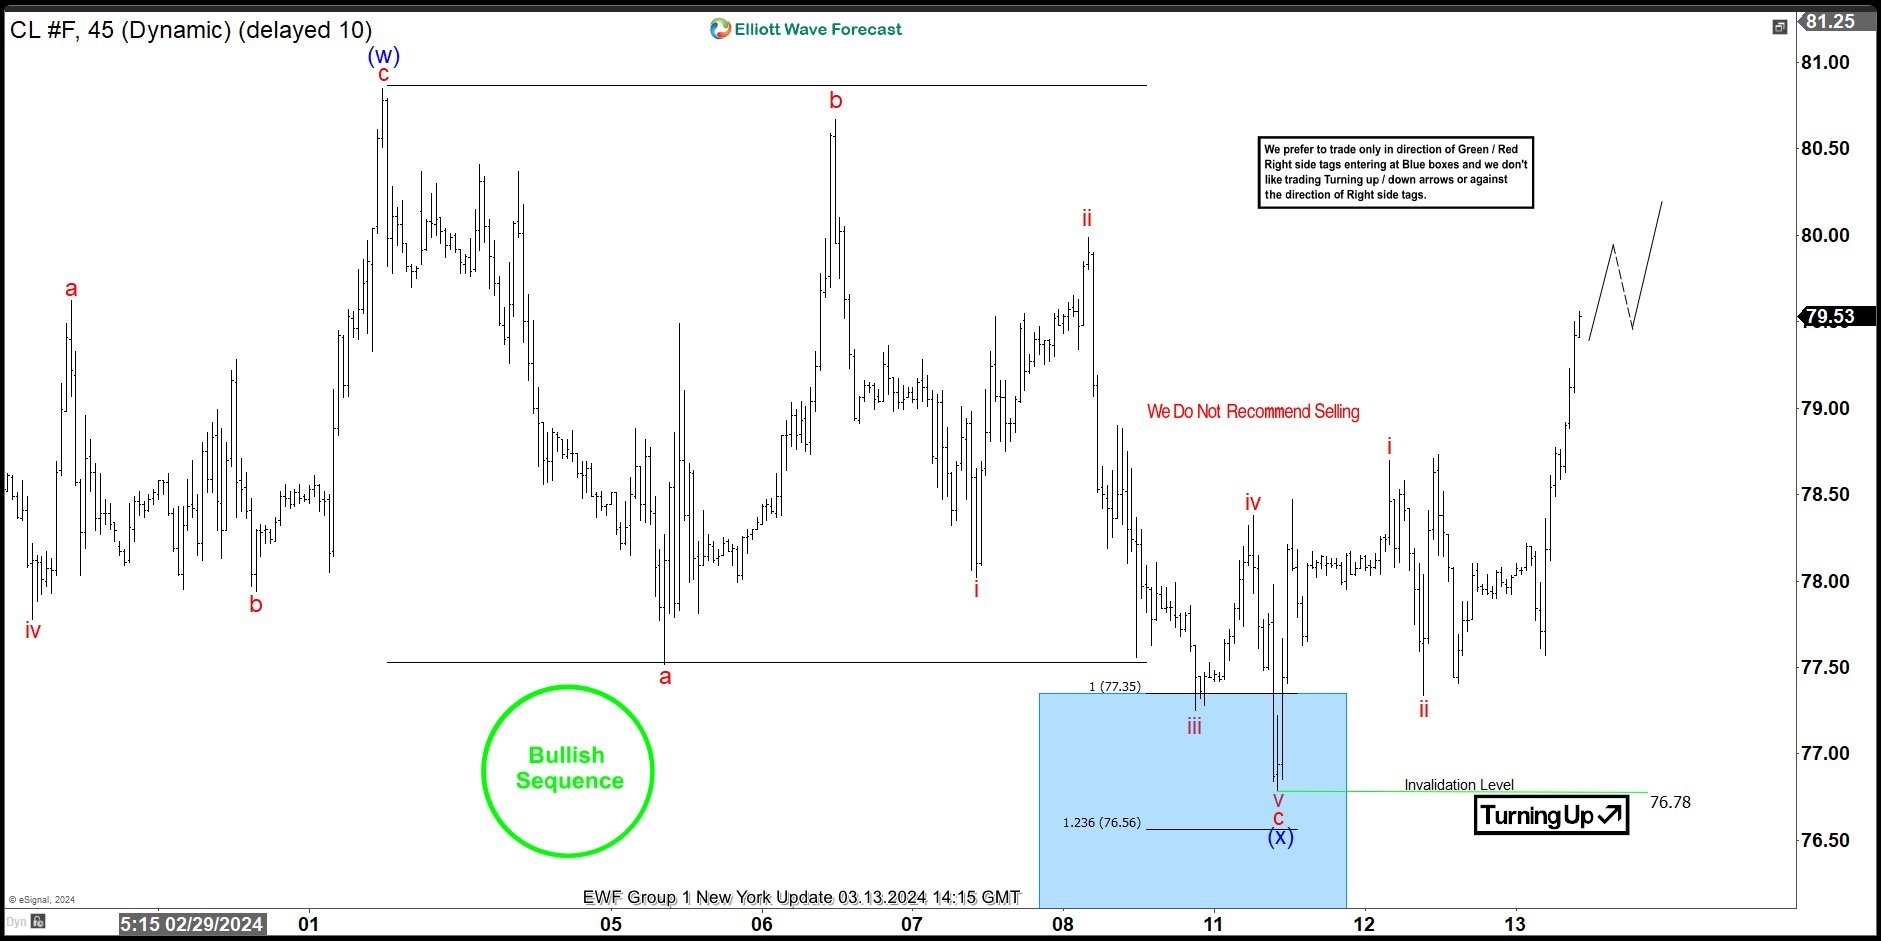
Hello fellow traders. As our members know , Oil has recently given us good buying opportunity . In this technical article we’re going to look at the Elliott Wave charts of Oil published in members area of the website. The commodity shows bullish sequences in the cycle from the 67.75 low. Consequently we have been favoring the long side and recommended members to keep buying the dips in 3,7,11 swings. Oil made clear 3 waves down from the March 1st peak and completed correction right at the Equal Legs zone ( Blue Box Area) . In further text we’re going to explain the Elliott Wave pattern and trading setup.
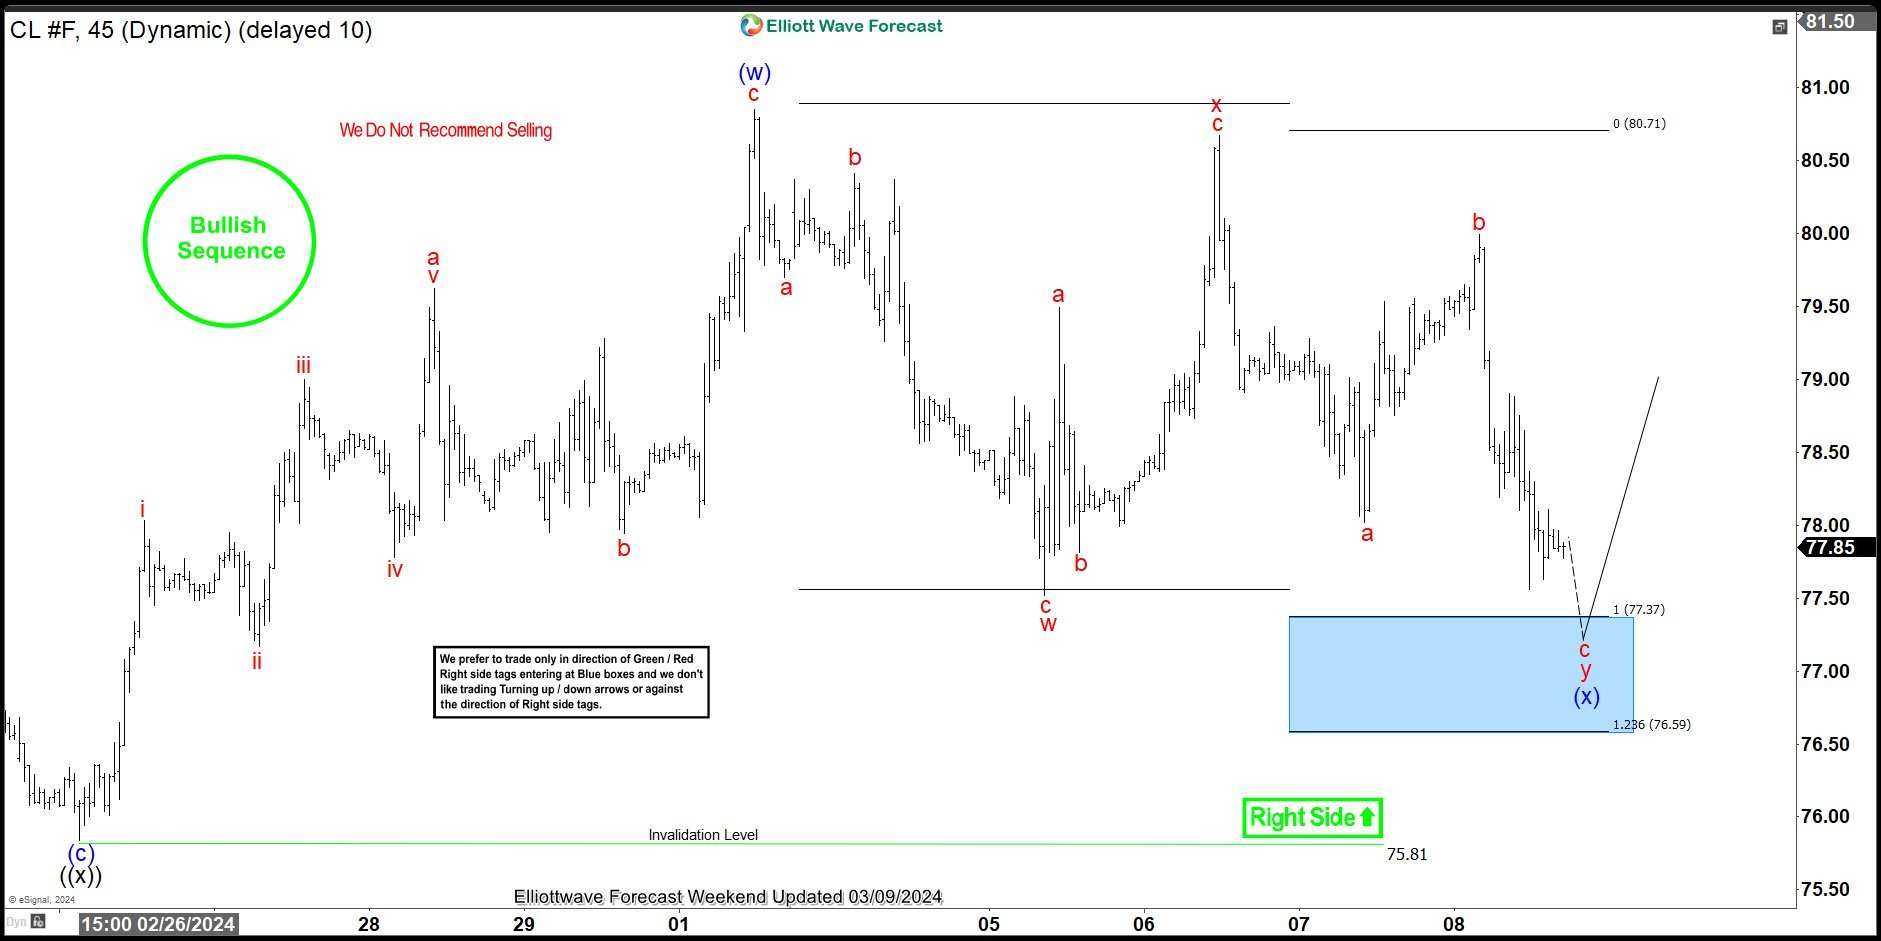
OIL Elliott Wave 1 Hour Chart 03.09.2024
Current view suggests that wave (x) pull back is still in progress , calling for more short term weakness toward 77.37-76.59 area. We don’t recommend selling Oil and prefer the long side from the marked Blue Box ( buying zone). As the main trend is bullish, we expect the price to make at least bounce in 3 waves from the Blue Box area. Once the bounce reaches 50 fibs against the x red connector we will take partial profits and make position risk free ( put SL at BE) .
Official trading strategy on How to trade 3, 7, or 11 swing and equal leg is explained in details in Educational Video, available for members viewing inside the membership area.
Quick reminder on how to trade our charts :
Red bearish stamp+ blue box = Selling Setup
Green bullish stamp+ blue box = Buying Setup
Charts with Black stamps are not tradable. 🚫
OIL Elliott Wave 1 Hour Chart 03.13.2024
The commodity reached our buying zone at : 77.35-76.56 and found buyers as expected. Oil is giving us very good reaction from the Blue Box Area. We call pull back (x) blue completed at the 76.78 low. As a result, any long positions should be risk free by now. We would like to see break of (w) blue peak (March 1st) to confirm next leg up is in progress.
WTI: Oil Prices Continue to Rise on Brighter Demand Outlook
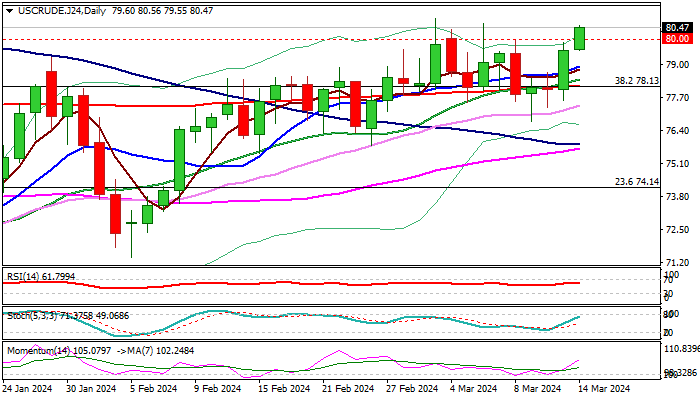
WTI oil price rose further on Thursday, extending gains above psychological $80 barrier and looking for the first daily close above this level since Nov 6.
Near-term bullish sentiment improved after the latest International Energy Agency’s report showed an upward revision to demand growth forecasts and cut in 2024 supply forecast.
The data brightened oil’s near-term outlook and provided fresh tailwind to oil’s prices which rally for the second consecutive day and pressure key barriers at $80.83/$81.3 (2024 high od Mar 1 / 50% retracement of $95.00/$67.70 downtrend).
Technical studies on daily chart show strengthening positive momentum and moving averages in full bullish setup, which adds to bullish outlook.
Daily close above $80 to generate initial bullish signal, with sustained break above $80.83/$81.35 to confirm bullish continuation and unmask target at $84.57 (Fibo 61.8%).
Broken $80 level now offers immediate support, with dips to ideally find ground above rising 10DMA ($78.91).
Caution on failure to close above $80 which would signal extended sideways mode.
Res: 80.83; 81.35; 82.00; 82.21.
Sup: 80.00; 79.55; 78.91; 78.20.