Sample Category Title
Fed Decision: Will the New ‘Dot Plot’ Boost Dollar?
- Fed will announce its latest decision at 18:00 GMT Wednesday
- Almost certain to keep rates steady, so focus will fall on ‘dot plot’
- Signals of fewer rate cuts this year could help the dollar recover
Solid economy pushes back Fed cuts
The US economy continues to defy expectations. Economic growth is on track to hit 2.5% this quarter, juiced by enormous government spending and solid consumer demand.
Labor markets have shown some early signs of loosening lately, but remain tight by historical standards. While the unemployment rate has risen a little, it is still below 4%, and there are no signs of widespread layoffs. Corporate America isn’t hiring so much anymore, but it isn’t firing workers either.
Reflecting this economic resilience, inflation has been persistently hot in recent months. While price pressures have cooled substantially over the past year, the progress has slowed down, with inflation being stickier than investors had hoped. It increasingly seems that the ‘last mile’ in bringing inflation down to its 2% target will be the most difficult part.
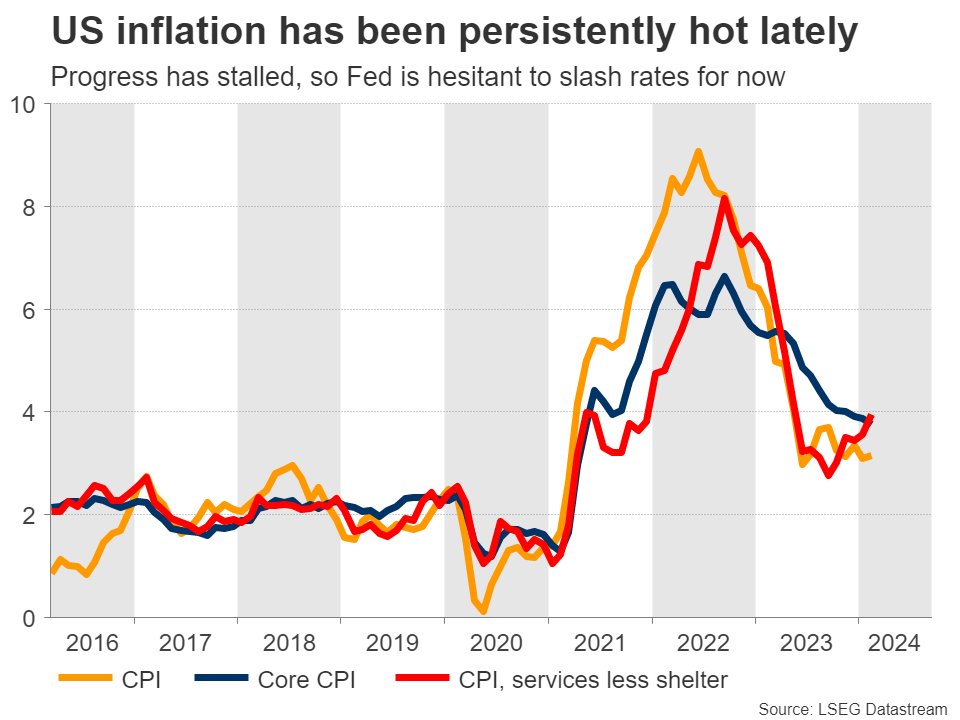
As such, investors have unwound bets of heavy Fed rate cuts. The market is currently pricing in just three rate cuts for this year, down from six a few months ago.
All eyes on the dots
Fed officials are almost certain to keep interest rates unchanged on Wednesday. As such, the market reaction will depend mostly on the updated economic forecasts, the new rate projections in the famous ‘dot plot’, and what Chairman Powell says during his press conference.
Back in December, the Fed signaled three quarter-point rate cuts for this year. Yet, considering that inflation has been hotter than anticipated lately, the risk is that the new ‘dot plot’ points to fewer cuts this year, perhaps just two.
Such an outcome would likely be positive for the dollar, and negative for rate-sensitive assets like gold. That said, any such reaction is unlikely to be huge. Investors know that it’s only a matter of time until rates come down, even if the timeline is pushed back a little.
Taking a look at the dollar/yen chart, a spike higher could propel the market above the 50-day simple moving average (SMA) currently at 148.33, turning the focus towards the 148.70 zone. If buyers slice above it, the next resistance barrier might be the 149.70 region.
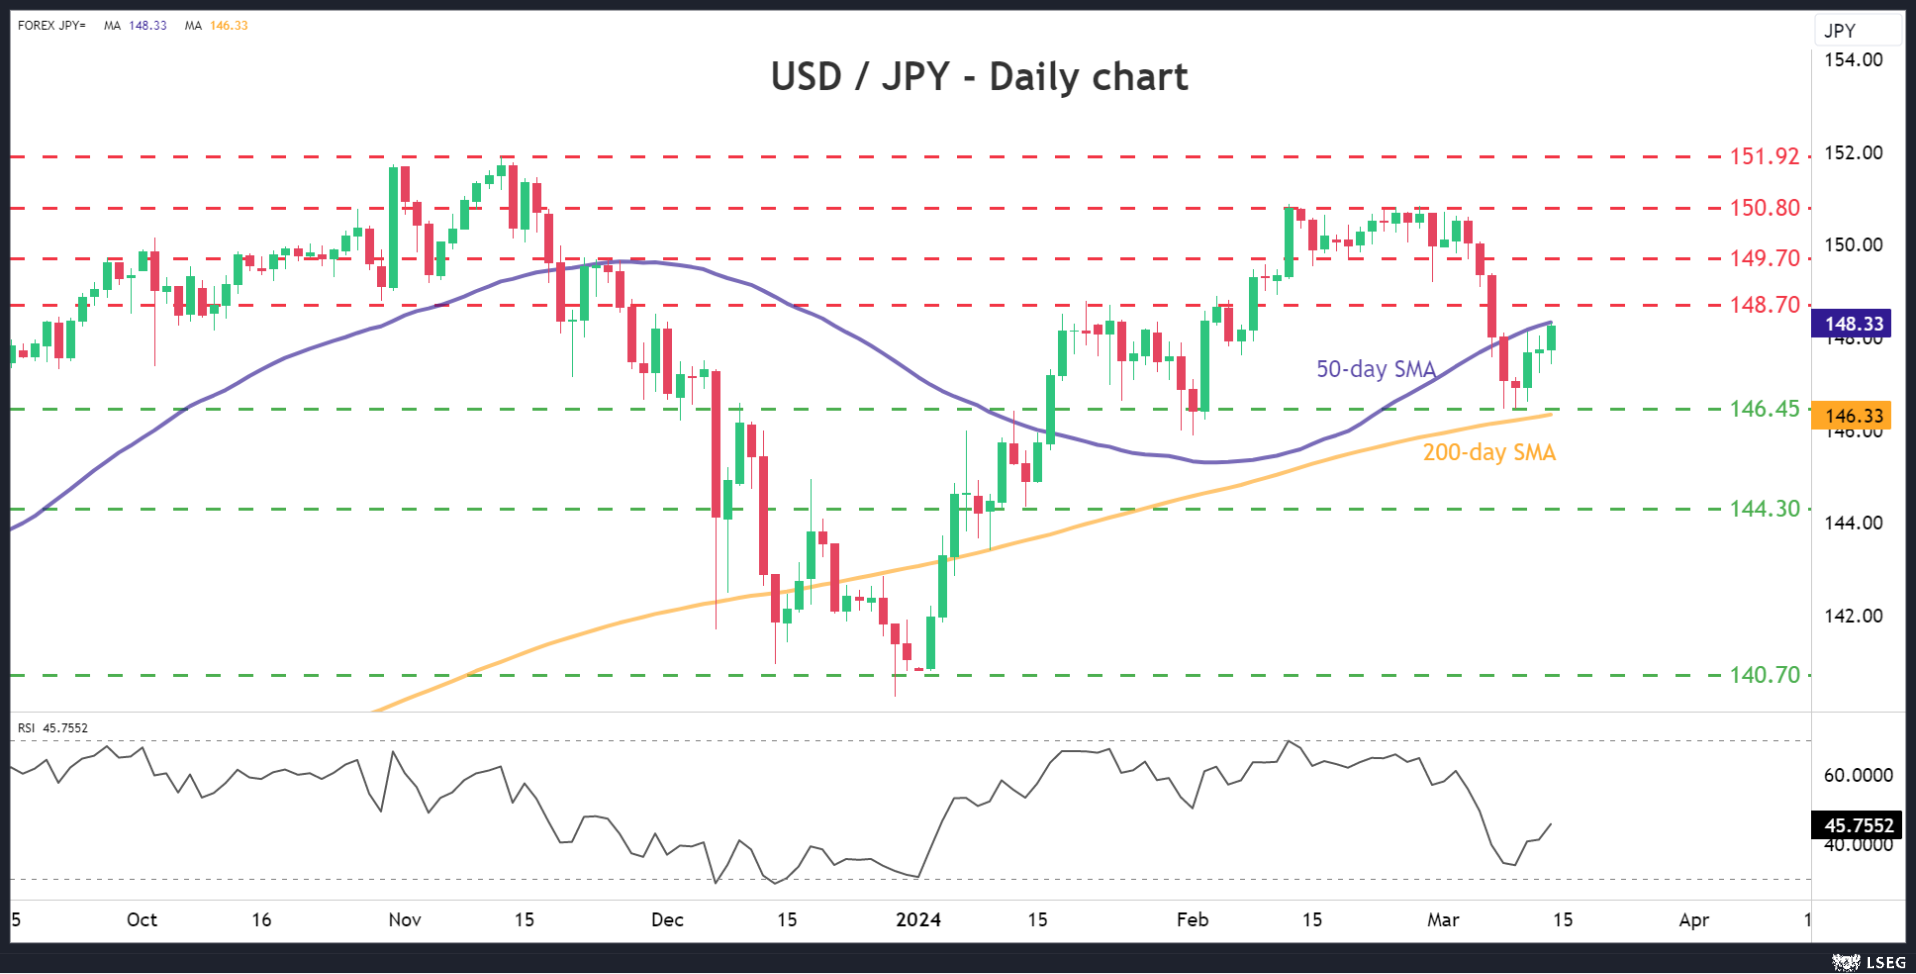
On the flipside, a Fed that keeps the dots unchanged to signal three rate cuts this year could bring ‘relief’ to investors and spark the opposite market reactions. In this case, dollar/yen could drop towards the 146.45 support area, which roughly encapsulates the 200-day SMA as well.
Note that dollar/yen will also be impacted by the Bank of Japan rate decision, which is due early on Tuesday.
What does the dollar need to rally?
All told, the dollar is the second-best performing major currency this year, slightly behind the British pound. That said, the dollar’s gains have not been very impressive, which is strange since the US economy is stronger than most of its competitors, especially in terms of growth.
One element behind the dollar’s inability to truly capitalize on its strong economic fundamentals has been the sanguine tone in stock markets, which has curbed demand for safe haven assets like the dollar.
Therefore, for the dollar to stage a sustainable rally, it might require a correction in high-flying stock markets. If that happens to coincide with a worsening economic outlook in the rest of the world, it would be the dream scenario for the reserve currency.
Looking Beyond the Horizon
The macro outlook is unchanged from our view of recent months. Two years of slow growth could result in economic slack, with inflation ultimately undershooting the RBA’s target. What forces could emerge to offset this?
This week we released fresh forecasts in our Market Outlook publication. The national accounts came in broadly as we expected, and the narrative is unchanged. We continue to expect slow growth in the first half of 2024, with some improvement in the second half of the year. The tax cuts coming from July will help reverse the squeeze on household incomes. Lower inflation will also help restore households’ purchasing power.
The impending tax cuts can be seen as largely restorative and a necessary rebalancing. The share of household income going to income tax payments was exceptionally high in the second half of 2023. Without the give-back inherent in these tax cuts, that tax take would continue to increase and the drag on growth in household disposable income would continue.
Likewise, the cuts in interest rates that we expect later in the year could be regarded as restorative. Monetary policy is currently restrictive. If a restrictive stance of policy is maintained for long enough, inflation continues to decline and ultimately exits the target range on the low side. Some normalisation of policy will therefore need to happen at some point.
Even with these pivots in policy, if our forecasts or something like them turn out to be true, Australia will have had two consecutive years of output growth around 1½% – the 1.5% result over 2023 and (we expect) 1.6% over 2024. This is well below trend. It is also well below the population growth recorded over 2023 and still a little below our expectations for population growth in 2024. Unemployment will be rising, wages growth slowing, and the economic experience of households more broadly will still be uncomfortable.
According to Westpac Economics’ forecasts, Australia will end this year with the unemployment rate at 4½%. As the RBA has emphasised recently, there is more to achieving full employment than just the unemployment rate. The sustainable rate of labour market slack – including unemployment – that keeps growth in labour costs stable and consistent with inflation at target, is not directly observable. But as best as anyone can tell, a 4½% unemployment rate is likely to be a little above this sustainable level. Some evidence for this assessment can be seen in the tipping over in growth in the leading edge of wage determination, individual agreements, already evident with an unemployment rate around 4%. If this assessment is correct, at least some parts of the domestic economy will be exerting downward pressure on inflation over the period ahead, and especially from 2025.
Looking beyond 2025, then, there is a risk that – without at least a period of above-trend growth and falling unemployment – domestic inflation continues to fall. The gap between actual unemployment (implied in our forecasts) and the full-employment level of labour market slack will be small, however, and hard to detect in the data. If it is indeed a gap, though, there will be a tendency for inflation to undershoot the RBA’s target beyond 2025.
When we look beyond 2025, the question therefore arises: what forces would bring about a period of above-trend growth to eliminate emerging economic slack and allow inflation to stabilise?
One obvious possibility would be that the RBA ends up reducing the cash rate to a level that is mildly stimulatory, rather than converging to a more neutral stance as is often assumed. This might not be a conscious strategy. Rather, the RBA might end up there simply because neither they nor anyone else knows exactly where the ‘neutral’ cash rate is. In feeling their way to neutral in the face of fiscal headwinds and labour market slack, they might end up a little below where neutral actually is.
In this context, one can interpret the Westpac Economics forecast for the cash rate at the end of 2025 of 3.1% as either neutral, with a neutral real rate a bit below 1%, or slightly below neutral with a higher neutral real rate. Given the uncertainties around both the outlook and the level of the neutral rate in any one period, we are agnostic about which interpretation turns out to be the right one. It might be that one will never be able to tell the difference.
Another alternative way for a period of above-trend growth to occur is that business investment might pick up. Our forecasts for business investment growth over 2024 and 2025 are running ahead of GDP growth for the same periods, but not enough to drive a period of above-trend output growth overall.
One scenario that would spur a further pick-up in this space would be a concerted response to the climate challenge, perhaps starting in 2026. The considerable required investment in renewable energy generation and transmission would be a large part of this. Other areas that could be involved would be the electrification of the commercial vehicle fleet and rail network, and development of biofuel alternatives for the legacy stock of internal combustion engine vehicles. The energy efficiency of buildings and building materials are another aspect of the transition, especially considering the elevated rate of non-residential building and infrastructure work underway.
The rest of the world will also be highly engaged in energy transition and climate mitigation. It is therefore possible that global investment is elevated in the period ahead, relative to the years between the Global Financial Crisis and the pandemic. This has implications for the likely structure of interest rates globally in coming years. Recall that the so-called ‘neutral’ risk-free interest rate is simply the rate that balances global saving and global investment. It is an outcome of the system, not something imposed as an external force. If desired global investment picks up relative to the pre-pandemic period, for climate or other reasons, that would tend to lift the rate that produces that equilibrium.
The deeper question is whether bond markets, and fiscal authorities, have planned for that possibility.
Cliff Notes: Fading Inflation Risks
Key insights from the week that was.
In Australia, market participants were left with little to dissect this week. The latest NAB business survey pointed to the domestic economy remaining weak in late February, the detail of the survey broadly consistent with last week’s Q4 2023 National Accounts. Although business conditions rose to +10 in February, on a multi-month view the index continues to trend lower, consistent with modest but persistent declines in forward orders over the past ten months. Against this backdrop, businesses are circumspect on the outlook, with confidence fragile for much of the past year. More positively, the deceleration in upstream price pressures is ongoing, final product prices tracking a modest 1.2% rise for the March quarter.
Next week, the RBA Board will meet to discuss recent economic data, including the Q4 National Accounts and Wage Price Index, to decide whether it warrants a shift in policy. Our view is that the RBA will be comforted by recent developments, given the Board’s aim to bring demand back into line with supply and ensure inflation continues to trend toward and then into the target range. We continue to expect the RBA to remain on hold until September at which time they should have enough confidence in the inflation outlook to slowly begin easing policy.
In this week’s essay, Chief Economist Luci Ellis looks beyond the end of our current forecast horizon to consider some of the factors that will determine growth and inflation from 2026. Critical will be the stance of monetary policy and the degree of labour market slack. Also important to the state of the economy is work related to the green transition.
Over in the US, February’s CPI came in a touch firmer than expected at 3.2%yr. The shelter component once again drove the increase, however. Excluding shelter, on both a 6-month annualised and annual basis, inflation is consistent with the FOMC's 2% inflation target. Clear from the detail of the report is that demand-side inflation has successfully been reigned in, leaving only supply-side pressures which monetary policy has little-to-no impact on, at least in the near term. For housing in particular, it is investment that is needed to ease price pressures; this is unlikely while interest rates are contractionary and the outlook for the labour market uncertain.
Retail sales again signalled that consumer demand is waning, February’s 0.6% gain below expectations and only a partial offset to January's downwardly revised 1.1% decline. The control group, which excludes volatile items like fuel, was flat, also below expectations. While inflation has essentially come back to target, the cumulative change in the cost of living since the beginning of the pandemic is substantial and unlikely to be made up by real income gains in the near term. Consumption growth is likely to be materially weaker in 2024 and 2025 than was the case in 2023. Our latest edition of Market Outlook provides key forecasts for Australia, the US and the world.
Finally to Japan, where Q4’s initial 0.1% contraction (the second in a row, signalling recession) was revised away on stronger business investment. In the revised figures, capital expenditure rose 2% in Q4 compared to the 0.1% decline initially reported. This put Q4 GDP growth at 0.1%qtr after a 0.8%qtr decline in Q3. Still, household consumption remains weak having declined over the last three quarters, a time when consumers benefitted from historically high wage growth. It is hard to see evidence of a virtuous cycle of wages, consumption and inflation beginning. As such, the Bank of Japan will want to remain patient with policy, waiting to see how inflation and wage outcomes develop beyond this year's wage decisions before moving their policy rates materially above zero.
WTI Wave Analysis
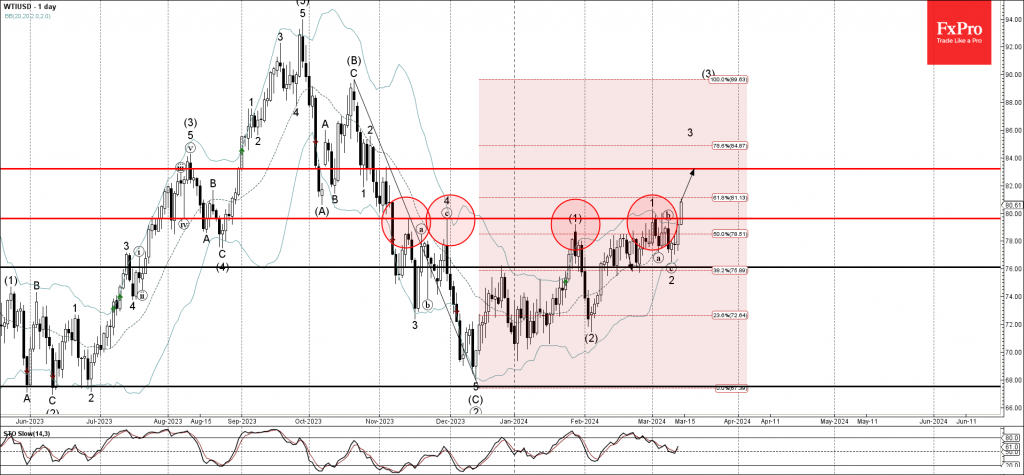
- WTI broke resistance level 80.00
- Likely to rise to resistance level 83.20
WTI crude oil recently broke the round resistance level 80.00 (which has been reversing the price from November).
The breakout of the resistance level 80.00 coincided with the breakout of the 50% Fibonacci correction of the previous sharp downward impulse wave (C) from October.
Given the deterioration of the global risk sentiment, WTI crude oil can be expected to rise further toward the next resistance level 83.20.
ETHUSD Trades Flat in Dencun Upgrade Aftermath
- ETHUSD trades sideways in the past few sessions
- Fails to capitalise on completion of Dencun upgrade on Wednesday
- Momentum indicators ease but do not exit overbought zones
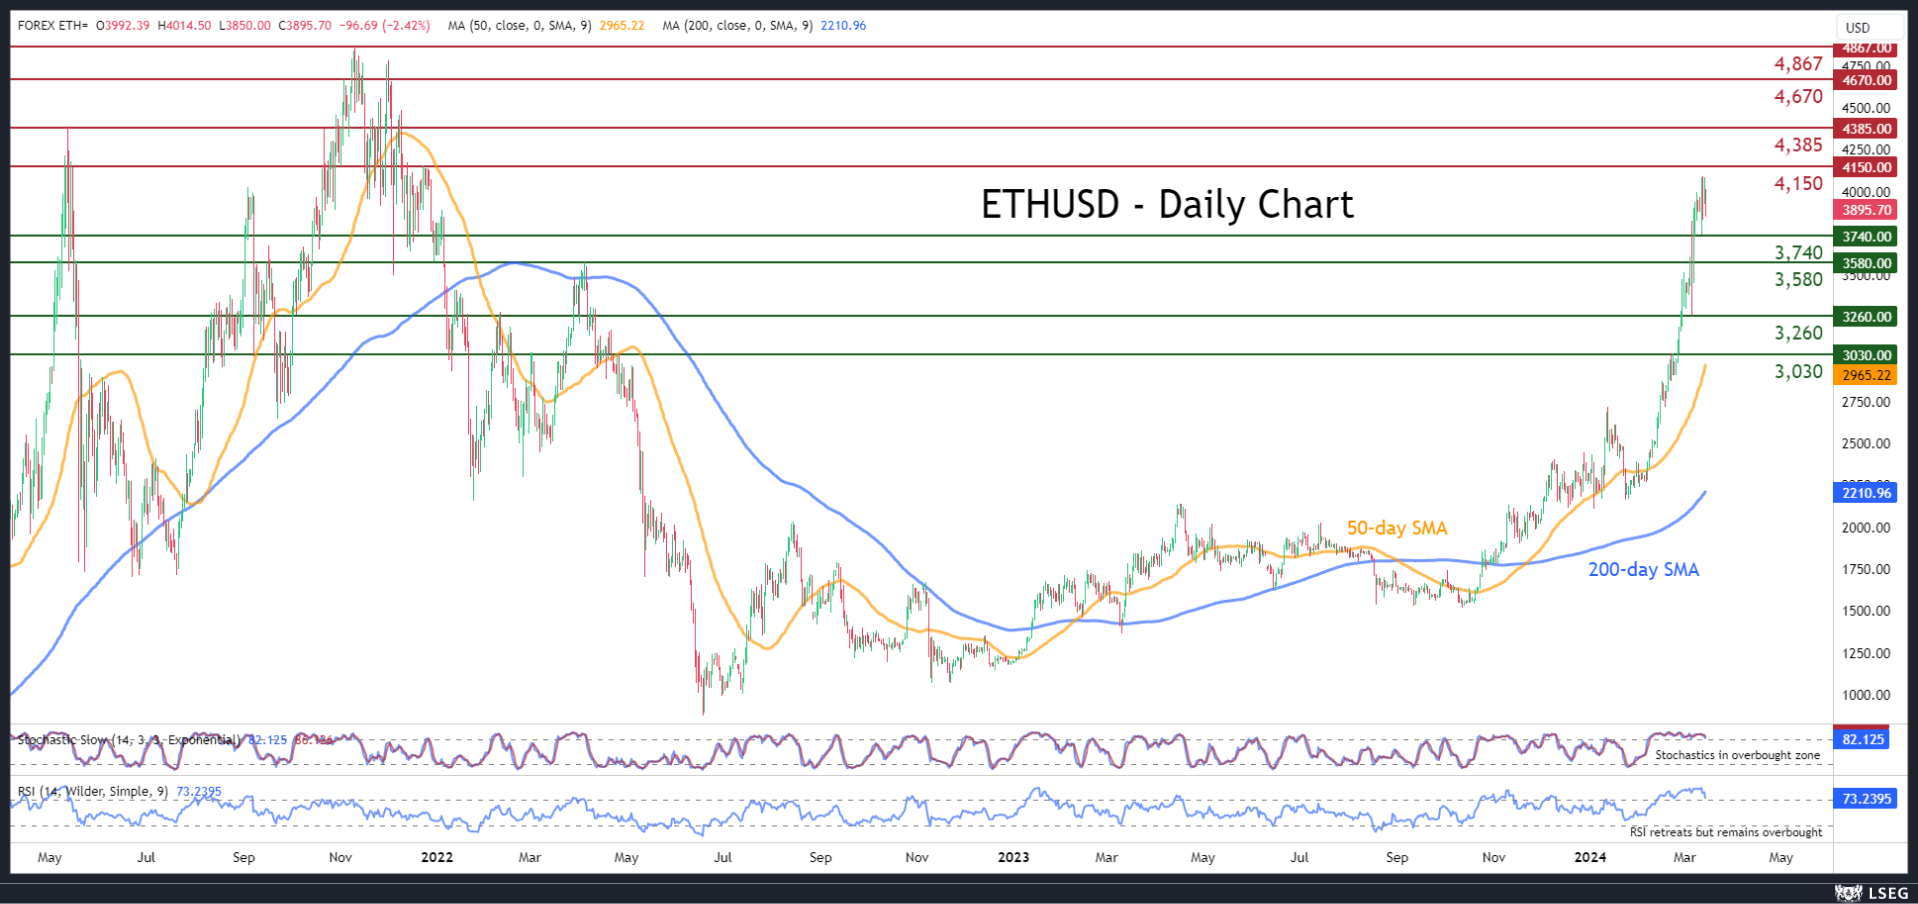
ETHUSD (Ethereum) has been in a steep uptrend in 2024, surging to consecutive multi-month highs. However, the leading altcoin seems to be consolidating in the past few sessions despite the successful completion of the Dencun upgrade as it has been repeatedly repelled a tad below the 4,100 mark.
Should bullish pressures fade, the price might reverse towards the recent support of 3,740. Further declines could then cease at the April 2022 resistance of 3,580, which could serve as support in the future. Failing to halt there, the price may challenge the March 2024 support of 3,260.
On the flipside, bullish actions could propel the price to fresh multi-month peaks, where the December 2021 resistance of 4,150 could curb initial upside attempts. Conquering that barrier, the bulls may attack the May 2021 high of 4,385. A violation of that region could pave the way for the November 2021 resistance of 4,670.
Overall, ETHUSD has been struggling to extend its series of multi-month highs despite the recent positive idiosyncratic developments. Is the price headed towards a pullback?
Sunset Market Commentary
Markets
ECB’s Stournaras this morning hijacked the headlines. The Greek governor said rates need to be cut soon: twice before the summer break (in August) and twice before the end of the year. He expects the first one to happen in June. Dutch hawk Knot sided with his Greek colleague insofar he is penciling in June for the kick-off. He refrained from giving guidance for the meetings thereafter though. Chief economist Lane held a more neutral approach, sticking to Lagarde’s message last week that a lot more data (including about wages) will be available at this potentially pivotal June meeting. While calls for ECB cuts in 2024 grow louder and bolder, a different scenario is panning out in front of the Fed. February producer price inflation easily topped forecasts across the board. The headline figure came in at 0.6% m/m, double the 0.3% consensus. The narrowest core gauge (ex. food, energy and trade) rose 0.4%. Year-on-year readings (between 1.6% - 2.8%) added more evidence to a bottoming out process that started somewhere end of last year. Weekly jobless claims meanwhile surprised to the downside. Applications for unemployment benefits last week dropped to a low 209k, from a downwardly revised 210k. Retail sales in February didn’t live up to expectations to more or less overcome the January dip. But with the broader (labour market) picture nicely intact, that didn’t prevent core bond yields from adding between 4.4 and 8.6 bps in the US. The 2-y and 10-y yield are single-digit bps away from their YtD highs. German yields add 2.6 (2-y) to 5.3 (10-y) bps in sympathy though one starts to wonder how much longer the front-end can join the US trend when ECB members continue to talk so openly about cuts. Either way, most tenors in Germany are also closing in on their YtD highs.
The dollar, for the first time since long, finally starts profiting from favourable interest rate differentials and a weakish risk environment (stocks slightly down in the US). EUR/USD slips from an intraday high of 1.0955 to currently test the 1.09 big figure. DXY (trade-weighted) found support at the 50% retracement on the December-February rebound (102.8) before moving beyond 103. USD/JPY and EUR/JPY parted ways with the former rising to 148 but the latter easing a few ticks to 161.5. The Japanese newspaper Jiji reported the BoJ is poised to end negative rates at its meeting next week, though adding that tomorrow’s wage negotiation results play a key role in the final decision. Sterling holds the upper hand against most G10 peers, including the euro (but not the USD). EUR/GBP snapped a three-day winning streak by erasing yesterday’s gains (0.8541).
News & Views
Swedish inflation rose by 0.2% on a monthly basis, both at the top level and the underlying one. Markets anticipated increases by 0.4% and 0.3% respectively. Headline inflation slowed more than expected on an annual level (4.5% from 5.4% vs 4.7% consensus) and for the core gauge using fixed interest rates for household mortgages (CPIF; the Riksbank’s preferred one): 3.5% from 4.4%. That’s less than the Swedish central bank predicted back in November (3.7%). Lower electricity prices contributed to decreased housing costs according to Statistics Sweden. Actual rents for housing still rose though. Furthermore, there were seasonally normal price rises for clothing. There were also price increases in fuel, recreational and cultural services, as well as for restaurant and hotel visits. Today’s data strengthen the Riksbank’s message that they will start cutting their policy rate in the first half of the year. The Swedish krone underperforms today with EUR/SEK rising to 11.23 following an intensive test of 11.14 support at the end of last week.
The International Energy Agency changed its view on this year’s oil availability. They now join OPEC+’s warning of an oil supply deficit throughout the year. The IEA upped its world oil demand growth forecasts by 110k barrels to 1.3mn b/day on a stronger US outlook and increased demand for ship fuel over problems in the Panama canal (climate) and the Suez canal (Houthi attacks). Simultaneously they now believe that OPEC+ could continue output cuts in the second half of the year. Brent crude prices rise for a second straight session, taking out $85/b for the first time since the end of October of last year.
Silver Bulls Return With a Bang
- Silver marks new higher highs in the year to date
- Some caution required as former resistance area is nearby
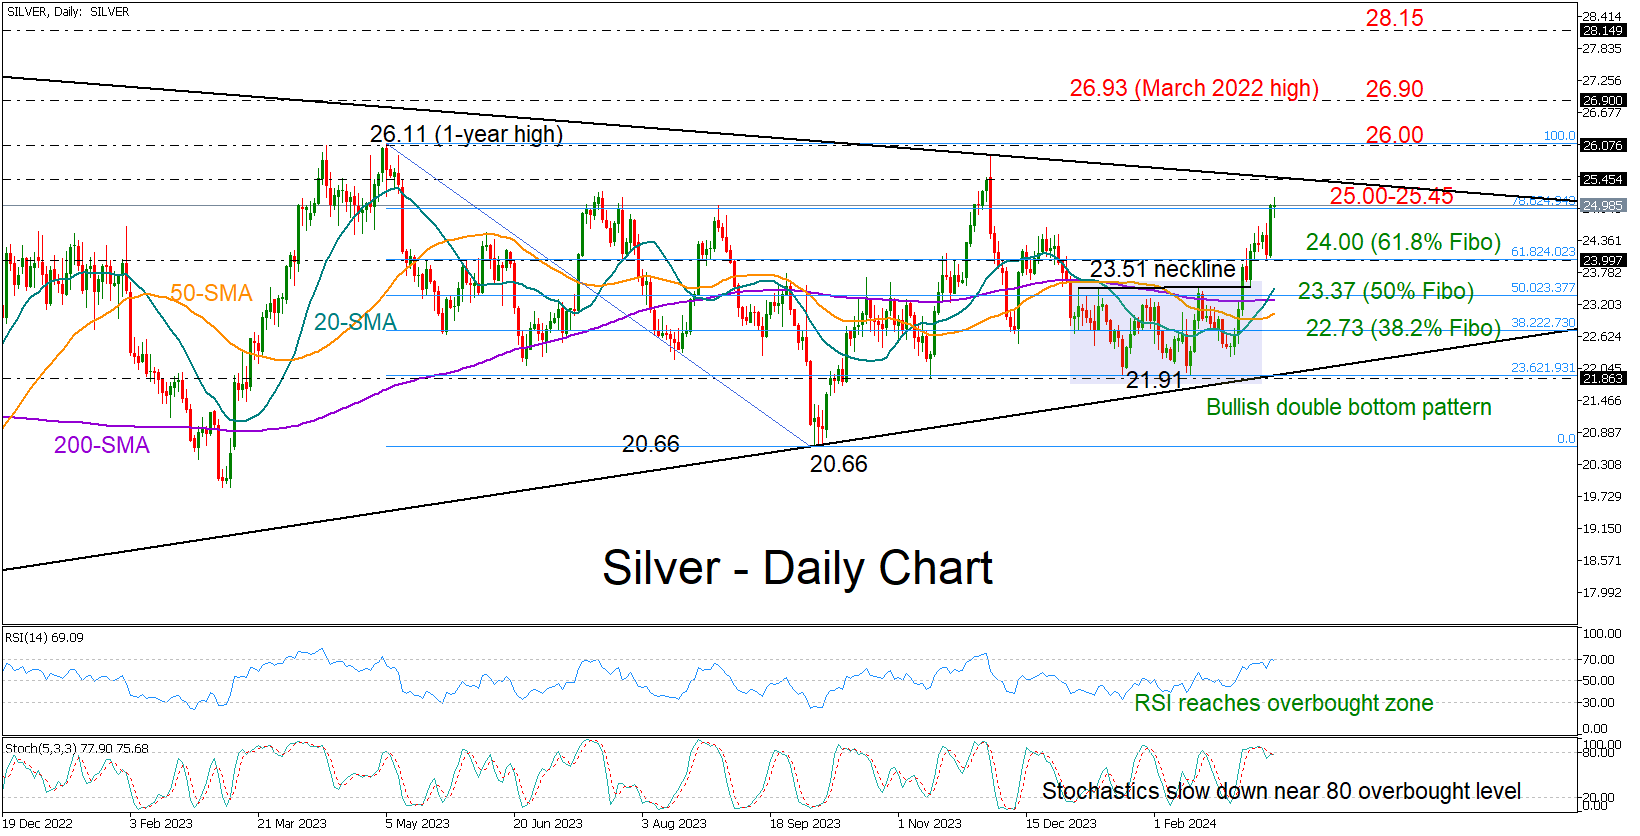
Silver bulls roared back during Wednesday’s late European trading hours, with the metal soaring to a more-than-three month high of 25.14 before closing marginally below the 25.00 round level.
The completion of a double bottom pattern around the 21.91 floor led to a bullish explosion, as the price advanced above the neckline of 23.51. While the bullish market structure in the short-term picture is still solid, the overbought signals coming from the RSI and the Stochastic oscillators suggest that upside pressures might soon lose steam.
The presence of the descending line, linking the 2021 and 2023 highs, could create downward pressure at 25.45, hindering any potential rise to the crucial 26.00 psychological level. Note that the metal has been attempting to close above the latter without success since the summer of 2021. Hence, if bullish efforts prove fruitful this time, the price might gear up to the 2022 high of 26.90 and then push towards the 28.15 barrier from May 2021.
If the price gets rejected near the 25.00 threshold, it may revisit the 61.8% Fibonacci retracement of the May-October 2023 downleg at 24.00. Failure to pivot there could see a bearish continuation towards the 50% Fibonacci of 23.37 and then an extension to the 38.2% Fibonacci of 22.73. The tentative support trendline, which joins the September 2022 and October 2023 lows, could cause bigger damage to the market if violated around 21.93.
Summing up, silver has experienced strong progress over the past two weeks, though a major resistance area is still overhead, questioning whether the metal will manage to violate its neutral 2023 pattern above 26.00.
U.S. Retail Sales Rebound in February
Retail sales rose 0.6% month-on-month (m/m) in February, reversing most of January's -1.1 % decline (revised from -0.8% previously). This was lower than the consensus forecast calling for slightly stronger growth of 0.8%.
Trade in the auto sector was up 1.6% m/m, reflecting an increase in sales at motor vehicle dealers (1.8%) which was partly offset by a decline in automotive parts and accessory stores (-0.5%).
Sales at gasoline stations broke four consecutive months of decline, rising by 0.9% m/m. This largely reflected an uptick in gas prices. The building materials and equipment category rose by a notable 2.2% m/m.
Sales in the retail sales "control group", which excludes the above volatile components (autos, building materials and gas) and is used to estimate personal consumption expenditures (PCE) was flat on the month after falling by -0.3% m/m in January (revised from -0.4% previously).
- Among the control group, positive contributions came from miscellaneous store retailers (0.6% m/m), department stores (0.4%) and food and beverage stores (0.1% m/m). Sales at sporting goods stores were flat on the month.
- All the remaining categories registered declines. Clothing and accessory stores registered the largest decline of -0.5% m/m.
Food services & drinking places – the only services category in the retail sales report – rose by 0.4% m/m.
Key Implications
Retail spending was back in positive territory in February, after a sizeable decline to start the year. Higher borrowing costs and elevated prices are challenging households but spending is still being fueled by a robust job market and rising wages. However, as the labor market cools and wage gains abate, spending should moderate. With two months of data in for the quarter, consumer spending is currently tracking 2.7% q/q (annualized) for Q1.
The pick-up in retail spending is unlikely to be good news for policymakers at the Federal Reserve. The recent flip in core goods prices from deflation to price growth makes continued buoyant retail sales even more of a challenge to the Fed's inflation targeting objective. The current near-term headwinds, from both inflation and spending, are likely to keep the Fed on the sidelines for a bit longer as they continue to monitor inflation's progress to target.
USD/JPY Mid-Day Outlook
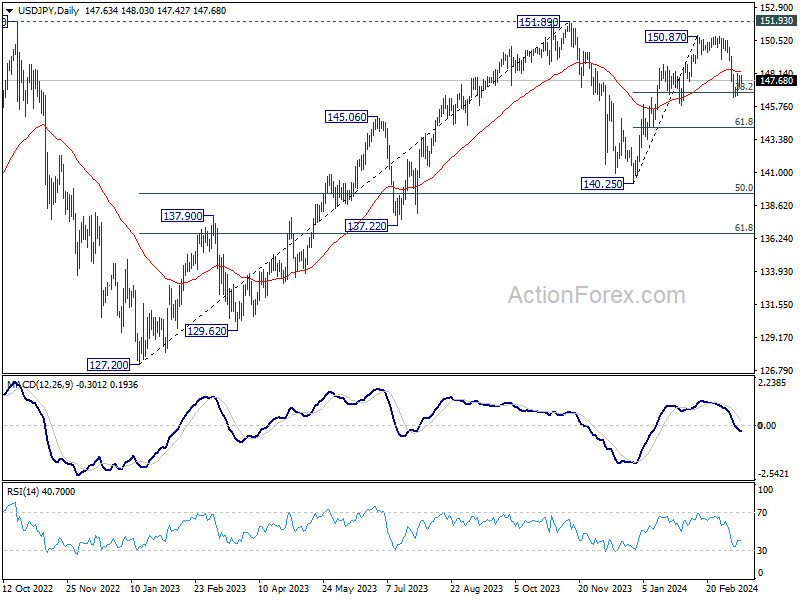
Daily Pivots: (S1) 147.31; (P) 147.68; (R1) 148.12; More...
Range trading continues in USD/JPY and intraday bias stays neutral. On the downside, sustained break of 38.2% retracement of 140.25 to 150.87 at 146.81 will argue that fall from 150.87 is reversing the whole rally from 140.25. In this case, deeper decline would be seen to 61.8% retracement at 144.30 and below. Nevertheless, strong support from 146.81, followed by break of 148.29 minor resistance resistance, will argue that fall from 150.87 is merely a correction, which has completed already. Retest of 150.87 should be seen next.
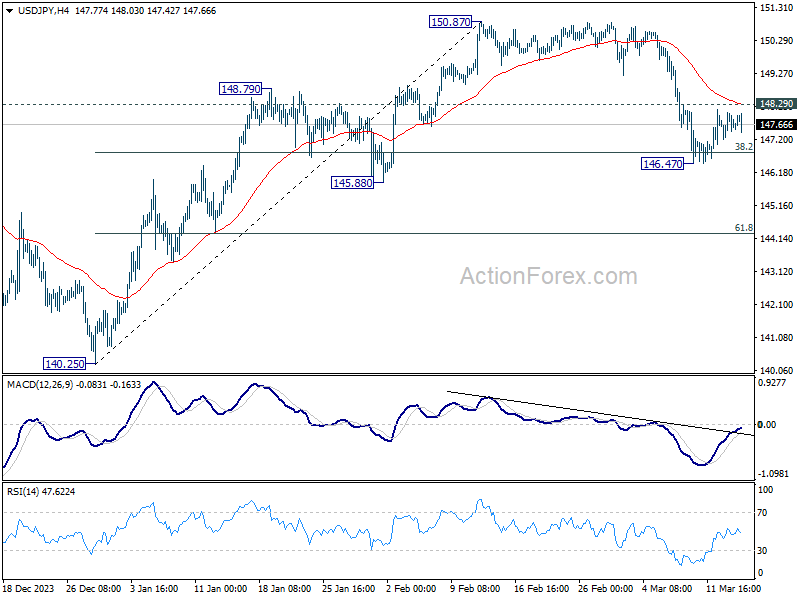
In the bigger picture, no change in the view that price action from 151.89 (2023 high) are correction to up trend from 127.20 (2023 low). The question is whether this correction has completed at 140.25, or extending with fall from 150.87 as the third leg. Sustained break of above mentioned 146.81 fibonacci level will favor the latter case. But even so, downside should be contained by 50% retracement of 127.20 to 151.89 at 139.54.