Sample Category Title
GBP/USD Daily Outlook
Daily Pivots: (S1) 1.2715; (P) 1.2769; (R1) 1.2807; More...
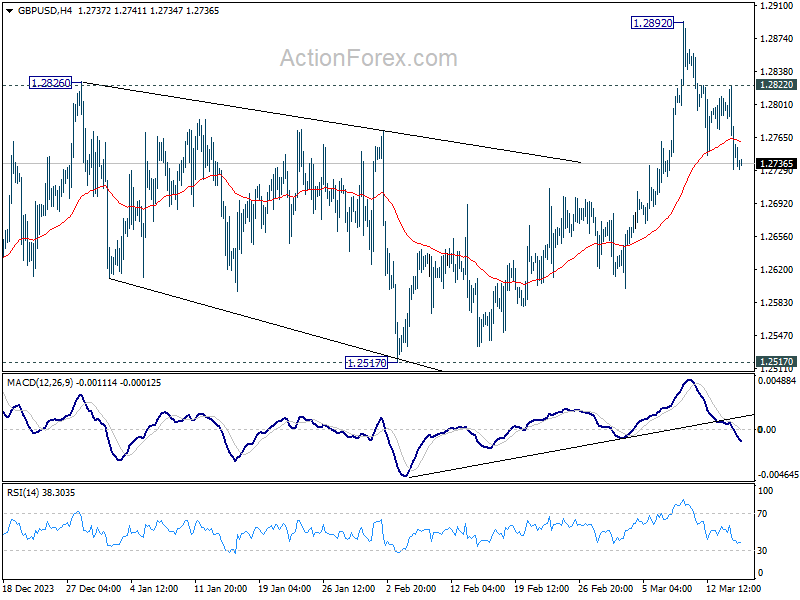
GBP/USD's break of 55 4H EMA (now at 1.2760) indicates short term topping at 1.2829. Intraday bias is back on the downside for 55 D EMA (now at 1.2673). Sustained break there will target 1.2517 structural support next. For now, risk will stay mildly on the downside as long as 1.2822 minor resistance holds, in case of recovery.
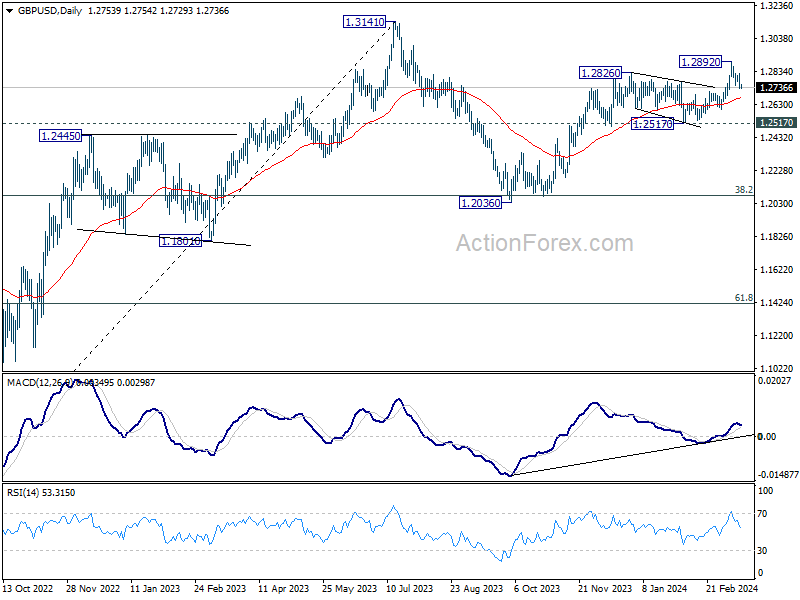
In the bigger picture, price actions from 1.3141 medium term top are seen as a corrective pattern to up trend from 1.0351 (2022 low). Rise from 1.2036 is seen as the second leg, which is still in progress. But upside should be limited by 1.3141 to bring the third leg of the pattern. Meanwhile, break of 1.2517 support will argue that the third leg has already started for 38.2% retracement of 1.0351 (2022 low) to 1.3141 at 1.2075 again.
USD/CHF Daily Outlook
Daily Pivots: (S1) 0.8795; (P) 0.8819; (R1) 0.8862; More....
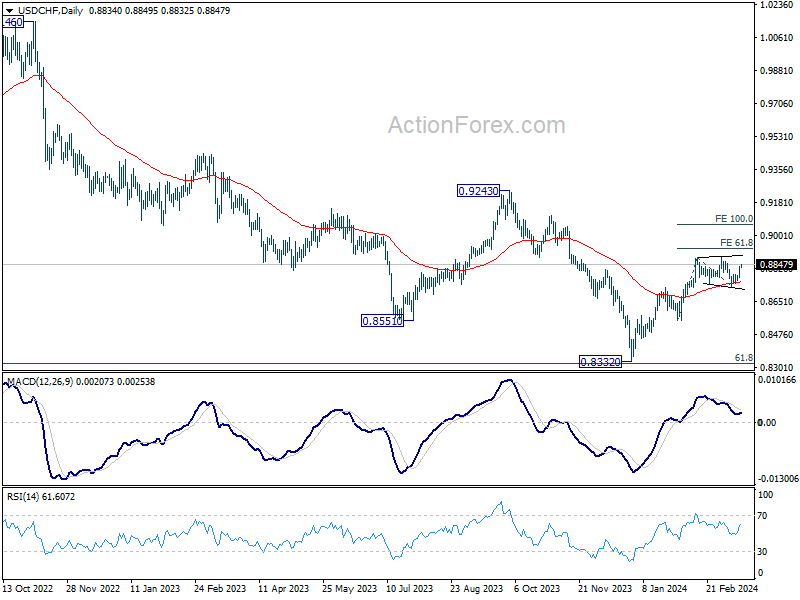
Current strong rebound in USD/CHF argues that consolidation pattern from 0.8884 has completed with three waves to 0.8728. Intraday bias is mildly on the upside for 0.8891 resistance first. Firm break there will resume whole rise from 0.8332. Next target is 61.8% projection of 0.8550 to 0.8884 from 0.8728 at 0.8934. For now, this will remain the favored case as long as 0.8728 support holds, in case of retreat.
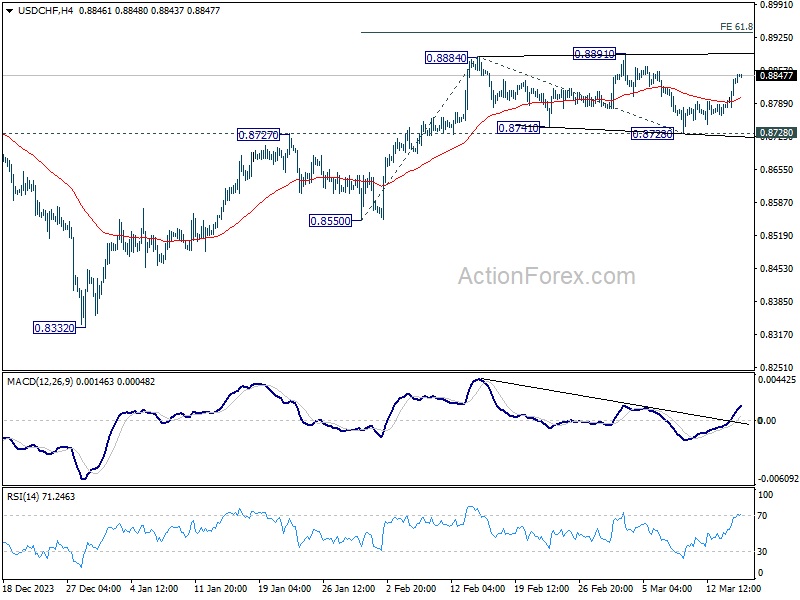
In the bigger picture, price actions from 0.8332 medium term bottom as seen as developing into a corrective pattern to the down trend from 1.0146 (2022 high). Further rise would be seen as long as 0.8555 support holds. But upside should be limited by 0.9243 resistance, at least on first attempt.
USD/JPY Daily Outlook
Daily Pivots: (S1) 147.71; (P) 148.04; (R1) 148.63; More...
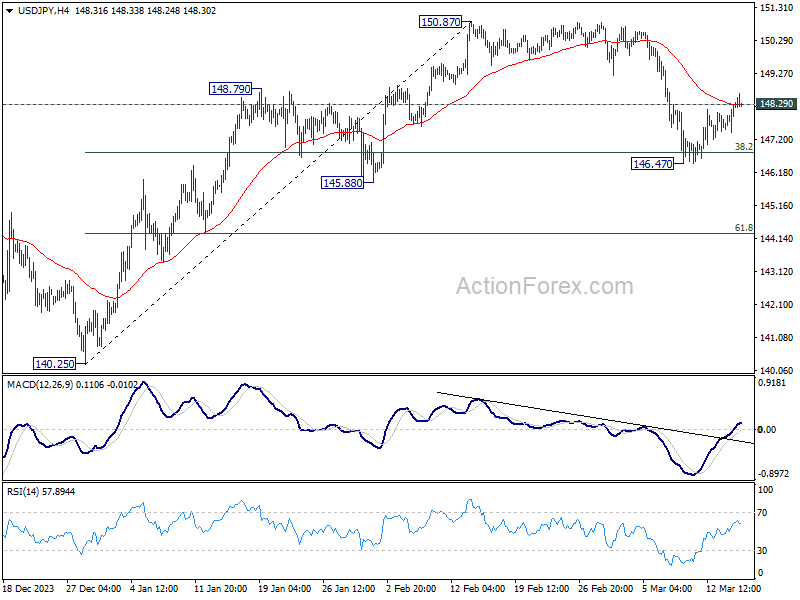
USD/JPY's break of 148.29 minor resistance argues that fall from 150.87 is merely a correction, and has completed at 146.47. Intraday bias is back on the upside for retesting 150.87. Nevertheless, on the downside, break of 38.2% retracement of 140.25 to 150.87 at 146.81 will argue that fall from 150.87 is reversing the whole rally from 140.25. In this case, deeper decline would be seen to 61.8% retracement at 144.30 and below.
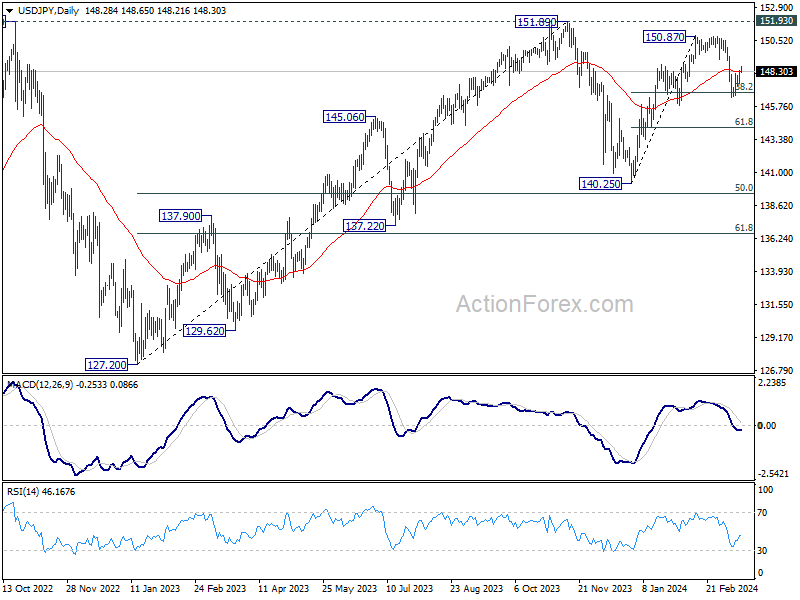
In the bigger picture, no change in the view that price action from 151.89 (2023 high) are correction to up trend from 127.20 (2023 low). The question is whether this correction has completed at 140.25, or extending with fall from 150.87 as the third leg. Sustained break of above mentioned 146.81 fibonacci level will favor the latter case. But even so, downside should be contained by 50% retracement of 127.20 to 151.89 at 139.54.
USD/CAD Daily Outlook
Daily Pivots: (S1) 1.3482; (P) 1.3511; (R1) 1.3563; More...
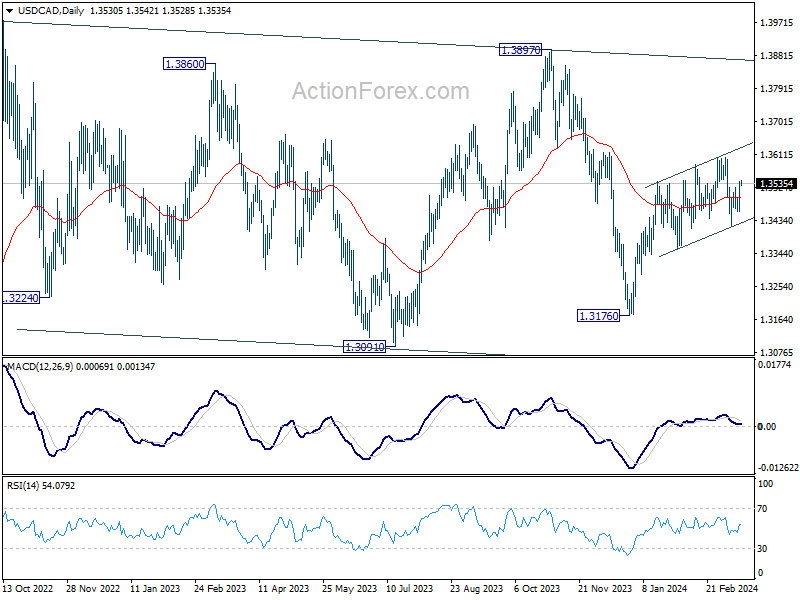
USD/CAD's break of 1.3524 minor resistance suggests that pull back from 1.3605 has completed at 1.3419 already. Also, rise from 1.3176 is in progress. Intraday bias is back on the upside for retesting 1.3605 resistance first. Firm break there will resume whole rally from 1.3176. On the downside, however, break of 1.3458 minor support will turn bias back to the downside or 1.3419 instead.
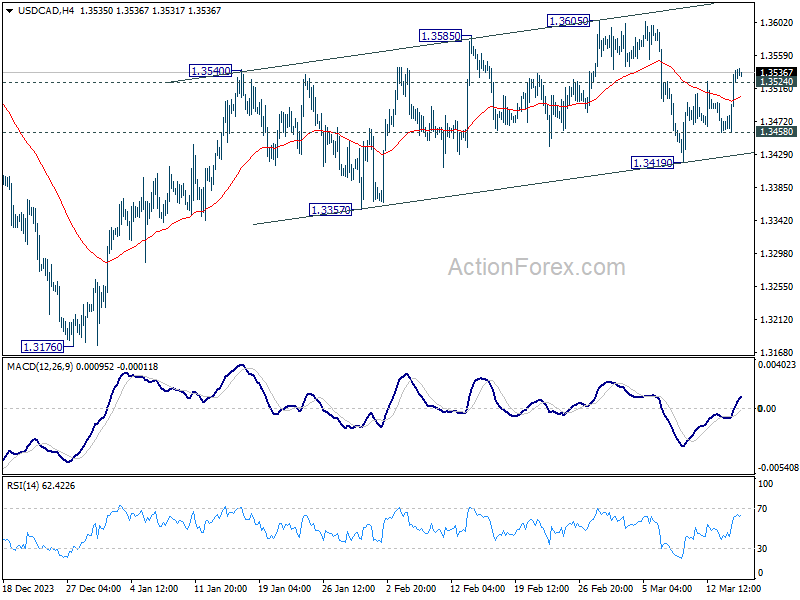
In the bigger picture, price actions from 1.3976 (2022 high) are viewed as a corrective pattern only. In case of another fall, strong support should emerge above 1.2947 resistance turned support to bring rebound. Overall, larger up trend from 1.2005 (2021 low) is still expected to resume through 1.3976 at a later stage.
AUD/USD Daily Report
Daily Pivots: (S1) 0.6557; (P) 0.6594; (R1) 0.6619; More...
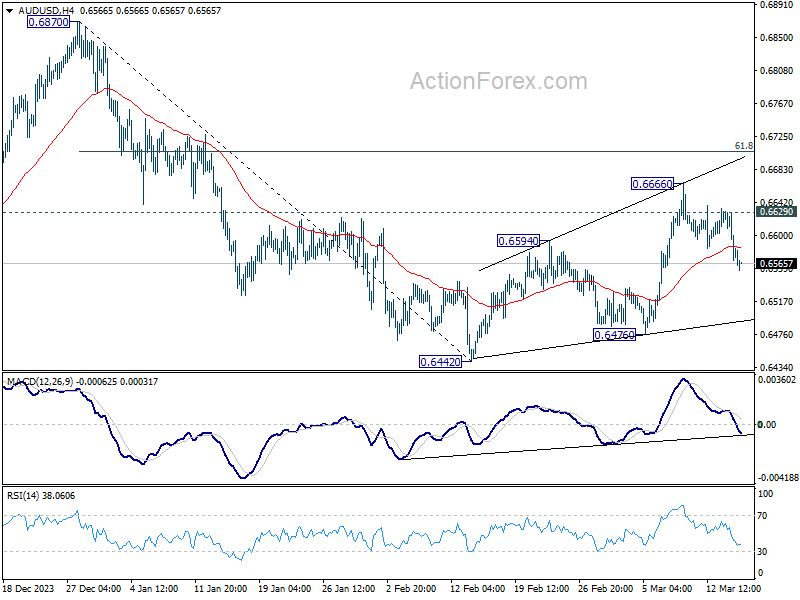
AUD/USD's break of 55 4H EMA (now at 0.6585) argues that corrective recovery from 0.6442 has completed with three waves up to 0.6666. Intraday bias is back on the downside for 0.6476 support first. Break there will argue that decline from 0.6870 is ready to resume. On the upside, break of 0.6629 minor resistance will turn bias back to the upside to extend the rebound from 0.6442 instead.
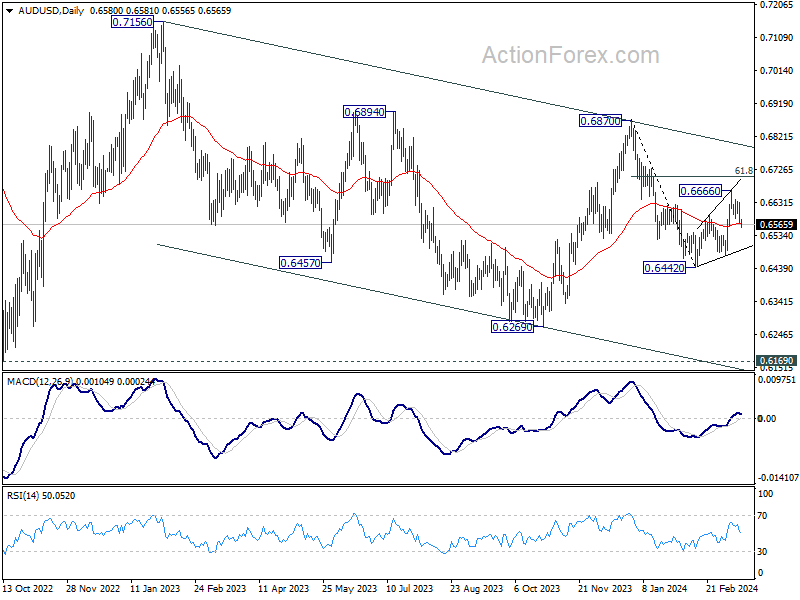
In the bigger picture, price actions from 0.6169 (2022 low) are seen as a medium term corrective pattern to the down trend from 0.8006 (2021 high). Fall from 0.7156 (2023 high) is seen as the second leg, which might still be in progress. Overall, sideway trading could continue in range of 0.6169/7156 for some more time. But as long as 0.7156 holds, an eventual downside breakout would be mildly in favor.
Dollar Strengthens as Treasury Yields Surge, Anticipating a Hawkish Fed Shift?
Dollar rebounded strongly overnight along with rally in treasury yields, and maintained its strength in Asian session. This resurgence is largely attributed to traders recalibrating their expectations for Fed's monetary policy, in light of this week's inflation data that surpassed forecasts. Both CPI and PPI reports for this week have painted a picture of persistent inflationary pressures, prompting speculation of a hawkish shift in FOMC's dot plot at the upcoming meeting next week.
With the inflation narrative gaining momentum, eyes are on University of Michigan's consumer sentiment index and inflation expectations in US session. Any surprises to the upside in these figures could further cement the Dollar's position, propelling it to end the week on a strong note.
In the broader forex markets, the Dollar is currently the best performer of the week, with Canadian Dollar and the trailing behind in strength. New Zealand Dollar is the worst, following the sharp selloff following manufacturing data that, despite showing improvements, continued to highlight the sector's struggles. Sterling and the Yen are also lagging, with Australian Dollar and Swiss Franc mixed in the middle.
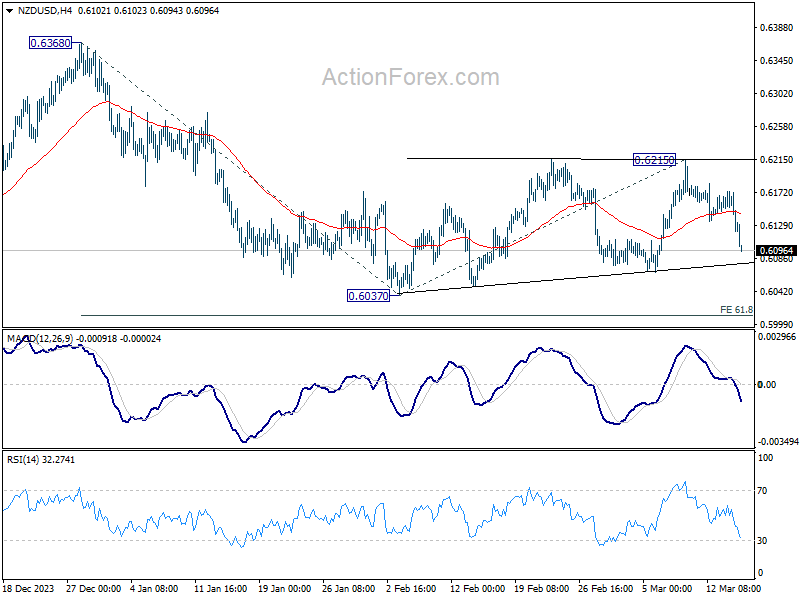
Technically, today's steep decline in NZD/USD affirms the case that consolidation pattern from 0.6037 has completed with three waves to 0.6215. And fall from 0.6368 is ready to resume. Further decline is now expected as long as 55 4H EMA (now at 0.6143) holds. Next targets are 0.6037, and the 61.8% projection of 0.6368 to 0.6037 from 0.6215 at 0.6010, which is close to 0.6 psychological support.
In Asia, at the time of writing, Nikkei is down -0.33%. Hong Kong HSI is down -2.27%. China Shanghai SSE is down -0.31%. Singapore Strait Times is down -0.25%. Japan 10-year JGB yield up 0.0109 at 0.787. Overnight, DOW fell -0.35%. S&P 500 fell -0.29%. NASDAQ fell -0.30%. 10-year yield rose 0.106 to 4.298.
US treasury yields leap as markets question Fed's easing path
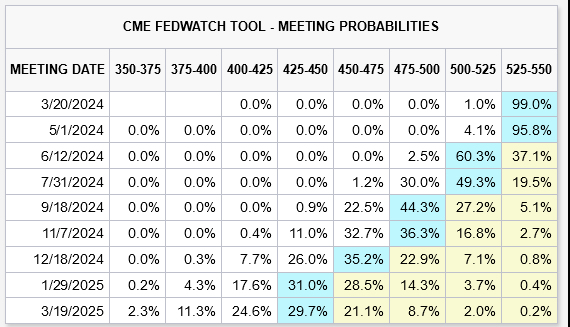
US Treasury yields surged overnight and pulled Dollar higher, in reaction to February's stronger than expected PPI data. Despite prevailing expectations for the Fed to initiate rate cuts in June, the persistence of "sticky" inflation has led a reassessment of the loosening path throughout the year.
Currently, Fed fund futures reflect diminished confidence, with the likelihood of three rate cuts by year-end, from current 5.25-5.50% down to 4.25-4.50%, falling below 70%. Some market participants appears to be speculating on a less dovish stance in Fed's updated dot plot, set to be unveiled next week.
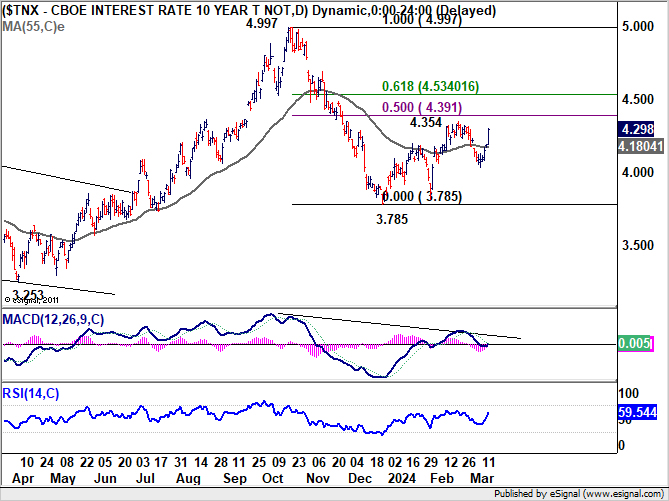
Technically, 10-year yield's strong rise overnight suggests that corrective rebound from 3.785 is still in progress. Break of 4.354 is possible. But for now, strong resistance is expected between 4.391 ad 4.534 (50% and 61.8% retracement of 4.997 to 3.785) to limit upside to complete the rebound.
NZ BNZ manufacturing climbs to 49.3, a glimmer of hope in ongoing recession
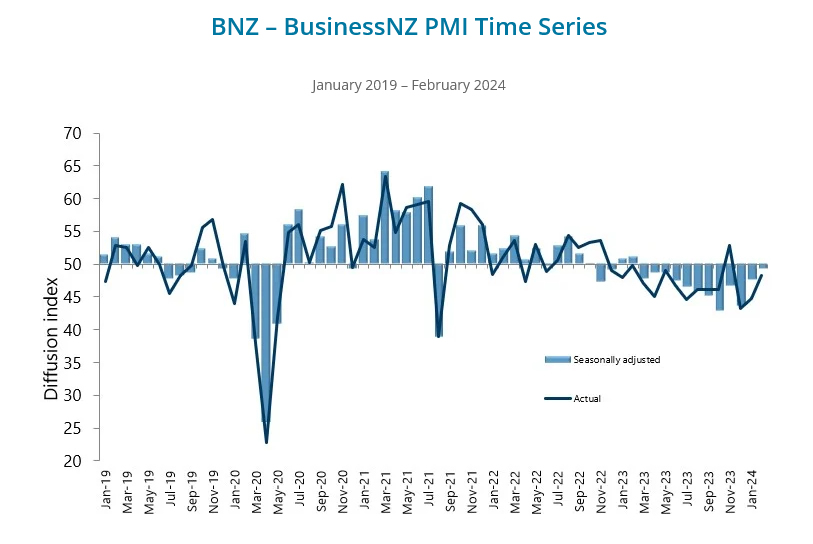
New Zealand BusinessNZ Performance of Manufacturing Index rose from 47.5 to 49.3 , marking the highest point in a year. However, the sub-50 reading indicates that the sector remains in contraction for the twelfth consecutive month.
A closer examination of the components reveals a mixed bag of progress and setbacks. Production saw a significant leap from 42.9 to 49.1, reaching its peak since January 2023. Contrarily, employment edged down to the breakeven point of 50.0 from 51.3. New orders continued to struggle, remaining unchanged at 47.8 and indicating contraction for the ninth month in a row, reflecting the ongoing difficulty in securing new business. Finished stocks and deliveries both saw improvements, with deliveries crossing into expansion territory at 51.4, the highest since March 2023.
Despite these developments, the sector's sentiment remains cautious, with 62% of comments being negative in February, marginally less pessimistic than January's 63.2% but more so than December's 61%. The primary concerns among respondents were a lack of orders, both domestically and internationally, and a general slowdown in the economy.
Stephen Toplis, BNZ's Head of Research acknowledged that while New Zealand's manufacturing sector "is still in recession", the latest PMI data signals "there is light at the end of the tunnel". The proximity of the PMI to the "breakeven" threshold and the positive differential between new orders and inventory suggest an upcoming increase in production.
Looking ahead
UK consumer inflation and Italy retail sales will be released in European session. Later in the day, Canada will release housing starts and wholesale sales. US will publish Empire State manufacturing, import prices, industrial production, and U of Michigan consumer sentiment.
AUD/USD Daily Report
Daily Pivots: (S1) 0.6557; (P) 0.6594; (R1) 0.6619; More...
AUD/USD's break of 55 4H EMA (now at 0.6585) argues that corrective recovery from 0.6442 has completed with three waves up to 0.6666. Intraday bias is back on the downside for 0.6476 support first. Break there will argue that decline from 0.6870 is ready to resume. On the upside, break of 0.6629 minor resistance will turn bias back to the upside to extend the rebound from 0.6442 instead.
In the bigger picture, price actions from 0.6169 (2022 low) are seen as a medium term corrective pattern to the down trend from 0.8006 (2021 high). Fall from 0.7156 (2023 high) is seen as the second leg, which might still be in progress. Overall, sideway trading could continue in range of 0.6169/7156 for some more time. But as long as 0.7156 holds, an eventual downside breakout would be mildly in favor.
Economic Indicators Update
| GMT | Ccy | Events | Actual | Forecast | Previous | Revised |
|---|---|---|---|---|---|---|
| 21:30 | NZD | Business NZ PMI Feb | 49.3 | 47.3 | 47.5 | |
| 04:30 | JPY | Tertiary Industry Index M/M Jan | 0.30% | 0.10% | 0.70% | |
| 09:30 | GBP | Consumer Inflation Expectations | 3.30% | |||
| 10:00 | EUR | Italy Retail Sales M/M Jan | 0.20% | -0.10% | ||
| 12:15 | CAD | Housing Starts Y/Y Feb | 227K | 224K | ||
| 12:30 | CAD | Wholesale Sales M/M Jan | -0.60% | 0.30% | ||
| 12:30 | USD | NY Empire State Manufacturing Index Mar | -6.5 | -2.4 | ||
| 12:30 | USD | Import Price Index M/M Feb | 0.20% | 0.80% | ||
| 13:15 | USD | Industrial Production M/M Feb | 0.00% | -0.10% | ||
| 14:00 | USD | Michigan Consumer Sentiment Index Mar P | 77.3 | 76.9 |
DAX Short Term Should Stay Supported
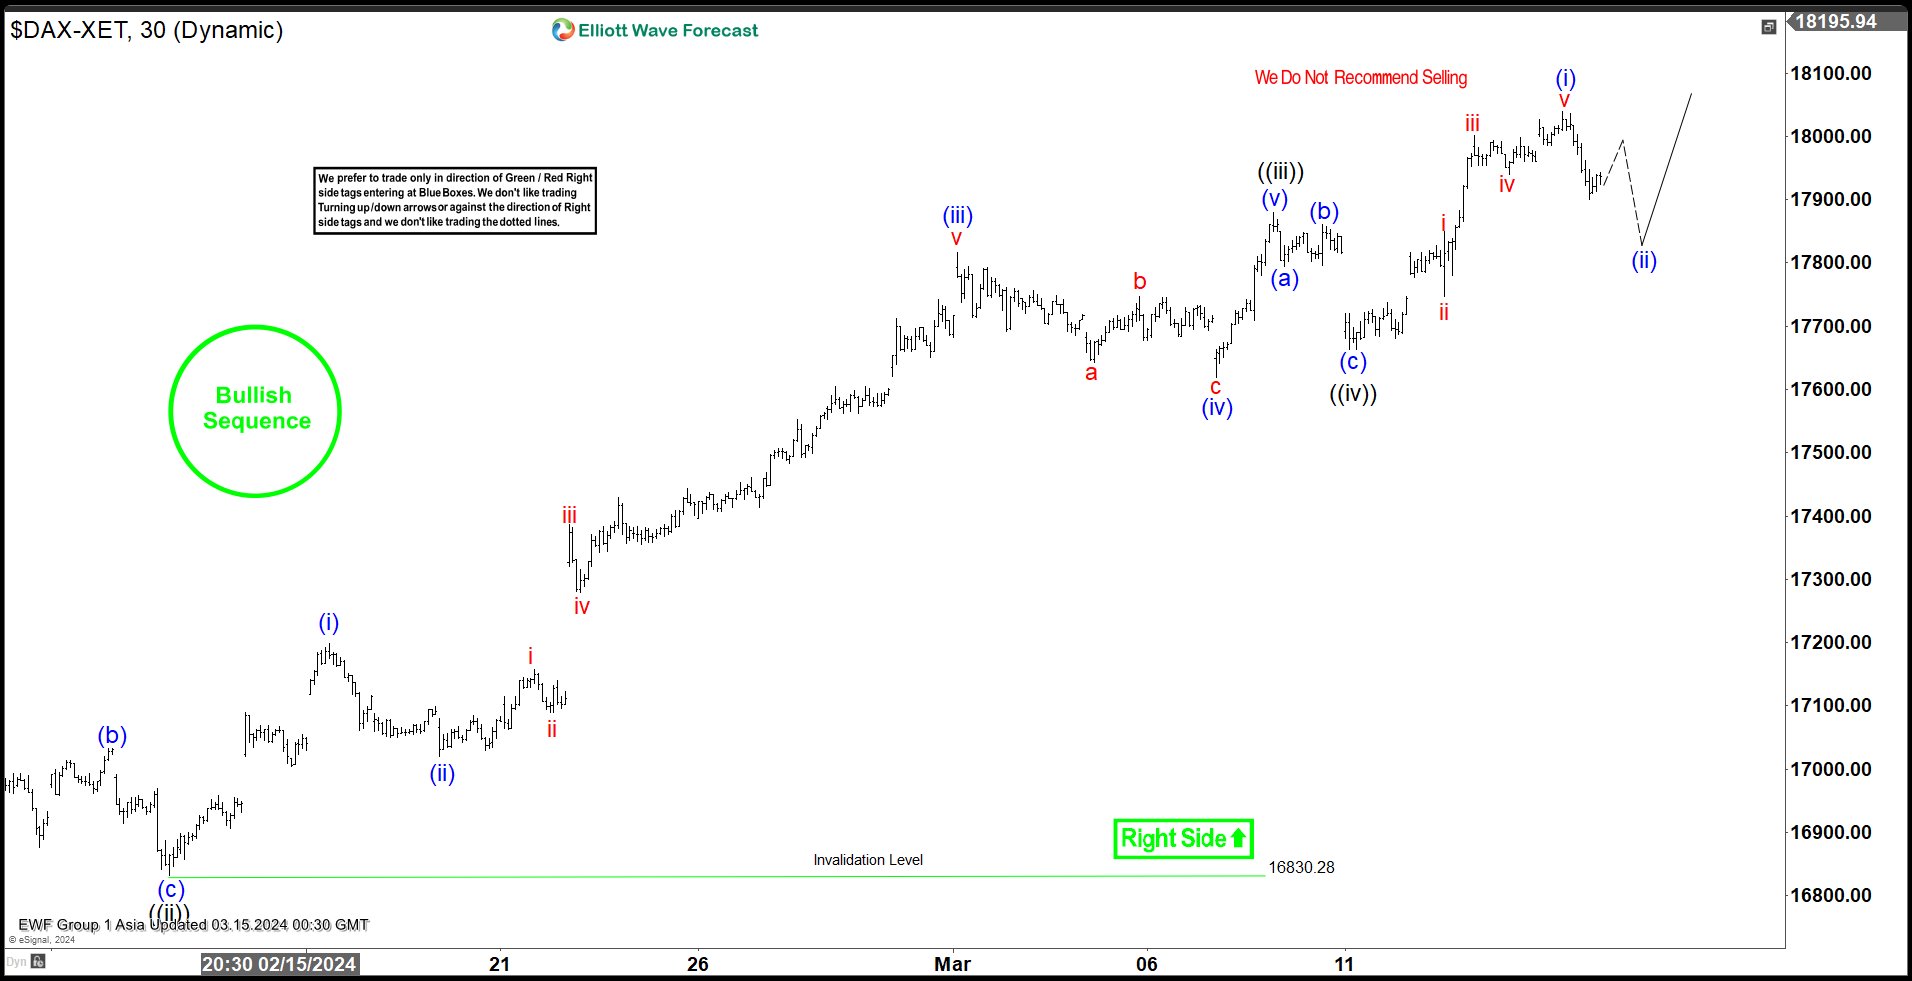
Short Term Elliott Wave view in DAX suggests cycle from 1.17.2024 low is in progress as a 5 waves impulse. Up from 1.17.2024 low, wave ((i)) ended at 17049.52 and pullback in wave ((ii)) ended at 16830.28 as the 30 minutes chart below shows. The Index then rallies higher within in wave ((iii)) with internal subdivision as another impulse in lesser degree. Up from wave ((ii)), wave (i) ended at 17198.45 and pullback in wave (ii) ended at 17019.15. The Index extended higher in wave (iii) towards 17816.52 and pullback in wave (iv) ended at 17619.4. The Index extended higher again in wave (v) towards 17879.11 which completed wave ((iii)) in higher degree.
Pullback in wave ((iv)) subdivided into a zigzag structure. Down from wave ((iii)), wave (a) ended at 17795.13 and wave (b) ended at 17860.51. Wave (c) lower ended at 17662.55 which completed wave ((iv)). The Index has extended higher in wave ((v)) with internal subdivision as 5 waves impulse. Up from wave ((iv)), wave i ended at 17849.8 and wave ii ended at 17746.89. Index extended higher in wave iii towards 18001.42 and wave iv ended at 17939.50. Final leg wave v ended at 18039.05 which completed wave (i). Expect wave (ii) pullback to find support in 3, 7, or 11 swing for further upside, as far as pivot at 16830.28 low stays intact.
DAX 30 Minutes Elliott Wave Chart
DAX Elliott Wave Video
https://www.youtube.com/watch?v=E_tj74X_PXU
USD/JPY Could Recover, Crude Oil Price Breaks $80
Key Highlights
- USD/JPY is attempting a recovery wave from the 146.50 support.
- A key rising channel is forming with support at 147.50 on the 4-hour chart.
- Crude oil prices surged above the $80.00 resistance zone.
- Gold prices are consolidating near the $2,150 zone.
USD/JPY Technical Analysis
The US Dollar declined heavily below the 148.00 zone against the Japanese Yen. USD/JPY found support near 146.50 and recently started a fresh increase.
Looking at the 4-hour chart, the pair is attempting a recovery wave above the 147.00 level. There was a move above the 23.6% Fib retracement level of the downward move from the 150.84 swing high to the 146.47 low.
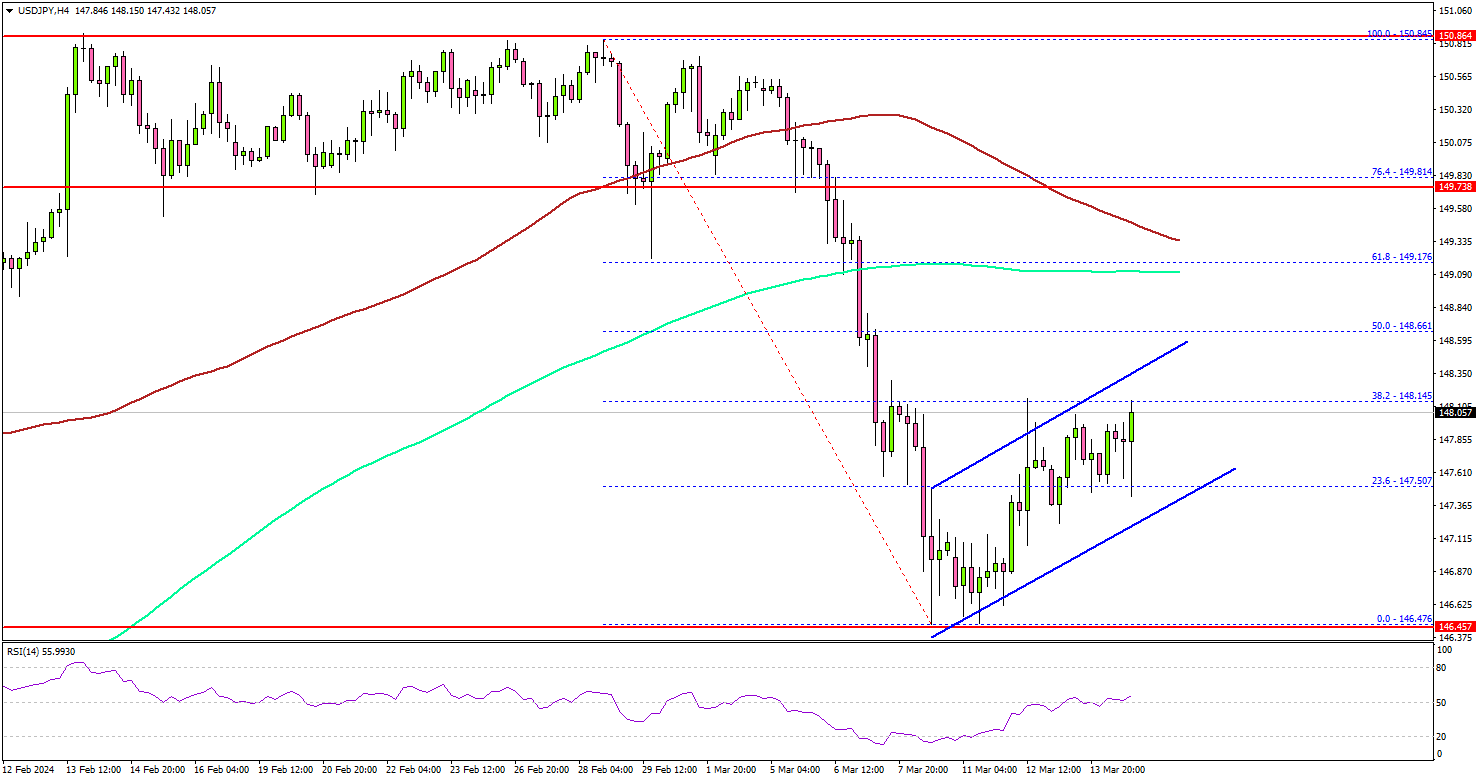
However, the pair is still well below 148.50, the 100 simple moving average (red, 4-hour), and the 200 simple moving average (green, 4-hour). On the upside, the pair could face resistance near the 148.30 level.
The first major resistance is now forming near 148.50. The main resistance is near 149.20. A close above the 149.20 zone could open the doors for more upsides. The next stop for the bulls might be 150.00.
Immediate support is near the 147.50 level. There is also a key rising channel forming with support at 147.50 on the same chart. The next major support is at 147.20. If there is a downside break below the 147.20 support, the pair could decline toward the 146.50 support.
Looking at Oil, there was a strong move above the $80.00 resistance and there are chances of more upsides in the near term.
Economic Releases
- NY Empire State Manufacturing Index for March 2024 – Forecast -7, versus -2.4 previous.
- Michigan Consumer Sentiment Index for Nov 2024 (Prelim) – Forecast 76.9, versus 76.9 previous.
US treasury yields leap as markets question Fed’s easing path
US Treasury yields surged overnight and pulled Dollar higher, in reaction to February's stronger than expected PPI data. Despite prevailing expectations for the Fed to initiate rate cuts in June, the persistence of "sticky" inflation has led a reassessment of the loosening path throughout the year.
Currently, Fed fund futures reflect diminished confidence, with the likelihood of three rate cuts by year-end, from current 5.25-5.50% down to 4.25-4.50%, falling below 70%. Some market participants appears to be speculating on a less dovish stance in Fed's updated dot plot, set to be unveiled next week.
Technically, 10-year yield's strong rise overnight suggests that corrective rebound from 3.785 is still in progress. Break of 4.354 is possible. But for now, strong resistance is expected between 4.391 ad 4.534 (50% and 61.8% retracement of 4.997 to 3.785) to limit upside to complete the rebound.
NZ BNZ manufacturing climbs to 49.3, a glimmer of hope in ongoing recession
New Zealand BusinessNZ Performance of Manufacturing Index rose from 47.5 to 49.3 , marking the highest point in a year. However, the sub-50 reading indicates that the sector remains in contraction for the twelfth consecutive month.
A closer examination of the components reveals a mixed bag of progress and setbacks. Production saw a significant leap from 42.9 to 49.1, reaching its peak since January 2023. Contrarily, employment edged down to the breakeven point of 50.0 from 51.3. New orders continued to struggle, remaining unchanged at 47.8 and indicating contraction for the ninth month in a row, reflecting the ongoing difficulty in securing new business. Finished stocks and deliveries both saw improvements, with deliveries crossing into expansion territory at 51.4, the highest since March 2023.
Despite these developments, the sector's sentiment remains cautious, with 62% of comments being negative in February, marginally less pessimistic than January's 63.2% but more so than December's 61%. The primary concerns among respondents were a lack of orders, both domestically and internationally, and a general slowdown in the economy.
Stephen Toplis, BNZ's Head of Research acknowledged that while New Zealand's manufacturing sector "is still in recession", the latest PMI data signals "there is light at the end of the tunnel". The proximity of the PMI to the "breakeven" threshold and the positive differential between new orders and inventory suggest an upcoming increase in production.