Sample Category Title
Gold Price Rally Takes Break, Crude Oil Price Surges
Gold price rallied above $2,180 before correcting lower. Crude oil price is rising and it could climb further higher toward the $82 resistance.
Important Takeaways for Gold and Oil Prices Analysis Today
- Gold price failed to clear the $2,200 resistance and corrected lower against the US Dollar.
- A key bearish trend line is forming with resistance at $2,170 on the hourly chart of gold at FXOpen.
- Crude oil prices are moving higher above the $80.00 resistance zone.
- There is a connecting bullish trend line forming with support near $80.60 on the hourly chart of XTI/USD at FXOpen.
Gold Price Technical Analysis
On the hourly chart of Gold at FXOpen, the price was able to climb above the $2,150 resistance, as mentioned in the previous analysis. The price even broke the $2,180 level before the bears appeared.
The price traded close to the $2,200 zone before there was a downside correction. There was a move below the $2,180 pivot zone. The price settled below the 50-hour simple moving average and RSI dipped below 50. Finally, it tested the $2,150 zone.
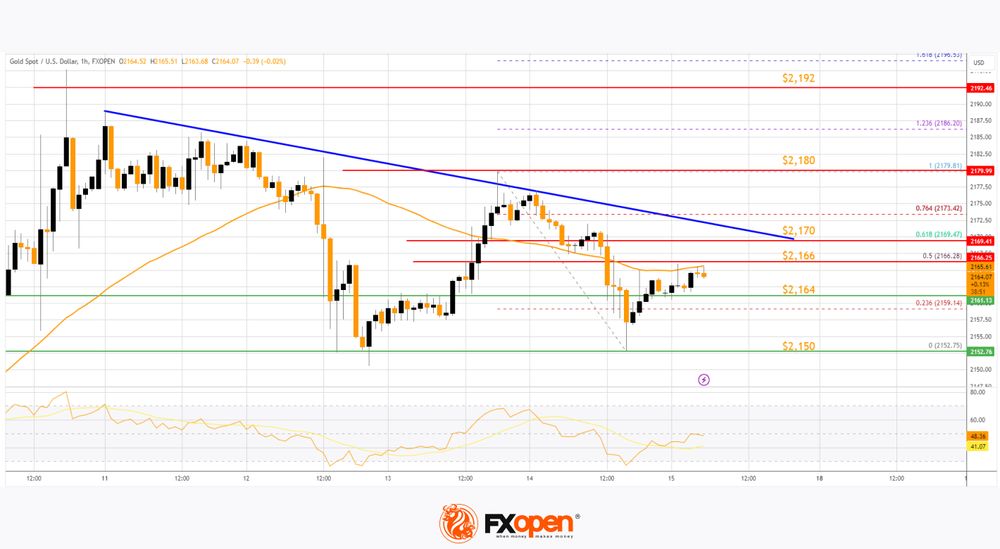
The price is now consolidating losses near the $2,160 level. Immediate resistance on the upside is near the $2,166 level or the 50% Fib retracement level of the downward move from the $2,179 swing high to the $2,152 low.
The next major resistance is near a key bearish trend line at $2,170. It is close to the 61.8% Fib retracement level of the downward move from the $2,179 swing high to the $2,152 low.
An upside break above the $2,170 resistance could send Gold price toward $2,180. Any more gains may perhaps set the pace for an increase toward the $2,200 level. If there is no recovery wave, the price could continue to move down.
Initial support on the downside is near the $2,164 level. The first major support is $2,150. If there is a downside break below the $2,150 support, the price might decline further. In the stated case, the price might drop toward the $2,132 support.
Oil Price Technical Analysis
On the hourly chart of WTI Crude Oil at FXOpen, the price started a decent increase against the US Dollar. The price gained bullish momentum after it broke the $78.20 resistance.
There was a sustained upward move above the $79.20 and $80.00 levels. The bulls pushed the price above the 50-hour simple moving average and the RSI climbed toward 65. A high was formed near $81.00 before there was a downside correction.
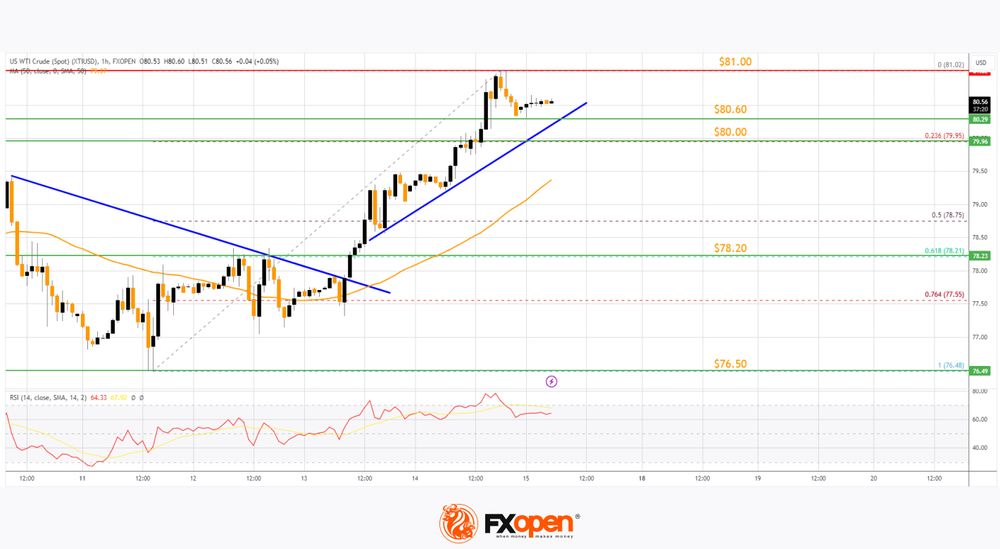
The price is still stable above the 23.6% Fib retracement level of the upward move from the $76.48 swing low to the $81.02 high. However, the bulls are active above a connecting bullish trend line with support near $80.60.
Immediate resistance is near the $81.00 level. If the price climbs further higher, it could face resistance near $82.00. The next major resistance is near the $83.20 level. Any more gains might send the price toward the $85.00 level.
Conversely, the price might correct gains and test the 61.8% Fib retracement level of the upward move from the $76.48 swing low to the $81.02 high at $78.20.
The next major support on the WTI crude oil chart is near $76.50. If there is a downside break, the price might decline toward $75.00. Any more losses may perhaps open the doors for a move toward the $73.50 support zone.
Start trading commodity CFDs with tight spreads. Open your trading account now or learn more about trading commodity CFDs with FXOpen.
This article represents the opinion of the Companies operating under the FXOpen brand only. It is not to be construed as an offer, solicitation, or recommendation with respect to products and services provided by the Companies operating under the FXOpen brand, nor is it to be considered financial advice.
Japan’s Shunto negotiations yield 5.28% pay rise, a 33-Year High
Japan's annual labor negotiations, known colloquially as "Shunto" or the "spring wage offensive," have culminated in a remarkable outcome this year, with major firms agreeing to a pay increase of 5.28%—the highest in 33 years.
This significant hike, announced by the country's largest trade union group Rengo, surpasses the previous year's increase of 3.80%. With wage talks for smaller companies anticipated to wrap up by the end of March, this development is a critical one in the context of monetary policy considerations by BoJ.
This wage growth is likely to be viewed positively by BoJ officials, who are widely expected to be on the verge of ending the long-standing negative interest rate policy. However, the exact timing of such a policy shift, whether it could be announced as soon as next week's meeting or delayed until April, remains a matter of speculation.
A recent Reuters poll conducted between March 11 and 14 showed that out of 34 economists surveyed, only 12 anticipate a rate hike in the upcoming week. The majority, 21 out of 34, foresee such a move in April.
Those in favor of an April decision point to BoJ's access to more comprehensive information by then, including results from Tankan survey, insights from branch managers, and a new set of economic projections.
Yet, history has shown that BoJ has a penchant for surprising the markets. This unpredictability serves as a reminder to never rule out the possibility of a sooner move.
Risks Significantly Tilting to First Fed Rate Cut in September at Earliest
Markets
US Treasuries sold off for a third straight session yesterday with eco data strengthening the case for a hawkish tone at next week’s FOMC meeting. Risks are significantly tilting to a first rate cut in September at the earliest. February US producer price inflation accelerated much more than forecast (0.6% M/M for headline & 0.3% M/M for core) with Y/Y-figures establishing a bottoming out pattern. Weekly jobless claims came in at another extremely low 209k. Slightly slower February retail sales growth on the top level (+0.6% M/M vs 0.8% forecast) and for the control group (flat vs +0.4%) suggest fading momentum in Joe Sixpack’s expenses, but were clearly not the market focus. US Treasury yields added 5.9 bps (2-yr) to 10 bps (10-yr) on a daily basis. The US 2-yr yield closed at 4.69% with the YTD high standing at 4.74%. The US 10-yr yield closed at 4.29% compared to YTD high resistance at 4.35%. German yields followed the move higher to a lesser extent with Bund yields adding 2.8 bps (2-yr) to 5.9 bps (5-yr). The dollar for the first time really profited from the interest rate support. EUR/USD closed below minor first support (1.0902; neckline short term double top formation). The pair is now attacking 1.0872 which is 38% retracement on the comeback since mid-February. Losing that level in this week’s close would be very significant and suggest more downward potential to the 1.08 and 1.07 big figures. Two other factors backed the greenback yesterday. First the (slight) risk-off market sentiment. Main European and US bourses lost up to 0.5% yesterday. Second, oil prices rallied significantly over the past two days. Brent crude surged from $82/b to almost $86/b, the highest level since the end of October. The International Energy Agency yesterday switched sides, forecasting a likely oil deficit for 2024 instead of a surplus previously. Stronger demand, limited passage through Panama & Suez canals and the risk of prolonged OPEC+ production cuts all came in the mix.
Today’s eco calendar contains the outcome of Japan’s biggest labour union’s (Rengo) wage negotiations. Kyodo reports that they won average pay hikes of over 5% for the coming fiscal year (3.8% last year) which cements the case for a first BoJ rate hike since 2007 when they meet next week. It could add to selling pressure on global core bonds with JPY in a first reaction profiting (USD/JPY 148). The US eco calendar contains import/export prices, production figures and March confidence data (Empire Manufacturing survey and University of Michigan consumer confidence). We expect them to prolong the current market trends of underperforming US Treasuries and a stronger greenback.
News & Views
New Zealand Finance Minister Willis warned for a substantial deterioration in the economic outlook for the country. "The numbers haven’t been finalized, but I know enough to say they won’t make happy reading". The New Zealand Treasury in December projected growth of 1.5% for this and next fiscal year. New Zealand will publish Q4 2023 growth figures next week. After a contraction of -0.3% Q/Q in Q3, growth is expected to have hardly rebounded in Q4 (0.1% Q/Q). The RBNZ in its end-February monetary policy report forecasted Q4 growth at 0.0%. Materially lower expected growth also eases the case for the RBNZ to maintain current tight monetary policy throughout this year. The market discounts a first 25 bps rate cut at the October meeting and even sees a 80% chance of a first step already at the August meeting. The kiwi dollar is ceding further ground this morning after yesterday’s USD driven loss. NZD/USD currently trades near 0.61.
Chinese housing data published this morning indicate that recent measures to support the property market still have to filter through to the real economy. In 57 of 70 cities observed, new home prices declined compared to last year. Prices on average fell 0.36% M/M. Prices of existing home were even lower in all 70 cities compared to last year with a further monthly decline in February of 0.62% M/M. Despite ongoing pressures in the real estate market and the broader economy, the People’s Bank of China today left its 1-year loan rate unchanged at 2.50%. Amongst others, the PBOC probably remains cautious on further monetary easy to prevent further downside pressure on the yuan. USD/CNY is holding a tight range close to, but just below 7.20 (currently 7.196).
GBP/JPY Daily Outlook
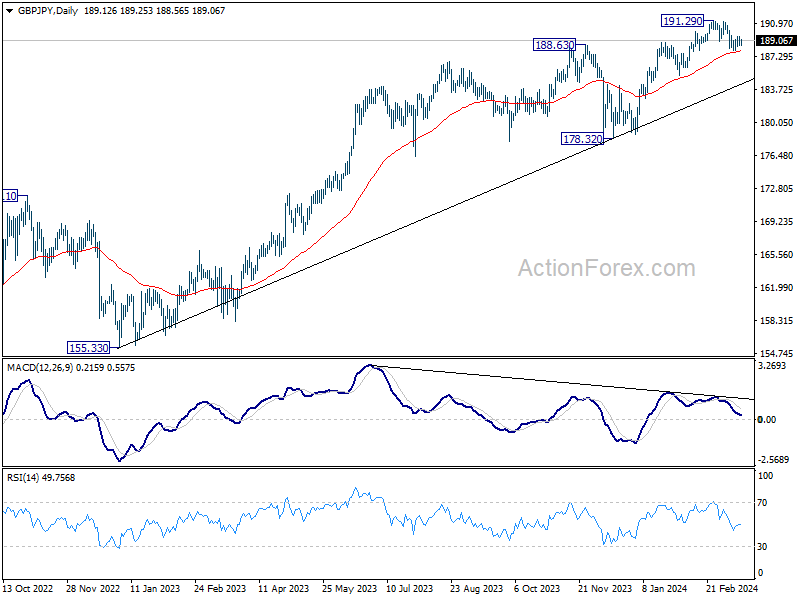
Daily Pivots: (S1) 188.65; (P) 189.09; (R1) 189.57; More.....
Intraday bias in GBP/JPY remains neutral for the moment. On the downside, below 187.94 will resume the decline from 191.29 to 38.2% retracement of 178.32 to 191.29 at 186.33. Sustained break there will raise the chance of larger scale correction and target 61.8% retracement at 183.27. On the upside, though, firm break 189.69 minor resistance will retain near term bullishness and bring retest of 191.29 high.
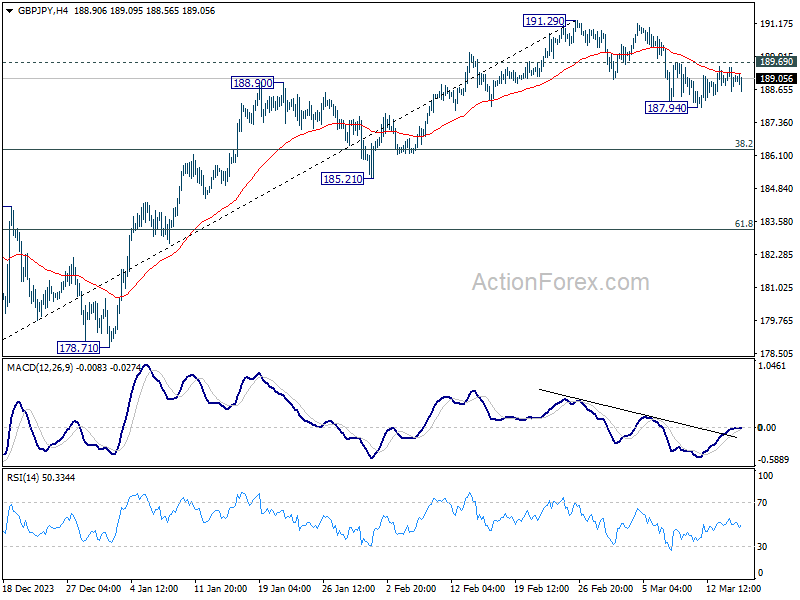
In the bigger picture, up trend from 123.94 (2020 low) is in progress. Medium term outlook will stay bullish as long as 178.32 support holds. Next target is 195.86 long term resistance (2015 high).
EUR/JPY Daily Outlook
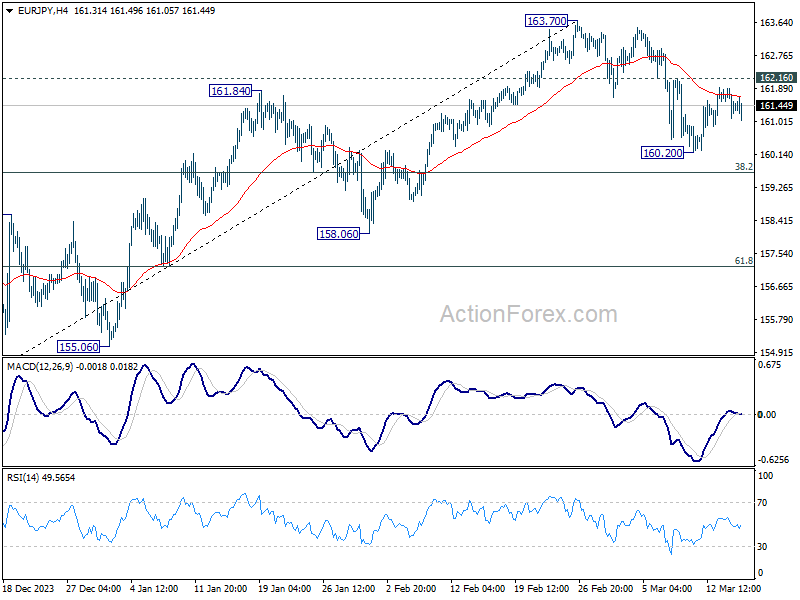
Daily Pivots: (S1) 161.04; (P) 161.48; (R1) 161.84; More...
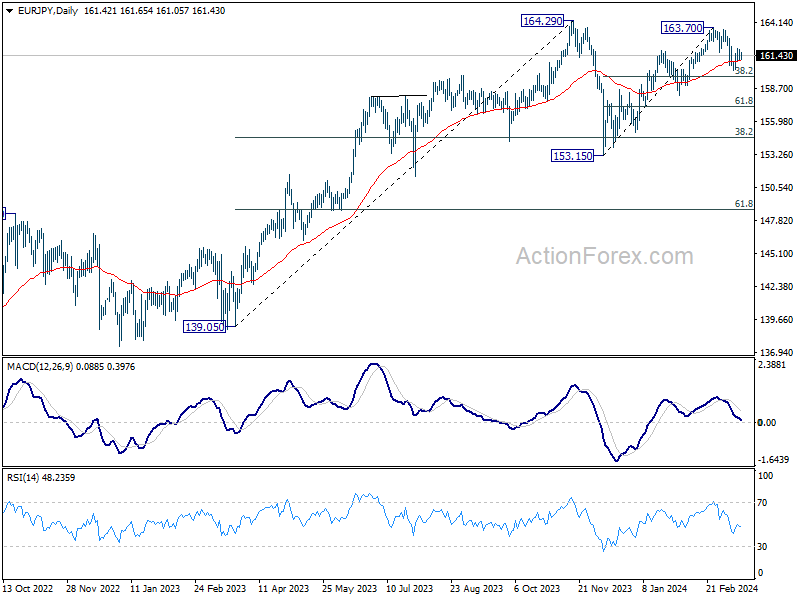
Intraday bias in EUR/JPY stays neutral at this point. On the downside, below 160.20 will resume the fall from 163.70 to 38.2% retracement of 153.15 to 163.70 at 159.66. Sustained break there will indicate that fall from 163.70 is reversing whole rise from 153.13, and target 61.8% retracement at 157.18. On the upside, though, above 162.16 minor resistance will retain near term bullishness, and bring retest of 163.70.
In the bigger picture, price actions from 164.29 medium term top are seen as a correction to rise from 139.05 which could still be extending. As long as 148.38 resistance turned support holds (2022 high), larger up trend from 114.42 (2020 low) is expected to resume through 164.29 at a later stage. Next target would be 169.96 (2008 high).
EUR/GBP Daily Outlook
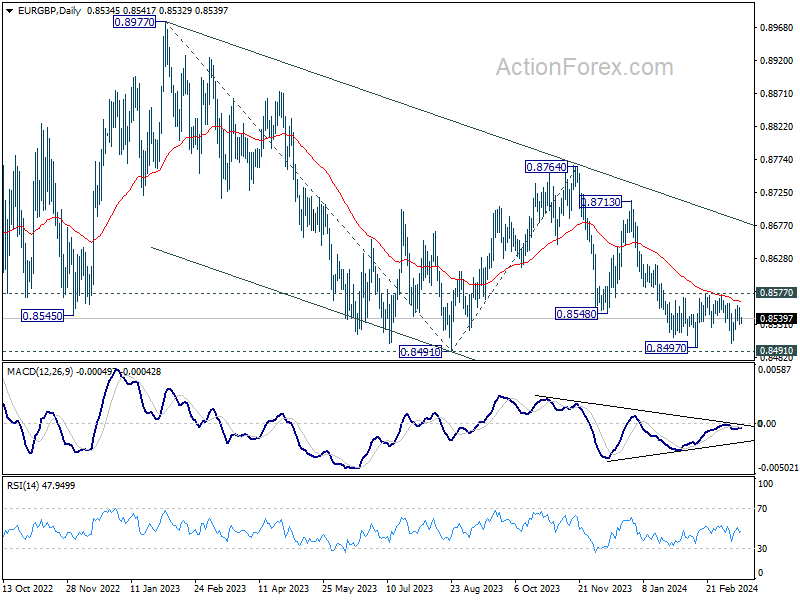
Daily Pivots: (S1) 0.8526; (P) 0.8542; (R1) 0.8549; More...
Intraday bias in EUR/GBP remains neutral for the moment. On the downside decisive break of 0.8491/7 support zone will confirm larger down trend resumption and target 0.8464 projection level first. Nevertheless, firm break of 0.8577 will turn bias back to the upside for stronger rebound.
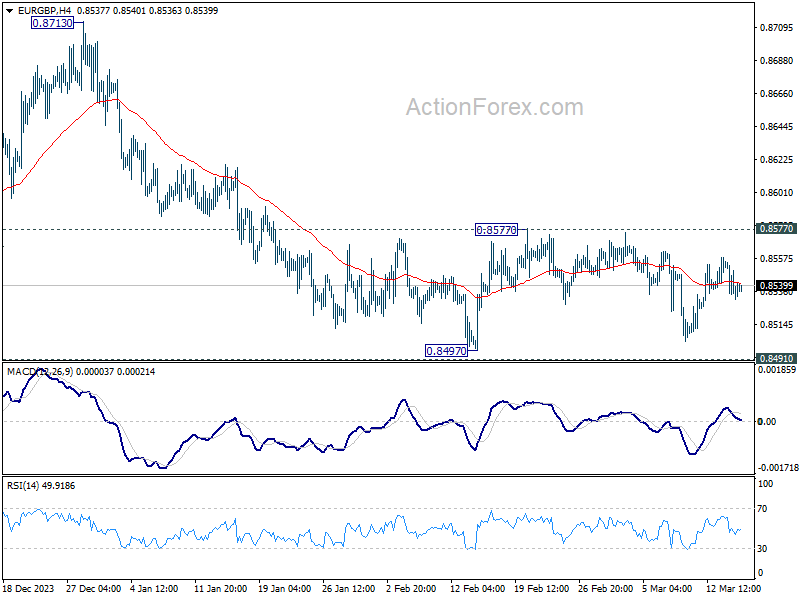
In the bigger picture, fall from 0.8764 is seen as another leg in the whole down trend from 0.9267 (2022 high). Outlook will stay bearish as long as 0.8713 resistance holds. Break of 0.8491 will target 61.8% projection of 0.8977 to 0.8491 from 0.8764 at 0.8464.
EUR/AUD Daily Outlook
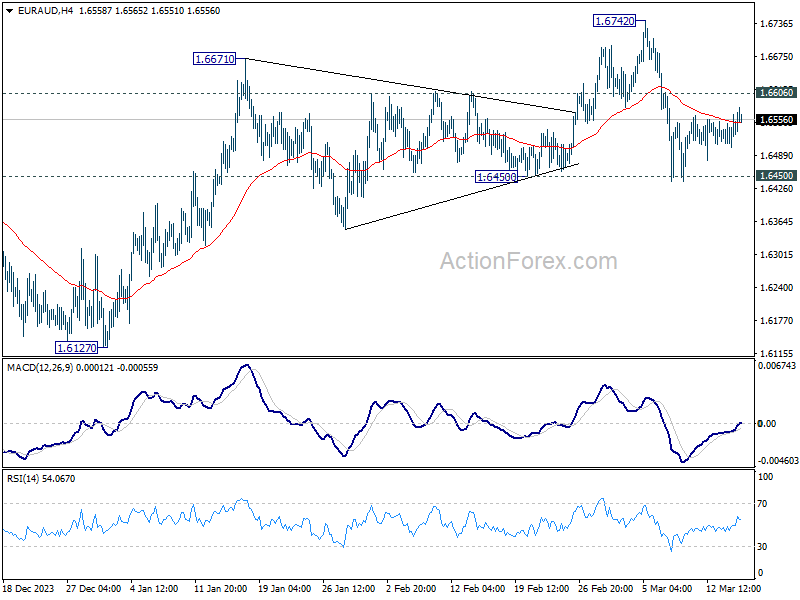
Daily Pivots: (S1) 1.6507; (P) 1.6538; (R1) 1.6569; More...
Intraday bias in EUR/AUD remains neutral for the moment. On the downside, decisive break of 1.6450 support will argue that whole rebound from 1.6127 has completed with three waves up to 1.6742 already. Near term outlook will be turned bearish for 1.6127 again, to extend the whole corrective pattern from 1.7062. Nevertheless, strong rebound from current level, followed by break of 1.6606 minor resistance, will retain near term bullishness and bring retest of 1.6742.
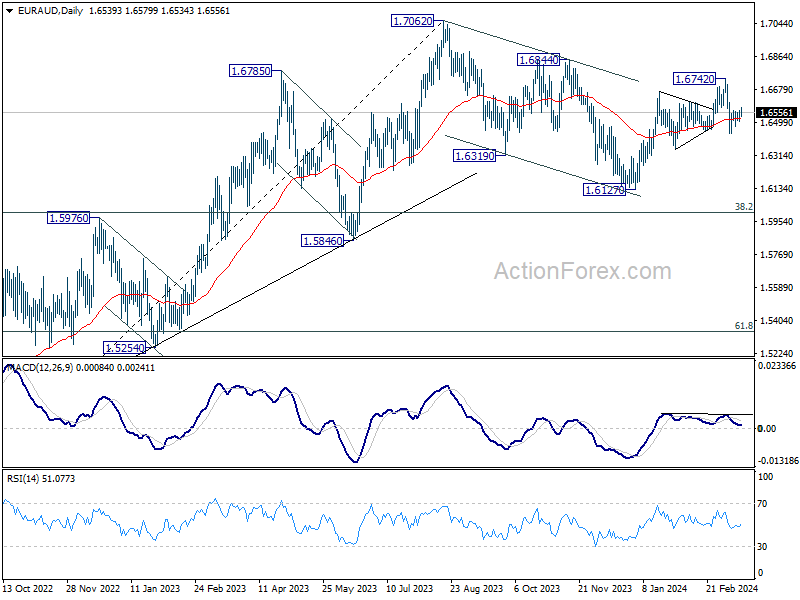
In the bigger picture, fall from 1.7062 medium term top is seen as a correction to the up trend from 1.4281 (2022 low). Break of 1.6844 resistance will argue that this up trend is ready to resume through 1.7062 high. In case of another fall, strong support should be seen around 1.5846 and 38.2% retracement of 1.4281 to 1.7062 at 1.6000 to bring rebound.
EUR/CHF Daily Outlook
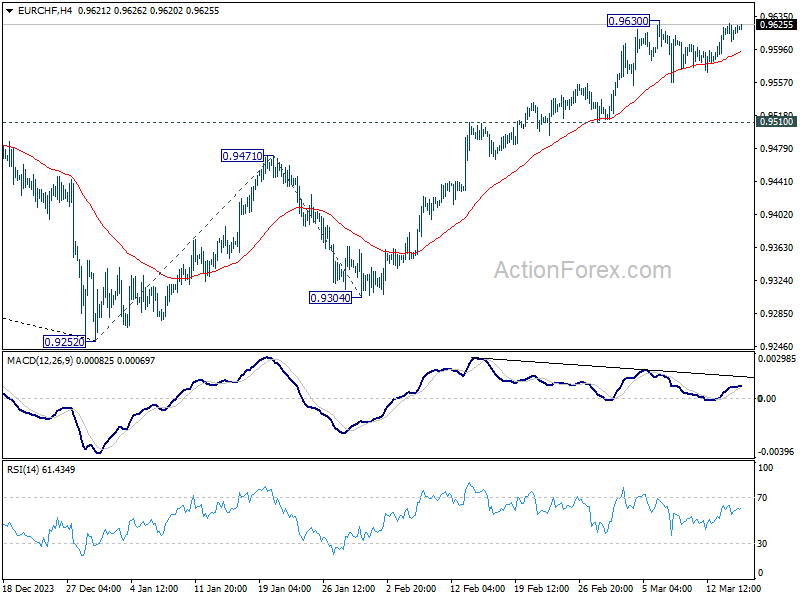
Daily Pivots: (S1) 0.9609; (P) 0.9619; (R1) 0.9629; More...
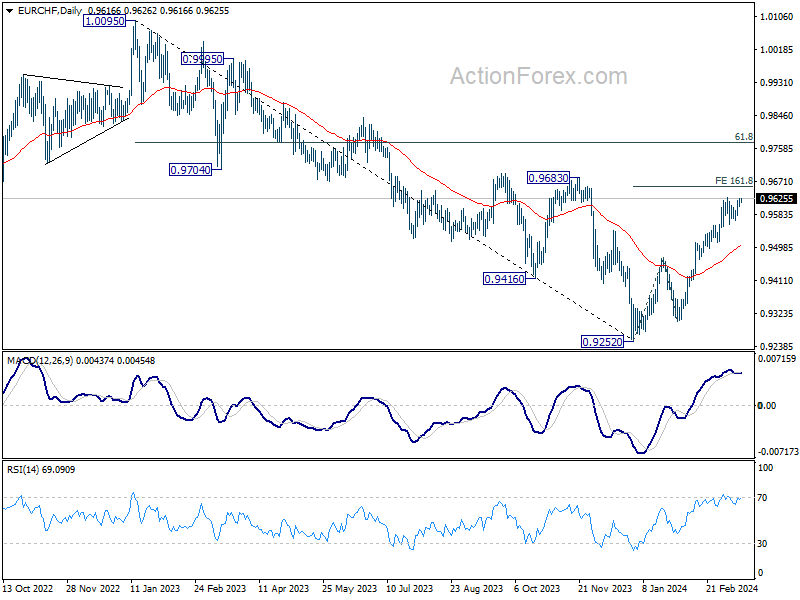
Intraday bias in EUR/CHF remains neutral and further rally is expected with 0.9510 support intact. On the upside, break of 0.9630 will resume the rise from 0.9252 and target 161.8% projection of 0.9252 to 0.9471 from 0.9304 at 0.9658 next. However, considering bearish divergence condition in 4H MACD, firm break of 0.9510 will turn bias back to the downside for deeper fall.
In the bigger picture, as long as 0.9683 resistance holds, rebound from 0.9252 are seen as a corrective move only. Larger down trend is expected to resume through 0.9252 after the correction completes. However, firm break of 0.9683 and sustained trading above 55 W EMA (now at 0.9620) will argue that 0.9252 is already a medium term bottom. Stronger rise would then be seen 61.8% retracement of 1.0095 to 0.9252 at 0.9773 and above.
Fed Doves Worried
Yesterday’s mix of economic data – which pointed at higher-than-expected inflation and lower-than-expected spending in the US – finally broke the Federal Reserve (Fed) doves’ and the equity bulls’ back for at least a day. US producer price inflation jumped to 0.6% on a monthly basis in February, and to 1.6% on a yearly basis. Higher fuel and food prices were to blame. But even taking the volatile energy and food prices out, the core metric showed higher-than-expected price pressures last month, core PPI remained steady at the 2% y-o-y. Retail sales, on the other hand, improved less than expected. The data forced the market to reconsider the Fed expectations. The probability of a June rate cut fell to 60%. The 2-year yield jumped to 4.70%, the 10-year yield spiked to 4.30%, the dollar index sharply rose and equities fell – though losses reversed toward the end of the session. The S&P500 closed the session 0.29% down and Nasdaq fell 0.30%.
All eyes are on next week’s FOMC meeting. The Fed will update its dot plot having seen a two-month jump in inflation, robust jobs data, a relatively strong GDP print and healthy earnings. There is a chance that we see the median forecast show no more than two rate cuts penciled in by the Fed members for the year – instead of three plotted at December’s dot plot. We will walk into next week’s FOMC meeting with a hawkish tilt knowing that it’s always better for the Fed not to act too early than to be forced to make a U-turn on the way.
Crude extends gains
US crude advanced to $81pb level after Ukraine damaged 12% of Russia’s refining capacity with drone attacks. The IEA also gave support to the bulls yesterday by saying that they anticipate a supply deficit throughout this year if OPEC+ continues to cut output in the Q2. This is a significant change in their forecast as they were pointing at a surplus at their earlier prediction. Trend and momentum indicators support a further rise in oil prices. But oil bulls could hit a wall if we see a hawkish shift from the Fed at next week’s meeting.
In the FX
The EURUSD tumbled to 1.0873 on the back of a broadly stronger dollar and rising speculation that the European Central Bank (ECB) will cut the rates even if it’s not fully sure that inflation is headed to 2% target according to the Belgian central bank head Pierre Wunsch. The Governor of the Bank of Greece goes a step further and says that the ECB should cut rates twice before its August break.
However, let's return to reality. The ECB would find it challenging to act independently and implement numerous rate cuts if the Fed adopts a hawkish stance, leading to appreciation of the US dollar. The ECB could take the risk of cutting before the Fed (in June) and announce one additional cut compared to the Fed at best before seeing inflation risks return to the bloc.
Price-wise, the EURUSD outlook remains bearish. The pair will step into a medium term bearish consolidation zone if it slips below the 1.0867 level – the major 38.2% Fibonacci retracement on February – March rebound, and could extend gains all the way down to 1.06 in the continuation of an ABCD pattern.
Elsewhere, the USDJPY is trending higher despite news that the wages negotiations in Japan show that big corporations meet the wages demand. Today, Rengo – the country’s biggest union group – will announce its numbers. Strong wages growth is inflationary and should convince the Bank of Japan (BoJ) to act sooner rather than later. However, the BoJ is expected to hold off until it obtains a clearer understanding of the wage landscape following the second and third rounds of negotiations, scheduled between the end of March and the beginning of April. These negotiations will not only encompass major corporations but also extend to medium and small-sized companies. This being said, given the positive news from the early negotiations, it’s interesting to see that the Japanese yen bulls don’t hold a dominant position in the market this week. The USDJPY is back above the 148 level. A broadly stronger US dollar certainly explains why the USDJPY couldn’t gain a further downside momentum this week, but given how cheap the yen has become, I would expect the yen bulls to resist to the dollar’s upside pressure. They have not. Still, I think that going short the yen at the current levels doesn’t offer a potential worth taking the risk of a sizeable bullish run in the yen into next week’s BoJ decision.
And speaking of decisions, the PBoC left its MLF rate unchanged today, while home prices fell for a 13th month in China warning that all the efforts deployed so far couldn’t slow bleeding in the country’s problematic property sector.
EUR/USD Daily Outlook
Daily Pivots: (S1) 1.0858; (P) 1.0907; (R1) 1.0932; More...
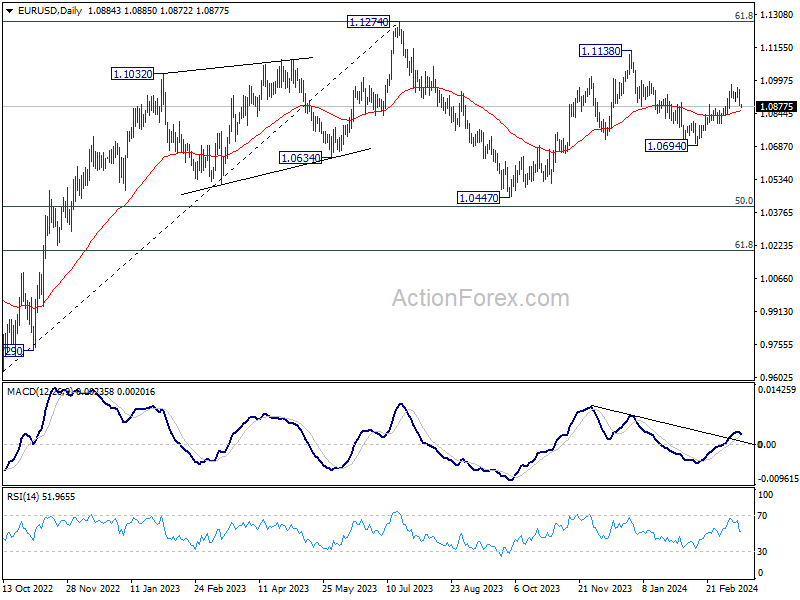
EUR/USD's break of 55 4H EMA (now at 1.0900) indicates short term topping at 1.0980. Intraday bias is back on the downside for 1.0797 support. Firm break there will argue that rebound from 1.0694 has completed and bring retest of this low. For now, risk will stay on the downside as long as 1.0980 resistance holds, in case of recovery.
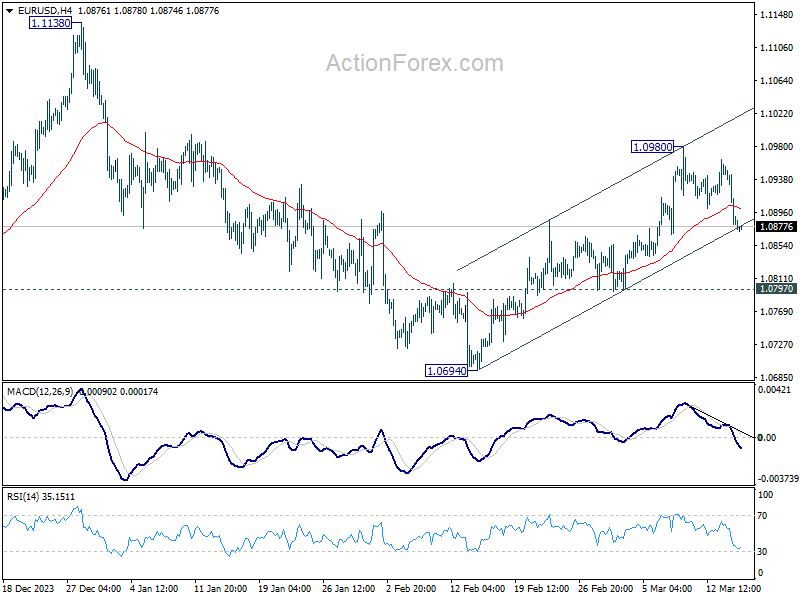
In the bigger picture, price actions from 1.1274 are viewed as a corrective pattern to rise from 0.9534 (2022 low). Rise from 1.0447 is seen as the second leg. While further rally could cannot be ruled out, upside should be limited by 1.1274 to bring the third leg of the pattern. Meanwhile, sustained break of 1.0694 support will argue that the third leg has already started for 1.0447 and possibly below.