

Sample Category Title
NZ Dollar Extends Losses after Mfg. PMI Contraction
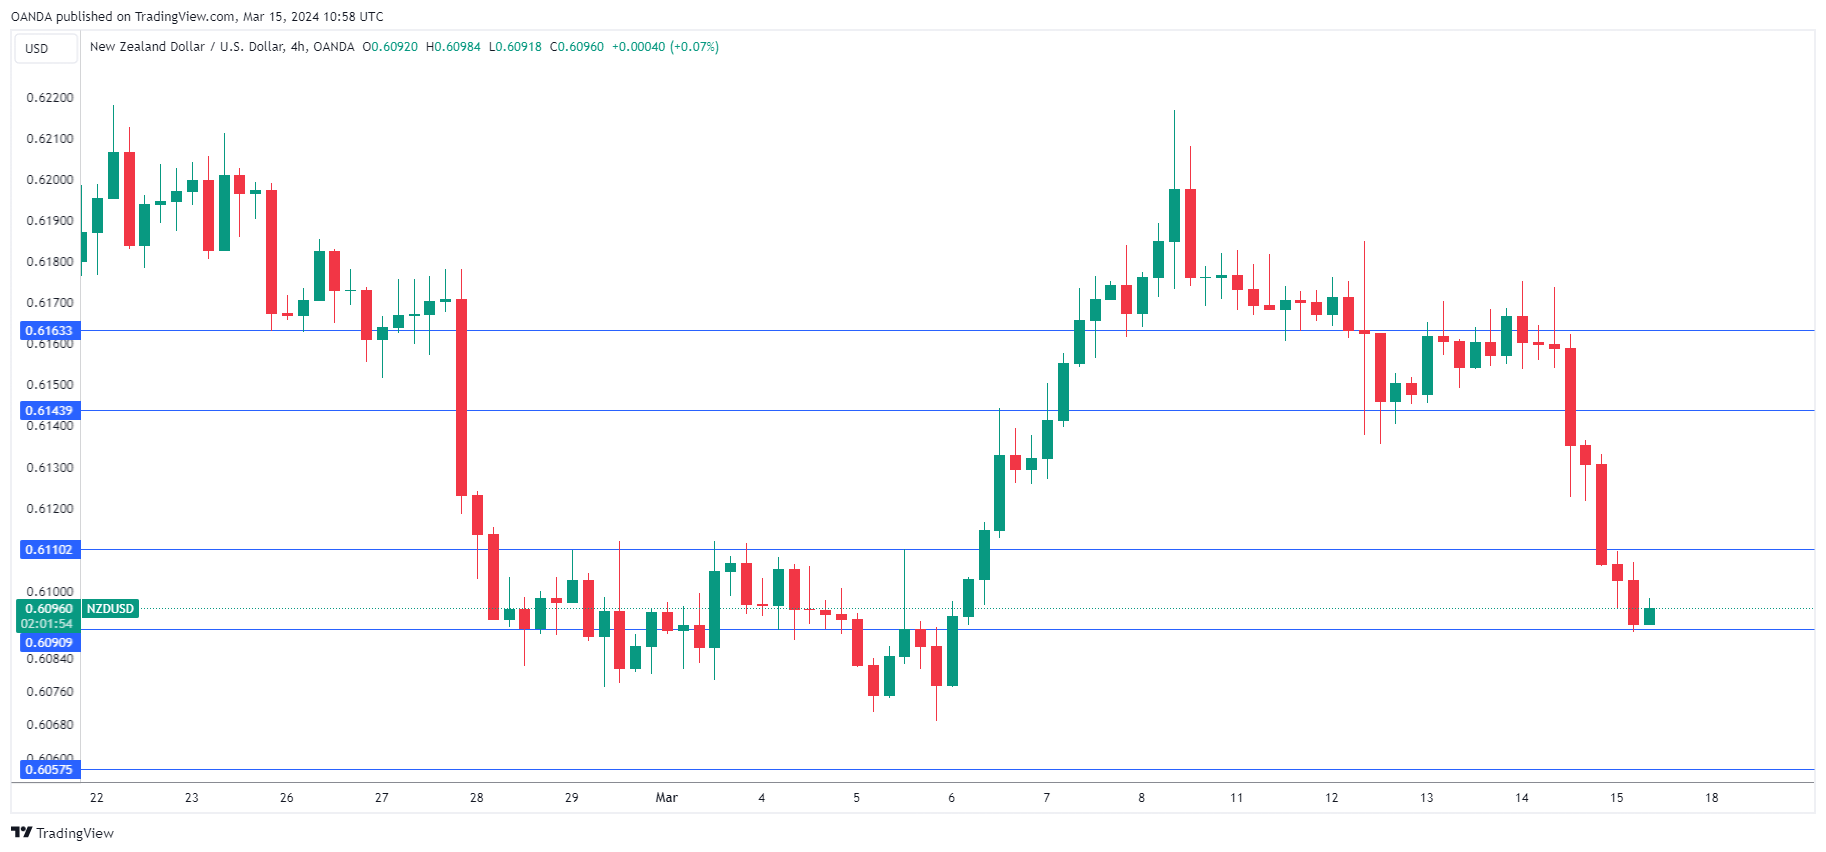
The New Zealand dollar continues to lose ground and has dropped more than 1% since Wednesday. In the European session, NZD/USD is trading at 0.6094, down 0.59%.
NZ Manufacturing PMI declines for 12th straight month
New Zealand’s manufacturing industry marked an unhappy anniversary on Friday as the sector contracted for a twelfth straight month (a PMI reading below 50 indicates contraction and above 50 indicates expansion). There was a silver lining as the BusinessNZ Manufacturing PMI improved in February for a second straight month, rising from 47.5 in January to 49.3 and beating the market estimate of 48.1.
This marked the highest level since February 2023 and raises hopes for manufacturers that there is light at the end of the tunnel. The slowdown in the New Zealand economy has dampened manufacturing activity and manufacturers reported weak demand both domestic and offshore in the February report.
It will be a busy start to next week with the release on Monday of New Zealand Services PMI and Chinese retail sales and industrial production. New Zealand’s services sector is showing signs of expansion and jumped to 52.1 in January, up from 48.8 in December. The uptrend is expected to continue in February, with a forecast of 52.9.
Chinese data often has a strong impact on the movement of the New Zealand dollar, as China is New Zealand’s largest export market. China’s retail sales is expected to fall to 5.2% y/y in January, down from 7.4% in December. Industrial production is also projected to de-accelerate to 5% in January, compared to 7.4% in December. If these key releases are weaker than expected, the New Zealand dollar could have a rough start to the week.
NZD/USD Technical
- NZD/USD has pushed below support at 0.6110 and tested support at 0.6090 earlier. Below, there is support at 0.6057
- There is resistance at 0.6143 and 0.6163
Yen Weakens Despite Japan’s Deflation Exit
The USD/JPY pair is rising, reaching 148.28 on Friday. The US dollar is strengthening across the market following the release of US retail sales data.
This information is prompting market participants to reassess their expectations for the future of the US Federal Reserve's interest rate policy. The Fed could interpret strong retail sales as a significant inflationary factor, potentially delaying the timing of any rate cut.
On Friday, Japan's Finance Minister Shunichi Suzuki stated that the Japanese economy is no longer suffering from deflation, as there is a strong trend towards wage growth. This statement is particularly noteworthy as previous comments from officials, including the Prime Minister, suggested the country had yet to fully emerge from a deflationary state.
According to Suzuki, the government has mobilised all efforts to support this wage growth trend.
The next Bank of Japan (BoJ) meeting is scheduled for next week, and high expectations surround its outcome. The interest rate could finally move out of negative territory, currently at -0.1% annually. The BoJ remains the only major central bank that maintains negative borrowing costs.
Technical Analysis of USDJPY
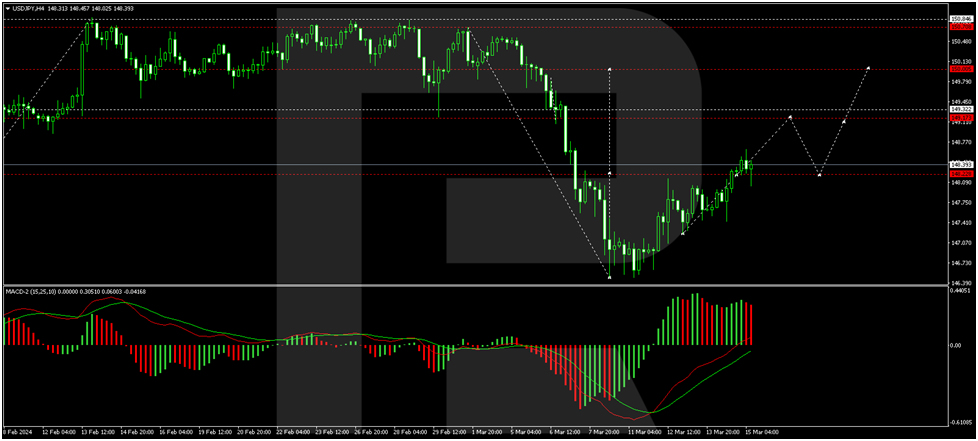
On the H4 chart, USDJPY has completed a growth wave to 148.64. Today, we consider the likelihood of forming a consolidation range below this level. Exiting upwards from this range could open the potential for a growth wave to 149.20, with the trend possibly continuing to 150.00. The MACD oscillator confirms this scenario, with its signal line breaking above zero and aiming for new highs.
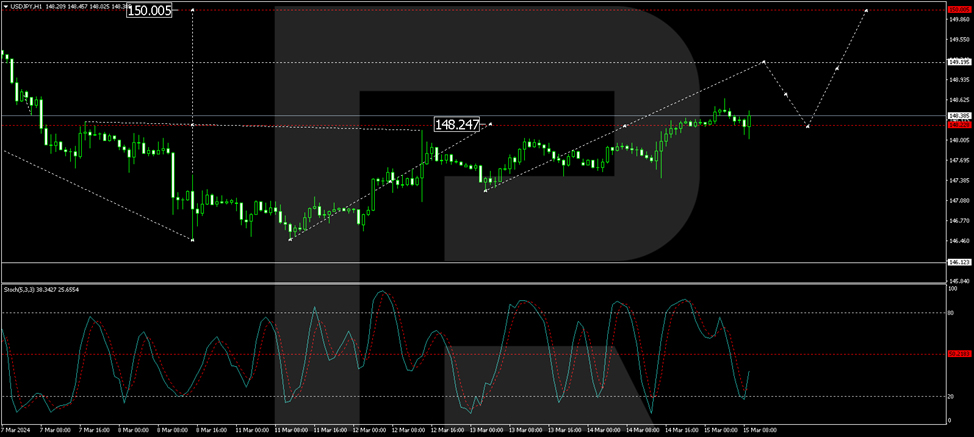
On the H1 chart, USDJPY is forming a consolidation range around 148.22. We expect an upward exit from this range and the continuation of the growth wave to 149.20. Following the completion of this level, a correction back to 148.22 (testing from above) is possible. Subsequently, the growth is expected to reach the main target of the wave at 150.00. The Stochastic oscillator supports this scenario, with its signal line above the 20 mark and ready to move towards 80.
WTI Oil Price Reaches 4-month High
The International Energy Agency (IEA) has once again raised its forecasts for global oil demand in 2024. While the agency's forecast pointed to the prospect of an oil surplus in 2023, its analysts now believe that the world will experience a shortage of oil in the second half of 2024.
Among the reasons for the shortage:
→ limitation of oil production by OPEC+ countries, it is 2 million barrels per day until the middle of the year. And it may be extended, as Bloomberg writes — the decision is scheduled for June 1;
→ changes in logistics routes due to Houthi attacks on tankers in the Red Sea.
Also, a bullish impulse for the price of WTI oil can be provided by the geopolitical situation, which remains tense.
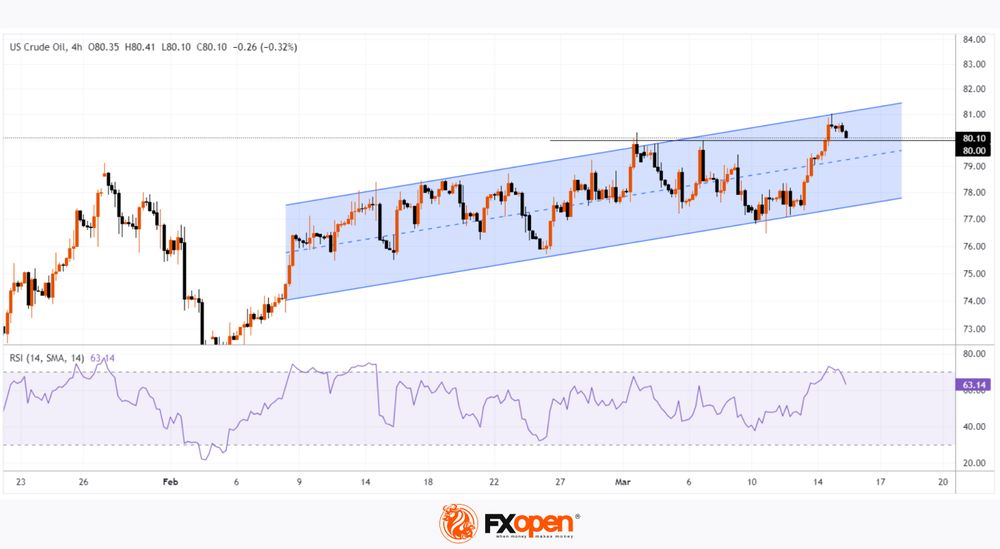
The WTI oil chart shows that:
→ the price has exceeded the psychological level of USD 80 per barrel and is trying to gain a foothold there;
→ the price moves within the ascending channel (shown in blue);
→ long upper shadows on the candles around USD 81 indicate seller activity. This is where the upper boundary of the channel lies, so there is reason to consider the level of USD 81 as current resistance.
Perhaps long position holders decided to take profits at the 4-month high in WTI oil prices. One way or another, given the activity of sellers and the presence of RSI indicator values in the overbought zone, this market is vulnerable to a pullback after growing by more than 4% this week. It is possible that the price will adjust to the median line of the channel.
Start trading commodity CFDs with tight spreads. Open your trading account now or learn more about trading commodity CFDs with FXOpen.
This article represents the opinion of the Companies operating under the FXOpen brand only. It is not to be construed as an offer, solicitation, or recommendation with respect to products and services provided by the Companies operating under the FXOpen brand, nor is it to be considered financial advice.
USD/JPY Rises, All Eyes on BoJ After Wage Deal
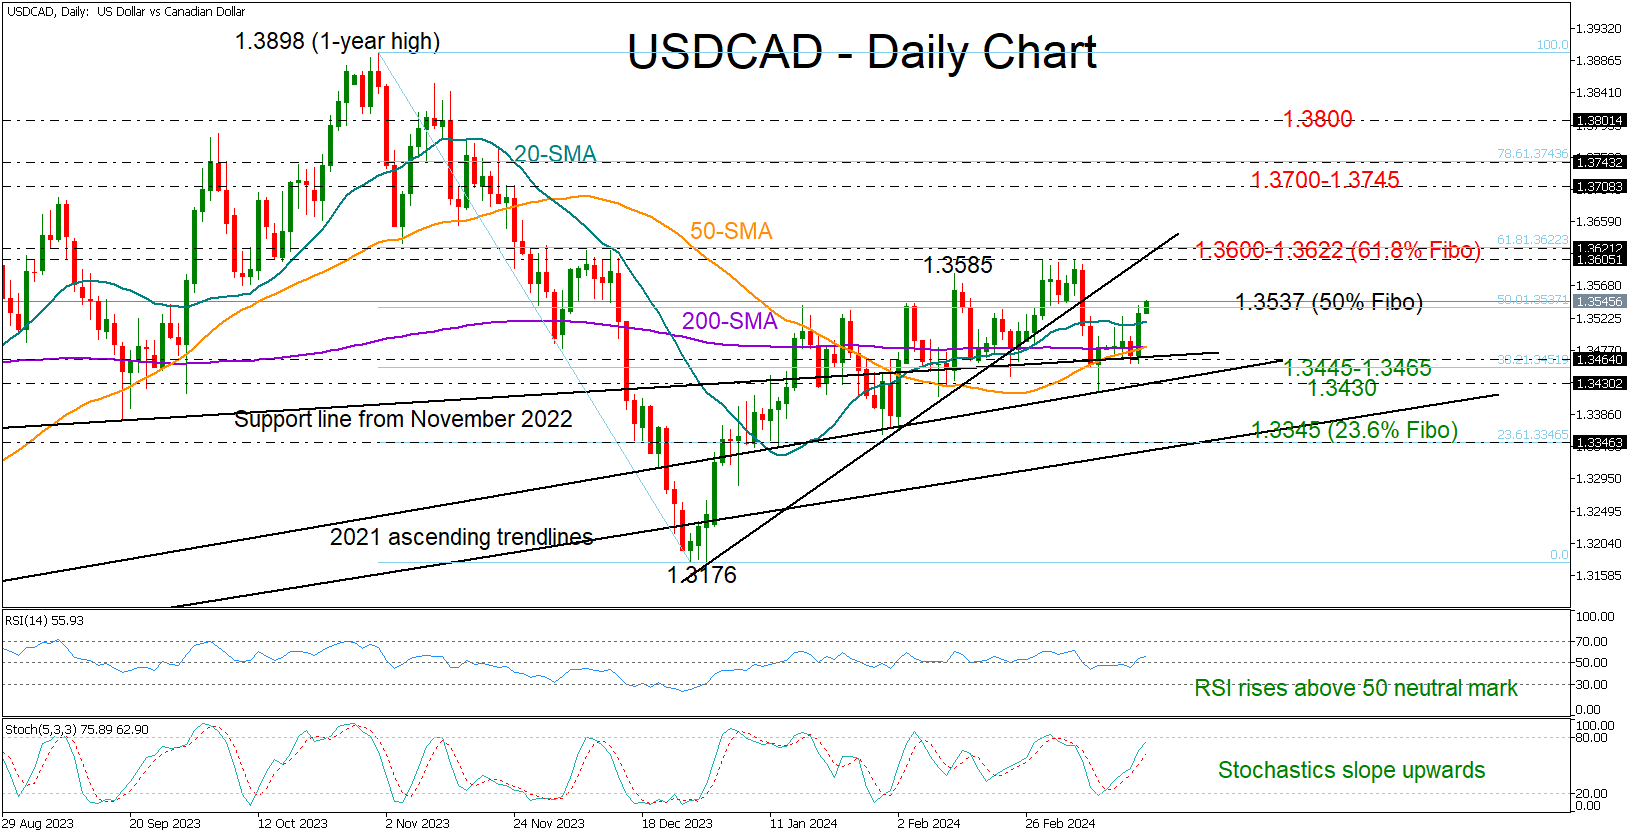
The Japanese yen has extended its losses against the US dollar for a fourth straight day and is down 1.1% this week. In the European session, USD/JPY is trading at 148.70, up 0.28%.
Japanese unions win big, BoJ considering rate hike
Japan’s largest trade union announced today that workers at Japan’s largest firms would receive a 5.28% salary raise, a huge victory for workers. This was much higher than the 2023 increase of over 3%, which was the highest pay rise in over 30 years.
The wage agreement is a crucial development ahead of the Bank of Japan’s rate announcement on March 19th, as it raises the likelihood that the BoJ will lift rates out of negative territory. The BoJ last raised interest rates in 2007, which means that a rise in rates would be a sea-change in policy and would likely send the yen higher.
So what can we expect from the central bank? It’s a close call as to whether the BoJ will shift its ultra-loose policy next week or wait until the April meeting, and BoJ members could well be split on when to raise rates.
Governor Ueda has repeatedly said that stronger wage growth is needed as evidence that inflation is sustainable, and only then will the BoJ will tighten policy. Is the wage agreement enough evidence?
The wage agreement is massive news, but it’s important to remember that the majority of Japanese workers aren’t employed by major companies and aren’t receiving the huge pay raise that the unions negotiated. This means that the new wage agreement isn’t enough on its own to determine overall wage trends. The BoJ could decide to wait until April in order to assess the impact of the wage agreement on inflation.
If the BoJ decides to pause at next week’s meeting, it could still signal that a rate hike is coming soon, and that message could boost the yen. Market participants are eagerly anticipating next week’s BOJ meeting, which promises to be very interesting.
USD/JPY Technical
- USD/JPY has pushed above resistance at 1.4863 and is putting pressure on resistance at 148.96
- 148.63 and 148.04 are providing support
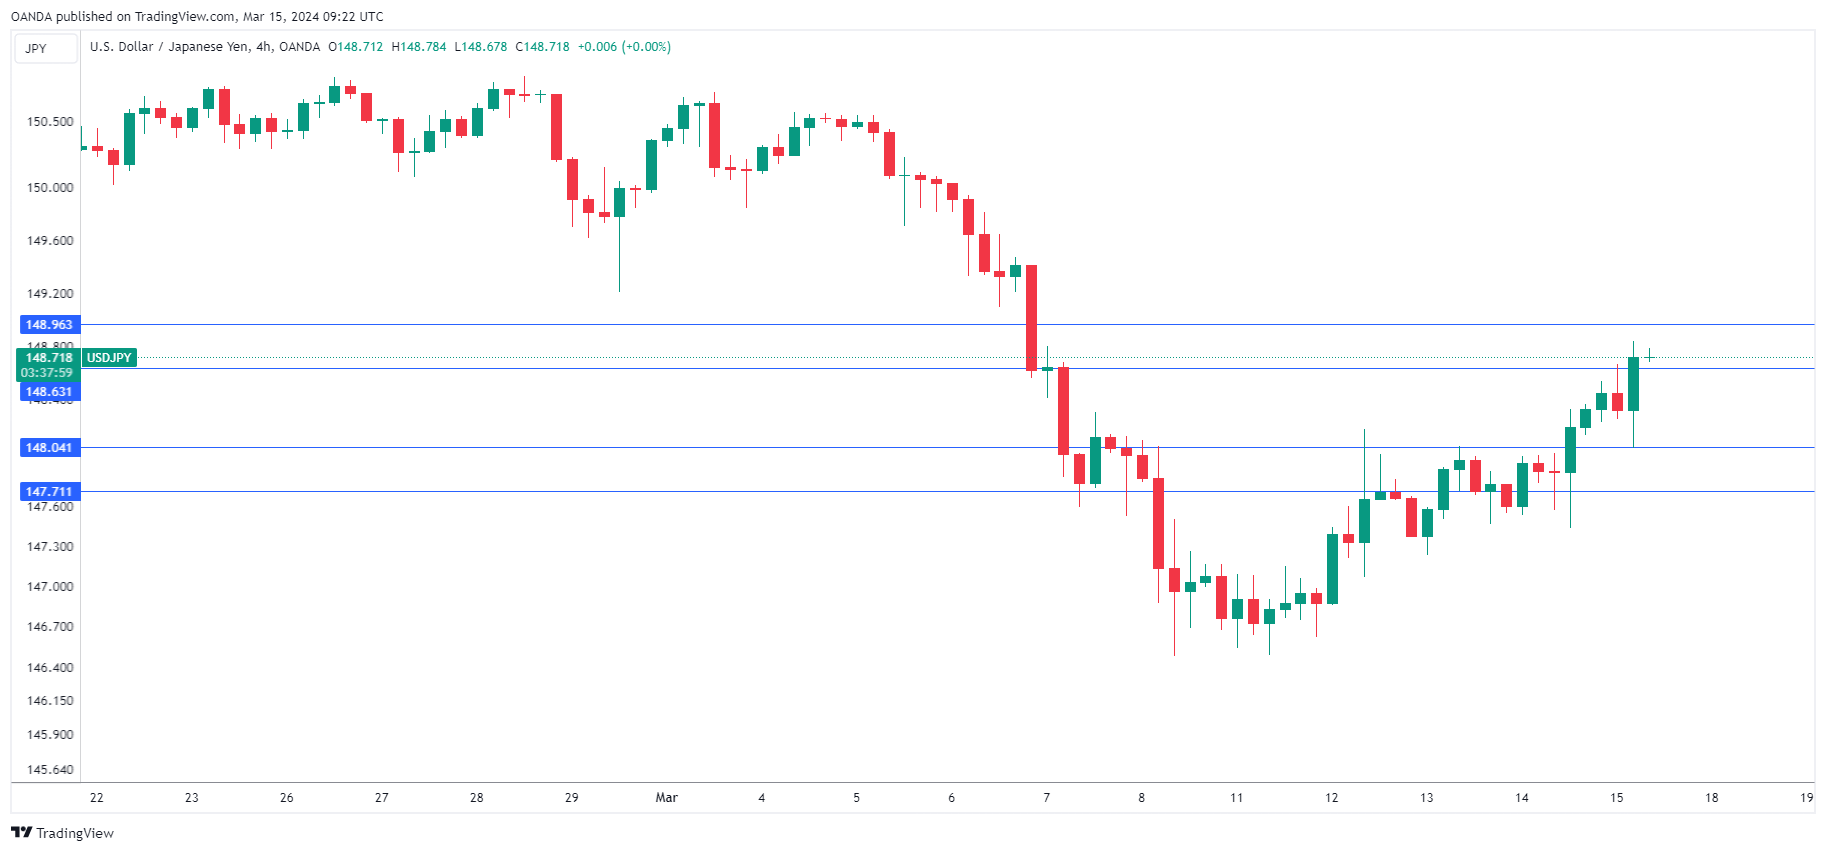
EUR/USD: Taking a Breather After Strong Fall on Thursday
The Euro is consolidating after almost 0.6% drop on Thursday (the biggest one-day loss since Feb 13).
Stronger than expected US PPI data added to hawkish rate outlook following last week’s hot inflation report and lifted the dollar.
Fresh bears found footstep at pivotal Fibo support at 1.0871 (38.2% of 1.0695/1.0981 bull-leg), with stronger bounce to signal a healthy correction and keep larger bulls in play for fresh push higher.
Daily close above broken 10DMA (1.0908) is needed to generate initial reversal signal and open way for further recovery.
Overall bullish setup of daily studies supports the notion however, downside risk still exists as near-term action is weighed by completion of bearish failure swing pattern on daily chart and a bull-trap above daily Ichimoku cloud.
Break below 1.0871 pivot to expose next key support at 1.0835 (daily cloud base reinforced by Kijun-sen) violation of which to sideline larger bulls and risk deeper pullback.
Res: 1.0913; 10963; 1.0981; 1.1000.
Sup: 1.0871; 1.0804; 1.0795; 1.0762.
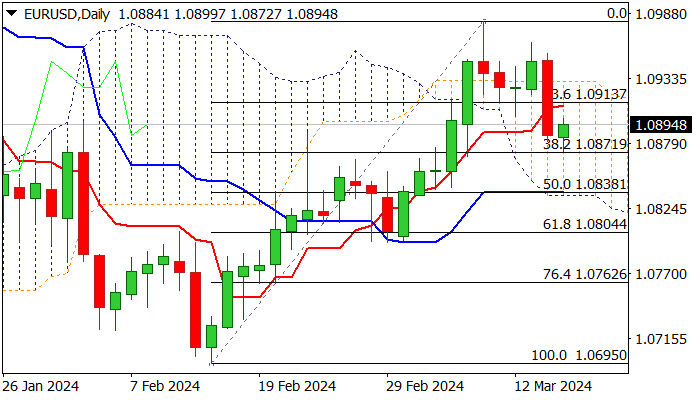
US100: Consolidated and Preparing Correction Below 18100. Key Levels on H4
- Bearish Scenario: Shorts below 18100 with TP1: 17900, TP2: 17814, and 17630 with S.L. above 18130 or at least 1% of account capital*.
- Anticipated Bullish Scenario: Intraday longs above 18130 with TP: 18219, TP2: 18270, and TP3: 18428, with S.L. below 18050 or at least 1% of account capital*. Apply trailing stop.
Bullish Scenario after Retracement: (After breaking support at 17813.95) Intraday longs above 17630 with TP: 17813, TP2: 17900, and TP3: 18000, with S.L. below 17600 or at least 1% of account capital*. Apply trailing stop.
H4 Scenarios:
After last week's historic high reached 18428.60, a sales POC formed around 18273.29, an area that was the target of the recent rally and efficiently defended by the bears.
The decline has left three uncovered POCs at 18273.29, 18219.90, and today's Thursday at 18128.45, forming a block of sales, which for now will keep prices under pressure to seek supports at 17901.50 and 17813.95, especially after decisively breaking the buying zone around 17985.43.
The breaking of the indicated supports will initiate a more extended corrective phase, with the next target being the buying zone around 17629, whose breaking on a second touch will extend the decline towards 17452. Note that US100 prices tend not to reach zones exactly but to approach within a few pips.
The bullish continuation can be renewed from the buying zones observed in the H4 chart and after the decisive breaking of the sales above zones, which will allow the price to challenge the resistances at 18265 and 18428, in an attempt to create new all-time highs.
For now, the price challenges the buying zone between 17984 and 17960, whose bullish reaction was limited to the day (D1:O) and week (W1:O) openings, indicating that as long as prices remain below the openings, it is more likely to extend sales to seek liquidity further down in the following buying zones marked on the chart with orange lines and levels.
*Uncovered POC: POC = Point of Control: It is the level or zone where the highest volume concentration occurred. If there was a bearish movement from it previously, it is considered a sales zone and forms a resistance zone. On the contrary, if there was previously a bullish impulse, it is considered a buying zone, usually located at lows, forming support zones
**Consider this risk management suggestion
**It is essential that risk management is based on capital and traded volume. For this, a maximum risk of 1% of capital is recommended. It is suggested to use risk management indicators such as Easy Order.
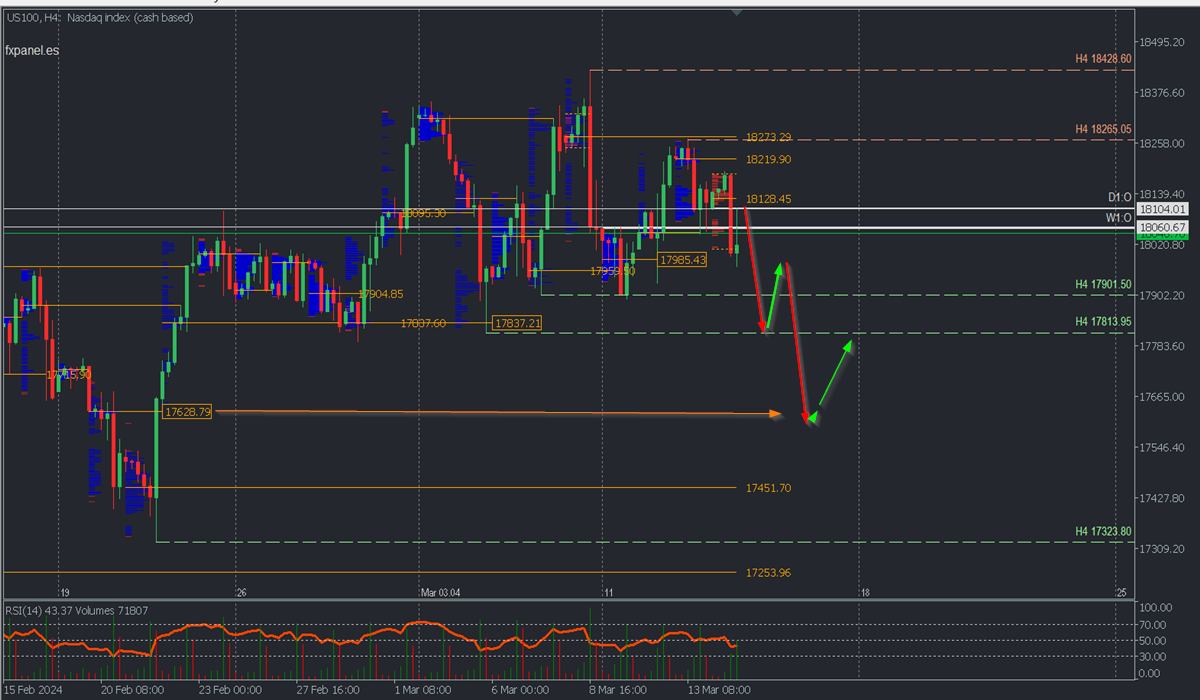
Is USDCAD Poised for Another Bullish Round?
- USDCAD brings key resistance in focus after rebound
- Technical signals are encouraging, but a bullish outlook expected above 1.3600
USDCAD made a strong comeback on Thursday, surpassing its simple moving averages (SMAs) and breaching the 1.3500 level after encountering fresh buying around the familiar long-term line from November 2022.
The 50% Fibonacci retracement of the November-December 2023 downleg is currently challenging the bulls around 1.3535. The chances of the bulls winning the game there are high because the RSI has crossed the neutral mark of 50 and the stochastic oscillator is showing an upward trend. If that proves to be the case, the pair might speed up to test the crucial resistance zone of 1.3600-1.3622, where the broken ascending trendline from December is placed. Breaking through that wall could be a game-changer, reigniting the 2024 uptrend and propelling the pair to the 1.3700-1.3745 area.
In the event the 1.3535 bar blocks the way up, the price might revisit the 1.3455-1.3465 area on the downside, where the 38.2% Fibonacci number is also positioned. Slightly lower, the 2021 ascending trendline could also act as a safeguard around 1.3430, preventing a freefall towards the 23.6% Fibonacci of 1.3345 and therefore a trend deterioration.
To summarize, USDCAD could experience more positive trading sessions in the near term, particularly if the bulls break through the resistance of 1.3535.
GBPJPY Ticks Up from Rising Trend Line
- GBPJPY recoups some of the losses
- RSI and MACD still show some weakness
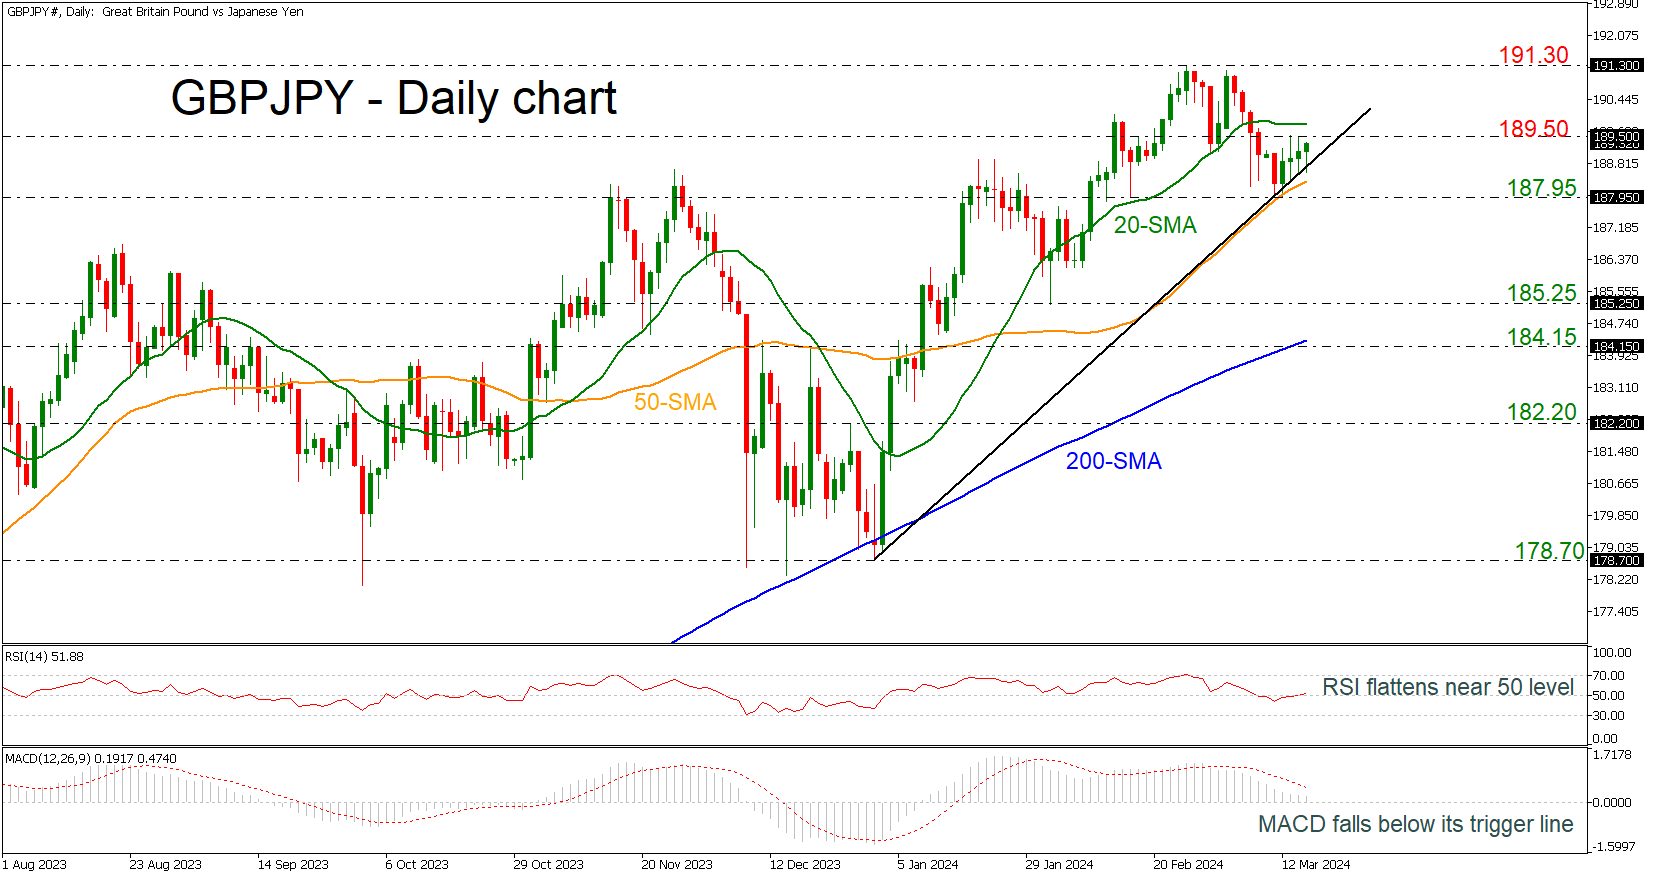
GBPJPY is recovering somewhat from the bearish movement that started from 191.30 and is following the direction of the ascending trend line.
The market is also developing within the 20- and the 50-day simple moving averages (SMAs) with the technical oscillators showing some weakness in price. The RSI is flattening near the neutral threshold of 50, while the MACD is holding beneath its trigger line and above the zero level.
In case the price overcomes the 189.50 resistance level and the immediate 20-day SMA at 189.80, then it may head towards the previous peak of 191.30.
On the other hand, in the case of a break beneath the short-term uptrend line and the 50-day SMA, then the pair could touch the 187.95 bottom. Steeper decreases could drive the market until the 185.25 support but any movements below the 200-day SMA, which stands around the 184.15 support, may change the outlook to bearish.
Summarizing, GBPJPY is looking positive in the short-term view, although that the technical oscillators are not mirroring the latest upturn.
Gold Price Rally Takes Break, Crude Oil Price Surges
Gold price rallied above $2,180 before correcting lower. Crude oil price is rising and it could climb further higher toward the $82 resistance.
Important Takeaways for Gold and Oil Prices Analysis Today
- Gold price failed to clear the $2,200 resistance and corrected lower against the US Dollar.
- A key bearish trend line is forming with resistance at $2,170 on the hourly chart of gold at FXOpen.
- Crude oil prices are moving higher above the $80.00 resistance zone.
- There is a connecting bullish trend line forming with support near $80.60 on the hourly chart of XTI/USD at FXOpen.
Gold Price Technical Analysis
On the hourly chart of Gold at FXOpen, the price was able to climb above the $2,150 resistance, as mentioned in the previous analysis. The price even broke the $2,180 level before the bears appeared.
The price traded close to the $2,200 zone before there was a downside correction. There was a move below the $2,180 pivot zone. The price settled below the 50-hour simple moving average and RSI dipped below 50. Finally, it tested the $2,150 zone.
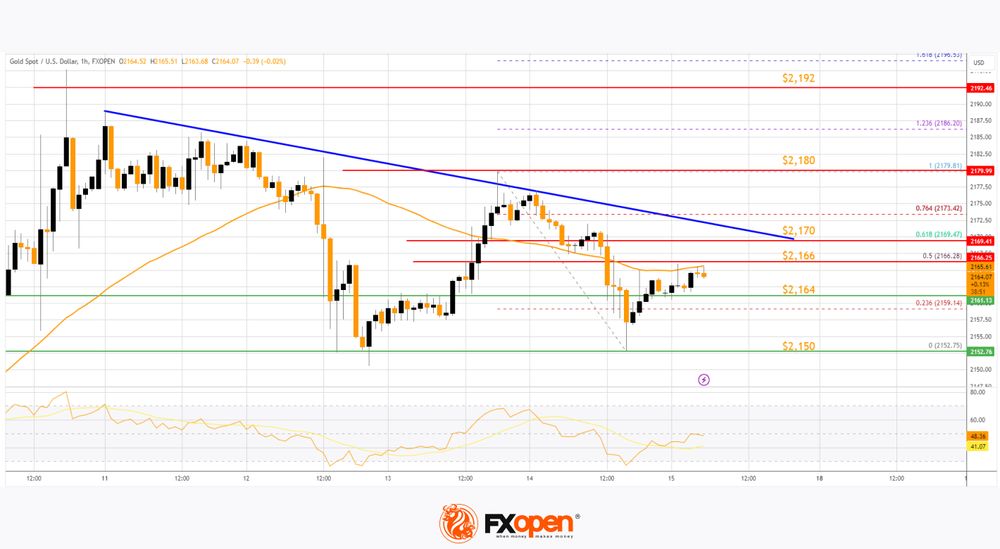
The price is now consolidating losses near the $2,160 level. Immediate resistance on the upside is near the $2,166 level or the 50% Fib retracement level of the downward move from the $2,179 swing high to the $2,152 low.
The next major resistance is near a key bearish trend line at $2,170. It is close to the 61.8% Fib retracement level of the downward move from the $2,179 swing high to the $2,152 low.
An upside break above the $2,170 resistance could send Gold price toward $2,180. Any more gains may perhaps set the pace for an increase toward the $2,200 level. If there is no recovery wave, the price could continue to move down.
Initial support on the downside is near the $2,164 level. The first major support is $2,150. If there is a downside break below the $2,150 support, the price might decline further. In the stated case, the price might drop toward the $2,132 support.
Oil Price Technical Analysis
On the hourly chart of WTI Crude Oil at FXOpen, the price started a decent increase against the US Dollar. The price gained bullish momentum after it broke the $78.20 resistance.
There was a sustained upward move above the $79.20 and $80.00 levels. The bulls pushed the price above the 50-hour simple moving average and the RSI climbed toward 65. A high was formed near $81.00 before there was a downside correction.
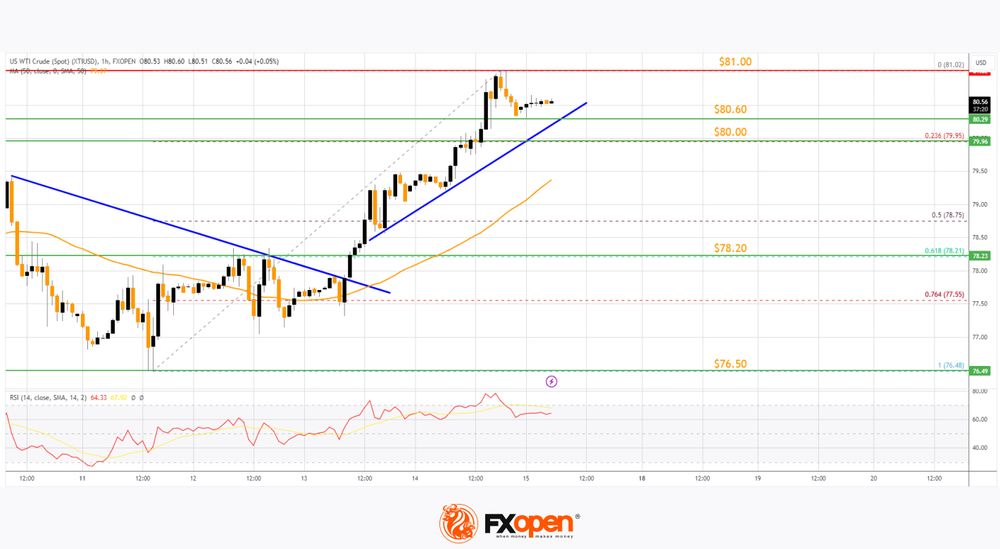
The price is still stable above the 23.6% Fib retracement level of the upward move from the $76.48 swing low to the $81.02 high. However, the bulls are active above a connecting bullish trend line with support near $80.60.
Immediate resistance is near the $81.00 level. If the price climbs further higher, it could face resistance near $82.00. The next major resistance is near the $83.20 level. Any more gains might send the price toward the $85.00 level.
Conversely, the price might correct gains and test the 61.8% Fib retracement level of the upward move from the $76.48 swing low to the $81.02 high at $78.20.
The next major support on the WTI crude oil chart is near $76.50. If there is a downside break, the price might decline toward $75.00. Any more losses may perhaps open the doors for a move toward the $73.50 support zone.
Start trading commodity CFDs with tight spreads. Open your trading account now or learn more about trading commodity CFDs with FXOpen.
This article represents the opinion of the Companies operating under the FXOpen brand only. It is not to be construed as an offer, solicitation, or recommendation with respect to products and services provided by the Companies operating under the FXOpen brand, nor is it to be considered financial advice.
Japan’s Shunto negotiations yield 5.28% pay rise, a 33-Year High
Japan's annual labor negotiations, known colloquially as "Shunto" or the "spring wage offensive," have culminated in a remarkable outcome this year, with major firms agreeing to a pay increase of 5.28%—the highest in 33 years.
This significant hike, announced by the country's largest trade union group Rengo, surpasses the previous year's increase of 3.80%. With wage talks for smaller companies anticipated to wrap up by the end of March, this development is a critical one in the context of monetary policy considerations by BoJ.
This wage growth is likely to be viewed positively by BoJ officials, who are widely expected to be on the verge of ending the long-standing negative interest rate policy. However, the exact timing of such a policy shift, whether it could be announced as soon as next week's meeting or delayed until April, remains a matter of speculation.
A recent Reuters poll conducted between March 11 and 14 showed that out of 34 economists surveyed, only 12 anticipate a rate hike in the upcoming week. The majority, 21 out of 34, foresee such a move in April.
Those in favor of an April decision point to BoJ's access to more comprehensive information by then, including results from Tankan survey, insights from branch managers, and a new set of economic projections.
Yet, history has shown that BoJ has a penchant for surprising the markets. This unpredictability serves as a reminder to never rule out the possibility of a sooner move.