Sample Category Title
Canadian Dollar Seeks Opportunities for Growth
The USDCAD pair remains within a sideways range, with the Canadian dollar occasionally showing a tendency to strengthen.
Recent DES data revealed that Canadian households have become more affluent. In Q4 2023, their "net" worth increased by 1.8%, or 300 billion Canadian dollars, smoothing out the decline seen in the previous quarter.
This increase can be attributed to the recovery in financial market returns, as both stocks and bonds appreciated during the period. This dynamic compensated for the "modest" decline in the country's housing market value. Overall, Canadians became 712.7 billion CAD richer in 2023 than they were the previous year.
Borrowing rates in Q4 of last year increased for the second consecutive quarter, with households attracting 29.5 billion CAD, primarily in mortgage loans, followed by consumer loans. These figures raise concerns, suggesting that some households may become more indebted than others. Canada's economy's loan debt is currently estimated at 2.9 trillion CAD, with three-quarters of these debts being mortgage loans. However, in the economic context, household debt as a percentage of Canadians' disposable income accounts for 178.7% in Q4, slightly lower than in Q3 of last year and the lowest level since the end of 2015. Thus, while debts exist, the overall picture is relatively stable.
USDCAD technical analysis
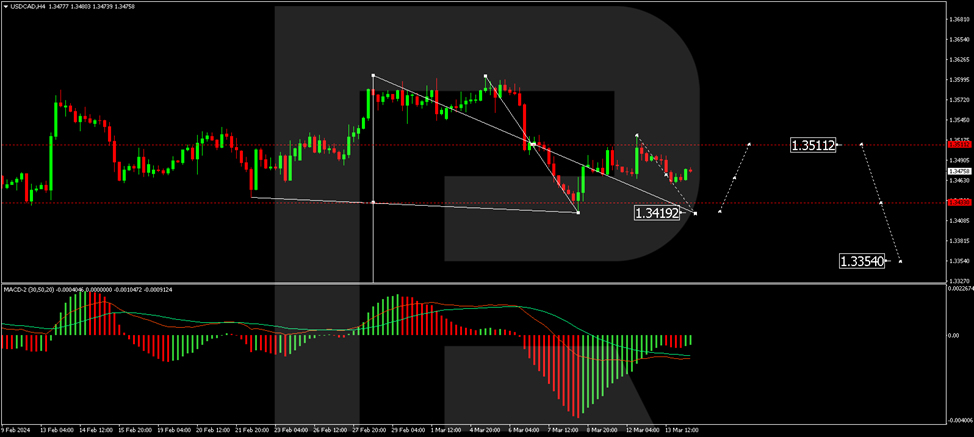
On the H4 chart of USDCAD, a declining wave is forming towards 1.3403. Today, we are considering the development of its fifth structure. After reaching the target level, a correction to 1.3511 is possible. Subsequently, we expect the beginning of a new declining structure towards the local target of 1.3354. This scenario is confirmed by the MACD indicator, whose signal line is below the zero mark and heading strictly downward towards new lows.
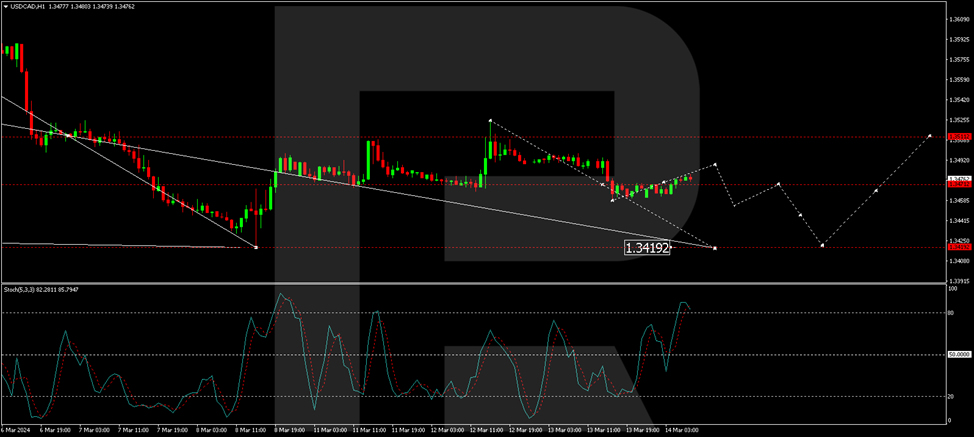
On the USDCAD H1 chart, the first structure of the fifth declining wave has been completed. Today, we are considering the possibility of a correction to 1.3488. After its completion, we expect a decline to 1.3454, then a rise to 1.3471 (testing from below), and then a decline to 1.3420. This is the first target. The stochastic oscillator, with its signal line above the 80 mark and preparing to drop to 20, also confirms this scenario.
US DJIA Technical: Bullish Breakout Ahoy
- In the past five days, the year-to-date laggard Dow Jones Industrial Average (DJIA) has played a positive catch-up.
- On a rolling 5-day performance basis, the DJIA has outperformed with a gain of +1.10% over the Nasdaq 100’s loss of -0.70% due to recent softness seen in the share price of Nvidia.
- Watch the key short-term support of 38,930.
On a year-to-date performance basis as of 13 March 2024, the Nasdaq 100 has managed to record a gain of 8.3% that surpassed the return of the Dow Jones Industrial Average of +3.50%.
Interestingly, in the past five days (5-day rolling basis as of 13 March), the laggard Dow Jones Industrial Average has started to play a catch-with with a return of +1.10% that overtook the Nasdaq 100’s loss of -0.70%.
The primary attribution to the current short-term outperformance of the Dow Jones Industrial Average over the Nasdaq 100 has been the lacklustre performance of the Artificial Intelligence (AI) theme play leader, Nvidia (third largest component market cap weightage stock in Nasdaq 100) where its share price has shed -5.6% over the same period.
Potential major bullish basing condition in ratio chart of DJIA/NDX
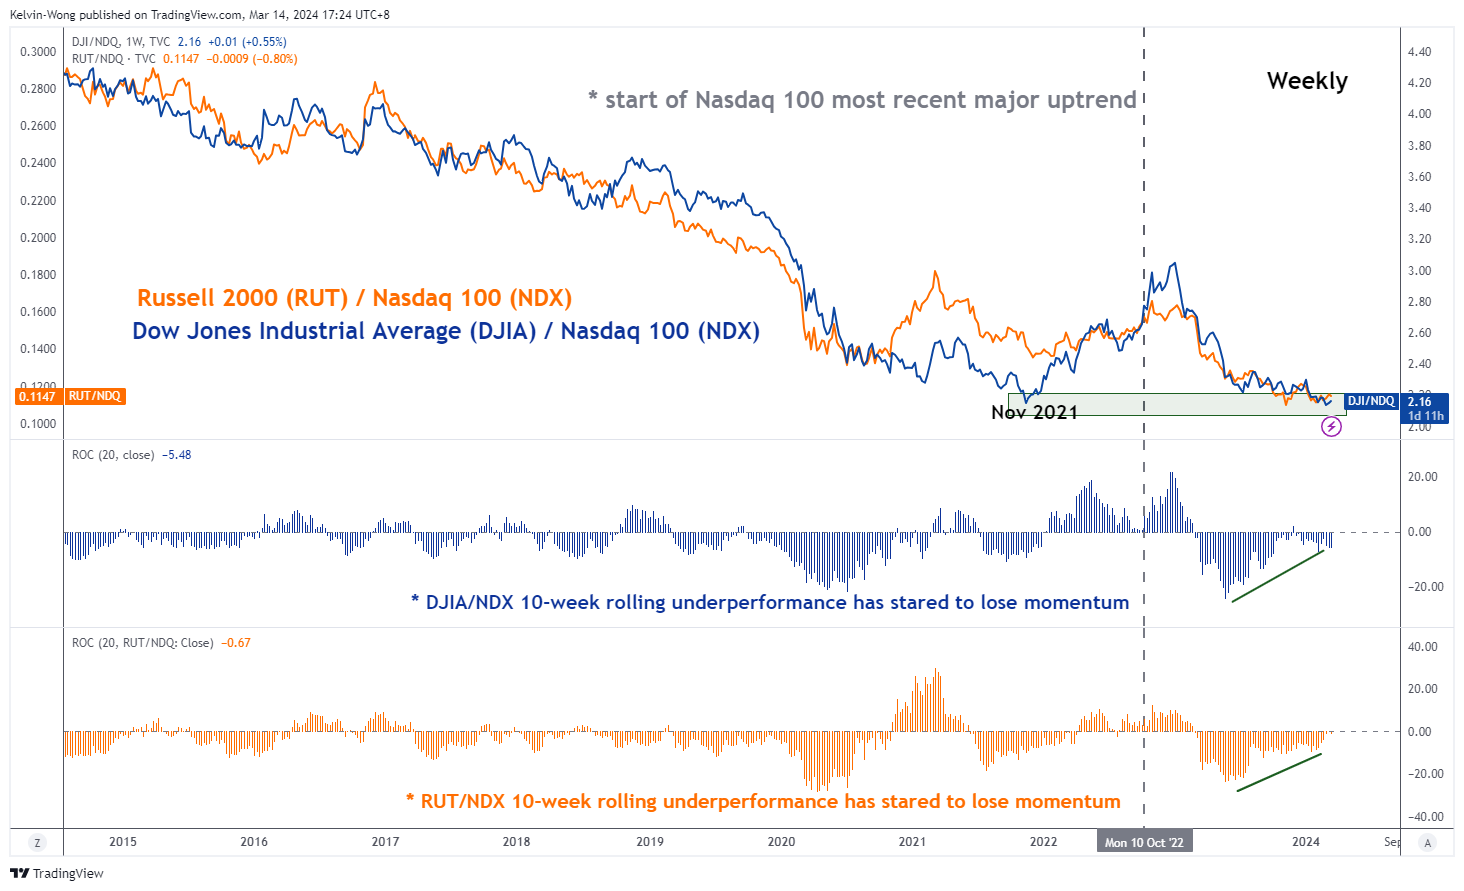
Fig 1: Ratio charts of DJIA & Russell 200 over Nasdaq 100 as of 14 Mar 2024 (Source: TradingView, click to enlarge chart)
The ratio chart of the Dow Jones Industrial Average (DJIA) over the Nasdaq 100 has started to form a potential major basing formation by not breaking below its prior significant November 2021 swing low (see Fig 1).
Also, its 10-week rolling underperformance measured by the ratio’s rate of change has continued to display a bullish divergence condition which suggests a potential looming major outperformance of DJIA over the Nasdaq 100.
Price actions cleared above 20-day moving average
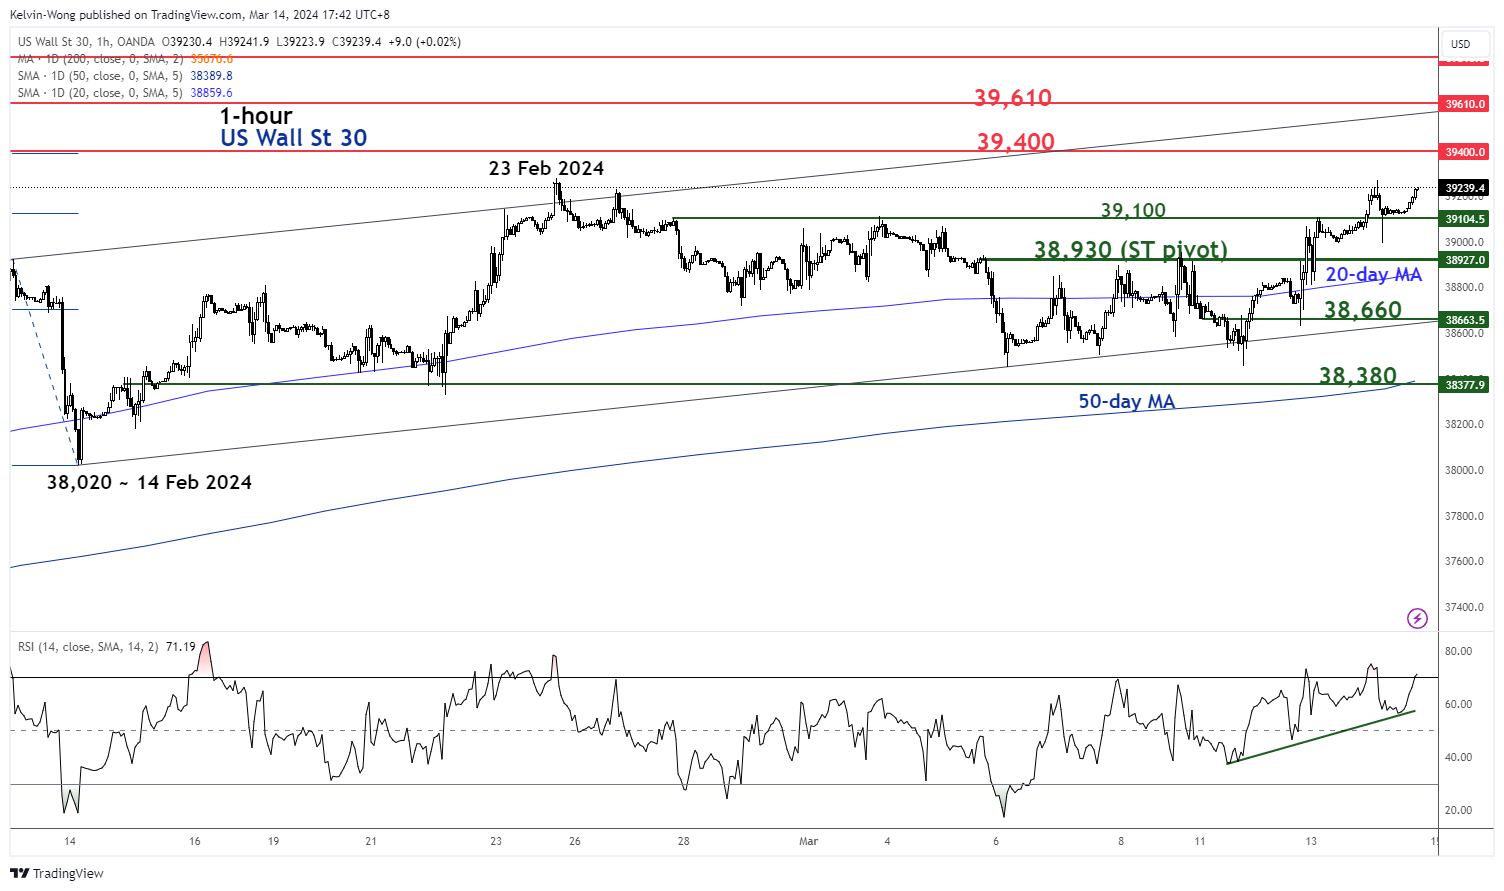
Fig 2: US Wall St 30 short-term trend as of 14 Mar 2024 (Source: TradingView, click to enlarge chart)
Yesterday, 13 March’s price actions movement of the US Wall St 30 Index (a proxy of the Dow Jones Industrial Average futures) staged a bullish breakout from its prior choppy minor range configuration in place since 23 February (see Fig 2).
In addition, the Index has also surpassed the 20-day moving average which suggests the potential revival of bullish momentum at least in the near-term horizon.
If the 38,930 short-term pivotal support holds, the Index may continue to shape “higher highs” for the next intermediate resistances to come in at 39,400 and 39,610 (also the upper boundary of the minor ascending channel from 14 February 2024 low).
On the flip side, a break below 38,930 negates the bullish tone for another round of choppy minor corrective decline that may expose the next intermediate supports at 38,660 and 38,380 (also the upward-sloping 50-day moving average).
AUDUSD Waits for Direction After Bullish Break
- AUDUSD squeezed between key levels
- Traders indecisive ahead of US retail sales
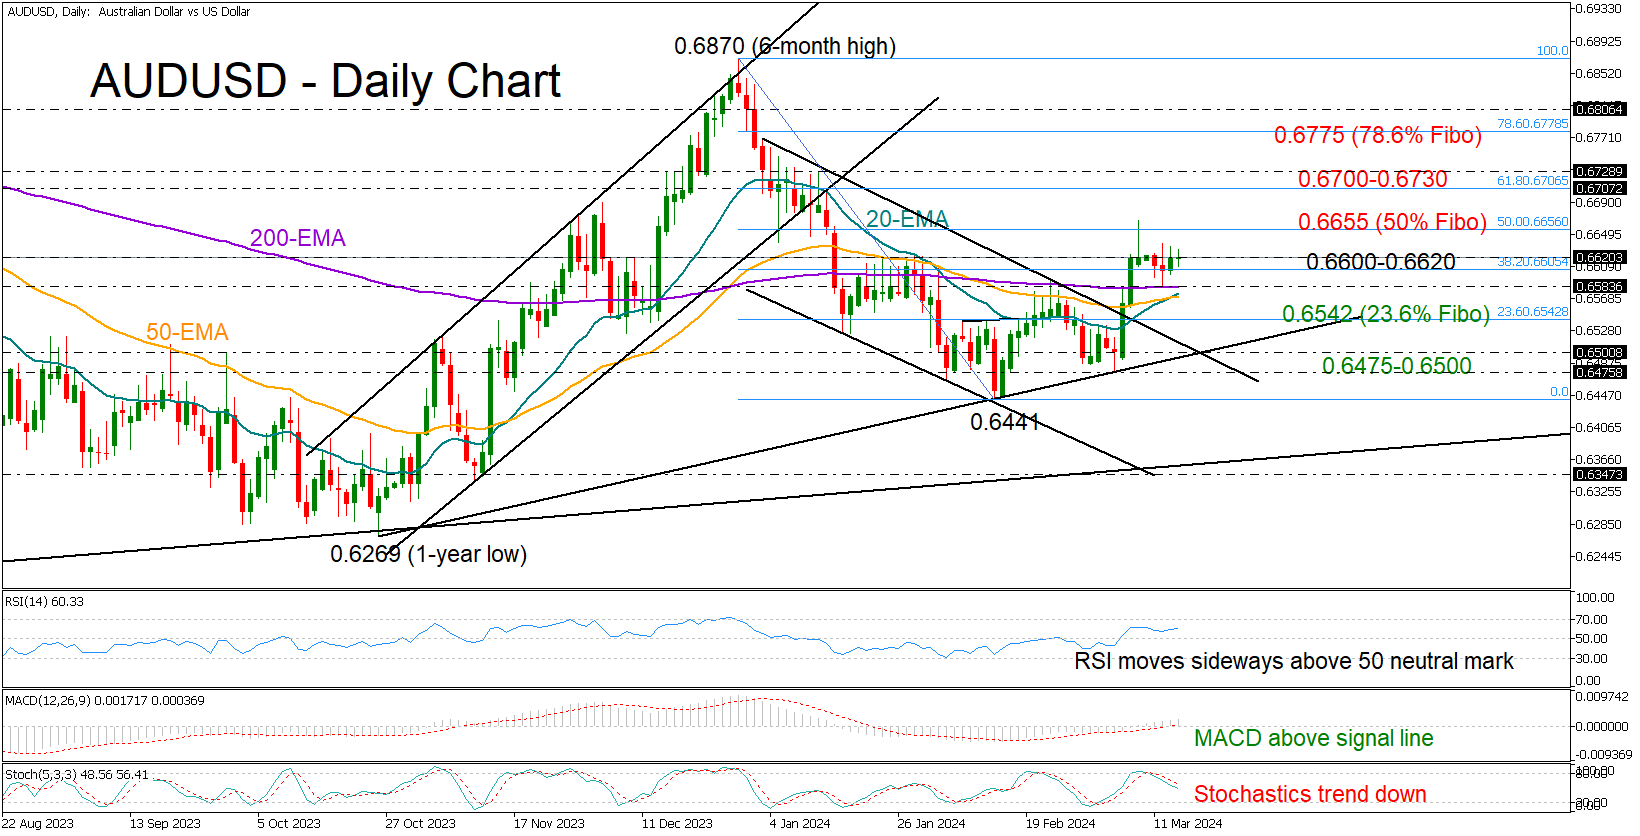
AUDUSD regained positive momentum and climbed above its exponential moving averages (EMAs) after breaking out of its 2024 bearich channel. But the 0.6620 region, which was a tough barrier in January, dented the upside forces following the flash spike to 0.6666.
The technical indicators are sending mixed signals, though the nearby support area of 0.6600, which has been limiting downside movements, is preserving a ray of hope that the ongoing tight consolidation phase might develop to the upside.
A close above 0.6620 could help the price to reach the 50% Fibonacci mark of 0.6655 and then stretch towards the 61.8% Fibonacci of 0.6706 and the 0.6730 resistance. Additional gains from there are expected to pick up steam towards the 0.6770 barrier.
Should the price dip below the 38.2% Fibonacci level of 0.6600 and the EMAs, it may find immediate support at the 23.6% Fibonacci mark of 0.6542, thus preventing a decline towards the ascending trendline from October at 0.6500. If the bears claim the March low of 0.6476 too, the door will open for the February trough of 0.6441.
All in all, AUDUSD is within a tight neutral territory, waiting for a clear close above 0.6620 or below 0.6583 to get a new direction.
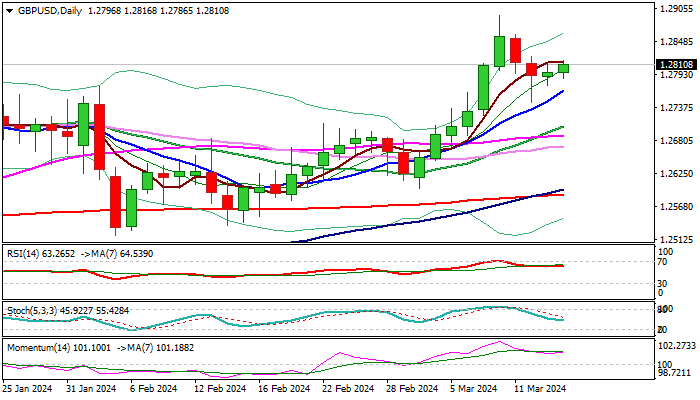
GBP/USD: Remains Constructive Ahead of US Data
Cable is probing above 1.2800 mark in early Thursday, adding to initial signals that shallow correction from new 8-month high (1.2893) might be over.
Two-day pullback was contained by rising 10DMA, with strong downside rejection on Wednesday, pointing to solid bids and signaling that larger bulls remain firmly in play.
Technical picture on daily chart is bullish (positive momentum is strong and Tenkan / Kijun-sen in bullish setup and diverging), with fresh recovery seeing a daily close above 1.2800 (Fibo 38.2% of 1.2893/1.2745 correction) as minimum requirement to keep near-term action biased higher.
Sterling regained traction after markets digested US inflation data and kept growing expectations for June rate cut, which put the dollar under pressure again.
Markets await release of a batch of US economic data today (retail sales, weekly jobless claims, producer price index) for fresh signals.
Res: 1.2820; 1.2837; 1.2858; 1.2893.
Sup: 1.2780; 1.2765; 1.2745; 1.2714.
USD/JPY: Analysts Adjust Forecasts for Strengthening of Yen
Since the beginning of 2024, the USD/JPY price has been in an uptrend (as shown by the blue channel), but when the rate exceeded the psychological level of 150 yen per US dollar, market sentiment changed. This was due to expectations that the Bank of Japan would take interest rates out of negative territory — and statements from officials gave clear indications of this possibility.
Expecting a tightening of monetary policy, the yen sharply strengthened against the dollar, and a bearish A→B impulse formed on the USD/JPY chart. However, having reached the level of 147 yen per US dollar (and dropped slightly below it), the market has stabilized. Moreover, we see some recovery: today, the USD/JPY price is trading around 147.8.
From a fundamental analysis point of view, analysts believe that the strength of the US economy should not be underestimated. And if the Bank of Japan raises rates, it will not be in an aggressive manner. Bloomberg writes that Nomura Securities Co., Mizuho Bank Ltd. and Citigroup Global Markets Japan Inc. have adjusted their forecasts for the yen in recent weeks. On average, they forecast the rate to be around 140 yen per US dollar at the end of this year. HSBC Holdings Plc, in turn, expects the yen to end the year at 136 against the US dollar.
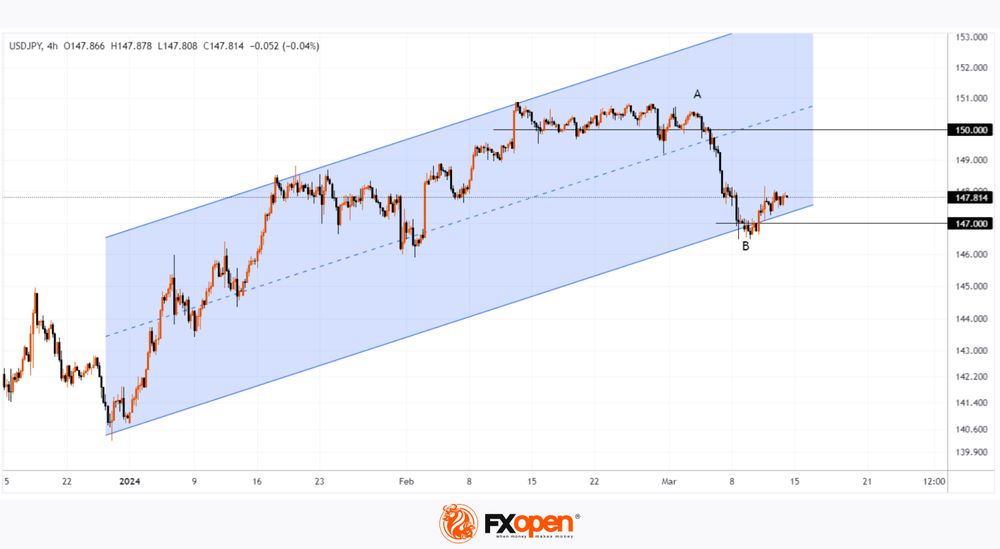
From the point of view of technical analysis of USD/JPY, the current recovery may be due to the influence of support from the lower border of the ascending channel.
Thus, traders can assume that the recovery will end (for example, rising to approximately 148.6 — 50% of the A→B momentum), with the bears attempting to resume the downward trend with a new assault on the lower channel boundary. If it turns out to be successful, this will open the way for the price to reach the levels indicated in analysts' forecasts.
Information from the Bank of Japan will be key. Its interest rate decision is scheduled for Tuesday, March 19.
Trade over 50 forex markets 24 hours a day with FXOpen. Take advantage of low commissions, deep liquidity, and spreads from 0.0 pips. Open your FXOpen account now or learn more about trading forex with FXOpen.
This article represents the opinion of the Companies operating under the FXOpen brand only. It is not to be construed as an offer, solicitation, or recommendation with respect to products and services provided by the Companies operating under the FXOpen brand, nor is it to be considered financial advice.
WTI Oil Futures Fight With 80.80 Bar
- WTI crude rebounds off 200-day SMA
- Remains in an uptrend in the short-term
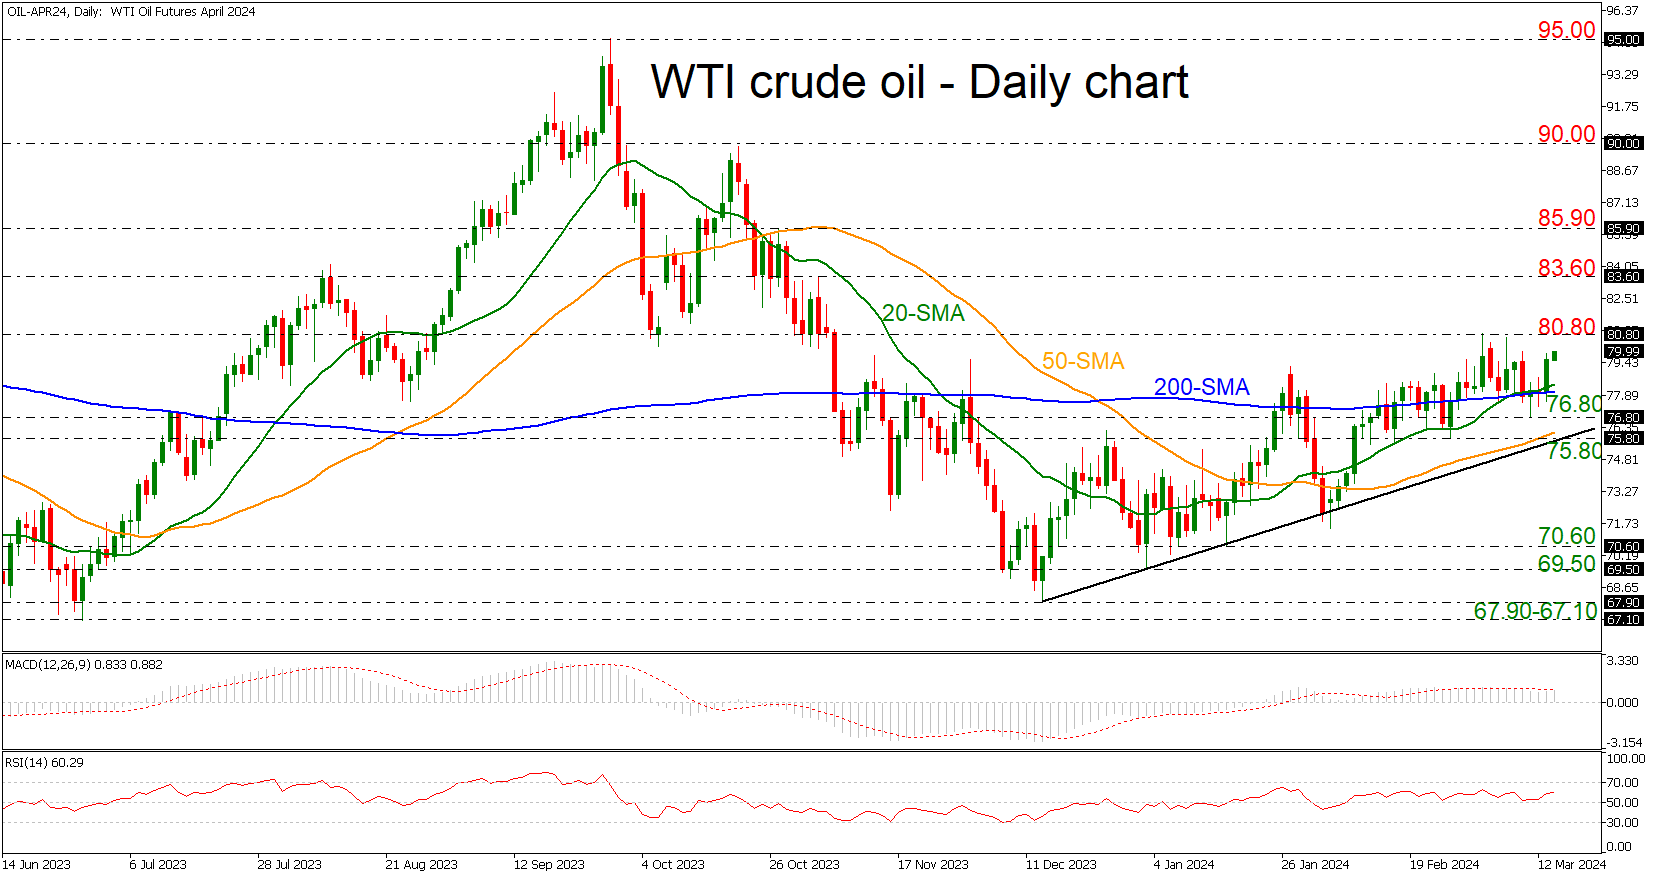
WTI oil futures are finding a strong support level near the 200-day simple moving average (SMA) at 78.00 and are also struggling to jump beyond the 80.80 resistance. The price has been in an uptrend since mid-December with the technical oscillators suggesting a neutral to bullish bias. The RSI is pointing north above the 50 territory, while the MACD is moving sideways below its trigger line and above the zero level.
If the market manages to pick up speed, the 80.80 level could offer nearby resistance ahead of the 83.60 barricade. A significant close above the latter would break the 85.90 hurdle, raising chances for further increases.
Should prices decline, immediate support could be found around the 200-day SMA at 78.00, an area which has provided both resistance and support from January to March. Then a leg below that level, the price could meet the 75.80-76.80 support, which encapsulates the short-term ascending trend line. A drop lower could change the outlook to a neutral one, hitting 70.60.
In a nutshell, WTI crude oil is moving horizontally in the very short-term view, but an increase above 80.80 could endorse the longer-term bullish outlook.
ECB’s Stournaras advocates two rate cuts by summer break, four throughout the year
ECB Governing Council member Yannis Stournara, a known dove, proposed two rate reductions "before the summer break" and a total of four throughout the year. This strategy, he argues, is essential to ensure that ECB's monetary policy "does not become too restrictive" in the face of current economic challenges.
In an interview, Stournaras emphasizes the urgency of beginning these rate cuts soon, but not in April, as there will be "only little new information" available before then.
The rationale behind Stournaras's push for rate cuts stems from his observations on Eurozone's economy is "much weaker than expected," with risks skewed to the downside. Meanwhile, inflation, although significantly reduced, presents a balanced risk profile.
Addressing concerns about risk of "wage-price spiral," Stournaras argued that wages are merely "catching up, not leading inflation." He also highlights the moderating trend in nominal wage growth and the capacity of profits to absorb part of the pay increases, suggesting that fears of a wage-driven inflationary loop may be overstated.
Looking ahead, Stournaras envisions the deposit rate gradually decreasing to 2% by the end of 2025 or the beginning of 2026. However, he draws a line at this level, suggesting that rates should not fall below the pre-pandemic levels of 2%.
Greenback’s Performance Has Been Lackluster Recently
Markets
US Treasuries extended their post-CPI sell-off yesterday in absence of eco data or other news. US yields added 2.8 bps (30-yr) to 5.3 bps (3-yr). The US 2-yr yield is gradually moving back in the direction of the YTD high at 4.74%. Longer tenors show a similar dynamic but there’s some more ground to cover (US 10-yr YTD high at 4.35%). Following upward CPI surprises in January and February, US (CPI) headline and core inflation are now both set to stay above 3% over the course of 2024 with inflation dynamics re-accelerating into Q2. This context suggests significant hawkish risks to next week’s FOMC meeting and to Fed policy this year in general. In absence of additional disinflation evidence in coming inflation reports, we err on the side of delaying a first policy rate cut to September at the earliest. The US eco calendar can today trigger a further hawkish repositioning with February retail sales, producer price inflation and weekly jobless claims on the agenda. The proof of evidence again tipped to the other side. Anything apart from big misses can extend the US Treasury sell-off. Such underperformance should gradually start to support the dollar as well. The greenback’s performance has been lackluster recently, both in case of (minor) risk corrections and in case of rising US yields. We must add that German yields managed to follow the US pace yesterday, rising by 3.5 bps (5-yr) to 5 bps (30-yr). EUR/USD yesterday closed at 1.0948 from an open 1.0927. The ECB’s changes to its operational framework had no direct impact on trading. They will continue to steer policy by adjusting deposit rates and will narrow the spread between the MRO rate and the deposit rate from the current 50 bps to 15 bps from September 18.
Overnight Asian risk sentiment is mixed this morning with China underperforming. Other Asian bourses neglect yesterday evening’s negative WS close (-0.50%). Decent UK housing data (see below) can’t inspire sterling which is back at well-known territory (EUR/GBP 0.8550) after unexpectedly testing the 0.85 support zone at the end of last week. Next week’s UK inflation report and Bank of England meeting can perhaps finally break the deadlock in the currency pair. Our overall bias for today is for higher core bond yields and a firmer dollar.
News & Views
Polish MPC member Janczyk indicated that the Polish central bank (NBP) will resume the debate about a possible interest rate cut in the third quarter when the outlook in inflation becomes clearer. According to Janczyk, the NBP will lookt at at how favourable economic data will be and at which factors that may fan inflation, including government decisions (eg restoring a 5% VAT on food and/or easing measures aimed to cap energy prices). Janczyk estimates the impact to restore to VAT on food may add 0.8 ppt to inflation, but this might be mitigated by competition in the retail sector. The comments from Janczyk bring somewhat of a more moderate message compared to recent guidance from NBP governor Glapinski who said that there might be no case for interest rates cuts further this year. Janczyk’s comments didn’t hurt the zloty. At EUR/PLN 4.28, the Polish currency is trading near the strongest levels against the euro since March 2020.
A survey of the Royal Institution of Chartered Surveyors (RICS) showed signs of a gradual improvement in the UK housing market. The index of new buyer inquiries printed at a net balance of +6, unchanged from January but holding at the strongest level since February 2022. The net balance of new instructions to sell rose further from 12 to 20, the best level since autumn 2020. Agreed sales eased slightly from 4 to -3, but sales expectations are still expected to rise (6 from 12). The house price balance of the survey also improved from -19% to -10%, the best level since October 2022. The RICS survey states that “the near-term outlook is still somewhat cautious reflecting, in part, the suspicion that the recent easing in mortgage rates is likely to stall on the back of ongoing uncertainty about the timing and speed of interest rate reductions”
GBP/JPY Daily Outlook
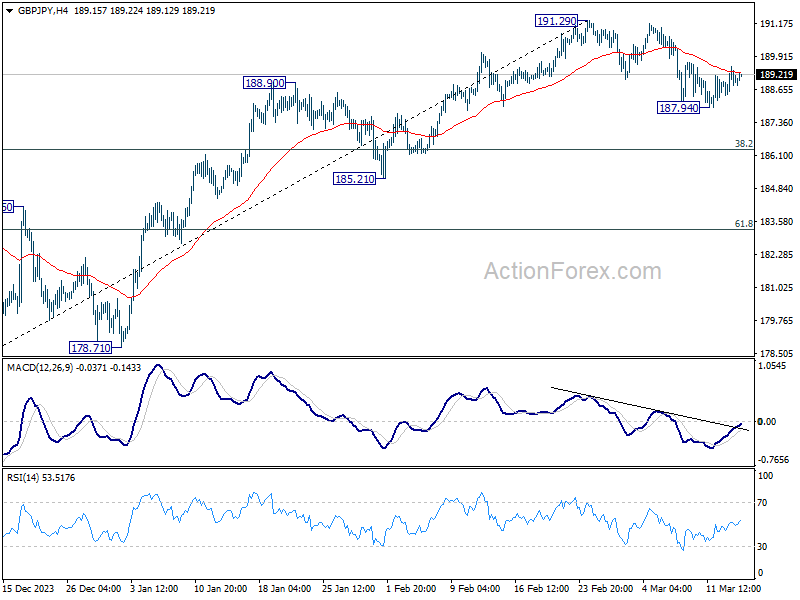
Daily Pivots: (S1) 188.48; (P) 189.02; (R1) 189.61; More.....
Outlook in GBP/JPY remains unchanged and intraday bias stays neutral. On the downside, below 187.94 will resume the decline from 191.29 to 38.2% retracement of 178.32 to 191.29 at 186.33. Sustained break there will raise the chance of larger scale correction and target 61.8% retracement at 183.27. On the upside, though, firm break of 55 4H EMA (now at 189.29) will retain near term bullishness and bring retest of 191.29 high.
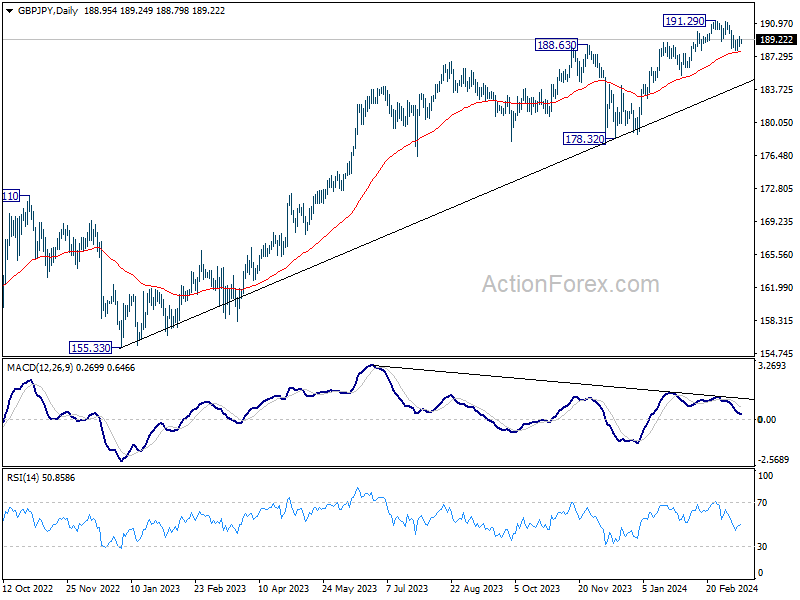
In the bigger picture, up trend from 123.94 (2020 low) is in progress. Medium term outlook will stay bullish as long as 178.32 support holds. Next target is 195.86 long term resistance (2015 high).
EUR/JPY Daily Outlook
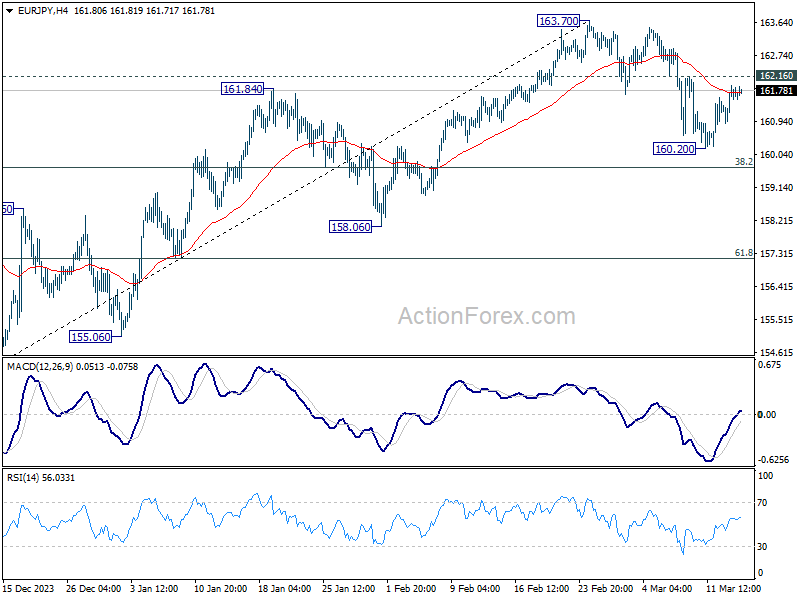
Daily Pivots: (S1) 161.13; (P) 161.54; (R1) 162.18; More...
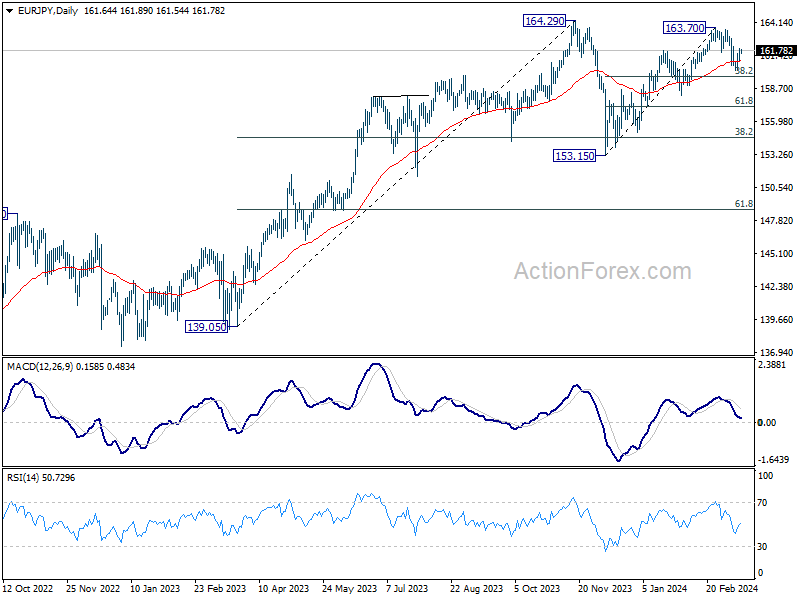
Intraday bias in EUR/JPY remains neutral and outlook is unchanged. On the downside, below 160.20 will resume the fall from 163.70 to 38.2% retracement of 153.15 to 163.70 at 159.66. Sustained break there will indicate that fall from 163.70 is reversing whole rise from 153.13, and target 61.8% retracement at 157.18. On the upside, though, above 162.16 minor resistance will retain near term bullishness, and bring retest of 163.70.
In the bigger picture, price actions from 164.29 medium term top are seen as a correction to rise from 139.05 which could still be extending. As long as 148.38 resistance turned support holds (2022 high), larger up trend from 114.42 (2020 low) is expected to resume through 164.29 at a later stage. Next target would be 169.96 (2008 high).