Sample Category Title
Silver Wave Analysis
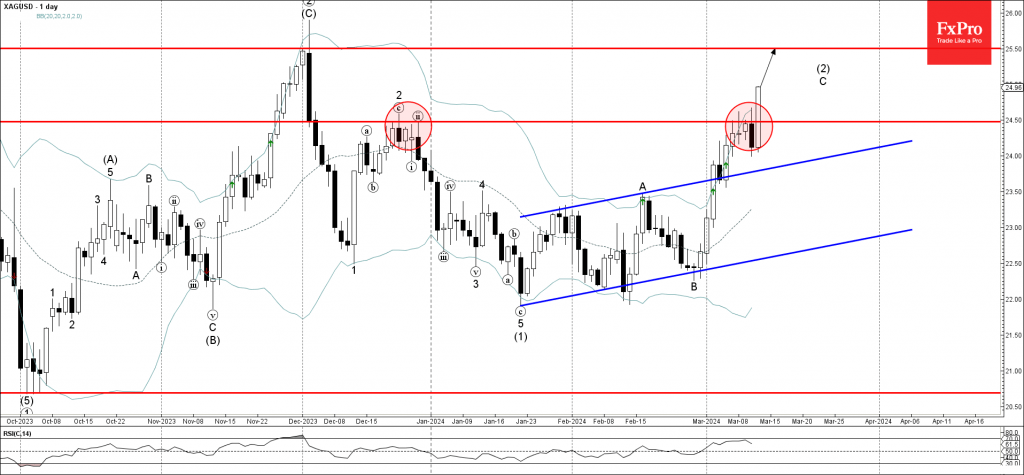
- Silver broke key resistance level 24.50
- Likely to rise to resistance level 25.5
Silver today broke the key resistance level 24.50 (which stopped the previous minor ABC correction 2 as can be seen below).
The breakout of the resistance level 24.50 continues the active impulse wave C of the ABC correction (2) from January.
Given the predominantly bullish sentiment that can be seen on the precious metal markets today Silver can be expected to rise further toward the next resistance level 25.5 (which stopped wave C in December).
Copper Rises Rapidly to 11-Month High
- Copper wins nearly 3.0% on production cuts
- Overbought signals detected around key resistance
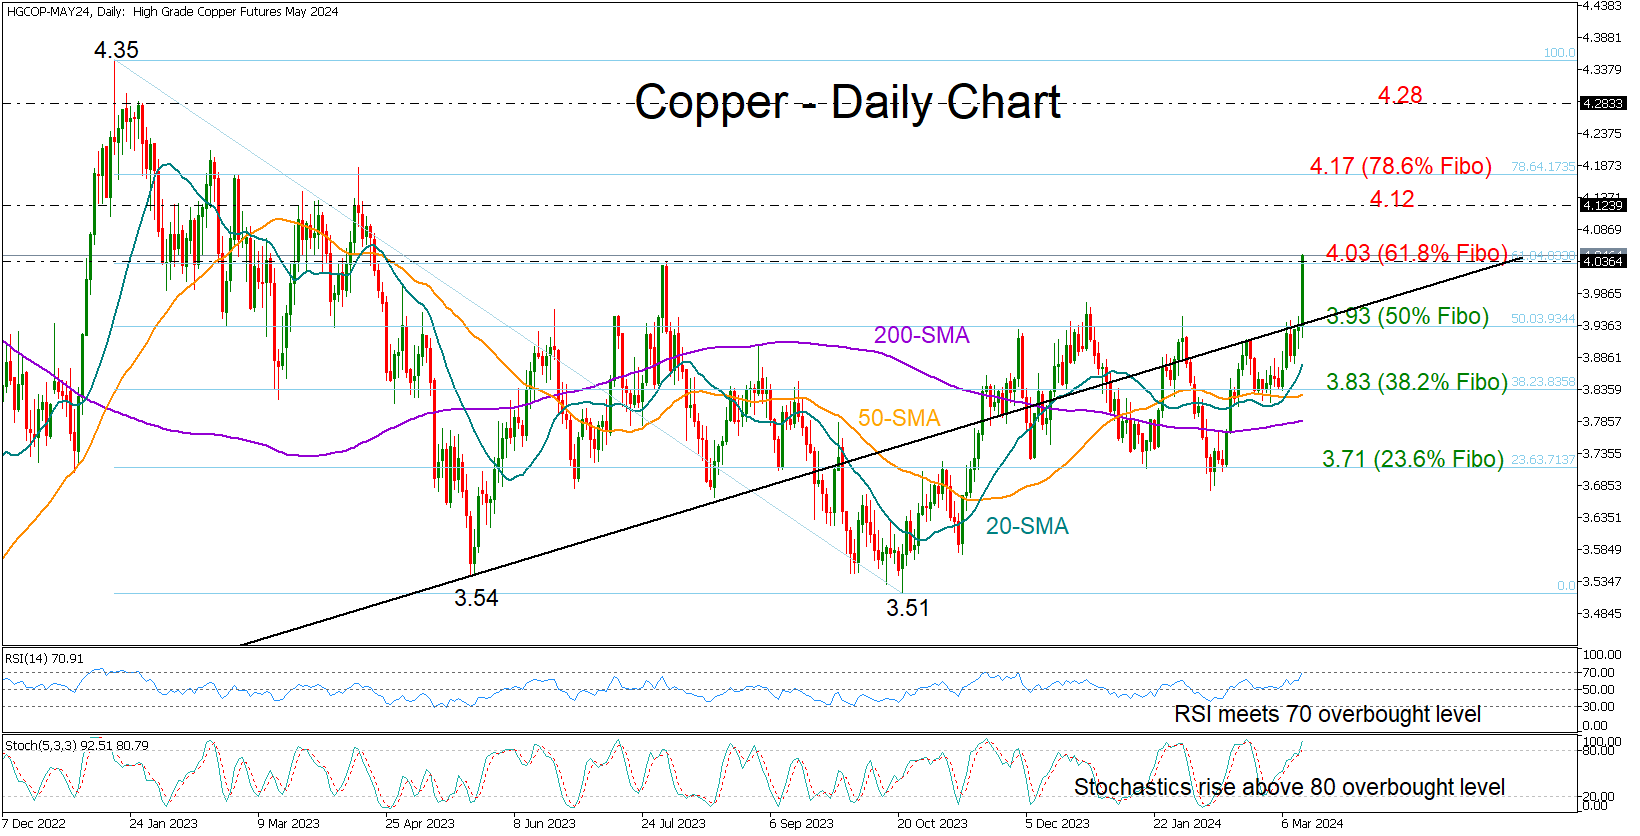
Copper futures (May delivery) surged to an almost one-year high of 4.04 on Wednesday after China’s biggest producers agreed on a rare supply cut amid raw material shortages.
Technically, the 61.8% Fibonacci retracement of the 2023 downtrend is currently under examination. A step above that border could lift the price instantly into the 4.12-4.17 zone, where the 78.6% Fibonacci mark is positioned. If upside pressures persist above 4.20, the next obstacle could pop up around the 2023 bar of 4.28.
The risk of a downside correction, however, is increasing as both the RSI and the stochastic oscillator are entering the overbought area, suggesting that today’s quick rally may not be sustainable.
Should the bears take over, the price might dive to retest the 50% Fibonacci mark of 3.93 and the ascending line from July 2022. If the 20-day simple moving average (SMA) gives way too, the next stop could be around the 38.2% Fibonacci of 3.83, while a drop below the 200-day SMA could clear the way towards the 23.6% Fibonacci of 3.71.
In brief, Copper futures are witnessing the fastest daily rally since July 2022. While a pullback cannot be ruled out, a close above 4.03 could delay any downside moves.
March Flashlight for the FOMC Blackout Period
Summary
- We do not expect the FOMC to change the federal funds rate or alter its current pace of balance sheet runoff at its upcoming meeting on March 19-20.
- Since the Committee last met, the U.S. inflation data have come in a bit stronger than expected, while the labor market generally has remained resilient. With payroll growth still solid and inflation proving to be a bit stickier recently, we suspect the FOMC will still be seeking greater confidence at the end of its meeting next week that inflation is headed back to 2% on a durable basis.
- That said, beneath the robust headline figures, we see building evidence that the labor market is cooling and inflation is still slowing on trend. Chair Powell testified to Congress shortly before the March blackout period that the Committee is "not far" from the confidence needed to dial back the level of policy restriction.
- We now expect the FOMC will initiate the first cut to the federal funds rate at its June 12 meeting (our previous expectation was at the May 1 meeting). We look for 100 bps of easing in total this year and another 100 bps of easing over the course of 2025 to bring the fed funds target range to 3.25%-3.50% by year-end 2025.
- In light of the recent slate of data and Fed-speak, we see few changes to the post-meeting statement after a meaningful rework following the January meeting.
- The March meeting will include an update to the Committee's Summary of Economic Projections (SEP). We do not expect material changes to the median projections for real GDP growth and the unemployment rate.
- The story is similar for inflation. Our most recent forecast projects headline and core PCE inflation of 2.3% and 2.5%, respectively, in 2024. The Committee's median projection in the December SEP was 2.4% for both headline and core PCE, suggesting that the current outlook is not materially different from December for most FOMC members. We think the core PCE inflation median for 2024 will rise by a tenth or so, putting it closer to the midpoint of the central tendency range from December.
- That said, even if the magnitude of the changes to the outlook for growth and inflation are relatively small, the direction of the revisions likely will be toward a hotter outlook, i.e. faster growth, and higher inflation. Will the dots follow suit?
- Our base case is that the median dot for 2024 will remain unchanged at 4.625%, but the risks are skewed toward a higher median given the distribution of the prior dots and the recent run of inflation data. Similarly, we expect no change to the 2025 and 2026 median dots, though here too we think the risks are skewed to the upside.
- A slowdown in the pace of the Fed's balance sheet runoff program also appears to be coming closer into view, and the Committee is likely to have a broad discussion of the central bank's plan for quantitative tightening (QT) at the March meeting.
- Our base case remains that the FOMC will announce a plan to slow the pace of QT at its June meeting, although we would not be shocked if the Committee decided to do so one meeting earlier or later. Specifically, we expect the runoff caps for Treasury securities to be reduced to $30 billion while MBS caps are dropped to $20 billion starting on July 1. We anticipate this slower pace of QT running until year-end 2024.
A Little More Conversation, but Still No Action
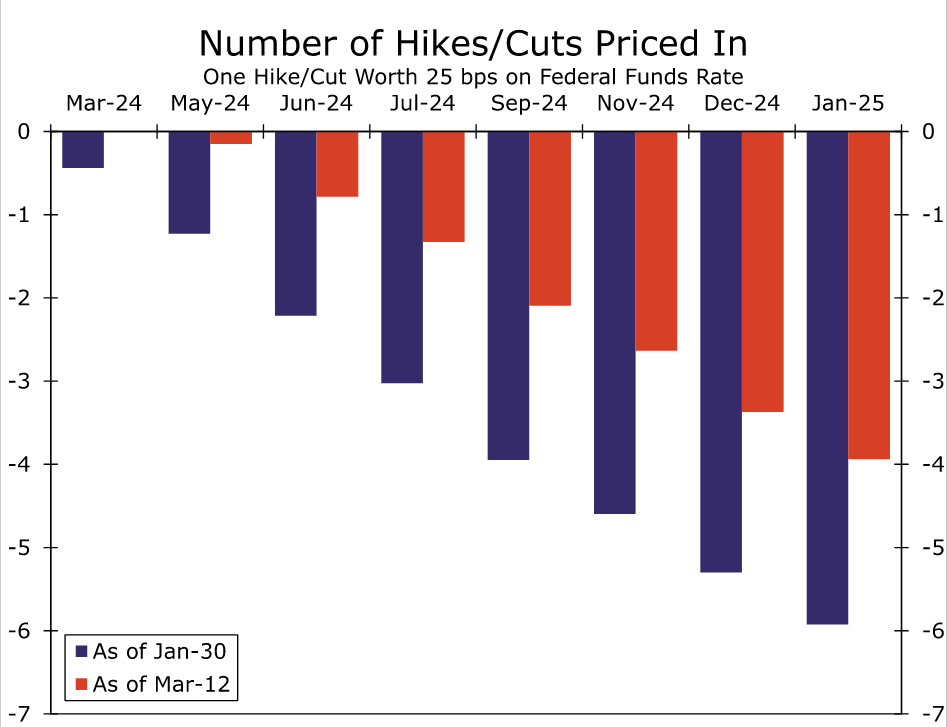
We do not expect any policy changes from the FOMC at its meeting next week, but the Committee's post-meeting communications should shed more light on the potential path of policy adjustments later this year. The prospects of the first rate cut occurring on March 20 initially started to slip away at the end of the Committee's last meeting on January 31. In the post-meeting press conference, Chair Powell shared that "I don't think it's likely that the Committee will reach a level of confidence by the time of the March meeting to identify March as the time to do that." Since then, generally stronger-than-expected data and the string of Fed officials indicating they are in no big rush to ease policy have driven down the odds of a rate cut at next week's meeting to essentially nil. Expectations that a rate cut could first come at the May 1 meeting have also been pared back (Figure 1).
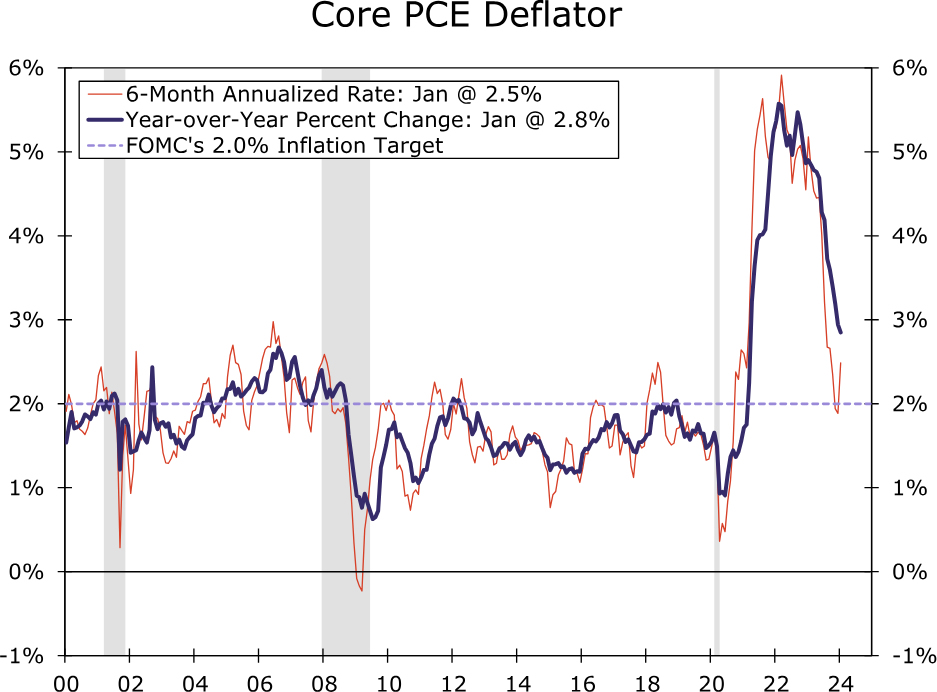
The tempered expectations for rate cuts follows a pickup in inflation to start the year. After the 6-month annualized rate of change in the core PCE deflator slowed to below 2% in the second half of last year, a hot print at the start of 2024 pushed this rate back up to 2.5% in January (Figure 2). The Consumer Price Index, which includes data through February, shows core inflation running at a 4.2% annualized rate the past three months compared to the 3.3% clip at the time of the FOMC's past meeting.
Job growth has also held up well in recent months. In February, nonfarm payrolls again surpassed consensus expectations, and the three-month average pace of 265K remains well above the ~100K pace that we estimate is currently needed to absorb labor force entrants. With the jobs market holding up for now and inflation looking a little stickier of late, Fed officials over the inter-meeting period seem to largely be on the same page as Governor Waller when it comes to the near-term prospect of rate cuts: "What's the rush?"
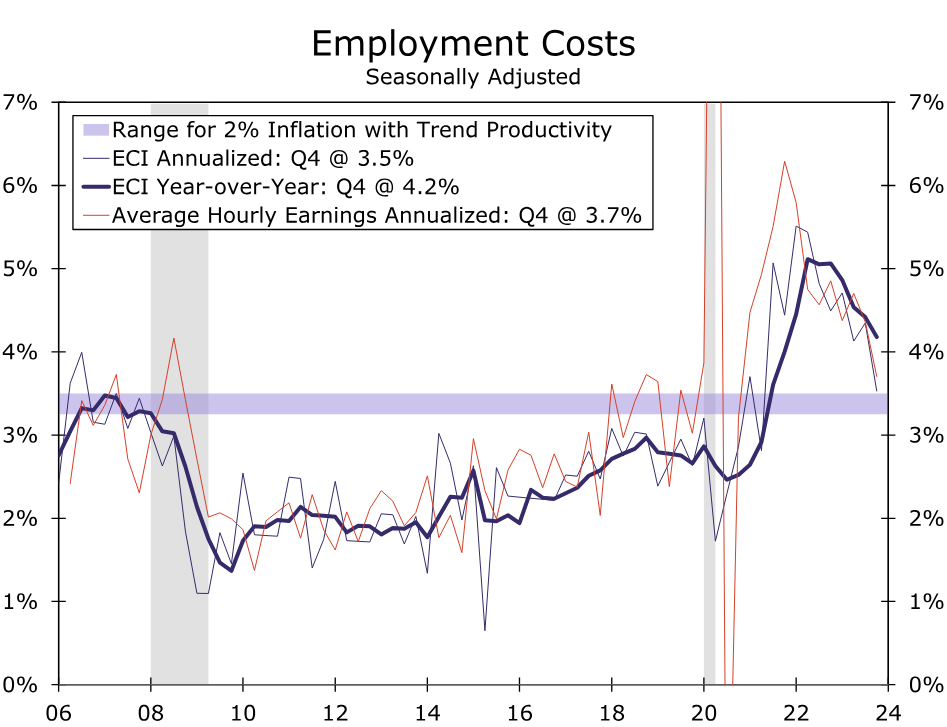
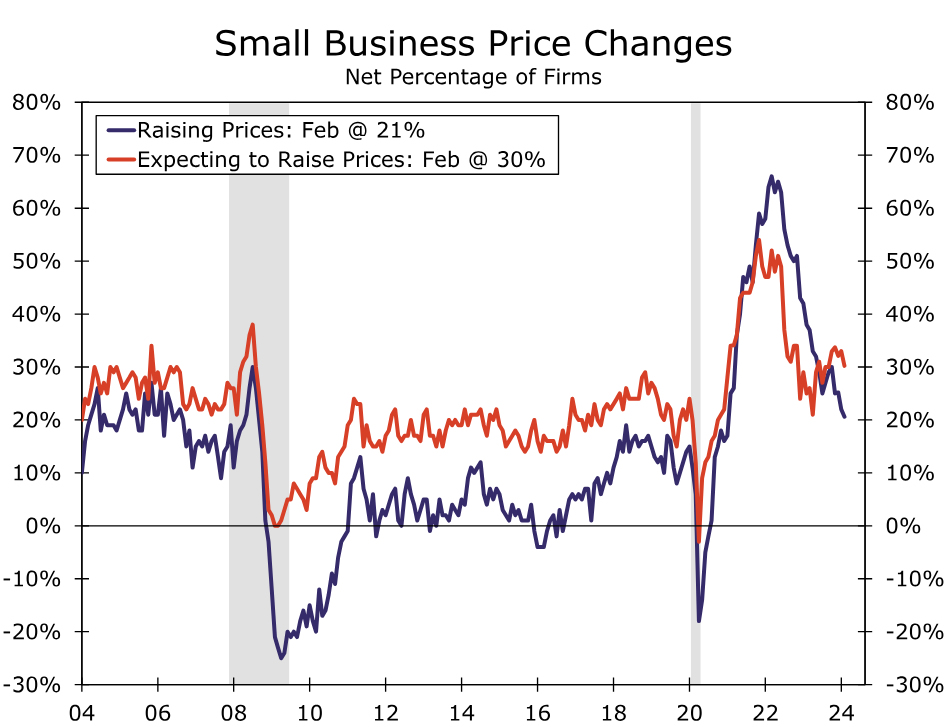
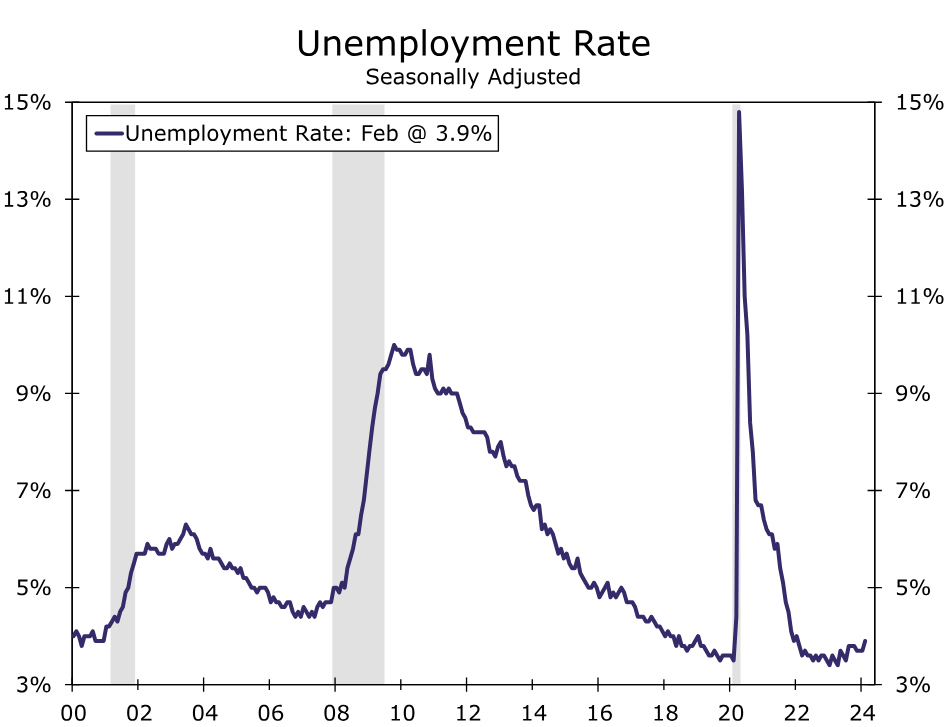
While most Fed officials seem in no hurry to ease policy, we expect the post-meeting communications to indicate that the FOMC continues to inch toward rate cuts later this year. Beyond the strength of nonfarm payrolls lies broad signs of labor market softening that suggest it does not need to cool significantly more for the Fed to achieve price stability. The unemployment rate reached a two-year high in February of 3.9%, while a pickup in layoff announcements and decline in job openings and hiring plans indicate demand for workers is diminishing. While wage growth currently remains stronger than during the last cycle, the trend continues to cool and, accounting for productivity growth, is not far from the pace consistent with the Fed's inflation target of 2% (Figure 3). Businesses are having more difficulty passing on higher costs to consumers, as was noted in the Fed's most recent Beige Book, and a shrinking share of businesses report raising prices (Figure 4). Furthermore, the improvement in supply chains since 2022 is helping to keep a lid on goods prices. With the jobs market in better balance and inflation pressures continuing to subside, Chair Powell testified to Congress shortly before the March blackout period that the Committee is "not far" from the confidence needed to dial back the level of policy restriction.
In light of the recent slate of data and Fed-speak, we see few changes to the post-meeting statement. The characterization of recent economic conditions may be tweaked slightly. We would not be surprised for the statement to note that the recent pace of economic activity appears to have cooled from the fourth quarter's solid pace, or that the unemployment rate has moved up but remains low.
Elsewhere, adjustments are likely to be minimal after a meaningful rework following the January meeting. January's statement removed the directional bias of the next rate move in a clear sign the hiking cycle probably has ended. The statement also noted that the risks to the inflation and employment sides of its mandate "are moving into better balance," but the FOMC would need to see "greater confidence that inflation is moving sustainably back toward 2%" before it is appropriate to reduce the fed funds target range. With the three-month annualized rate of core CPI inflation strengthening to 4.2% through February, we suspect the FOMC will still be seeking greater confidence at the end of its meeting next weekand will not hint that a rate cut is imminent at its following meeting on May 1.
We now expect the FOMC will initiate the first cut to the federal funds rate at its June 12 meeting (our previous expectation was the May meeting). We look for 100 bps of easing in total this year and another 100 bps of easing over the course of 2025 to bring the fed funds target range to 3.25%-3.50% by year-end 2025. We will publish a more detailed update on our expectations for the path of the fed funds rate, inflation and economic growth tomorrow in our March Monthly Economic Outlook.
SEP: Will the 2024 Median Dot Go Higher?
With the statement likely to offer nothing new in terms of rate guidance, the updated Summary of Economic Projections (SEP) will shed light on how the Committee sees the path of interest rates, economic growth and inflation unfolding beyond the next couple of months. The current SEP was released at the December FOMC meeting and, as discussed above, the economy generally has remained solid over the past few months. Real GDP rose 3.1% on a year-ago basis in Q4-2023, half a percentage point stronger than the median Committee projection in the December SEP. Similarly, the unemployment rate was 3.9% in February, a tenth above the median projection for year-end 2023 but still two-tenths below the median projection for year-end 2024 (Figure 5). It is still early in the year, and the fundamental picture has not changed much since December, so we doubt most Committee members will want to make major changes in their projections for economic growth and unemployment. We expect the medians for growth and the unemployment rate to remain more or less unchanged.
The story on the inflation front is similar. PCE inflation finished 2023 roughly in line with the Committee's expectations, but price growth topped expectations in January. Our most recent forecast looks for PCE inflation to be 2.3% year-over-year in Q4-2024. Excluding food and energy prices, we look for core PCE inflation of 2.5% over the same period. The median projections for 2024 inflation in the December SEP were 2.4% for both headline and core, and the central tendency ranges were 2.2%-2.5% and 2.4%-2.7%. This suggests to us that the inflation outlook is not materially different from what it was in December for most participants. We think the core PCE inflation median for 2024 probably will rise by a tenth or so, putting it closer to the midpoint of the central tendency range from December. Upward revisions much larger than this would surprise us and suggest that the Committee is more worried about the recent inflation data.
On balance, we expect the revisions to the Committee's expectations for growth, unemployment and inflation to be relatively modest. However, we think the direction of these revisions will be toward a hotter outlook, i.e. faster growth, and higher inflation. This raises the question of whether the dots will follow suit. The median dot for 2024 currently sits at 4.625%, implying 75 bps of rate cuts by year-end (Figure 6). The distribution of the 2024 dots has an upward bias. Eight participants submitted projections in December with less than 75 bps of easing, while just five participants penciled in more than 75 bps of cuts. As a result, if just two participants shift from 75 bps of easing to 50 bps, the median will move from the former to the latter.
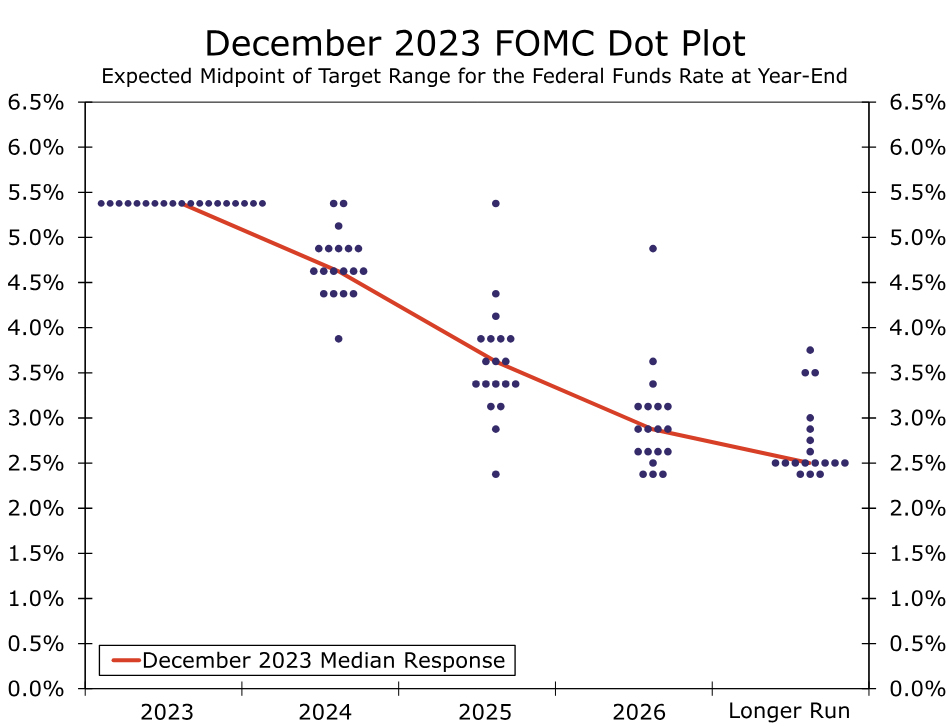
Our base case is that the median dot for 2024 will remain unchanged at 4.625%, but the risks are skewed toward a higher median given the distribution of the December dots and the recent run of inflation data. Similarly, we expect no change to the 2025 and 2026 median dots, though here too we think the risks are skewed to the upside.
QT Discussion to Occur at March Meeting
The FOMC is not only inching closer to cutting the fed funds rate. A slowdown in the pace of the Fed's balance sheet runoff program also appears to be coming closer into view. In his post-meeting press conference after the January FOMC meeting, Chair Powell made clear that the Committee would engage in a broad discussion of the central bank's balance sheet runoff program, more commonly know as quantitative tightening (QT), at the March meeting. The FOMC began allowing a maximum of $30 billion of Treasury securities and $17.5 billion of mortgage-backed securities (MBS) per month to roll off its balance sheet in June 2022. These caps were increased to $60 billion and $35 billion, respectively, in September 2022, and they have subsequently remained unchanged. At present, the Fed's balance sheet totals roughly $7.5 trillion, down from nearly $9 trillion at its peak in Q2-2022.
Our base case remains that the FOMC will announce a plan to slow the pace of QT at its June meeting, although we would not be shocked if the Committee decided to do so one meeting earlier or later (May 1 or July 31). Specifically, we expect the runoff caps for Treasury securities to be reduced to $30 billion while MBS caps are dropped to $20 billion starting on July 1. We anticipate this slower pace of QT running until year-end 2024. Starting in 2025, we look for balance sheet growth to resume to accommodate organic growth in liabilities (e.g., paper currency and bank reserves). We expect the FOMC will continue to passively reduce its MBS holdings in 2025 and beyond while replacing these MBS with Treasury securities, a move that would replicate what occurred in 2019.
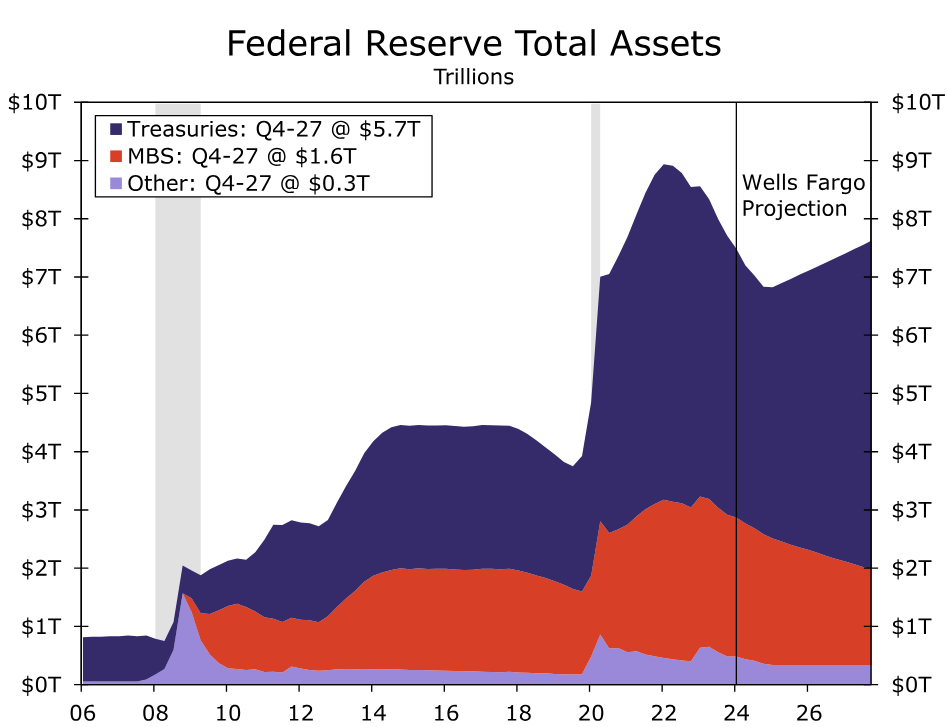
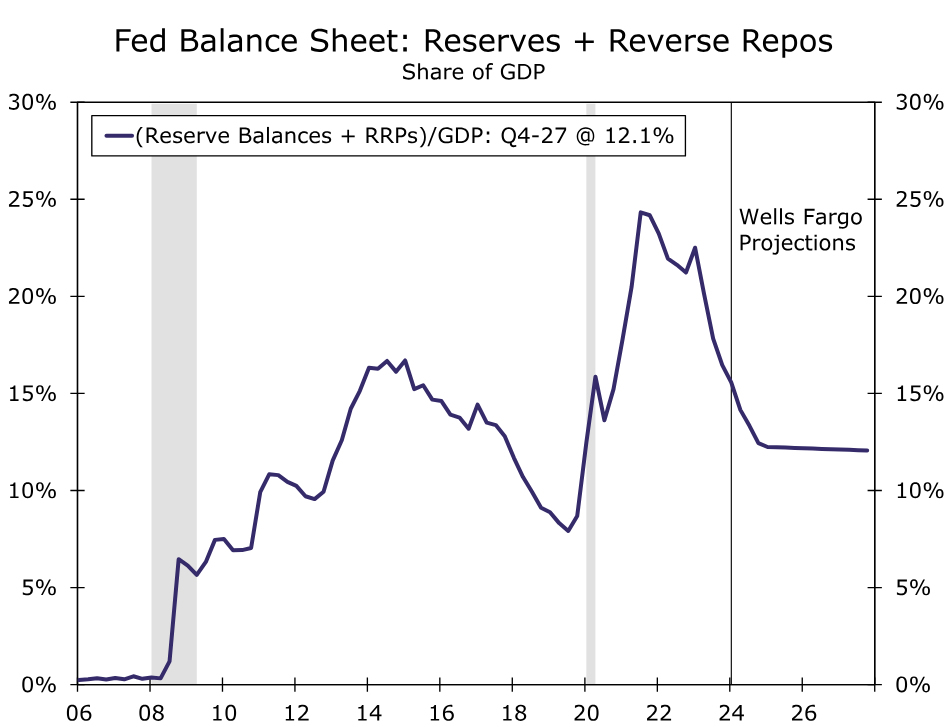
If our forecast is realized, the Fed's balance sheet would reach a trough of $6.8 trillion or so at year-end 2024 and begin growing gradually again thereafter (Figure 7). The nadir in the Fed's balance sheet would be only a bit higher than the $6.5 trillion projection in our "middle-of-the-road" scenario outlined in our report on QT from last October. In this scenario, we look for RRP balances to decline to about $200 billion by year-end, with bank reserves that are around $3 trillion at the trough. As a share of GDP, this would represent a meaningful liquidity buffer relative to pre-pandemic levels (Figure 8).
1 – Quotation from Governor Waller at the Finding Forward Speaker Series at the University of St. Thomas on February 22, 2024.
Will BoJ Take Interest Rates Out of Negative Territory?
- Investors assign nearly 50% chance for a March BoJ hike
- Wage negotiations set to conclude with strong pay hikes
- Recession is avoided, inflation reaccelerates
- The BoJ meets on Tuesday at 02:30 GMT
March hike speculation intensifies
The yen staged a strong recovery last week following several reports suggesting that the Bank of Japan (BoJ) may abolish its ultra-loose monetary policy as early as its upcoming policy meeting, which is scheduled for next week.
After a couple of policymakers noted that the economy is making progress towards achieving the Bank’s 2% inflation objective, another report hit the wires this week, citing sources familiar with the Bank’s thinking, saying that there is a growing number of members warming to the idea of ending negative interest rates this month. This appears to be a realistic take as Japan’s largest industrial labor group said that 25 of its member unions have already seen their wage demands being met in full, which means that the central bank may not necessarily have to wait for April to act.
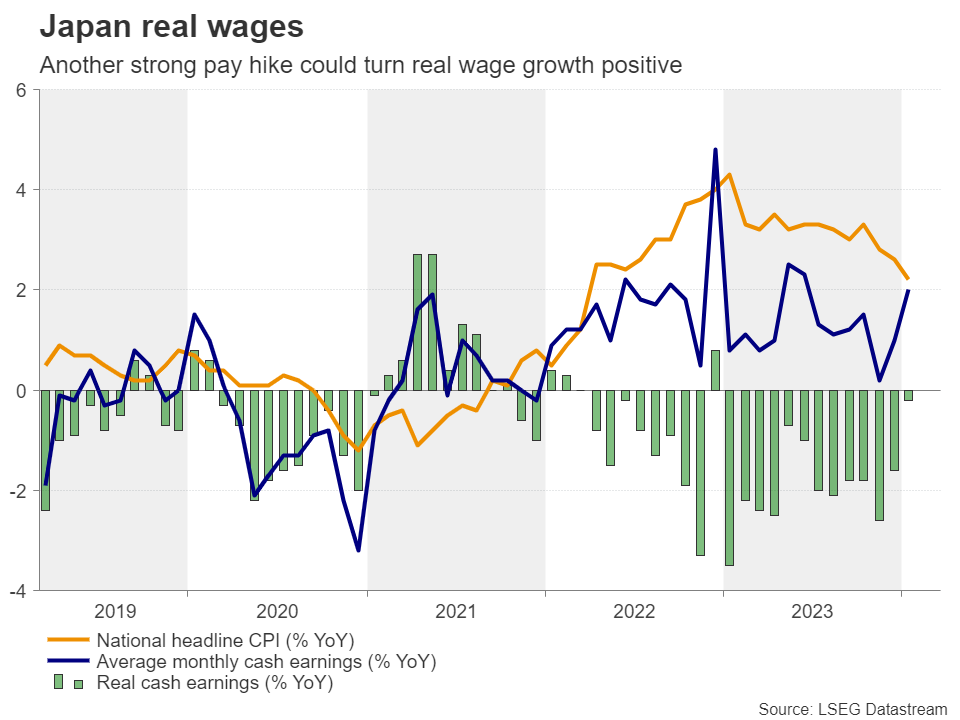
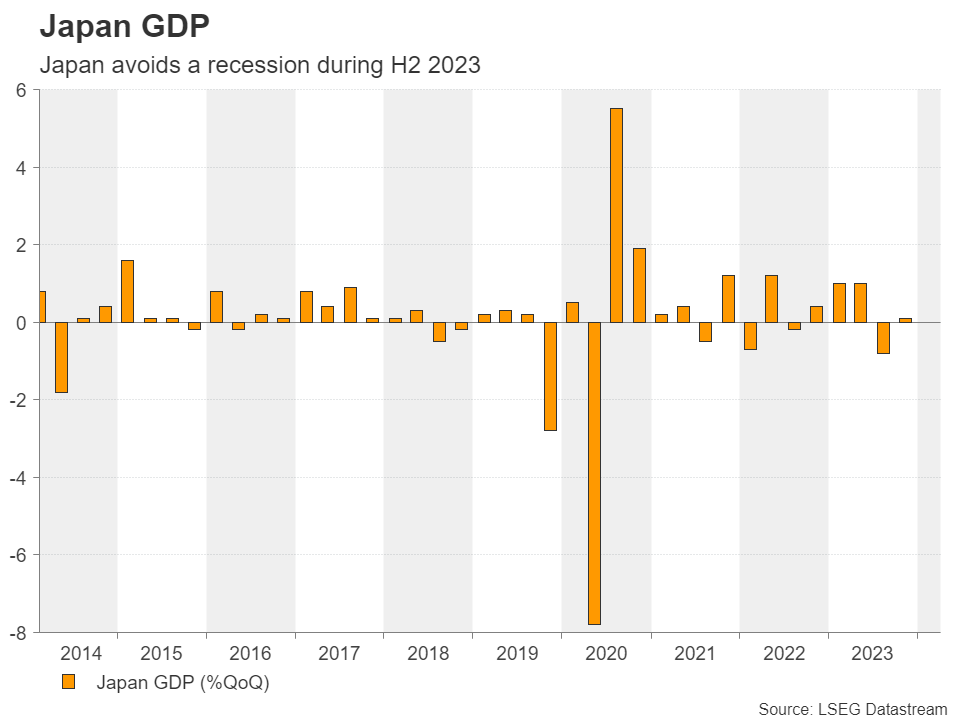
All this, combined with revised government data suggesting that the economy avoided a technical recession during the second half of 2023, prompted market participants to assign around a 50% probability for the Bank to take interest rates out of negative territory at next week’s gathering.
That said, on Tuesday, BoJ Governor Ueda said that although the Japanese economy is recovering, it is still showing signs of weakness, while Finance Minister Suzuki noted that they cannot declare that deflation is beaten yet, despite some positive developments like the strong pay hikes. Nonetheless, although the yen reacted negatively to those remarks, the probability of a March hike slid only to 45%.
Rate hike or yield curve control adjustment?
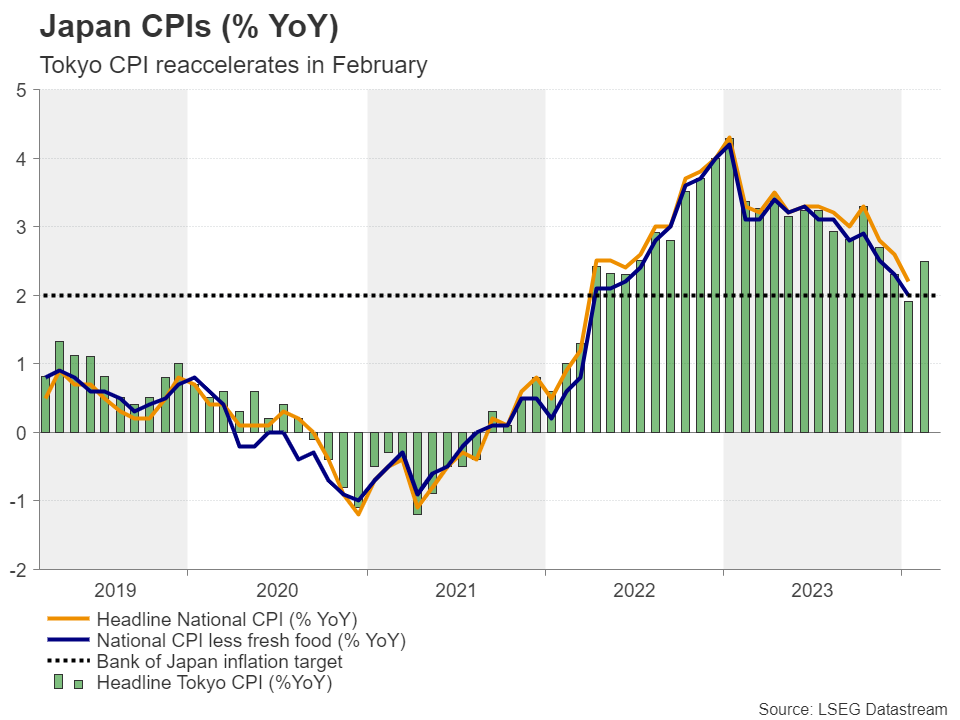
So, the big question on everyone’s mind is of course: Will the BoJ exit its negative-rate policy next week? The upward revision of the GDP data for the last quarter of 2023 pointed to a 0.1% q/q expansion instead of the initially suggested 0.1% contraction, while the latest set of Tokyo CPI numbers revealed strong acceleration in inflation, corroborating the market’s view for a decent probability of a March rate hike. Even if they don’t push the hike button at this gathering, policymakers could well telegraph an April move and even tweak their yield curve control.
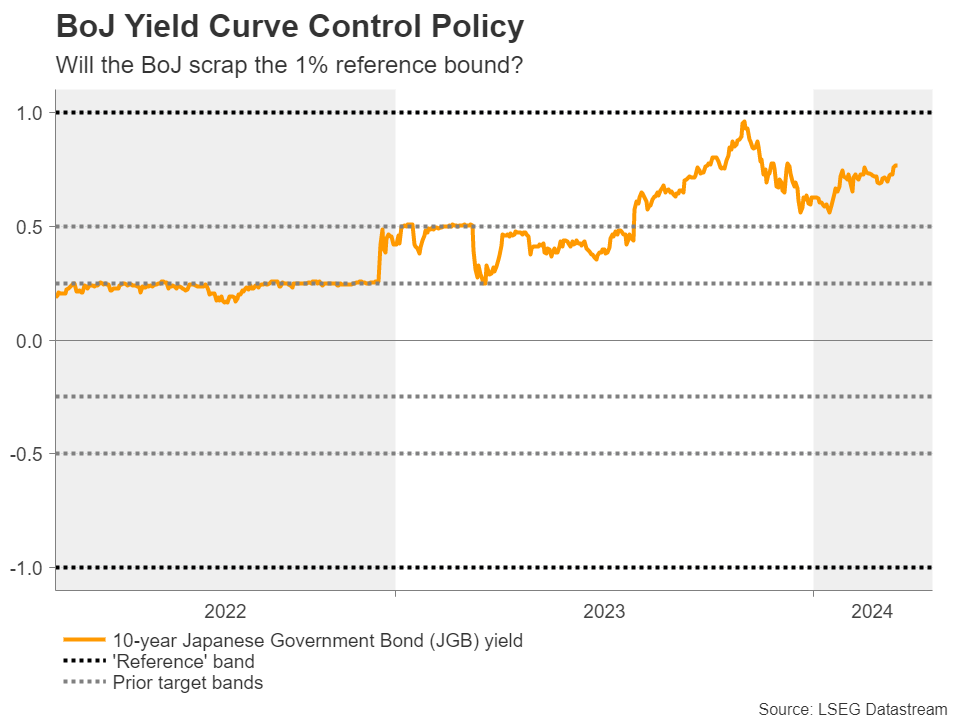
There is already a Bloomberg report saying that the BoJ is considering scrapping its yield curve control and instead start reporting the amount of government bonds it plans to purchase each time. In other words, they could stop aiming at keeping 10-year yields around 0% and start targeting the volume of purchases.
How may the yen respond?
Having said all that though, even if the Bank announces such a change to its yield curve control framework, but doesn’t press the hike button at this gathering, the yen may pull back as that nearly 50% of participants expecting an immediate liftoff might get disappointed. Nonetheless, with other major central banks seen cutting interest rates at some point during the summer months, a long-lasting fall may be unlikely if the Bank clearly hints at an April liftoff.
On the other hand, a hike now could add fuel to the yen’s engines, especially if it is accompanied by a decision to abandon yield curve control at its current form. Whether this will develop into a sustainable yen uptrend, though, will depend on the pace of subsequent rate increases. Several officials have already noted that after the first hike, the tightening process will be slow and gradual, and if it proves slower than the market’s own projections, then the yen may struggle to stay on the front foot.
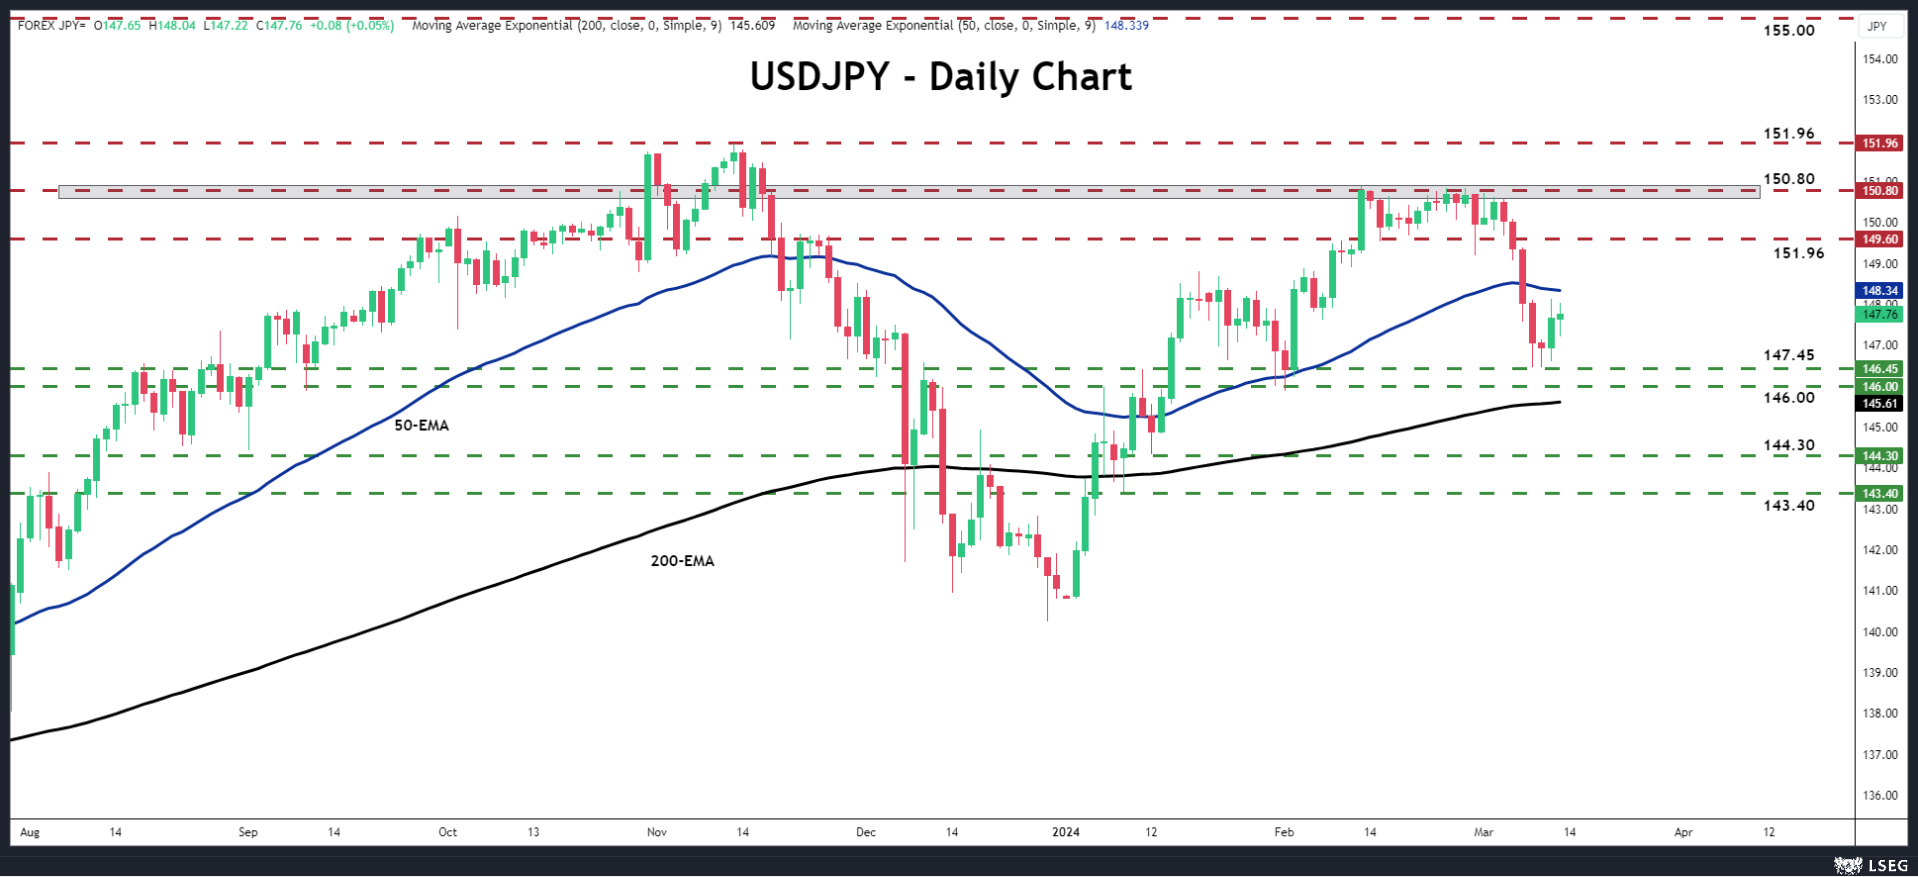
Dollar/yen entered a recovery mode this week, after it hit support at around 146.45. However, the pair covered less than half of the previous week’s losses, keeping the short-term outlook blurry. For the picture to brighten, the bulls may need to climb all the way above the 150.80 zone, which acted as a ceiling during February. On the downside, a dip below 146.00, marked by the low of February 1, will confirm a lower low on the daily chart and perhaps invite more bears into the action.
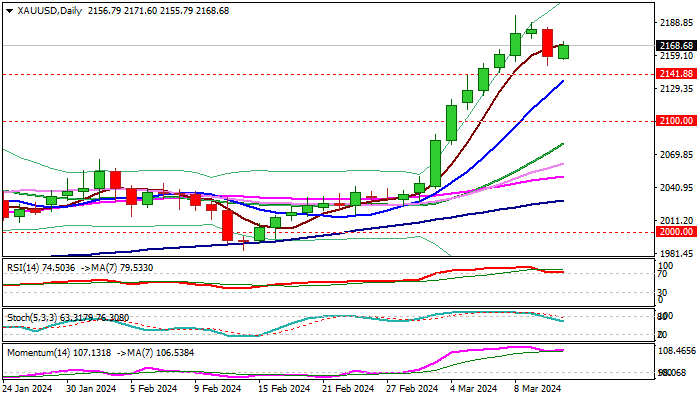
Gold Regains Traction After a Shallow Pullback as June Rate Cut Expectations Remain in Play
Gold price rose on Wednesday, reversing a part of Tuesday’s 1.1% drop, sparked by hotter-than-expected US inflation data, which temporarily cooled expectations for rate cut in June.
Fresh gains suggest that markets believe, after digesting the data, that elevated inflation won’t have stronger negative impact on current expectations for the start of monetary policy easing.
Tuesday’s drop found ground above the initial support at $2141 (former record high of Dec 4), adding to signals of shallow correction before bulls regain control, as overall technical picture is firmly bullish.
Fresh recovery needs daily close above $2170 zone (5DMA / near 50% retracement of $2195/$2150 pullback) to validate renewed bulls and signal higher low at $2150.
However, strong rally in past three weeks when the metal gained over 8%, may prompt traders to collect some profits, keeping the possibility of deeper correction on the table.
Res: 2178; 2188; 2195; 2200.
Sup: 2150; 2141; 2136; 2114.
Sunset Market Commentary
Markets:
The ECB released a statement on the changes to the operational framework for implementing monetary policy. In the new framework (cf infra), the ECB will provide liquidity through a mix of instruments including the main refinancing operations (MRO’s), new structural longer-term refinancing operations and a structural portfolio of securities. However, the deposit rate facility will remain the main instrument to steer the monetary policy stance . For now, the announcement has little impact on money and bond markets. There were no eco data to guide trading in US and EMU today. Over the previous days, several ECB members indicated that the ECB was coming closer to the point where it can start cutting rates. Bank of France governor Villeroy recently indicated that the ECB could cut rates in spring, with the ECB having upcoming meetings in April and June. Villeroy keeps a data-dependent approach but today clarified that June is probably more likely, again aligning with the guidance from ECB Lagarde at the press conference last week. The June guidance is currently putting a floor for EMU yields with German yields in technical trading rising 1-2 bps. Similar dynamics on US interest rate markets. The 0.4% monthly CPI inflation pace (February), suggests that there is no room for the Fed to turn softer in its policy assessment/dots at next week’s policy meeting. On the contrary. US yields maintain yesterday’s gain even adding another 2-3 bps. European equities still succeed some catching-up gains after yesterday’s rally on WS (Eurostoxx 50 +0.5%). US indices take a breather, but are still holding within reach of recent peak levels.
In most major FX cross rates, volatility remains (very) low with little directional momentum. DXY eases marginally (102.85). The euro beats the dollar on points (EUR/USD 1.0935). The yen slightly underperforms the dollar even as anecdotic evidence suggests a rather strong outcome of Japanese wage negotiations (USD/JPY 147.9 from 147.7). Sterling is losing slightly further ground against the euro, with EUR/GBP again hovering near the 0.855 pivot. After a soft UK labour market report yesterday, the January monthly GDP (0.2% M/M) and production data were not strong enough to give sterling additional momentum. The potential test of the key EUR/GBP 0.85/0.8493 support is called off, at least for now. A return above 0.858 is needed to put the pair again in more neutral territory.
News & Views:
The ECB announced its new framework to steer short-term money market rates in line with monetary policy decisions as the Eurosystem balance sheet normalizes. The central bank will continue steering monetary policy rate by adjusting the deposit rate. Short-term money market rates are expected to evolve in vicinity of the deposit rate. Main refinancing operations (MRO’s) and longer-term refinancing operations (LTRO’s) continue to be conducted through fixed-rate tenders with full allotment against broad collateral. In a later stage, new structural LTRO’s and a structural portfolio of securities will be introduced taking into account legacy bond holdings. On September 18, the ECB will narrow the 50 bps spread between the main refinancing rate and the deposit rate to 15 bps by lowering the MRO rate by 35 bps. The spread between the MRO rate and the marginal lending facility will remain unchanged at 25 bps. The reserve ratio for determining banks’ minimum reserve requirements remains unchanged at 1%. The remuneration of minimum reserves remains unchanged at 0%. The Governing Council will review the key parameters of the operational framework in 2026 and stands ready to adjust the design and parameters of the framework earlier, if necessary.
EMU industrial production decreased by 3.2% M/M in January according to first estimates from Eurostat. Details showed declines in capital goods (-14.5% M/M), durable consumer goods (-1.2%) and non-durable consumer goods (-0.3%) while energy (+0.5% M/M) and intermediate goods (+2.6% M/M) increased. In Y/Y-terms, productions fell by 6.7%.
XAUUSD: In Bearish Correction With Key Levels on H4
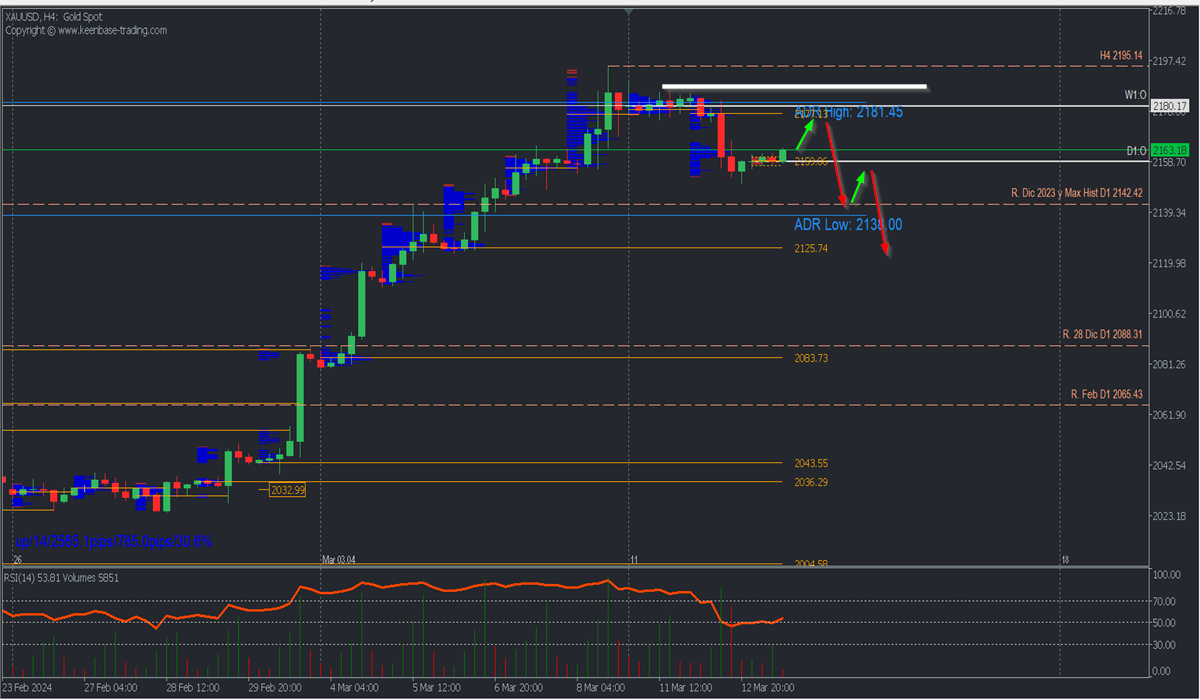
- Bullish scenario: Intraday buys above 2160.00 with TP: 2171 and TP2: 2177, with S.L. below 2155.00 or at least 1% of account capital*. Apply trailing stop.
- Bearish scenario: Sells below 2177 with TP1: 2150, TP2: 2142, and 2126 with S.L. above 2185 or at least 1% of account capital*.
Scenario from the H4 chart:
The trend remains bullish, but a correction has started, which could extend as long as prices stay below the last selling zone.
The price corrects below 2200 after reaching a historic high on Friday at 2195.14, leaving a selling zone after the weekly opening around 2177, where the price is expected to return in search of liquidity, and where it is expected that bears will reactivate to extend sales towards the level 2142.42 and the next buying zone at the uncovered POC* 2125.74.
This bearish scenario will be invalidated if prices decisively break the selling zone above 2180, demonstrating the renewed strength of the bulls to seek a new historic high above 2195.14.
The RSI indicator maintains its position in positive territory after bouncing from the midpoint, so the ascent accompanied by decreasing vertical volume and subsequent break of the midpoint with higher volume will be favourable signals supporting the current short-term bearish idea.
*Uncovered POC: POC = Point of Control: It is the level or zone where the highest volume concentration occurred. If there was a bearish movement from it previously, it is considered a selling zone and forms a resistance zone. On the other hand, if there was a bullish impulse previously, it is considered a buying zone, usually located at lows, thus forming support zones.
**Consider this risk management suggestion
**It is very important that risk management is based on capital and traded volume. Therefore, a maximum risk of 1% of the capital is recommended. It is suggested to use risk management indicators such as Easy Order.
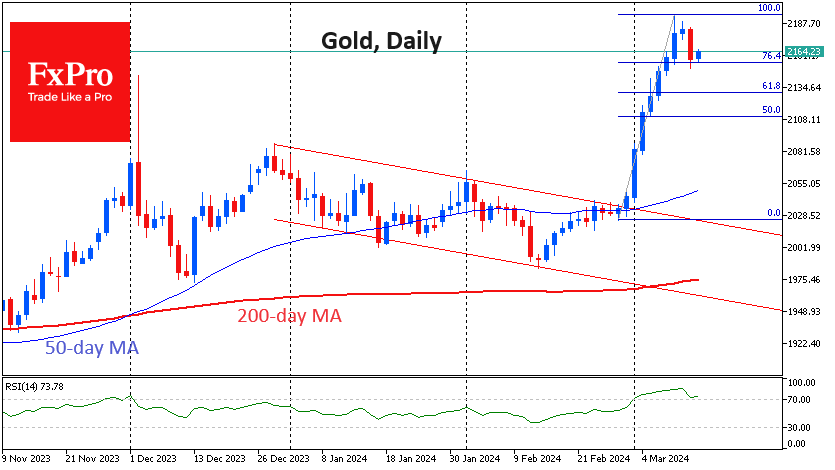
Gold: Correction is Fuel for Growth
Gold lost over 1% on Tuesday, its first daily decline after nine days of gains, six of which were all-time highs.
Signs of consolidation were already evident on Monday and Tuesday, which began with a moderate decline, accelerated by the release of US inflation data. While the rush out of risk assets on this news was very short-lived, the sell-off in gold was more sustained but did not go beyond a short-term fixation.
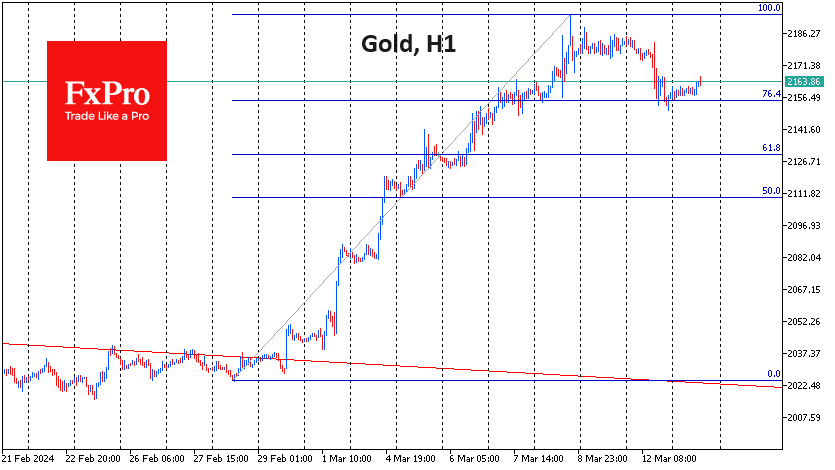
A number of factors suggest that this is a corrective pullback rather than a reversal.
Firstly, the sell-off has come to an end near $2150, where there was a consolidation at the end of last week before the latest upside momentum. This level also coincides with the 76.4% Fibonacci retracement of the $175 rally of the last fortnight, when gold broke out of a bearish trading range. Such shallow corrective pullbacks are a sign of a strong bull market.
Second, gold’s weakness is not supported by a general decline in risk appetite. Bitcoin briefly lost 6.5% during Tuesday’s sell-off, but by Wednesday morning, it was already at all-time highs. As I write this, the Dollar Index has given back all the gains from the CPI release. The S&P500 closed at a new high on Tuesday, and the European indices are moving further into their all-time high territory on Wednesday. The correlation between European indices and gold has become very high since the second half of December.
Separately, we note the break of multi-month resistance in copper and the rise in oil, pointing to increased risk appetite, which is also favourable for gold.
All of this suggests that we may have seen a quick recharge of the bulls yesterday, allowing them to build up liquidity – fuel for further buying and renewal of all-time highs.
GBP/USD Shrugs as UK Economy Shows Slight Growth
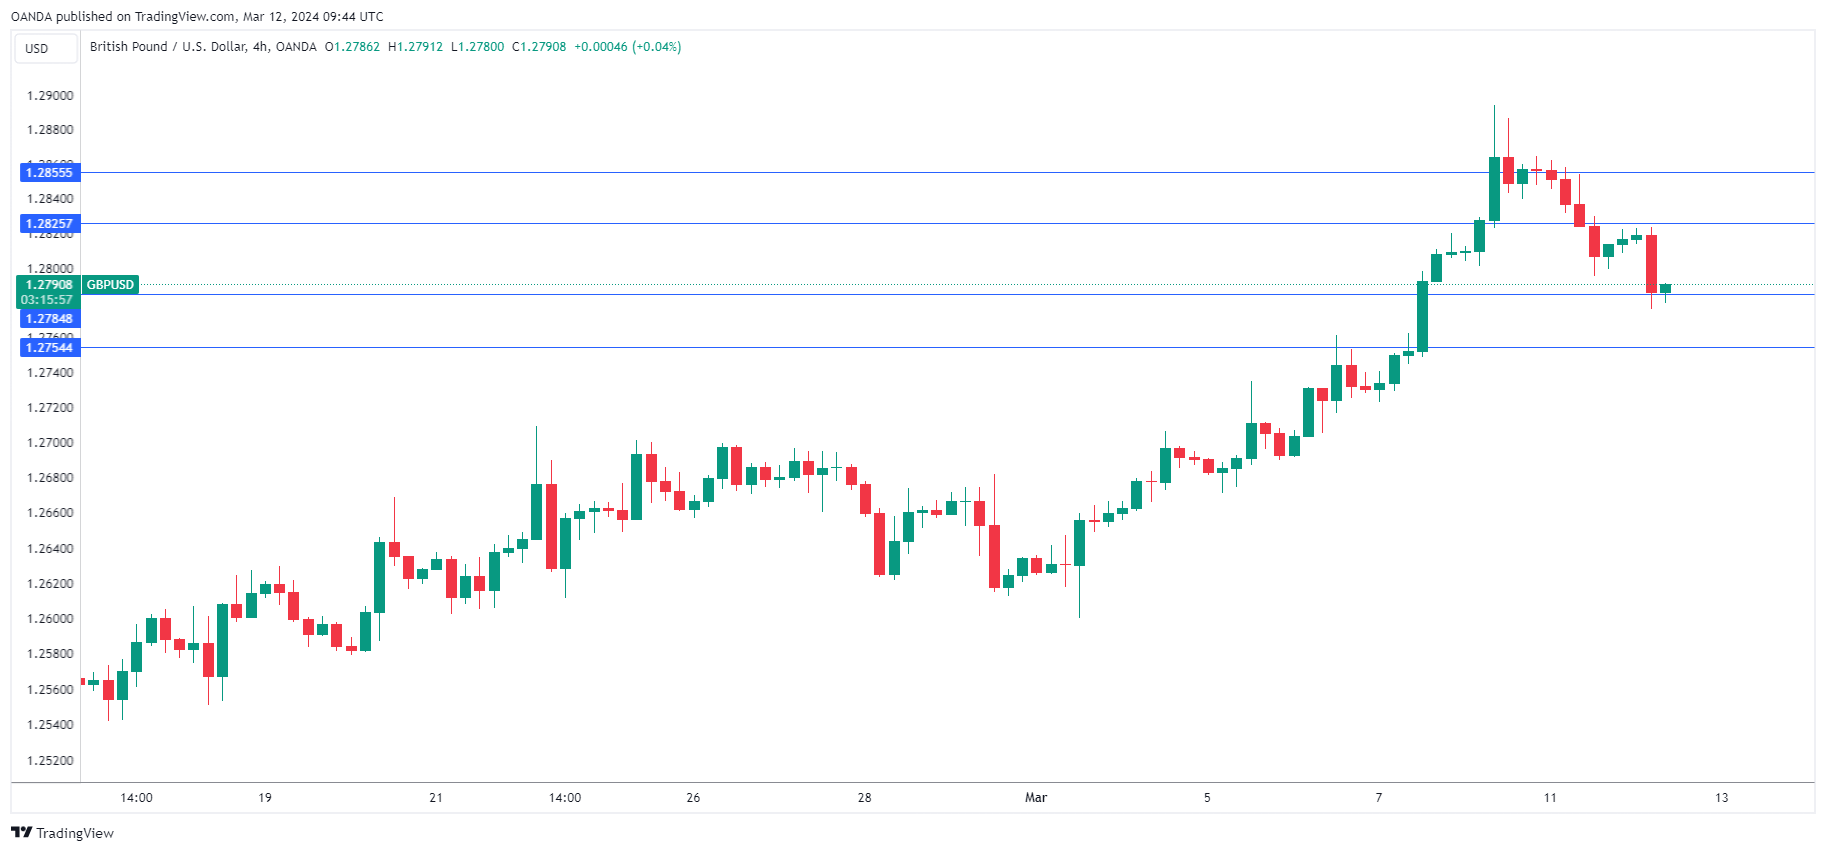
The British pound is drifting on Wednesday. In the European session, GBP/USD is trading at 1.2784, down 0.06%.
UK GDP expands 0.2% in January
It wasn’t a spectacular rebound but the UK economy showed some slight improvement, with GDP rising 0.2% m/m in January. This modest gain was in line with market expectations and followed a 0.1% decline in December. The main drivers behind the gain were retail trade and construction.
Over the past three months, GDP painted a gloomier picture. On an annualized basis, GDP declined by 0.3% decline, while GDP in the three months to January was down 0.1%.
The UK economy experienced a shallow recession in the second half of 2023, as the third and fourth quarters showed negative growth. The small gain in January shows that economy remains stagnant and could still be in a recession, but could point to the economy slowly finding its feet.
The Bank of England has projected that GDP for the first quarter will edge higher by 0.1% and the markets have priced in rate cut later in the year – August is the most likely date for a first rate cut but June is also a possibility. Inflation has dropped to 4% and consumers are feeling less of a squeeze on their wallets. Still, inflation remains double the 2% target and the battle against inflation is far from over.
Like other major central banks, the BoE is wary about lowering rates until it is convinced that inflation will not jump higher after it cuts rates. The BoE meets on March 21st and is widely expected to hold rates at 5.25% for a fifth straight time.
GBP/USD Technical
- GBP/USD tested support earlier at 1.2788. Below, there is support at 1.2751
- There is resistance at 1.2829 and 1.2866