Sample Category Title
Dissecting ECB Monetary Policy Decisions Communiqué
- The monetary policy decisions statement is released at 13:15 GMT
- President Lagarde et al could signal a policy shift in this communiqué
- The ECB staff projections could also hold the key to a rate cut soon
- The scheduled press conference takes place 30 minutes later
Complementing the detailed ECB preview, this report focuses on the first communication made by the European Central Bank after the completion of each rate setting meeting. A press statement called “Monetary policy decisions” is released at 13:15 GMT and it is the first point of reference for traders. This communiqué has grown in both length and importance since President Lagarde took over on November 1, 2019.
The communiqué layout is mostly predetermined
There is a preset layout for this communiqué with the necessary flexibility to shift the segments around in order to convey the intended message. The initial section contains a comment on the current economic conditions, mostly on inflation, with the first paragraph presenting any likely rate changes decided in the respective gathering. Barring a major upset, Thursday’s communiqué should report that the ECB decided to keep the three ECB rates unchanged.
ECB Staff projections are again the key
This first section of this communication release becomes even more important when the ECB staff projections are published in March, June, September and December of each year. Therefore, on Thursday this section will be closely scrutinized as the updated ECB staff projections could offer the ECB with sufficient justification for a rate cut soon, even in April. This has occurred in the past as on June 9, 2022 the staff projections were used to pre-announce the first rate hike after almost 11 years of stable rates, while the September 2023 projections essentially confirmed the end of the 14-month long rate hiking cycle.
The next paragraph usually signals the ECB's rate intentions regarding its future gatherings. For example, the "Governing Council (GC) will take whatever action is needed" comment at the April 14, 2022 communiqué morphed into the "the GC decided to take further steps in normalising its monetary policy" sentence in the June 9, 2022 release, essentially signalling that a rate hike was coming up next.
Since hiking rates in September 2023, the communiqué includes the following key paragraph: “Based on its current assessment, the GC considers that the key ECB interest rates are at levels that, maintained for a sufficiently long duration, will make a substantial contribution to this goal. The GC’s future decisions will ensure that its policy rates will be set at sufficiently restrictive levels for as long as necessary.” Should President Lagarde et al decide to send an initial dovish signal to the market, this paragraph could be amended, especially the latter part about the time needed to maintain the current level of ECB rates.
The "Key ECB interest rates" segment is usually next
Provided that there are no changes at the various ECB asset purchases programmes, the details of the meeting’s rate decision follow. Should the ECB want to clearly state its strategy for the next meeting, comments like "the GC expects to raise the key ECB interest rates again in September" appearing after the June 9, 2022 gathering could feature at Thursday's communiqué. This looks somewhat far-fetched considering President Lagarde’s inclination to avoid any precommitment, but the ECB has utilized this approach in the past and could possibly employ it again, if deemed necessary.
A comment on the various ECB purchase programmes usually follows
Βarring a surprise, no change at both the Asset purchase programme (APP) and pandemic emergency purchase programme (PEPP) is expected. The PEPP was amended at the December 2023 meeting with the ECB announcing its intention to reduce the PEPP portfolio by €7.5bn per month on average over the second half of 2024. It also maintained its original promise of discontinuing reinvestments under the PEPP at the end of 2024. Another amendment to the PEPP announced on Thursday could mean that a rate cut could be closer than currently foreseen by the market.
The "Refinancing operations" section is usually last
The refinancing section of this press communication is usually not market moving. However, the final four operations of the third TLTRO programme mature during 2024 with the first, and biggest one with €215.5bn outstanding amount, scheduled for a March 27 maturity. Considering the €3.5trn deposited at the overnight ECB facility, the full repayment of this amount is unlikely to change the current liquidity profile of most banking institutions. Nevertheless, President Lagarde et al could have a comment on the provision of liquidity by the ECB.
Putting everything together, when the monetary policy decisions communiqué is published on Thursday at 13:15 GMT the focus should be on (1) the first section detailing the new staff projections, offering the ECB’s view on recent inflation prints and possibly including a comment from President Lagarde et al on upcoming ECB gatherings and (2) on the "Key ECB interest rates" segment potentially signalling a rate cut in April or June.
ECB to Ask for More Patience Before Rate Cuts
- ECB announces rate decision on Thursday at 13:15 GMT
- Policymakers to avoid rate cut signals as inflation risks linger in the background
- New economic projections might reflect potential changes in the ECB’s thinking
Don’t expect rate cut signals
Hawkish views by central bankers and positive economic data have led investors to reconsider their expectations of aggressive rate cuts. Although no actions are anticipated during the European Central Bank's policy review this week, the board's updated economic projections may shed light on the feasibility of a rate cut in June.
The recent euphoria in European stock markets is more of a reflection of the AI frenzy than a true picture of the region’s economy. Real GDP growth in the eurozone declined to 0.1% y/y in the second half of 2023. This is below the ECB’s sluggish forecast of 0.6% y/y expansion but is not considered a technical recession thanks to Spain’s and Portugal’s positive tourism performance which prevented the bloc from falling off the cliff despite Europe’s diminishing powerhouse Germany weighing on the output.
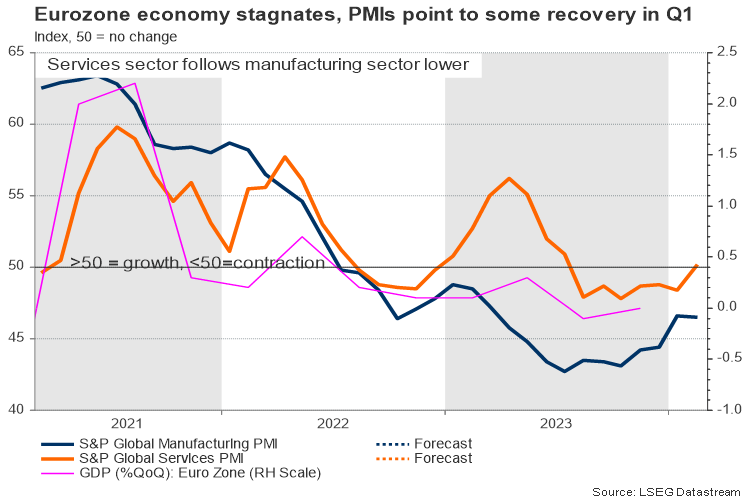
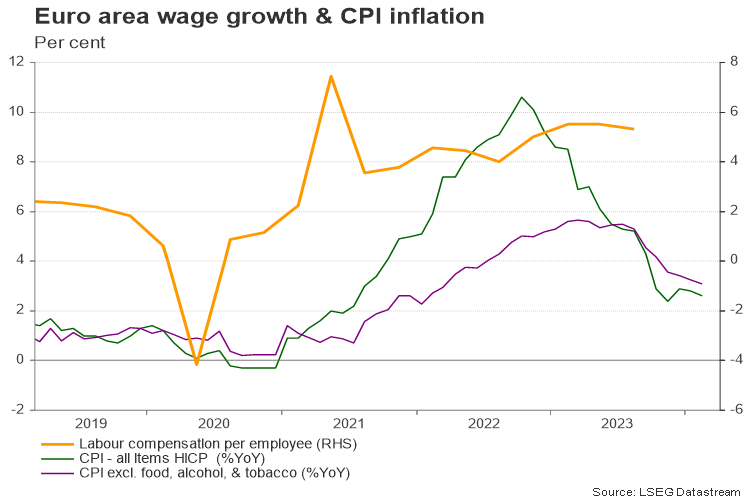
Despite the stagnant economy, policymakers are cautious about rate reductions to avoid fueling inflation amidst low unemployment and increasing wages. Moreover, the EU's surrounding areas are experiencing instability, with no clear indication of when a ceasefire will occur in the Middle East and if Russia-NATO relations will improve in the near future. Therefore, another round of spikes in energy and food prices cannot be ruled out in the foreseeable future.
The ECB prefers to witness a stable decline in inflation towards its 2.0% goal before engaging in talks about rate cuts. Apparently, this is difficult to ensure this week. So, the central bank may not risk losing its credibility by disclosing its rate cut plans prematurely, especially when core CPI inflation is still above 3.0% and oil prices are rising again. There is another meeting in April and a couple of data releases, which might provide more clarity on the inflation path before June’s gathering, while May’s negotiated wage data for Q1 might be worth waiting too.
But new economic projections might move the euro
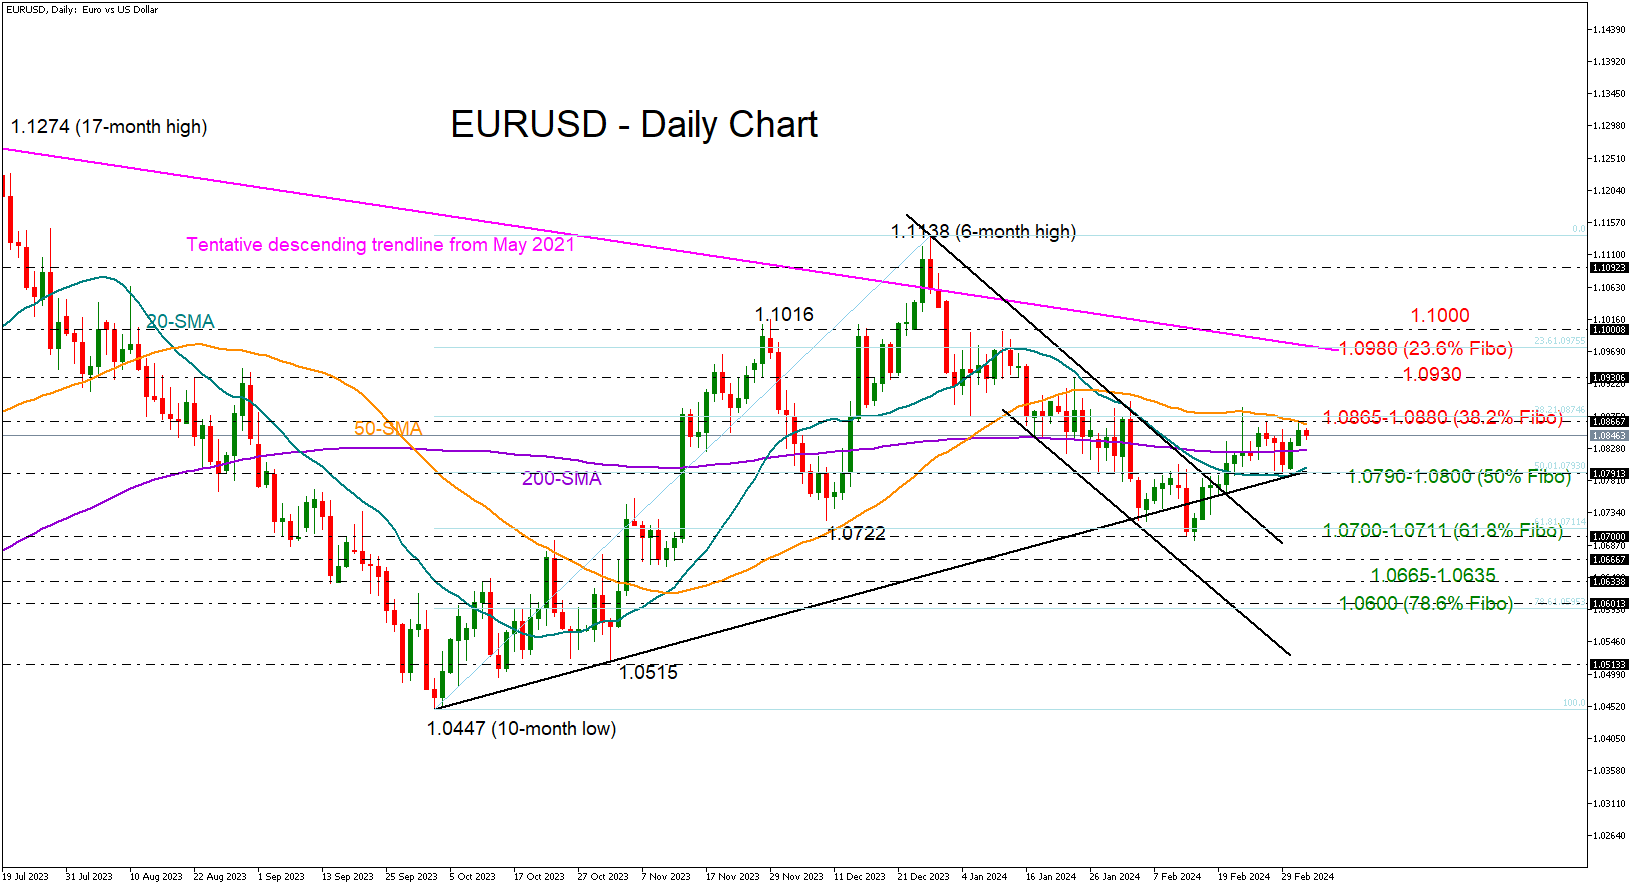
Hence, the central bank may not open up on Lagarde’s summer rate cut rhetoric, but its updated economic forecasts might give some indirect insight into its thinking. Previous projections showed headline inflation averaging around 2.1% y/y at the end of 2025. If policymakers bring the timing forward, investors might feel more confident that a June rate cut is on the way. In this case, EURUSD could reverse lower to test its 1.0790-1.0800 support zone, a break of which could prompt a sharper decline towards 1.0700.
Otherwise, if the central bank disappoints those who expect rate cut signals, sticking to its existing guidance and inflation forecasts, the euro could gear up. Specifically, the bulls will look for a close above the important 1.0880 bar and the 50-day simple moving average to lift the price aggressively into the 1.0930-1.0980 region. A negative surprise in the US nonfarm payrolls or unexpected dovish tweaks in Powell’s testimony later this week might have a similar impact on the pair.
That said, the eurozone economy may not have the comfort to wait for too long either. The elevated interest rates keep weighing on loans, with bank lending to households rising incrementally in February year-on-year and at the softest pace since June 2015. Mortgage lending faced a slight contraction for the first time in nine years, and corporate lending diminished too. Therefore, if not at this meeting, the next ECB gatherings might be more eventful for markets, potentially providing more details about when and how interest rates will drop.
USDJPY: Will the Bullish Trend Persist?
- Bullish Scenario: Intraday buys above 149.80 with TP: 150.50, TP2: 150.80, and TP3: 151.00 and 151.90 medium-term, with S.L. below 149.60 or at least 1% of account capital*. Apply trailing stop.
- Bearish Scenario: Sales below 150.50 with TP1: 149.80, TP2: 149.17, and 147.62 medium-term with S.L. above 150.80 or at least 1% of account capital*.
Fundamental Environment
The Bank of Japan has been postponing its plans to abandon its moderate policy stance as wage growth is still not strong enough to sustainably keep inflation above the 2% target.
This week, the key trigger for the pair will be the testimony of Federal Reserve Chairman Jerome Powell before Congress on Wednesday, who may reiterate that there is no urgency to cut rates. The Federal Reserve is less likely to cut interest rates before gaining confidence that inflation will sustainably return to the 2% target.
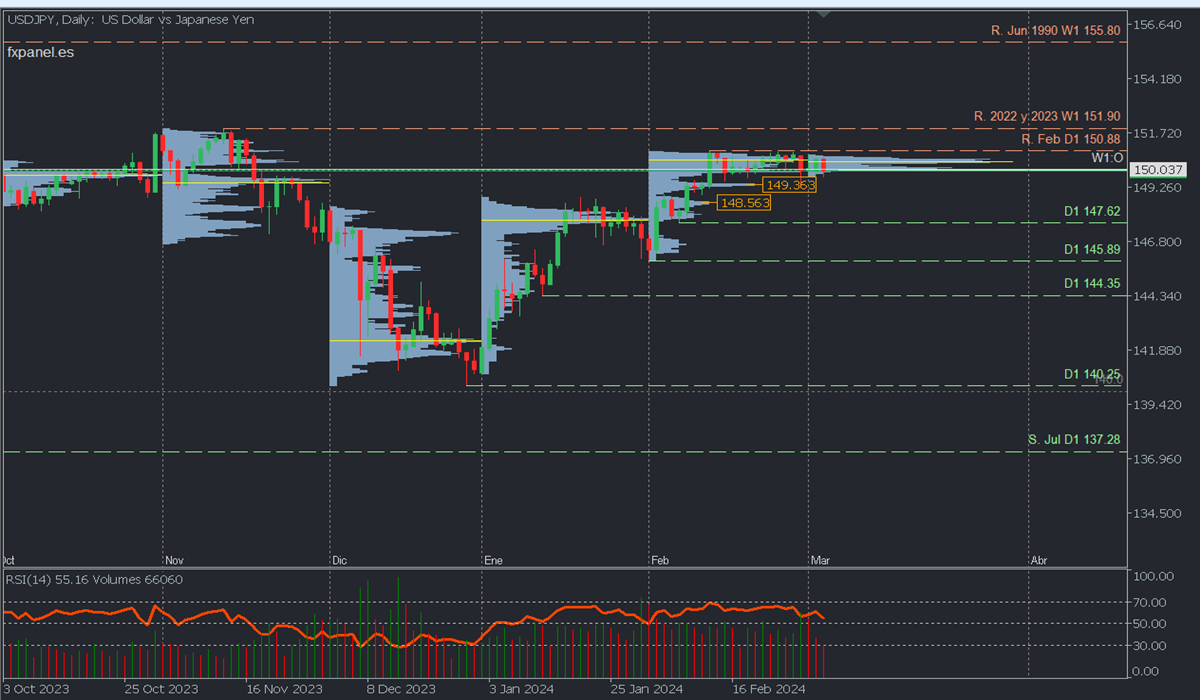
Analysis from a daily chart. Volume Profile and Structure.
The pair has maintained a bullish technical structure since January, aiming to break the 2022 and 2023 resistance at 151.96 to extend the multi-month bullish trend, although it remained consolidated in February below its resistance at 150.88, leaving a volume concentration around 150.48, after a brief rebound from a high-volume node of the month around 149.36.
All of the above leaves the scenario open to continue bullish if prices decisively break above the high volume zone and February resistance at 150.88, aiming to reach the 2022 and 2023 resistance at 151.90.
However, as long as prices remain below 150.00, a new correction towards 149.00 and 148.56 can be expected, with attention to the last relevant support of the bullish trend at 147.62, whose confirmed breakout with a second minimum will reverse the bullish trend.
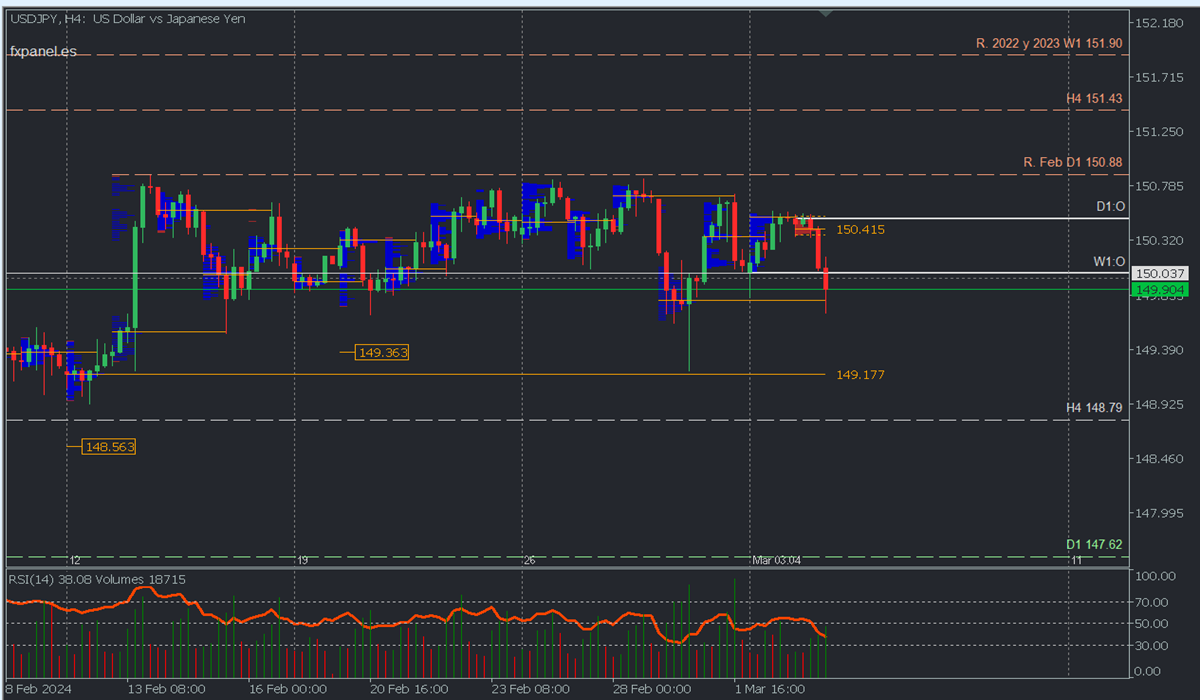
Scenario from H4 chart:
Consolidation could continue in the short term given the proximity of supply and demand zones, so sales can only be considered while prices remain below 150.40, considering the latest supply zones at 150.50 and 150.70, which will test the buy zone at 149.80 and 149.17. The breakout of the buy zones will extend the decline towards 148.79 with a possible challenge to the 147.62 support.
On the other hand, the strong bullish reaction from the buy zones that trigger a breakout of the sell zones between 150.50 and 150.80, with the consequent decisive breakout of the February resistance at 150.88, will be the signal that yen weakness will drive prices towards the 151.43 resistance and the highest in the last two years.
*Uncovered POC: POC = Point of Control: It is the level or zone where the highest volume concentration occurred. If there was a bearish movement from it previously, it is considered a sell zone and forms a resistance zone. Conversely, if there was a bullish impulse previously, it is considered a buy zone, usually located at lows, thus forming support zones.
**Consider this risk management suggestion
**It is very important that risk management be based on capital and traded volume. Therefore, a maximum risk of 1% of the capital is recommended. It is suggested to use risk management indicators like Easy Order.
Renminbi (USDCNH) Bullish Corrective Sequence Still Incomplete
In the last years, the renminbi made a pause in his attempt to get stronger against USD dollar. In February 2014, renminbi found support at 6.0153 as wave ((III)) and from there it made a perfect zig – zag correction structure to equal legs at 7.1964 in June 2020. After these 3 swings, USDCNH should have continued with the downtrend. However, the pair turning up again breaking 7.1964 high suggesting that market is developing a double correction structure.
USDCNH November 2023 Weekly Chart
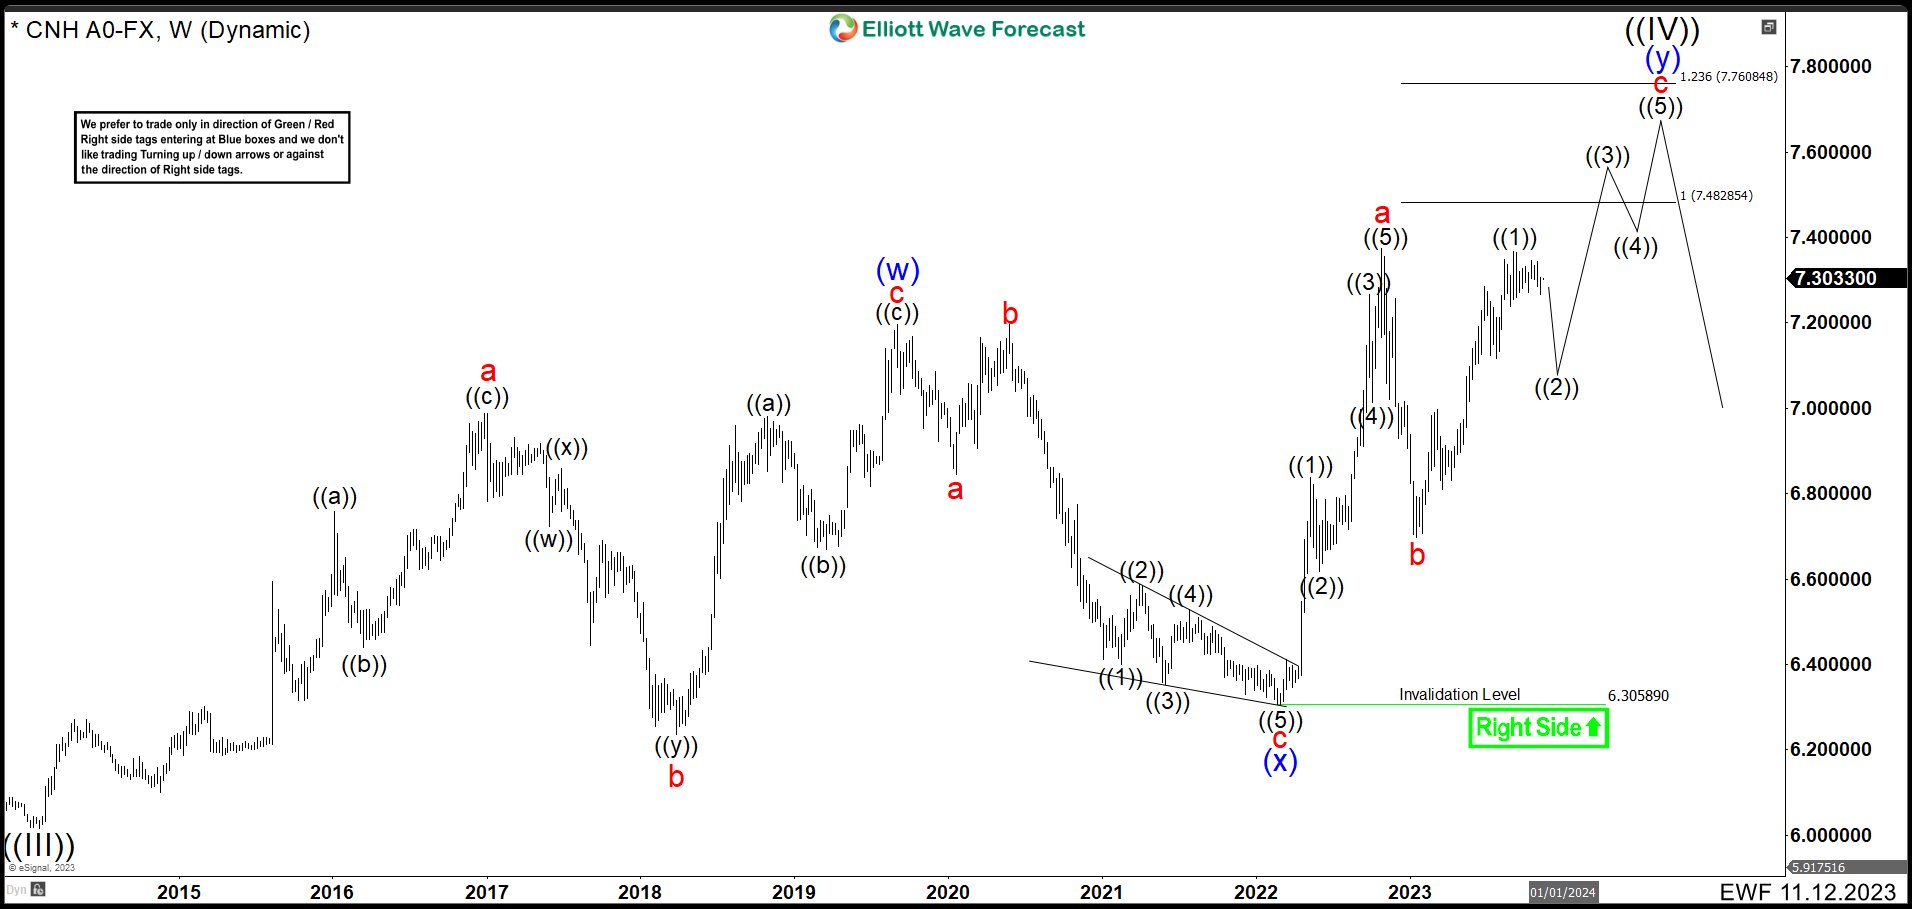
In the chart above, looks like the first leg of the wave “c” ended as wave ((1)). Up from 6.6883 wave “b” low, we can see 5 swings higher creating an impulse. First wave ended at 6.9967. Wave (2) pullback at 6.8107 low. Then USDCNH rally finishing wave (3) at 7.2855. Wave (4) correction completed at 7.1162 low. Last push to 7.3679 ended wave (5) and wave ((1)). Currently, we are expecting a correction as wave ((2)) of “c”. This movement should drop to 7.12 – 6.95 area correlating with USDX weakness that we are looking for. After finishing wave ((2)), pair should rally in 3 swings to build an impulse as wave “c” to 7.4866 – 7.7646 area. This also will finish the double correction wave (y), and the wave ((IV)) before renminbi continues with the downtrend.
USDCNH March 2024 Weekly Chart
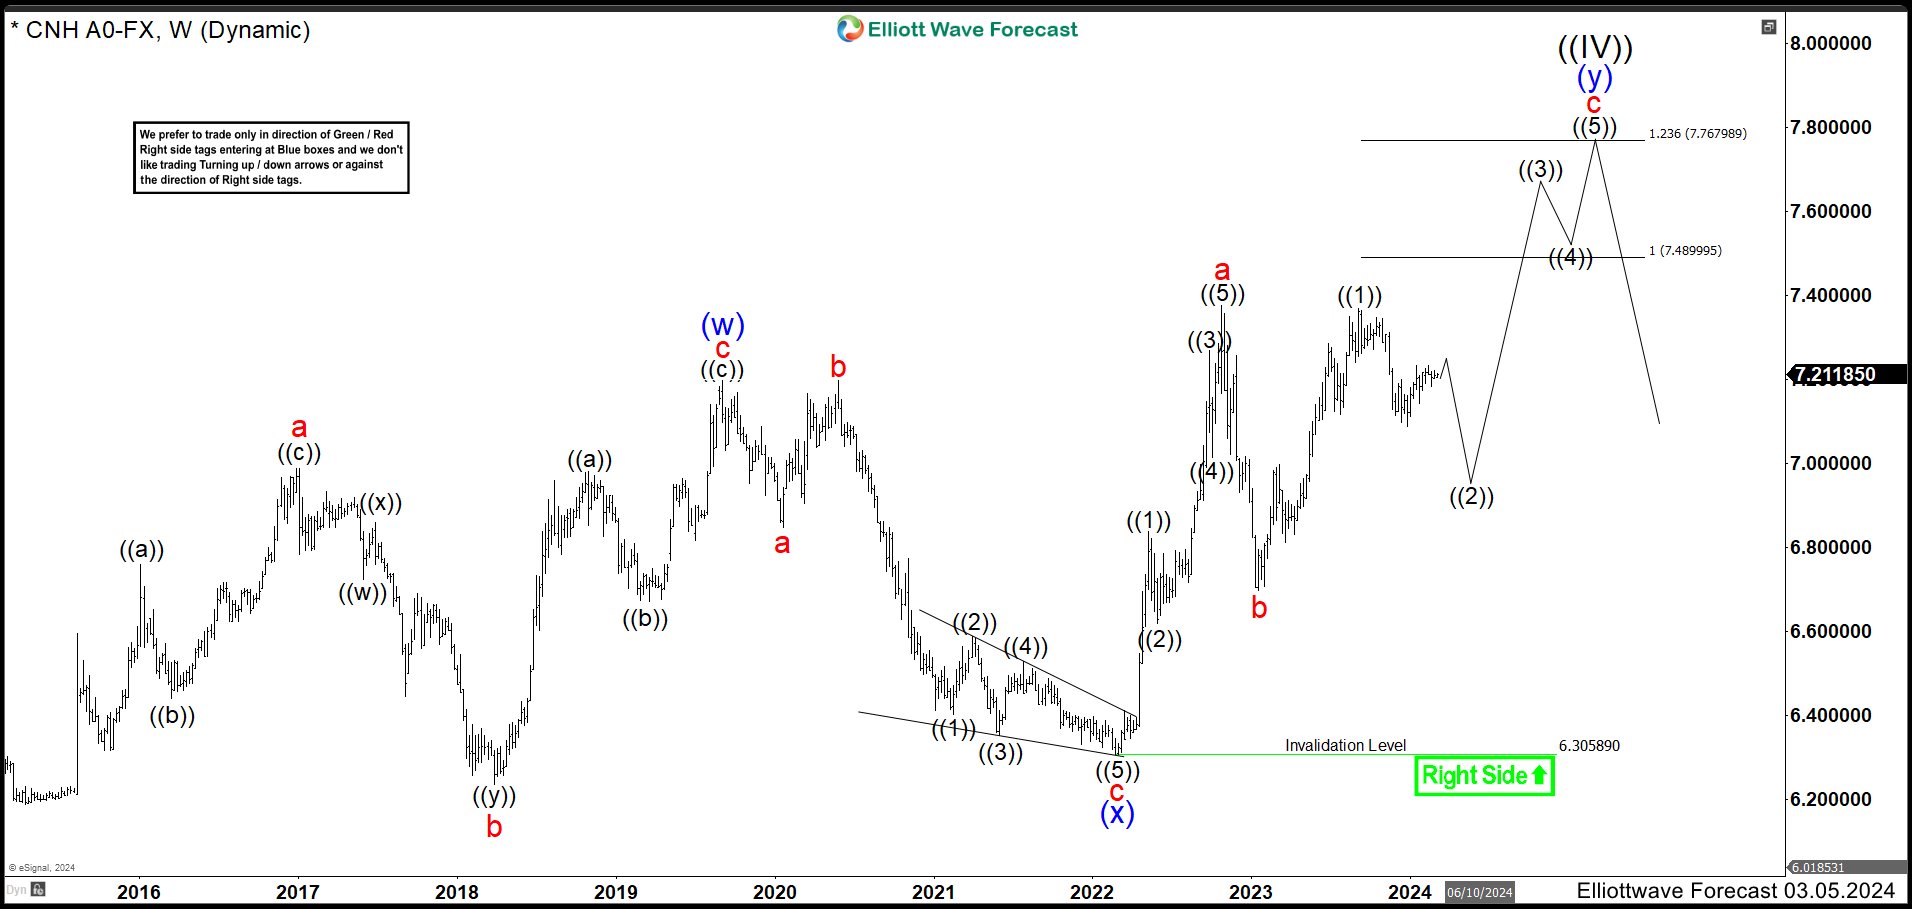
After 4 months, We can see a pullback as we expected. The drop in wave ((2)) ended at 7.08 in the 7.12 – 6.95 area and it has bounced higher. The reaction is not what we expected and pair looks like is lagging. Therefore, we are calling the possibility that structure ended at 7.08 could be wave (A) of ((2)), the bounce the wave (B) of ((2)) and we should see one more low to end wave ((2)) before resuming the rally to 7.4866 – 7.7646 area to complete wave ((IV)) correction.
USDCNH March 2024 Alternative Weekly Chart
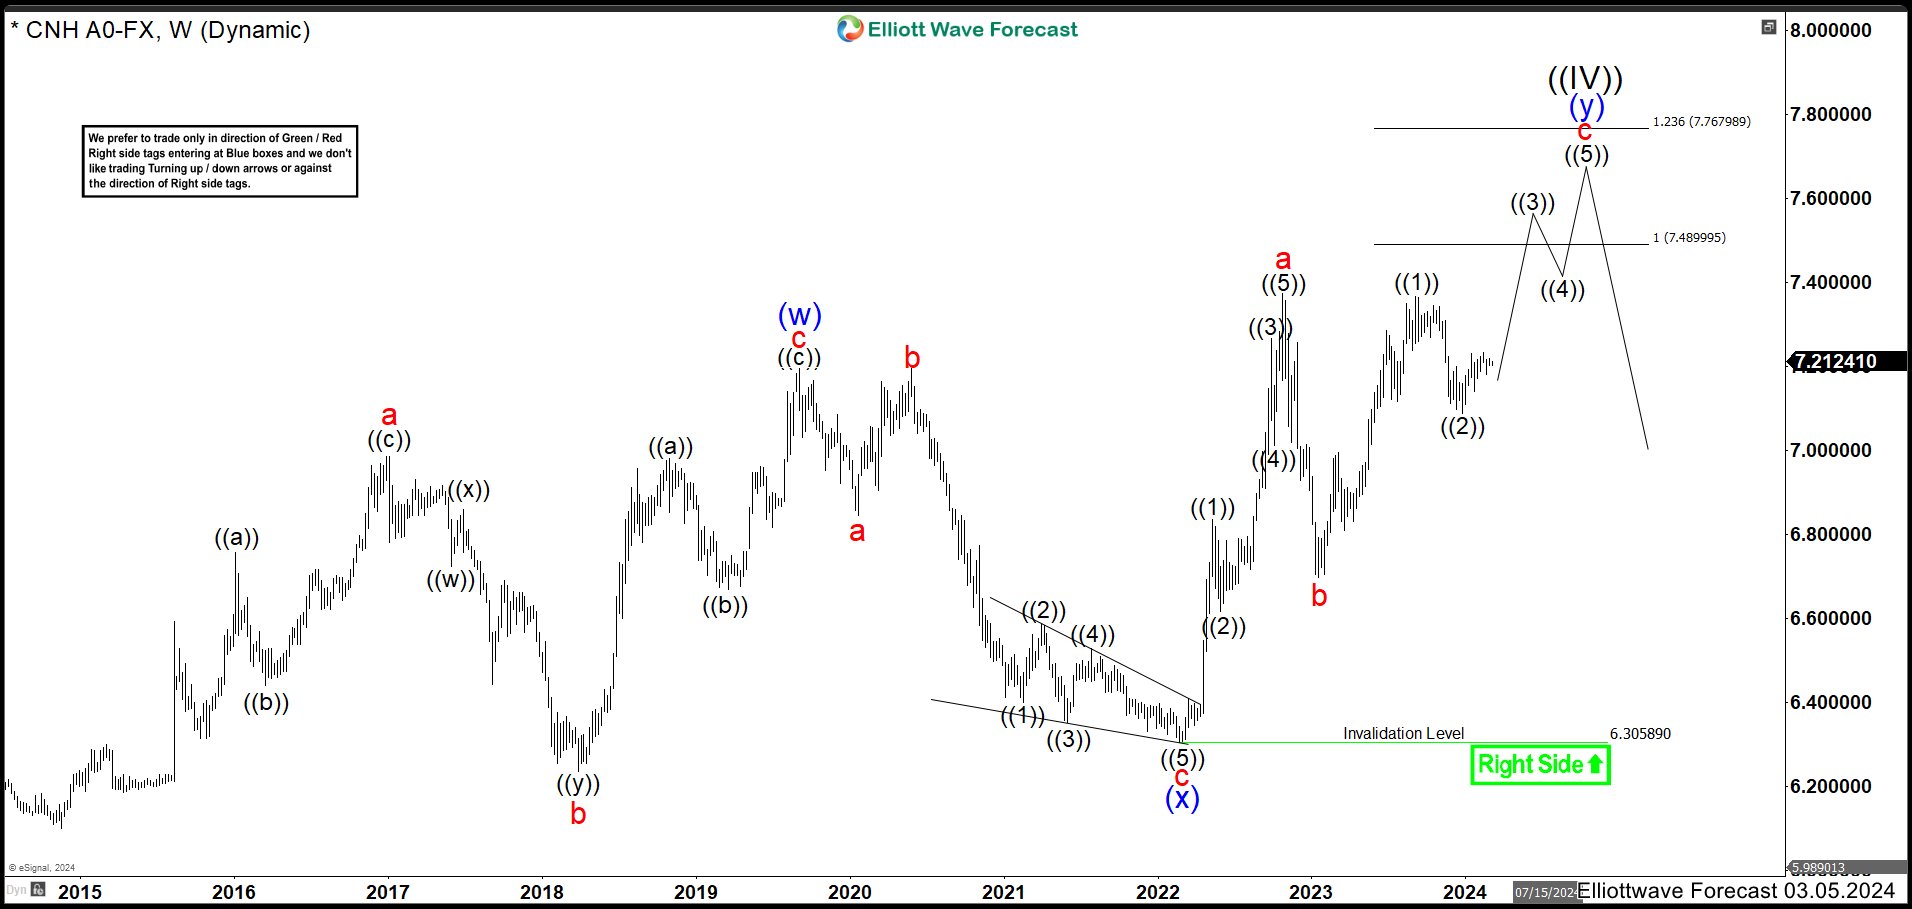
As alternative view, we cannot rule out that wave ((2)) is completed at 7.08 and the pair should continue to the upside to end the double correction as wave ((IV)).
ISM Shows Services Sector Expansion Continued in February
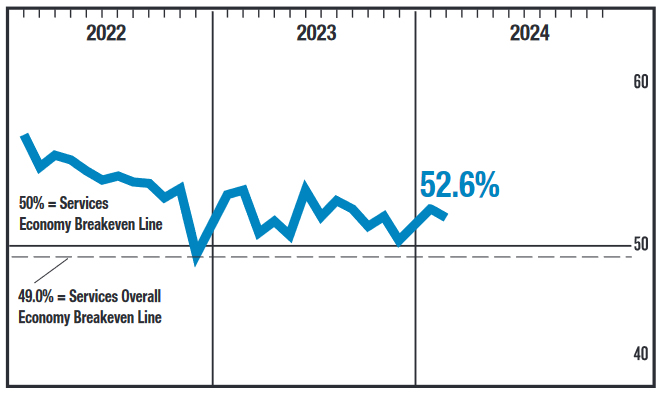
The ISM Services index slipped to 52.6 in February from 53.4 in January, just shy of the 53.0 consensus expectation. However, growth did become more widespread, with 14 of 18 industries reporting growth for the month – up from ten in January.
The business activity sub-index rose to 57.2, while the new orders index ticked up to 56.1 from 55.0 in January.
The prices paid component tumbled 5.4 percentage points (pp) to 58.6 – giving up much of January's gain. The supplier deliveries sub-index fell to 48.9, indicating shorter delivery times compared to January.
The employment sub-component flipped back to signaling contraction, falling 2.5 pp to 48.0.
Key Implications
Another month of expansion in the service sector – albeit at a slightly slower rate than the consensus was expecting. However, there were some mixed signals under the hood, with employment falling short of expectations but new order growth firming in the month.
Despite the slight miss, the details of the report (new orders and business activity) continue to show solid, and broader, growth in the services sector. For Fed watchers, the interesting tidbits are in the employment, supply deliveries and prices indexes. Employment growth continues to trend lower (posting a second contractionary reading in three months), while improving supplier delivery times and a deceleration in prices paid growth suggest improving supply side conditions. Improvements on the supply side, and a loosening in the labor market, suggest inflationary pressure could ease in the coming months.
EUR/USD Shows Strength Amid Anticipation of Key Events
The EUR/USD pair is exhibiting resilience, navigating around the 1.0850 mark on Tuesday, following a sequence of rises in the previous two sessions. The current market atmosphere is one of cautious optimism, as participants brace for significant upcoming events, including a speech by Jerome Powell, the head of the US Federal Reserve, and the release of February's employment sector statistics on Friday. Particularly, the focus will be on the wage growth components for February, which are speculated to have nearly tripled, potentially indicating a diminishing impact of pro-inflationary factors.
The consensus among market observers is leaning towards an expectation that the Federal Reserve may initiate the first interest rate cut of this monetary cycle in June, with possibilities of further reductions occurring up to three times by year-end.
EUR/USD Technical Analysis
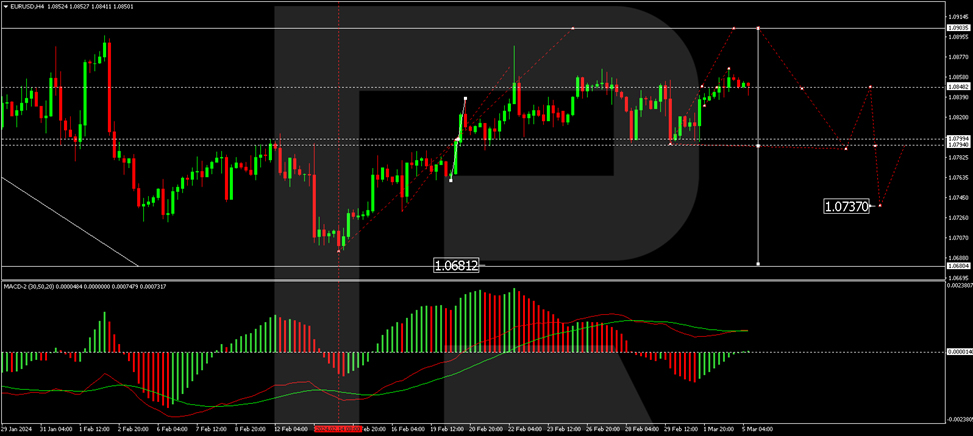
On the H4 chart, the EUR/USD pair is currently carving out a consolidation pattern around the 1.0831 level, with a recent extension up to 1.0866. A downward correction to 1.0831, testing the level from above, could materialize today. An upward break from this consolidation could herald the start of a growth wave towards 1.0900, at which point the current growth phase is anticipated to conclude, potentially giving way to a new downtrend with an initial target at 1.0680. This outlook is supported by the MACD indicator, which shows the signal line above zero and a sharply rising histogram, indicating a continuation of the growth trend.
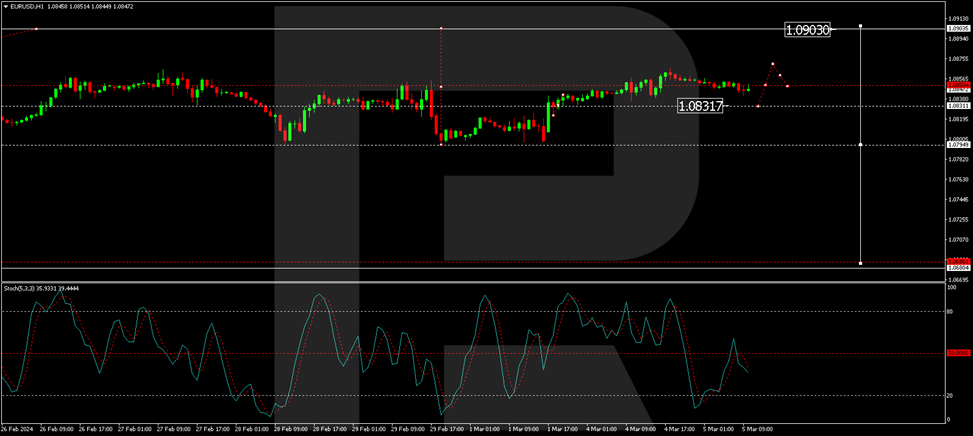
The H1 chart reveals a consolidation phase around the 1.0831 level, with a growth structure targeting 1.0870 currently unfolding. The local target of 1.0866 for this wave has been achieved, with a correction back to 1.0831 anticipated. Following this correction, the focus will shift towards the structure's growth potential to 1.0870. The Stochastic oscillator, currently below the 50 mark and expected to drop to 20, validates this scenario, suggesting a potential for further fluctuations within this bullish trend.
Sunset Market Commentary
Markets
It was a drawn-out stretch towards the publication of the US services ISM today (read about it down below). Core bonds in the meantime gained ground with US Treasuries in particular shaking off yesterday’s Bostic’s comments. The Atlanta Fed president warned for inflation risks from “pent-up exuberance”. That’s how he describes companies being ready to spend and hire when “the time is ripe” (read: when the Fed starts cutting rates). Should the Fed heed Bostic’s advice and pause after it cut rates for a first time in Q3, the December dot plot’s total of 75 bps (three cuts) is even beginning to look overly optimistic. Anyway, US yields drop between 2.9 and 6.2 bps with the long end outperforming. Losses in the 10-y yield for example extended after slipping below intermediate support area between 4.17% (200 daily moving average) and 4.18% (mid-February correction low). German Bunds outclass Treasuries. Yields print 4.8 (2-y) to 8.2 bps (30-y) lower in a similar curve shift. The drop in core bond yields helped gold to temporarily surpass the previous intraday record high of early December. In terms of closing prices, the shiny metal already set a new record yesterday following a curious two-day rally and is on track to hit another today. Stock markets struggle for direction. The EuroStoxx50 wavers some 0.2% from its post-GFC top while Wall Street returns 0.5-1%. Switching to currency markets, we note some JPY outperformance vs global peers – be it without technical implications. USD/JPY holds just north of 150, EUR/JPY eases a few ticks but hovers around recent highs at 162.8. Sterling is doing good despite gilt outperformance pushing yields more then 10 bps (10-y) lower. EUR/GBP inches lower to below 0.855 but with the broader stalemate in the pair not going anywhere.
The February US services ISM missed the headline reading of 53 by coming in at 52.6, a slightly bigger retreat from the 53.4 in January. Details showed employment dipping to 48 as the main culprit for the undershoot. New orders however unexpectedly expanded at a faster clip (56.1 from 55). The latter is coming on top of already strong business activity (rises from 55.8 to 57.2). That combination may well mean the employment setback is only temporary. Prices paid eased to 58.6, erasing part of the January uptick. All in all a good reading considering the underlying series. Yields in the US nevertheless lose a few more extra basis points in a first reaction, dragging German yields along.
News & Views
The German government coalition today proposed plans for supplementary pension scheme that should help to address the challenges to the funding of the pension system in the next decade. The new scheme will be funded both by loans and transfers from the federal budget. Investment in the fund should amount to €200 bln by the middle of next decade. From 2035, the proceeds from the fund should flow back to the pension system and mitigate the burden of the pension costs for employees and the government budget. From the mid-2030’s, €10 bln should annually flow from the fund to the pension system. The government intends to guarantee that pension payments can be kept at least at 48% of the average wage until end of the 2030’s. Additional measures should be taken to guarantee it beyond 2039, according to the government. The government wants the new measures to be approved in Parliament before summer.
Hungary today published details on Q4 GDP growth. Activity in the economy was unchanged both from the previous quarter as well as compared to the same quarter in 2022. The expenditure approach showed that households consumption rose by 0.8% Q/Q while government consumption decreased by 0.7% Q/Q. Gross fixed capital formation increased by 1.0%. With respect to external trade, both volumes of imports and exports decline respectively by 2.0% and 2.3%. In a production approach agriculture (+4.2%) and services contributed positively to Q4 growth. Activity in construction (-1.6% Q/Q) and industry (-1.9%) decreased in Q4. Overall in 2023, activity in the Hungarian economy was 0.7% lower (calendar adjusted) compared to 2022.
GBP/USD upside breakout after US ISM services miss
Dollar falls broadly after slightly lower than expected ISM Services PMI reading. But more importantly, employment component was back in contraction while price component dipped notably.
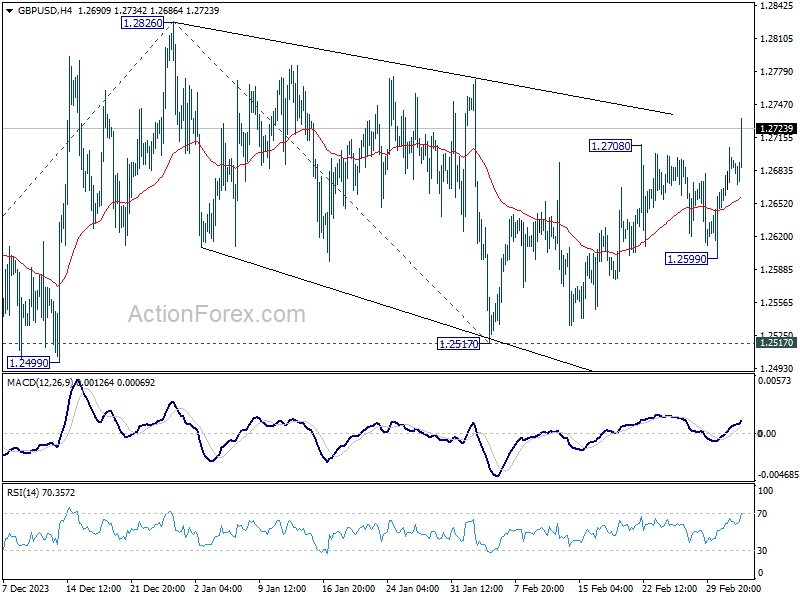
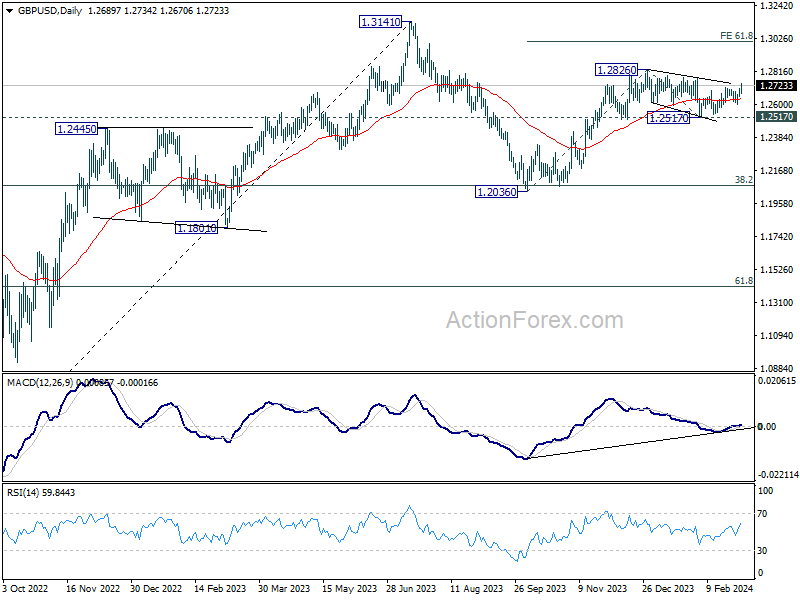
GBP/USD's rebound from 1.2517 resumed by breaking through 1.2708 resistance. The development argues that corrective from 1.2826 has completed at 1.2517 already. Further rise is now in favor to retest 1.2826 resistance first. Decisive break there will resume whole rally from 1.2517 to 61.8% projection of 1.2036 to 1.2826 from 1.2517 at 1.3005 next.
US ISM services falls to 56.2, employment back in contraction
US ISM Services PMI fell from 53.4 to 52.6 in February, worse than expectation of 53.0. Looking at some details, business activity/production rose from 55.8 to 57.2. New orders rose from 55.0 to 56.1. Employment fell from 50.5 to 48.0, back in contraction. Prices fell from 64.0 to 58.6.
Anthony Nieves, Chair of ISM Services Business Survey Committee, said, "The slight decrease in the rate of growth in February is a result of faster supplier deliveries and the contraction in the Employment Index. The majority of respondents are mostly positive about business conditions. Respondents remain concerned about inflation, employment and ongoing geopolitical conflicts."
"The past relationship between the Services PMI and the overall economy indicates that the Services PMI for February (52.6 percent) corresponds to a 1.2-percent increase in real gross domestic product (GDP) on an annualized basis."