Sample Category Title
XAU/USD: Gold Retests Record High, Bulls Likely to Take a Breather Before Resuming
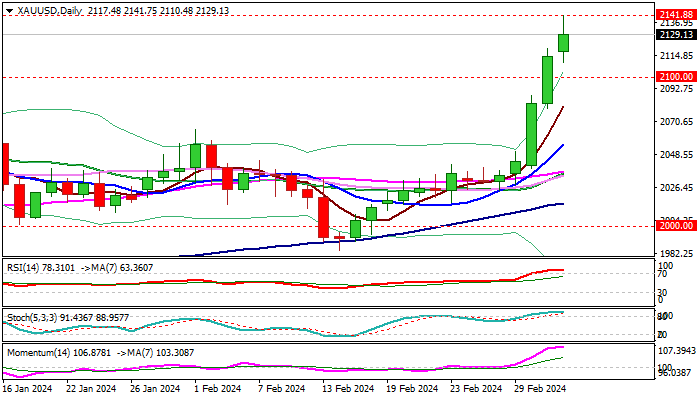
Steep rally extends into the fifth straight day on Tuesday, after the metal closed above $2100 level for the first time in history on Monday.
Strong demand for safe haven bullion was sparked by further drop in the activity in US manufacturing sector and persistently weak consumer sentiment.
Bulls retested key barrier at $2141 (gold’s record high, posted on Dec 4), break of which to spark fresh acceleration higher and open way for 2200+ gains.
Meanwhile, increased headwinds at this zone should be anticipated, due to significance of resistance and strong rejection seen after last rally to this level (Dec 4 bearish daily candle with very long upper shadow), as well as strongly overbought daily studies.
Dips should be limited (ideally to find ground at $2100/$2080 zone) to keep bulls intact and offer better levels to re-enter bullish market.
Res: 2141; 2181; 2206; 2226.
Sup: 2110; 2100; 2088; 2080.
EUR/USD Mid-Day Outlook
Daily Pivots: (S1) 1.0840; (P) 1.0853; (R1) 1.0870; More...
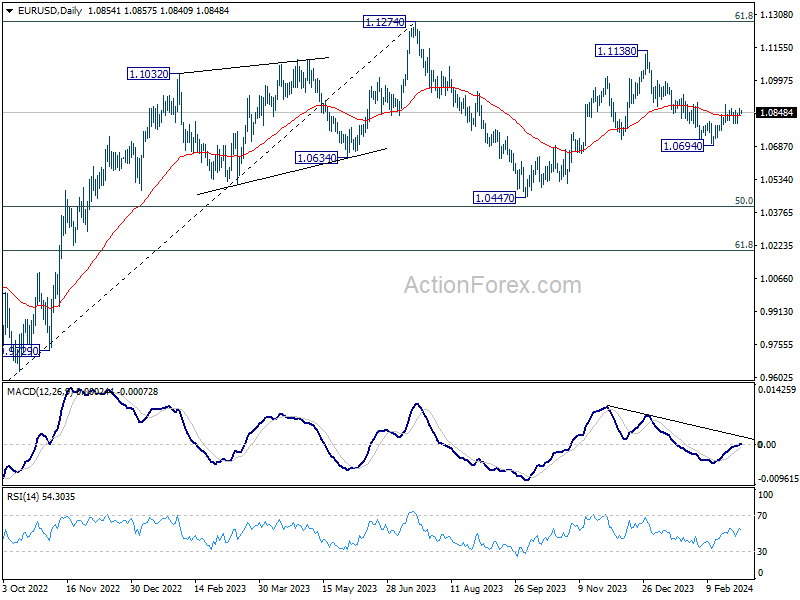
Range trading continues in EUR/USD and intraday bias remains neutral. On the upside, break of 1.0887 and sustained trading above 55 D EMA (now at 1.0831) will affirm the case that fall from 1.1138 has completed. Stronger rally would then be seen back to 1.1138. However, break of 1.0795 minor support will turn bias back to the downside for retesting 1.0694 support.
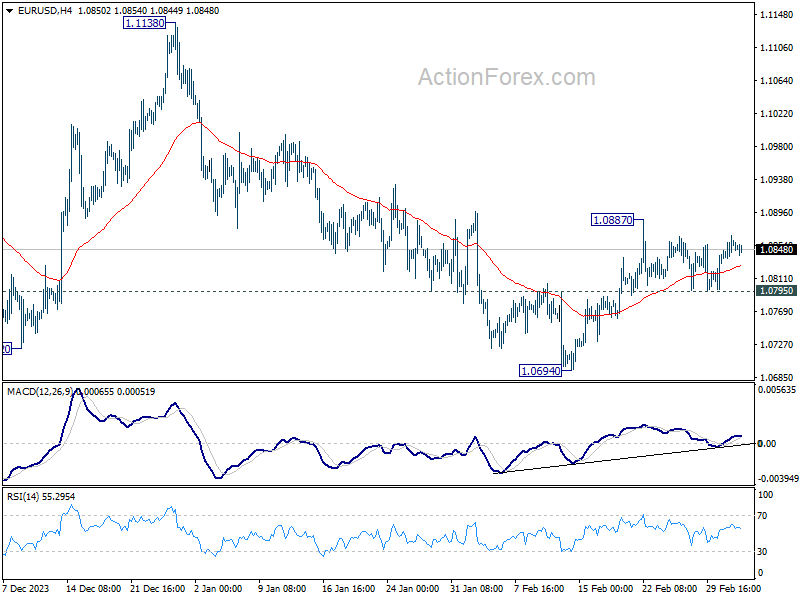
In the bigger picture, price actions from 1.1274 are viewed as a corrective pattern to rise from 0.9534 (2022 low). Rise from 1.0447 is seen as the second leg. While further rally could cannot be ruled out, upside should be limited by 1.1274 to bring the third leg of the pattern. Meanwhile, sustained break of 1.0694 support will argue that the third leg has already started for 1.0447 and possibly below.
GBP/USD Mid-Day Outlook
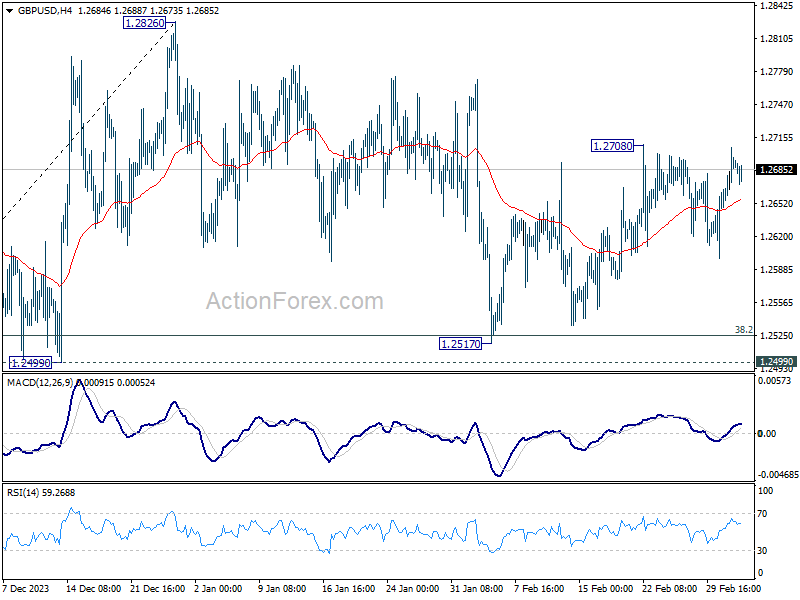
Daily Pivots: (S1) 1.2659; (P) 1.2683; (R1) 1.2716; More...
Intraday bias in GBP/USD stays neutral as it's staying in range below 1.2708. On the upside, break of 1.2708 resistance will indicate that correction from 1.2826 has completed. Intraday bias will be back on the upside for retesting 1.2826. Nevertheless, decisive break of 1.2499 will argue that whole rise from 1.2036 has completed and turn near term outlook bearish.
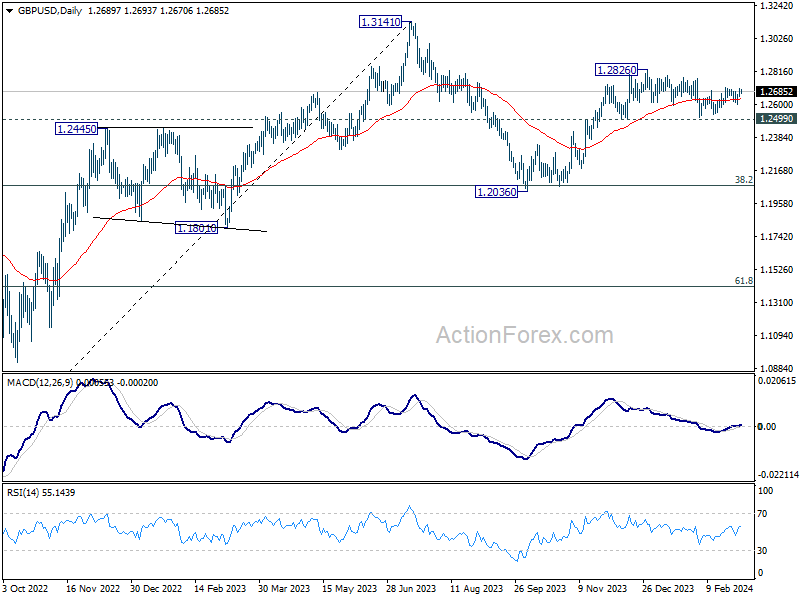
In the bigger picture, price actions from 1.3141 medium term top are seen as a corrective pattern to up trend from 1.0351 (2022 low). Rise from 1.2036 is seen as the second leg, which could be still in progress. But upside should be limited by 1.3141 to bring the third leg of the pattern. Meanwhile, break of 1.2499 support will argue that the third leg has already started for 38.2% retracement of 1.0351 (2022 low) to 1.3141 at 1.2075 again.
USD/CHF Mid-Day Outlook
Daily Pivots: (S1) 0.8811; (P) 0.8852; (R1) 0.8874; More....
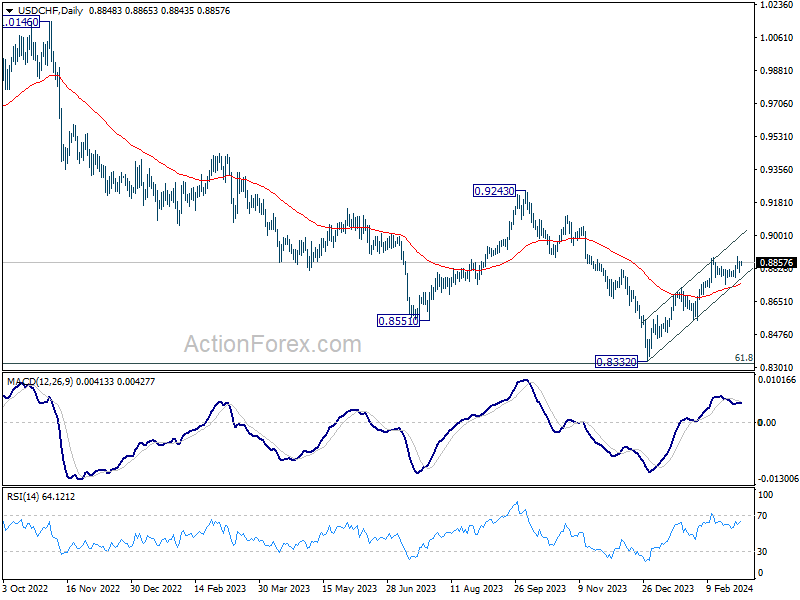
Intraday bias in USD/CHF remains neutral as range trading continue below 0.8891. Further rally is in favor as long as 0.8741 support holds. Break of 0.8891 will resume the whole rebound from 0.8332 towards 0.9243 key resistance. Nevertheless, break of 0.8741 support will turn bias back to the downside for deeper pullback.
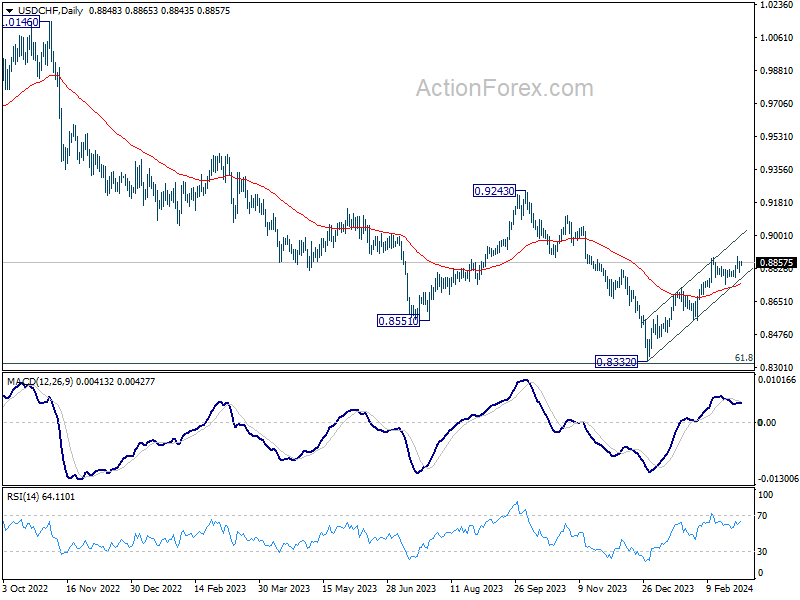
In the bigger picture, a medium term bottom should be formed at 0.8332, on bullish convergence condition in W MACD, just ahead of 0.8317 long term fibonacci support. It's still early to decide if the larger down trend from 1.0146 (2022 high) is reversing. But further rise should be seen to 0.9243 resistance even as a correction.
USD/JPY Mid-Day Outlook
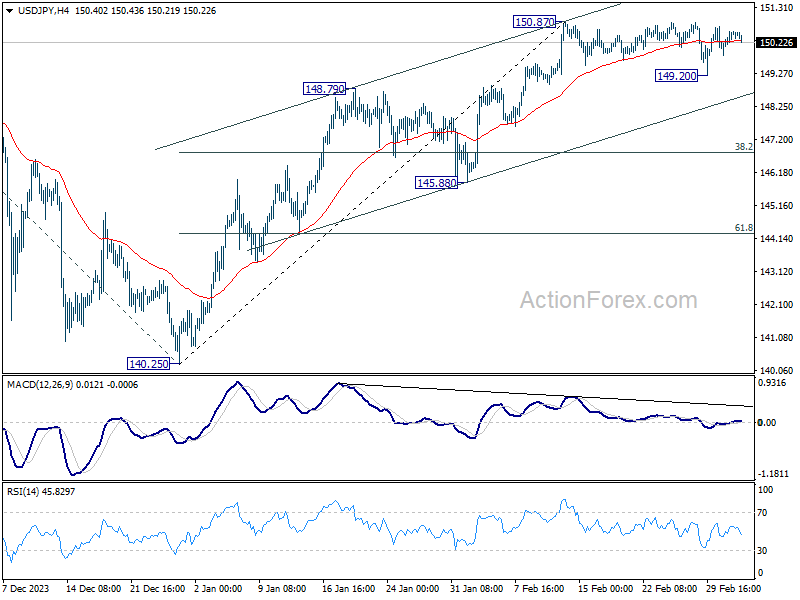
Daily Pivots: (S1) 150.05; (P) 150.31; (R1) 150.78; More...
USD/JPY is still bounded in consolidation from 150.87 and intraday bias remains neutral at this point. On the upside, break of 150.87 will resume the rise from 140.25 to 151.89/93 key resistance zone. On the other hand, considering bearish divergence condition in 4H MACD, firm break of 149.20 will confirm short term topping at 150.87. Deeper fall would be seen to channel support (now at 148.60) and possibly below, even as a corrective move.
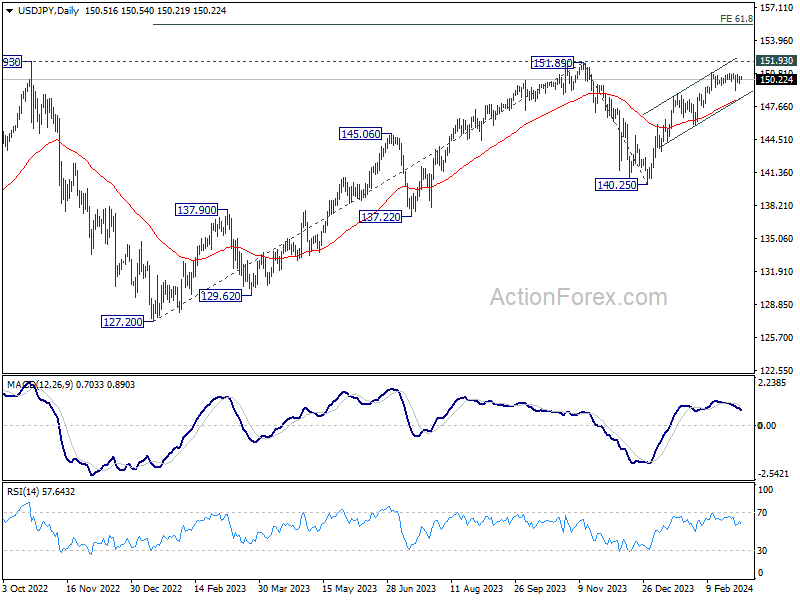
In the bigger picture, rise from 140.25 is seen as resuming the trend from 127.20 (2023 low). Decisive break of 151.89/.93 resistance zone will confirm this bullish case and target 61.8% projection of 127.20 to 151.89 from 140.25 at 155.50. However, break of 148.79 resistance turned support will delay this bullish case, and extend the corrective pattern from 151.89 with another falling leg.
AUD/USD Mid-Day Report
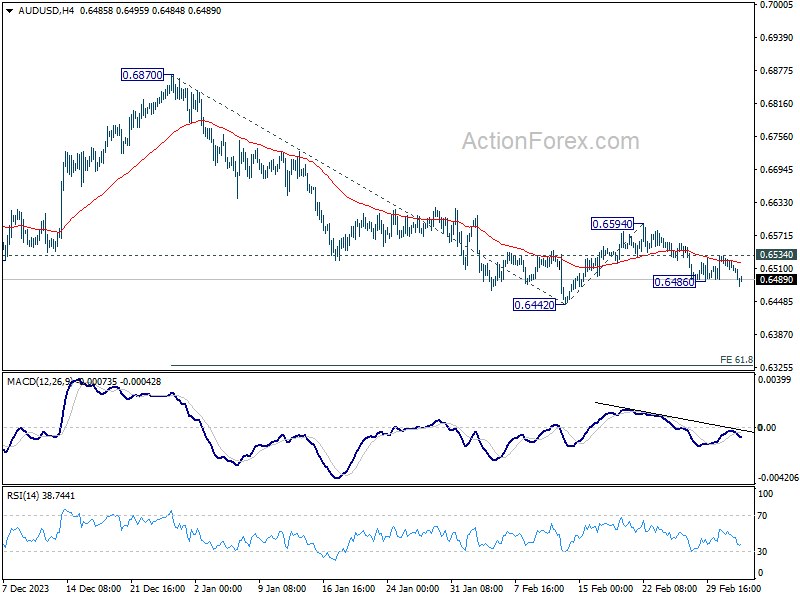
Daily Pivots: (S1) 0.6499; (P) 0.6517; (R1) 0.6528; More...
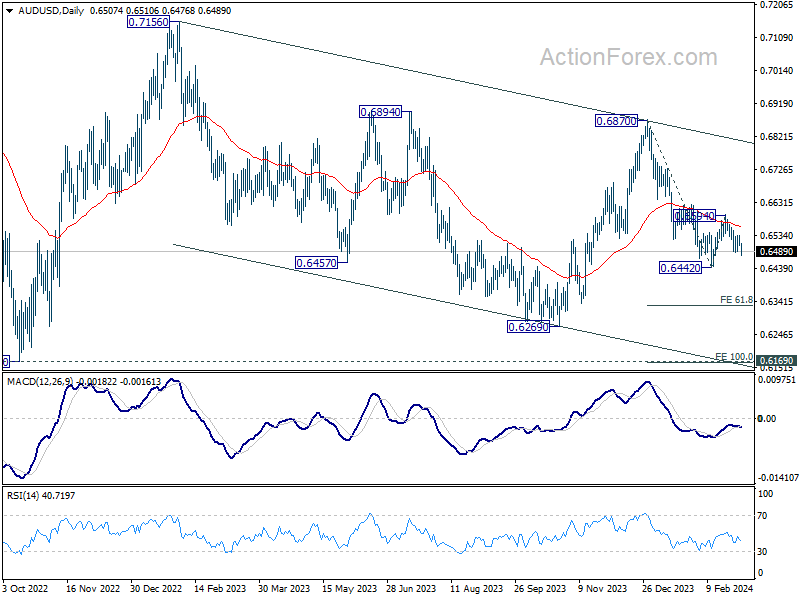
Intraday bias in AUD/USD is back on the downside with break of 0.6486 temporary low. Retest of 0.6442 support should be seen next. Firm break there will resume whole decline from 0.6870 for 61.8% projection of 0.6870 to 0.6442 from 0.6594 at 0.6329. On the upside, above 0.6534 minor resistance will turn intraday bias neutral again first. But outlook will stay bearish as long as 0.6594 resistance holds, in case of recovery.
In the bigger picture, price actions from 0.6169 (2022 low) are seen as a medium term corrective pattern to the down trend from 0.8006 (2021 high). Fall from 0.7156 (2023 high) is seen as the second leg, which might still be in progress. Overall, sideway trading could continue in range of 0.6169/7156 for some more time. But as long as 0.7156 holds, an eventual downside breakout would be mildly in favor.
Aussie Falters While Dollar Sees Slight Uptick
The picture is pretty much the same through Asian and early part of European session, with the Australian and New Zealand Dollars, alongside the Canadian Dollar, persisting as the day's underperformers. Swiss Franc has also found itself under pressure, particularly against its European counterparts, aligning with the commodity currencies in their struggle. Conversely, Yen and Dollar have eked out modest gains, closely tailed by the Euro and Sterling
Market reactions to the latest PMI services data from the Eurozone and the UK have been subdued. Both reported suggested some persistent inflationary pressure in the services sector, which could deter ECB and BoE for earlier rate cuts. With the ECB's meeting later this week, market participants are keenly awaiting any hints of future policy direction, especially with new economic projections set to be unveiled.
The economic calendar promises to bring heightened attention to the markets, with several key events lined up. The imminent release of the US ISM services data, Australia's GDP figures in the next Asian session, and tomorrow's BoC rate decision, coupled with Fed Chair Jerome Powell's testimony to Congress, are all poised to influence market sentiment.
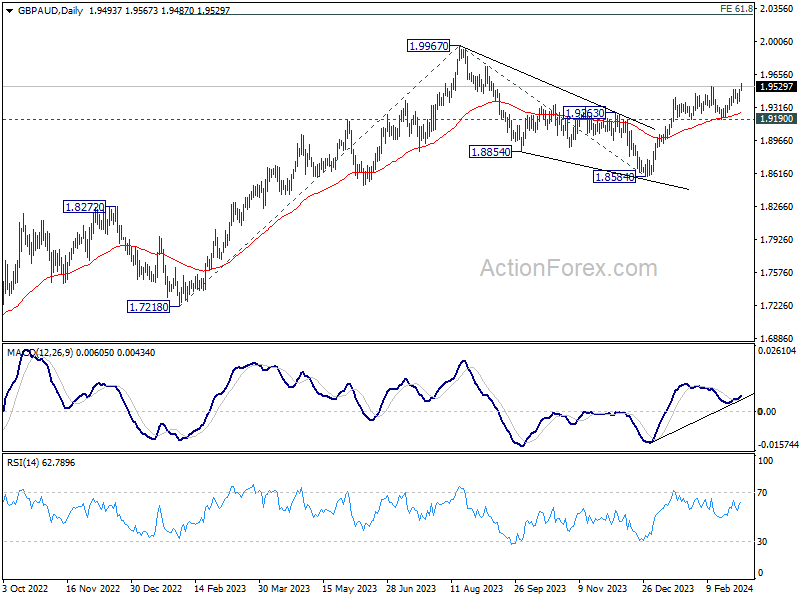
Technically, GBP/AUD's rebound from 1.8584 resumed today by breaking through 1.9527 near term resistance. Prior support from 55 D EMA is a bullish sign, which strength the case that correction from 1.9967 has completed with three waves down to 1.8584. Further rise is now expected as long as 1.9190 support holds, to retest 1.9967. Firm break there will resume larger up trend.
In Europe, at the time of writing, FTSE is down -0.01%. DAX is flat, CAC is up 0.03%. UK 10-year yield is down -0.0675 at 4.153. Germany 10-year yield is down -0.0349 at 2.368. Earlier in Asia, Nikkei fell -0.03%. Hong Kong HSI fell -2.61%. China Shanghai SSE rose 0.28%. Singapore Strait Times fell -0.48%. Japan 10-year JGB yield fell -0.0080 to 0.708.
Eurozone PPI down -0.9% mom, -8.6% yoy in Jan
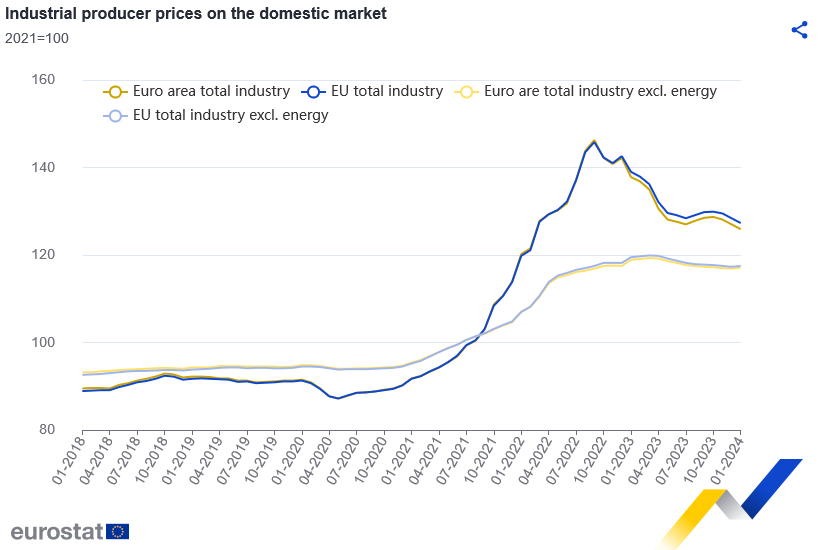
Eurozone PPI fell -0.9% mom, -8.6% yoy in January, below expectation of -0.1% mom, -0.8% yoy. For the month, PPI decreased by -0.2% for intermediate goods, -2.9% for energy, -0.2% for durable consumer goods, increased by 0.6% for capital goods and by 0.3% for non-durable consumer goods.
EU PPI fell -0.9% mom, -8.4% yoy. Among Member States for which data are available, the largest monthly decreases in industrial producer prices were recorded in Slovakia (-14.3%), Poland (-3.0%) and Austria (-2.2%). The highest increases were observed in Estonia (+5.3%), Ireland (+4.0%) and Czechia (+2.4%).
Eurozone PMI services finalized at 50.2, two important insights for ECB
Eurozone PMI Services was finalized at 50.2 in February, up from January's 48.7, a 7-month high. PMI Composite was finalized at 49.2, up from January's 47.9, an 8-month high.
Country-specific data revealed varying degrees of economic activity, with Ireland leading the pack with PMI Composite of 54.4, a 12-month high. Spain and Italy followed closely, posting 9-month highs of 53.9 and 51.1, respectively. However, not all news was positive, as France and Germany trailed behind, with Germany recording a 4-month low of 46.3, and France at 9-month low of 48.1.
Cyrus de la Rubia, Chief Economist at Hamburg Commercial Bank, highlighted two critical insights from the PMI survey in the context of the upcoming ECB meeting on March 7.
Firstly, output prices in the service sector continue to "surge at an accelerated rate", driven by "escalating wages", underscores inflationary pressures that are yet to abate.
Secondly, the service sector's "unexpectedly robust pricing power", amidst a slow economic recovery and a forecasted growth rate below 1% for 2024, suggests the risk of "a wage-price spiral and stagflation" scenario, exacerbated by structural labor shortages impacting productivity.
"Those advocating late rate cuts may very well find reinforcement in the PMI findings," de la Rubia noted.
UK PMI services finalized at 53.8, rising inflationary pressures
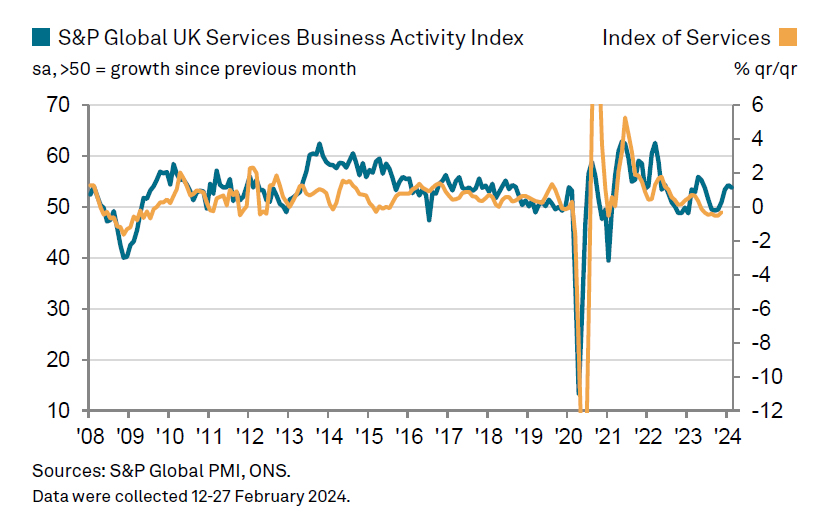
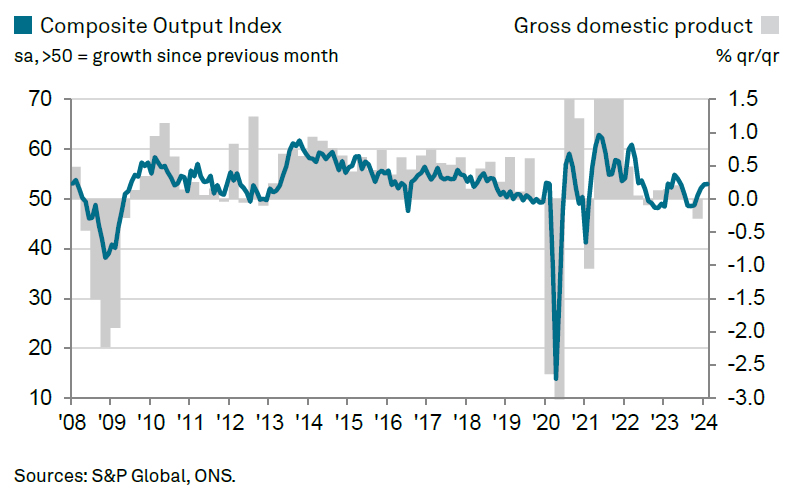
UK PMI Services was finalized at 53.8 in February, down from January's 54.3. PMI Composite was finalized at 53.0, up fractionally from January's 52.9.
Tim Moore, Economics Director at S&P Global Market Intelligence, highlighted the trend as evidence that UK economy may be emerging from the shadows of a technical recession experienced in the latter half of 2023, suggesting a "turning of the corner" towards recovery.
Meanwhile, the service sector faces rising input costs, primarily driven by higher salary payments and increased shipping expenses. This led to the most significant input price inflation since September 2023.
Moreover, the pressure to maintain profit margins has prompted service providers to raise their prices at one of the quickest rates since the previous summer, reflecting the necessity to offset the surging staff costs.
Japan's Tokyo CPI core rises to 2.5% yoy, PMI services finalized at 52.9
Japan's Tokyo CPI core (ex-fresh food) rose from upwardly 1.8% yoy to 2.5% yoy in February, matched expectations. CPI core-core (ex-food and energy) slowed from 3.3% yoy to 3.1% yoy. Headline CPI in the capital city rose from 1.8% yoy to 2.6% yoy.
Also released, PMI Services was finalized at 52.9 in February, down from January's 53.1, but stays in expansion for the 18th month in a row. PMI Composite was finalized at 50.6, down from prior month's 51.5.
According to Usamah Bhatti, Economist at S&P Global Market Intelligence,services business activity growth was sustained into February while the rate of growth in new business accelerated to a six-month high. However, steeper reduction in manufacturing output levels contributed to a slowdown in overall private sector activity growth.
China's Caixin PMI services falls to 52.5, composite unchanged at 52.5
China's Caixin PMI Services fell from 52.7 to 52.5 in February, below expectation of 52.9. PMI Composite was unchanged at 52.5.
Wang Zhe, Senior Economist at Caixin Insight Group, noted that both manufacturing and services sectors recorded steady growth. However, he noted supply was "still running ahead" of improved demand. Employment across both sectors saw contraction. On the pricing front, pressures of low prices becoming more pronounced within the manufacturing sector.
Overall, "market sentiment remained optimistic", Wang noted.
AUD/USD Mid-Day Report
Daily Pivots: (S1) 0.6499; (P) 0.6517; (R1) 0.6528; More...
Intraday bias in AUD/USD is back on the downside with break of 0.6486 temporary low. Retest of 0.6442 support should be seen next. Firm break there will resume whole decline from 0.6870 for 61.8% projection of 0.6870 to 0.6442 from 0.6594 at 0.6329. On the upside, above 0.6534 minor resistance will turn intraday bias neutral again first. But outlook will stay bearish as long as 0.6594 resistance holds, in case of recovery.
In the bigger picture, price actions from 0.6169 (2022 low) are seen as a medium term corrective pattern to the down trend from 0.8006 (2021 high). Fall from 0.7156 (2023 high) is seen as the second leg, which might still be in progress. Overall, sideway trading could continue in range of 0.6169/7156 for some more time. But as long as 0.7156 holds, an eventual downside breakout would be mildly in favor.
Economic Indicators Update
| GMT | Ccy | Events | Actual | Forecast | Previous | Revised |
|---|---|---|---|---|---|---|
| 23:30 | JPY | Tokyo CPI Y/Y Feb | 2.60% | 1.60% | 1.80% | |
| 23:30 | JPY | Tokyo CPI ex Fresh Food Y/Y Feb | 2.50% | 2.50% | 1.60% | 1.80% |
| 23:30 | JPY | Tokyo CPI ex Food & Energy Y/Y Feb | 3.10% | 3.10% | 3.30% | |
| 00:01 | GBP | BRC Like-For-Like Retail Sales Y/Y Feb | 1.00% | 1.40% | ||
| 00:30 | AUD | Current Account Balance (AUD) Q4 | 11.8B | 5.0B | -0.2B | 1.3B |
| 01:45 | CNY | Caixin Services PMI Feb | 52.5 | 52.9 | 52.7 | |
| 07:45 | EUR | France Industrial Output M/M Jan | -1.10% | -0.10% | 1.10% | 0.40% |
| 08:45 | EUR | Italy Services PMI Feb | 52.2 | 52.3 | 51.2 | |
| 08:50 | EUR | France Services PMI Feb F | 48.4 | 48 | 48 | |
| 08:55 | EUR | Germany Services PMI Feb F | 48.3 | 48.2 | 48.2 | |
| 09:00 | EUR | Eurozone Services PMI Feb F | 50.2 | 50 | 50 | |
| 09:30 | GBP | Services PMI Feb F | 53.8 | 54.3 | 54.3 | |
| 10:00 | EUR | Eurozone PPI M/M Jan | -0.90% | -0.10% | -0.80% | -0.90% |
| 10:00 | EUR | Eurozone PPI Y/Y Jan | -8.60% | -8.10% | -10.60% | -10.70% |
| 14:45 | USD | Services PMI Feb F | 51.3 | 51.3 | ||
| 15:00 | USD | ISM Services PMI Feb | 0.30% | 53.4 | ||
| 15:00 | USD | Factory Orders M/M Jan | -2.80% | 0.20% |
Gold: Not Yet Overheated
Gold is primed for a substantial move, second only to cryptocurrencies in amplitude but lacking their enduring strength. At the end of last week, we saw a swift technical completion of a bullish pattern.
Sometimes, gold avoids volatility for weeks, but at certain moments, strong multi-day trends are born, and the movement becomes almost one-sided, as we saw this time.
After breaking through the resistance of the descending channel, gold quickly moved higher, gaining almost 2% on Friday, another 1.5% on Monday and over 0.5% since the start of the day on Tuesday. Current levels at $2126 are around all-time highs. The higher price was off-market at the start of trading on the 1st, with a history-making short squeeze of 3.5%.
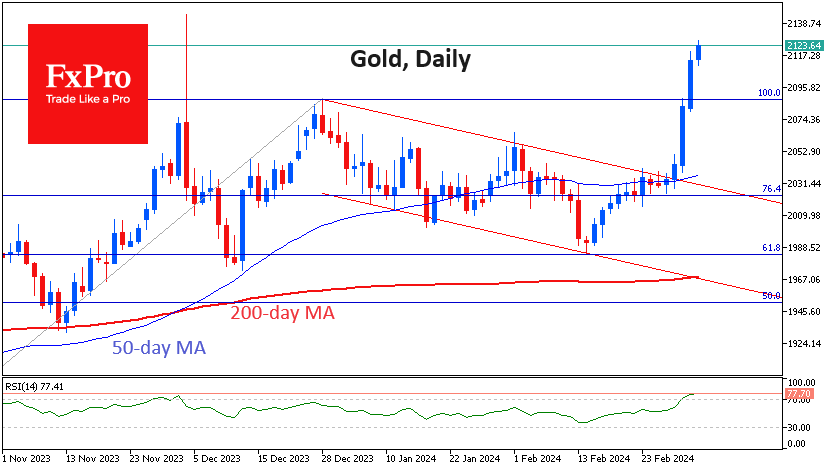
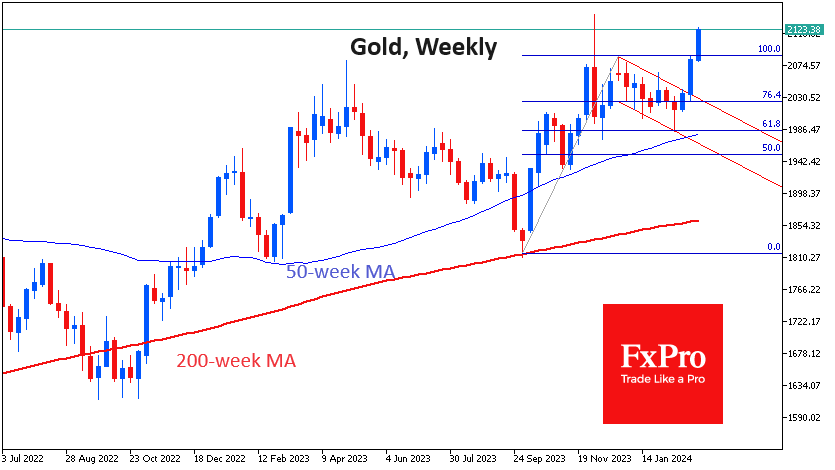
After Monday’s strong rally above $2088, which rewrote the closing highs, the current working scenario for gold is for a rally to the $2255 area, which is the 161.8% level from the initial October-December impulse. The price has made a classic corrective pullback to 61.8% of the initial rally at the start of the year.
One of the warning signs is the overbought RSI. At 77.7, the Relative Strength Index is at its highest level since March 2022, where it remained for the following 14 months.
The RSI reached even higher levels in July-August 2020, and we see more similarities with this particular episode. The overbought RSI then, as it is now, coincided with the entry into the historical high area above $1800. Technically, it wasn’t an all-time high, as it is the case now, but it was a move out of a steadily traded range (then $1800, now $2050), and that is what matters.
Eurozone PPI down -0.9% mom, -8.6% yoy in Jan
Eurozone PPI fell -0.9% mom, -8.6% yoy in January, below expectation of -0.1% mom, -0.8% yoy. For the month, PPI decreased by -0.2% for intermediate goods, -2.9% for energy, -0.2% for durable consumer goods, increased by 0.6% for capital goods and by 0.3% for non-durable consumer goods.
EU PPI fell -0.9% mom, -8.4% yoy. Among Member States for which data are available, the largest monthly decreases in industrial producer prices were recorded in Slovakia (-14.3%), Poland (-3.0%) and Austria (-2.2%). The highest increases were observed in Estonia (+5.3%), Ireland (+4.0%) and Czechia (+2.4%).
UK PMI services finalized at 53.8, rising inflationary pressures
UK PMI Services was finalized at 53.8 in February, down from January's 54.3. PMI Composite was finalized at 53.0, up fractionally from January's 52.9.
Tim Moore, Economics Director at S&P Global Market Intelligence, highlighted the trend as evidence that UK economy may be emerging from the shadows of a technical recession experienced in the latter half of 2023, suggesting a "turning of the corner" towards recovery.
Meanwhile, the service sector faces rising input costs, primarily driven by higher salary payments and increased shipping expenses. This led to the most significant input price inflation since September 2023.
Moreover, the pressure to maintain profit margins has prompted service providers to raise their prices at one of the quickest rates since the previous summer, reflecting the necessity to offset the surging staff costs.