

Sample Category Title
EUR/AUD Daily Outlook
Daily Pivots: (S1) 1.6658; (P) 1.6702; (R1) 1.6735; More...
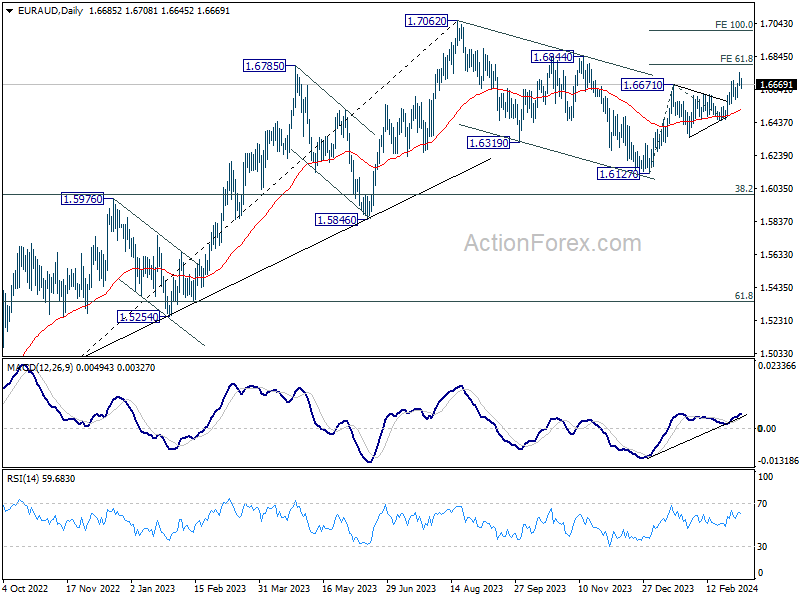
Further rally is still expected in EUR/AUD with 1.6578 support intact, despite current retreat. Rise from 1.6127 should target 61.8% projection of 1.6127 to 1.6671 from 1.6450 at 1.6786. Firm break there will target 100% projection at 1.6994 next. Nevertheless, break of 1.6578 will mix up the near term outlook and bring deeper fall back towards 1.6450 support.
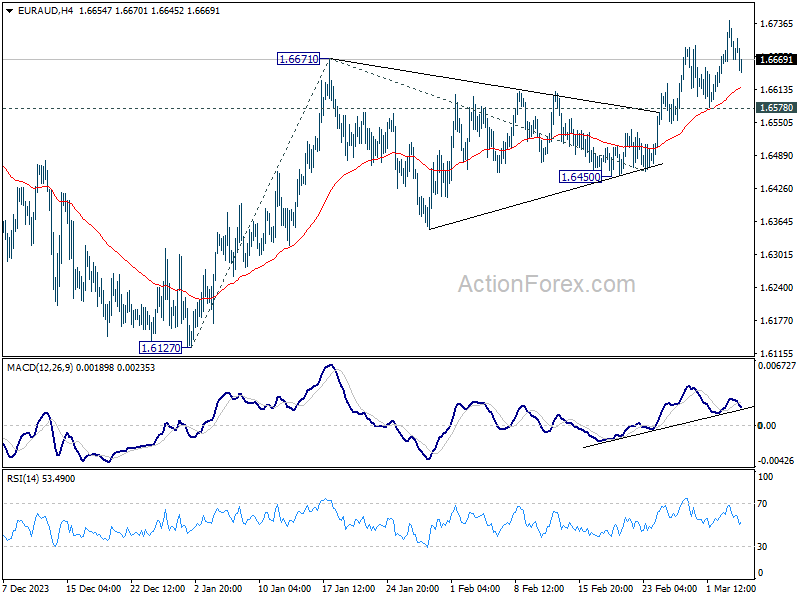
In the bigger picture, fall from 1.7062 medium term top is seen as a correction to the up trend from 1.4281 (2022 low). Break of 1.6844 resistance will argue that this up trend is ready to resume through 1.7062 high. In case of another fall, strong support should be seen around 1.5846 and 38.2% retracement of 1.4281 to 1.7062 at 1.6000 to bring rebound.
EUR/CHF Daily Outlook
Daily Pivots: (S1) 0.9578; (P) 0.9598; (R1) 0.9611; More...
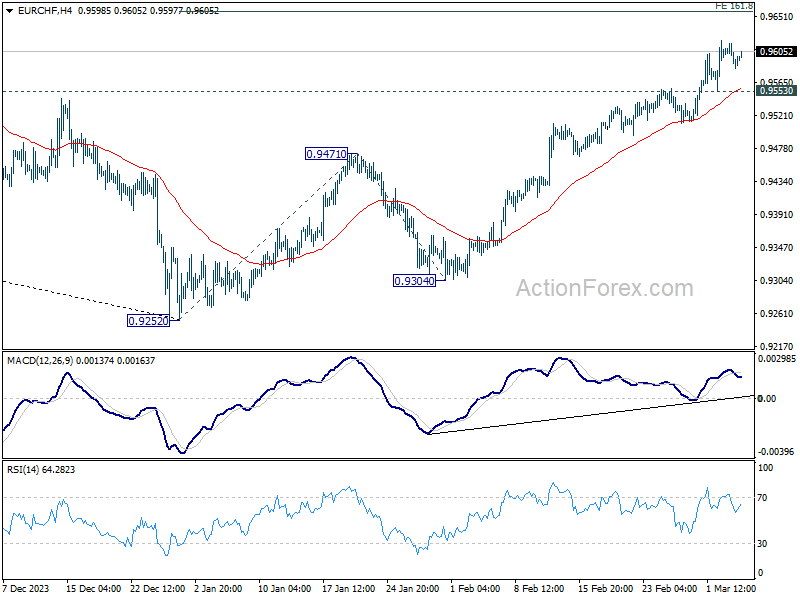
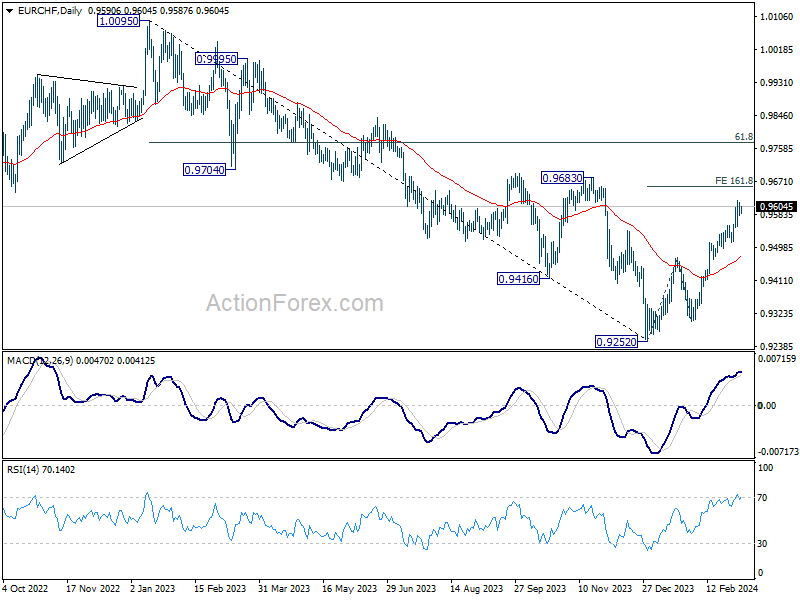
EUR/CHF is losing some upside momentum but intraday bias stays on the upside for now. Current rise from 0.9252 should target 161.8% projection of 0.9252 to 0.9471 from 0.9304 at 0.9658 next. On the downside, below 0.9553 minor support will turn intraday bias neutral and bring consolidations first, before staging another rise.
In the bigger picture, as long as 0.9683 resistance holds, rebound from 0.9252 are seen as a corrective move only. Larger down trend is expected to resume through 0.9252 after the correction completes. However, firm break of 0.9683 and sustained trading above 55 W EMA (now at 0.9622) will argue that 0.9252 is already a medium term bottom. Stronger rise would then be seen 61.8% retracement of 1.0095 to 0.9252 at 0.9773 and above.
EURUSD Holds in Tight Range Within SMAs
- EURUSD remains above downtrend line
- RSI and MACD look weak
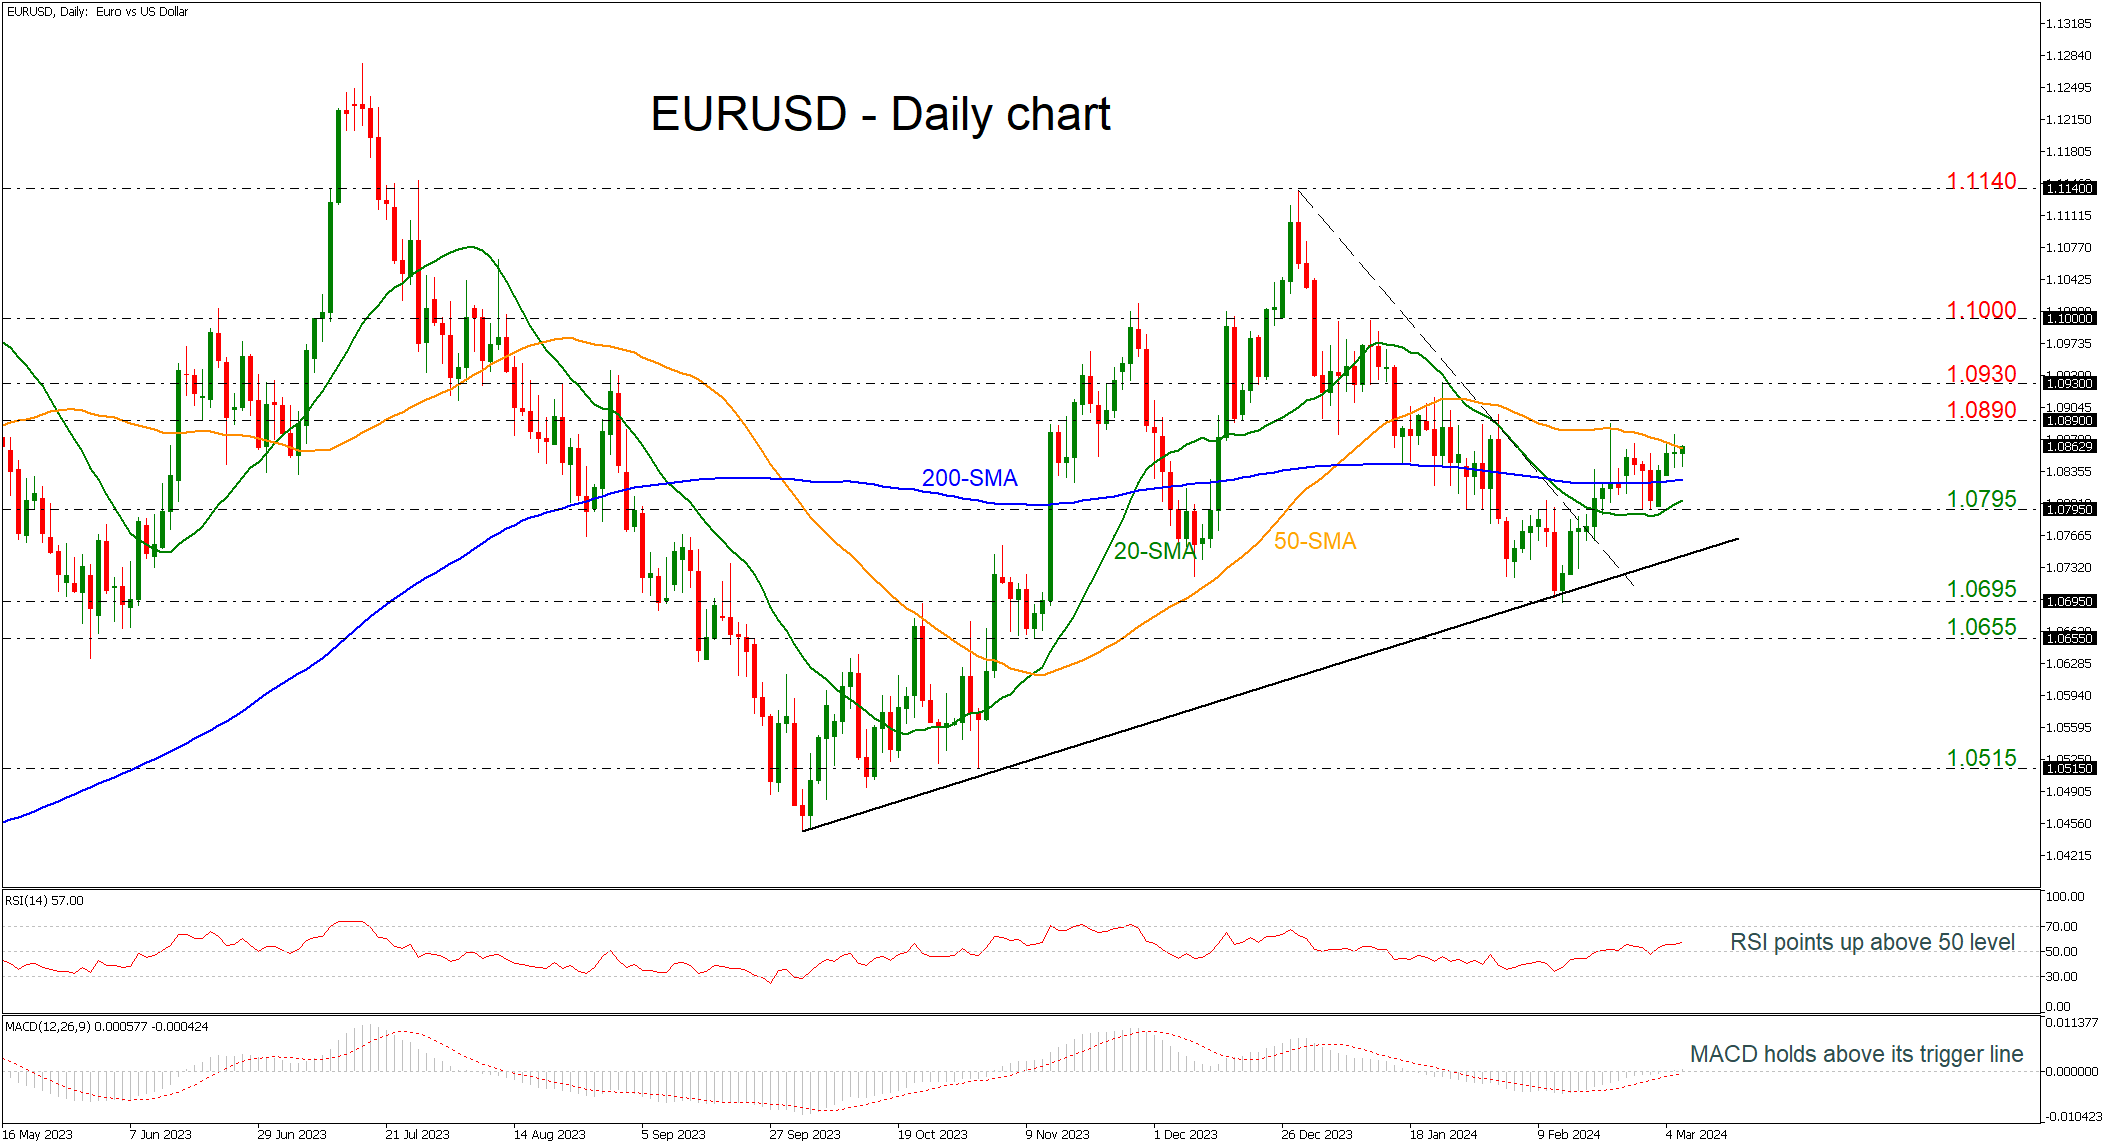
EURUSD has been developing within a narrow range of the 20- and the 50-day simple moving averages (SMAs) of 1.0805 to 1.0860 respectively. The pair is still standing above the short-term downtrend line and the 200-day SMA, confirming the broader bullish outlook.
Technically, the RSI indicator is pointing slightly up above the neutral threshold of 50; however, the MACD oscillator is weakening its momentum above its trigger and zero lines.
If prices overcome the 50-day SMA and the immediate resistance of 1.0890 then it may open the way towards the 1.0930 resistance ahead of the 1.1000 round number, taken from the high on January 24.
On the flip side, it there is a potential decline below the 200-day SMA and the critical level of 1.0795 then the market may dive towards the medium-term supportive trend line at 1.0750. A successful break lower could retest the 1.0695 barricade ahead of 1.0655, switching the outlook to negative.
All in all, EURUSD is looking neutral to bullish in the short-term and bullish in the medium-term timeframes, but a climb above 1.0890 is expected to endorse the positive outlook.
USD/CAD Daily Outlook
Daily Pivots: (S1) 1.3564; (P) 1.3584; (R1) 1.3613; More...
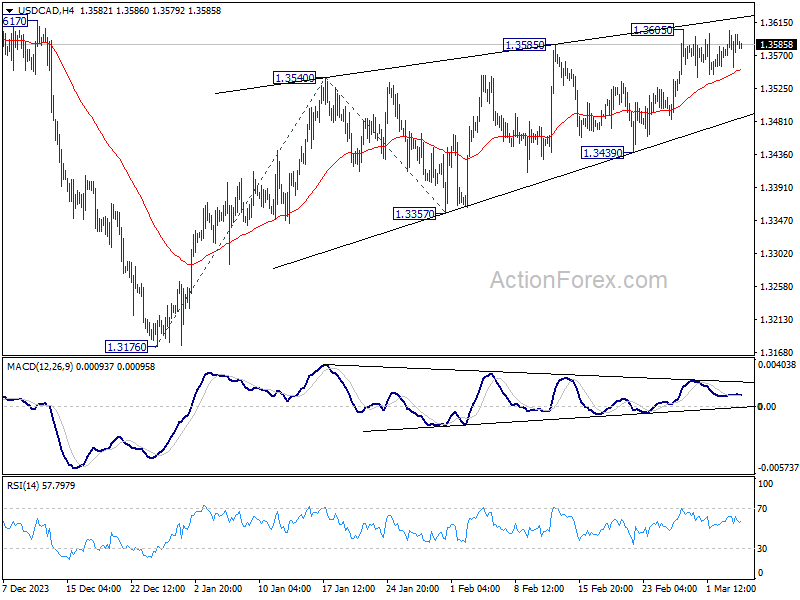
Intraday bias in USD/CAD remains neutral as consolidation continues below 1.3605. Further rally is expected as long as 1.3439 support holds. Break of 1.3605 will resume the rise from 1.3176 and target 100% projection of 1.3176 to 1.3540 from 1.3357 at 1.3721 next.
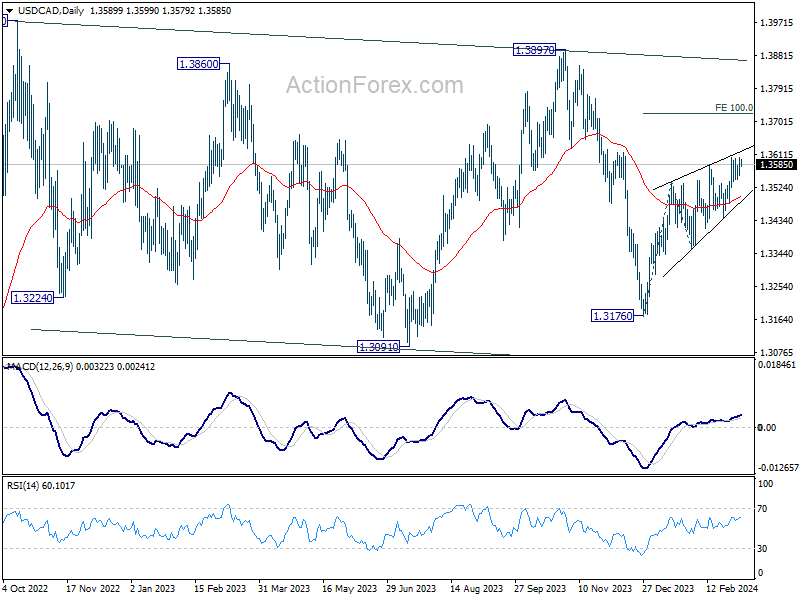
In the bigger picture, price actions from 1.3976 (2022 high) are viewed as a corrective pattern only. In case of another fall, strong support should emerge above 1.2947 resistance turned support to bring rebound. Overall, larger up trend from 1.2005 (2021 low) is still expected to resume through 1.3976 at a later stage.
AUD/USD Daily Report
Daily Pivots: (S1) 0.6481; (P) 0.6501; (R1) 0.6524; More...
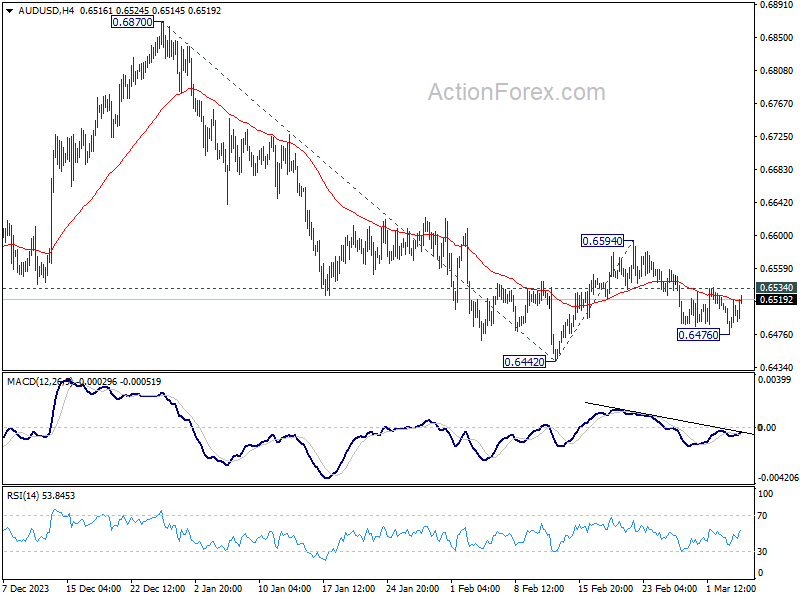
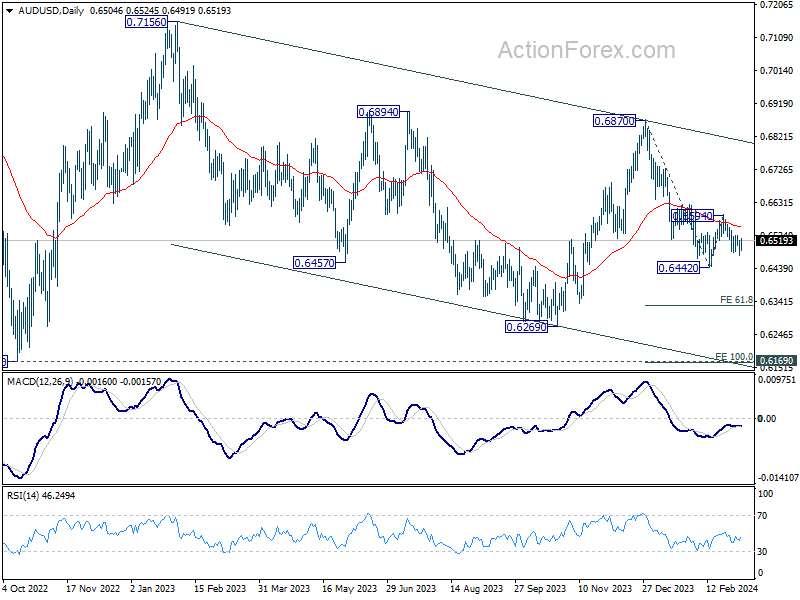
AUD/USD recovered after brief dip to 0.6476 and intraday bias is turned neutral first. Outlook will stay bearish as long as 0.6594 resistance holds. Below 0.6476 will bring retest of 0.6442 low first. Firm break there e will resume whole decline from 0.6870 for 61.8% projection of 0.6870 to 0.6442 from 0.6594 at 0.6329.
In the bigger picture, price actions from 0.6169 (2022 low) are seen as a medium term corrective pattern to the down trend from 0.8006 (2021 high). Fall from 0.7156 (2023 high) is seen as the second leg, which might still be in progress. Overall, sideway trading could continue in range of 0.6169/7156 for some more time. But as long as 0.7156 holds, an eventual downside breakout would be mildly in favor.
USD/JPY Daily Outlook
Daily Pivots: (S1) 149.66; (P) 150.11; (R1) 150.51; More...
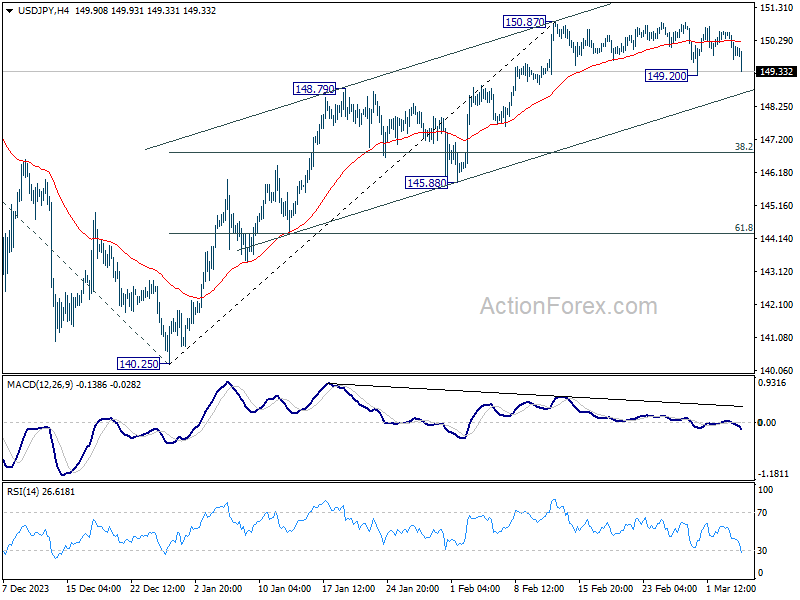
USD/JPY falls notably today but stays above 149.20 supports so far. Intraday bias remains neutral first. On the upside, break of 150.87 will resume the rise from 140.25 to 151.89/93 key resistance zone. On the other hand, considering bearish divergence condition in 4H MACD, firm break of 149.20 will confirm short term topping at 150.87. Deeper fall would be seen to channel support (now at 148.65) and possibly below, even as a corrective move.
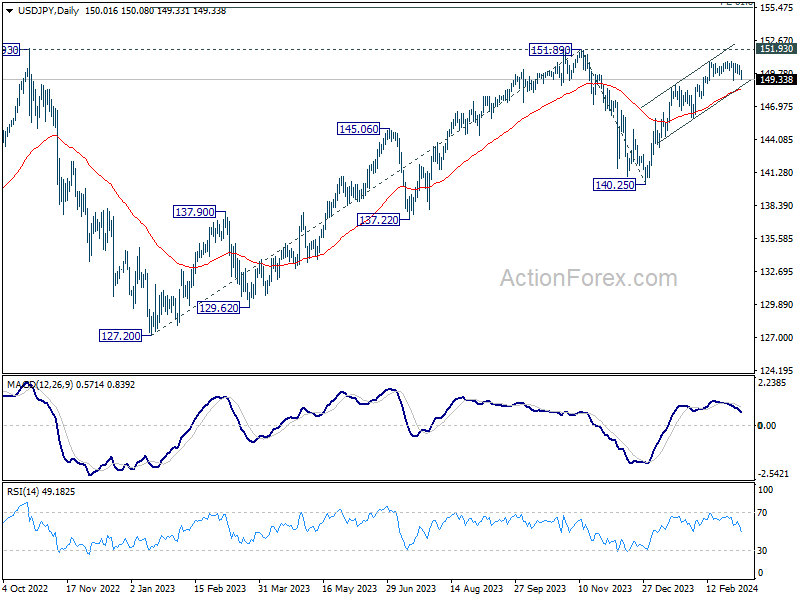
In the bigger picture, rise from 140.25 is seen as resuming the trend from 127.20 (2023 low). Decisive break of 151.89/.93 resistance zone will confirm this bullish case and target 61.8% projection of 127.20 to 151.89 from 140.25 at 155.50. However, break of 148.79 resistance turned support will delay this bullish case, and extend the corrective pattern from 151.89 with another falling leg.
USD/CHF Daily Outlook
Daily Pivots: (S1) 0.8817; (P) 0.8843; (R1) 0.8860; More....
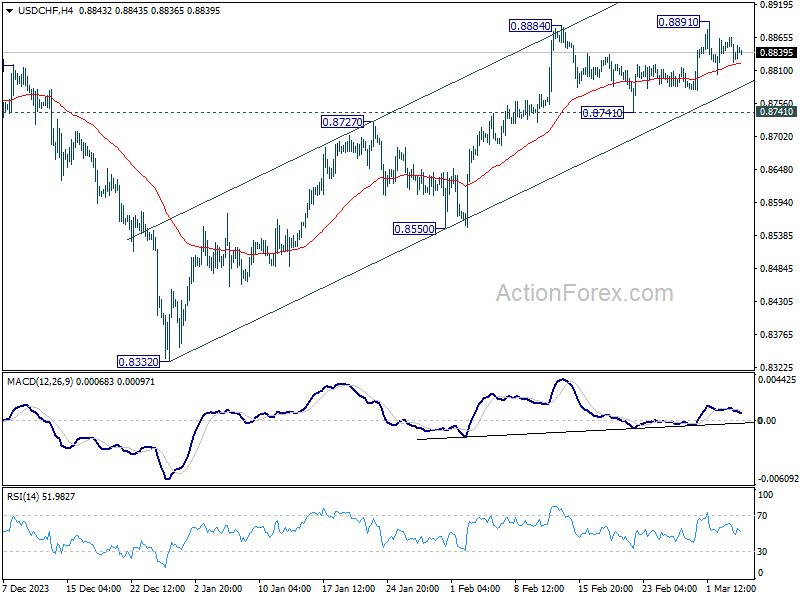
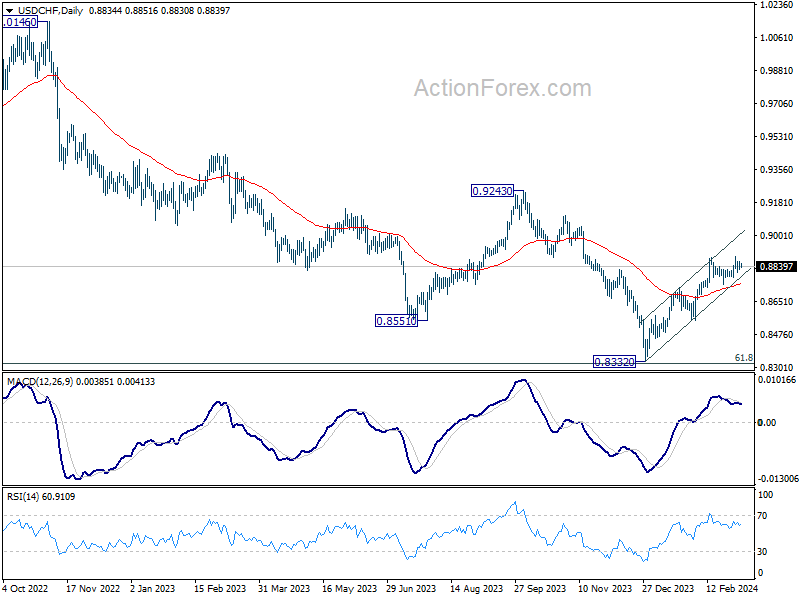
Range trading continues in USD/CHF and intraday bias remains neutral. Further rally is in favor as long as 0.8741 support holds. Break of 0.8891 will resume the whole rebound from 0.8332 towards 0.9243 key resistance. Nevertheless, break of 0.8741 support will turn bias back to the downside for deeper pullback.
In the bigger picture, a medium term bottom should be formed at 0.8332, on bullish convergence condition in W MACD, just ahead of 0.8317 long term fibonacci support. It's still early to decide if the larger down trend from 1.0146 (2022 high) is reversing. But further rise should be seen to 0.9243 resistance even as a correction.
EUR/USD Daily Outlook
Daily Pivots: (S1) 1.0840; (P) 1.0858; (R1) 1.0875; More...
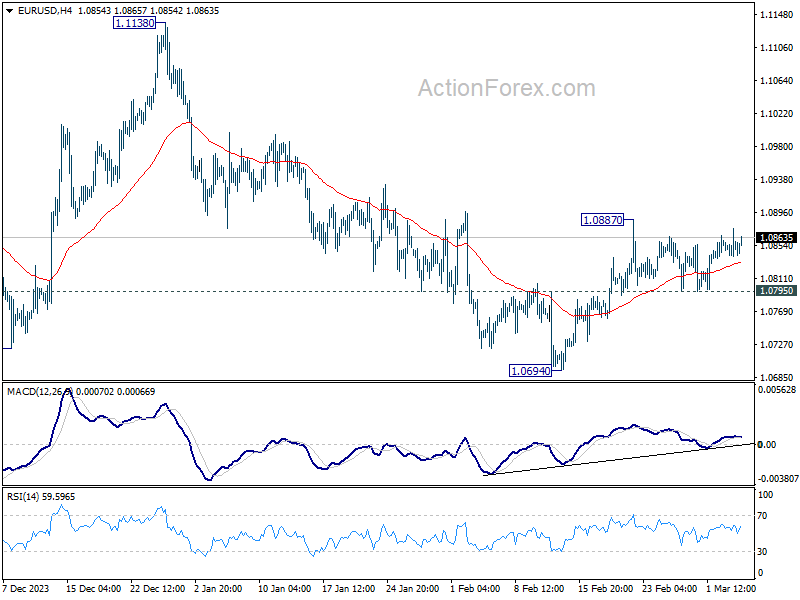
Intraday bias in EUR/USD stays neutral first as it's still bounded in range below 1.0887. On the upside, break of 1.0887 and sustained trading above 55 D EMA (now at 1.0831) will affirm the case that fall from 1.1138 has completed. Stronger rally would then be seen back to 1.1138. However, break of 1.0795 minor support will turn bias back to the downside for retesting 1.0694 support.
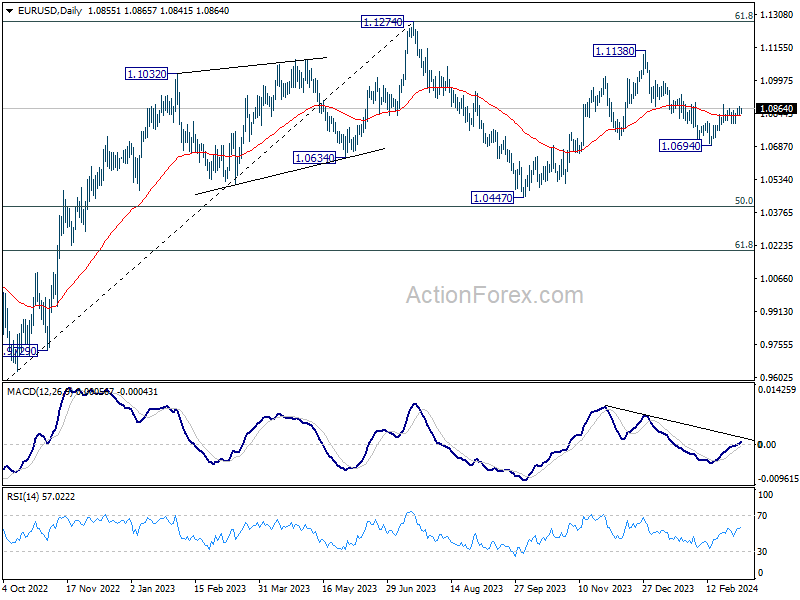
In the bigger picture, price actions from 1.1274 are viewed as a corrective pattern to rise from 0.9534 (2022 low). Rise from 1.0447 is seen as the second leg. While further rally could cannot be ruled out, upside should be limited by 1.1274 to bring the third leg of the pattern. Meanwhile, sustained break of 1.0694 support will argue that the third leg has already started for 1.0447 and possibly below.
Fed Chair Has Every Reason to Hold the Line
Markets
In the run-up to the release of the US services ISM, (US) equity futures/markets yesterday fell prey to a tentative risk-off correction. In particular some parts of the tech sector apparently felt some vertigo after recent record race in the likes of the S&P and the Nasdaq. Safe haven flows supported Treasuries. A soft (but not outright weak) US services ISM pointed in the same direction. The headline index eased slightly more than expected (from 53.3 to 52.6). Employment also unexpectedly eased below the 50 mark (48.0 from 50.5). However, business activity (57.2) and orders remained strong. Price paid eased to 58.6, but clearly suggest ongoing price rises. Yields briefly spiked further south upon the release, but stabilization kicked in soon. At the end of the day, US yields eased between 4.4 bps (2-y) and 6.1 bps (30-y). The outperformance of the long end suggests that the risk-off was at least as much of a driver as the softer ISM. Also interesting the US 10-y real yield extended its correction below 2.0% (1.82%), but for now this doesn’t help risk assets (cf infra). German Bunds even outperformed Treasuries, declining between 5.2 bps (2-y) and 8.0 bps (30-y) even as losses on European equity markets were much more contained compared to the US (Eurostoxx 50 -0.4%). The dollar also briefly spike lower upon the ISM release, but in the end daily changes were limited (DXY 103.8; EUR/USD 1.0857). The yen slightly outperformed with USD/JPY closing at 150.05.
Asian equity markets this morning mostly ignore the correction on WS yesterday as investors look out for more concrete measures from Chinese authorities to reach the ambitiously set 5.0% target. US yields gain marginally after yesterday’s setback. Later today, the US ADP labour market report and the JOLTS job openings might give some insight in strength of the labour market ahead of Friday’s payrolls. However, the market focus will be on Fed Chair Powell’s testimony before the House Financial Services Committee. Given recent data, we assume the Fed Chair has every reason to hold the line that the Fed is in no rush to cut interest rates until it has additional evidence that (underlying) inflation is cooling further, that growth eases enough to bring supply and demand in balance and that the labour market cools to a degree that guarantees wage growth in line with productivity. Such a message should help to put a bottom for yields, even in case of slightly milder than expected activity data. In the UK, markets are keen to see how much stimulus (tax cuts) Fin Min Hunt’s spring budget will provide in the run-up to the upcoming elections. Will it be strong enough for the BoE to take a more cautious stance on policy easing and be able to unlock the stalemate in sterling?
News & Views
The Reserve Bank of New Zealand’s chief economist Conway said the policy rate could be cut sooner than expected if the Federal Reserve begins to ease later this year. The kiwi central bank last week projected no change in the 5.5% rate until 2025, but these forecasts assume a constant NZD exchange rate. If the Fed starts easing (probably around the middle of the year), this would cause the NZD to appreciate and bring down inflationary pressures – all else equal. Conway says this “wiggle room” is limited though. The chief economist is encouraged by the declines in core inflation and business inflation expectations but highlighted the still-high levels of price pressures anticipated by households remain a risk. CPI in Q4 last year eased to 4.7% compared to the RBNZ’s 1-3% target range. The kiwi dollar’s drop on Conway’s comments was temporary. NZD/USD is currently trading a tad higher just south of 0.61.
Australian Q4 GDP growth printed bang in line with expectations. Quarterly dynamics came in at 0.2%. Growth slowed down over every quarter in 2023. Compared to the same period a year ago, GDP is 1.5% bigger. The Australian Bureau of Statistic’s head pointed at government spending (0.6% q/q) and private business investment (0.7%, supported by non-dwelling construction) as the main drivers. Net exports contributed 0.6% mainly on the account of faltering imports (-3.4% q/q). Household spending was subdued, rising a meagre 0.1% in the December quarter. All categories showed net increases but the ABS noted a shift as spending in discretionary areas was wound back while households upped their spending on essential items like electricity, rents and food. The Australian dollar rises this morning in lockstep with its NZD neighbour. Though that’s mostly a general USD move rather than AUD strength. AUD/USD trades around 0.652.
NZD/JPY Technical: Failure Bullish Breakout Indicates Potential Softness (JPY Strength) Ahead
- 3 key risk events that may significantly influence the movement of NZD/JPY; Japan’s FY 2024/2025 annual wage negotiations preliminary results (15 March), BoJ’s monetary policy outcome (19 March) & Fed FOMC and release of its latest dot plot (20 March).
- Technical analysis has indicated a potential medium-term bearish momentum on sight for NZD/JPY.
- Watch the key short-term resistance of 92.00 for NZD/JPY.
The NZD/JPY cross pair has drifted lower after our prior analysis and hit the first intermediate support level of 89.40 (printed an intraday low of 89.26 on 1 February) before it reversed up to print a 52-week high of 93.45 on 23 February.
Right now, technical elements on both medium and short-term horizons are still flashing bearish biases to advocate for another round of further potential weakness in NZD/JPY.
3 key event risks ahead (Japan’s annual wage negotiations results, BoJ & FOMC)
The next key risk events to watch out for that may influence this JPY cross-pair significantly will be the outcome of the Bank of Japan’s (BoJ) monetary policy decision on 19 March, and on 15 March, Rengo, Japan’s biggest labour union federation releases the first results of the FY 2024/2025 annual wage negotiations where the expectations have been set for an average annual increase of 3.85% (slightly above last year’s 3.58%) for Japanese employees, the highest wage increase in 31 years if it materializes.
BoJ Governor Ueda has highlighted numerous times in public that BoJ will focus on the outcome of the wage negotiations which has an impact on sustainable demand-pull inflationary trends in Japan and, in turn, plays a significant part in setting up the decision to end short-term negative interest rates policy in April where most of the consensus has pencilled in.
Next up on the calendar will be the US Federal Reserve FOMC monetary policy outcome, and the release of its latest “dot plot” on 20 March (market participants are likely to pay attention to the new projected US inflationary trends, and Fed funds rate forecasts).
Failure bullish breakout on NZD/JPY
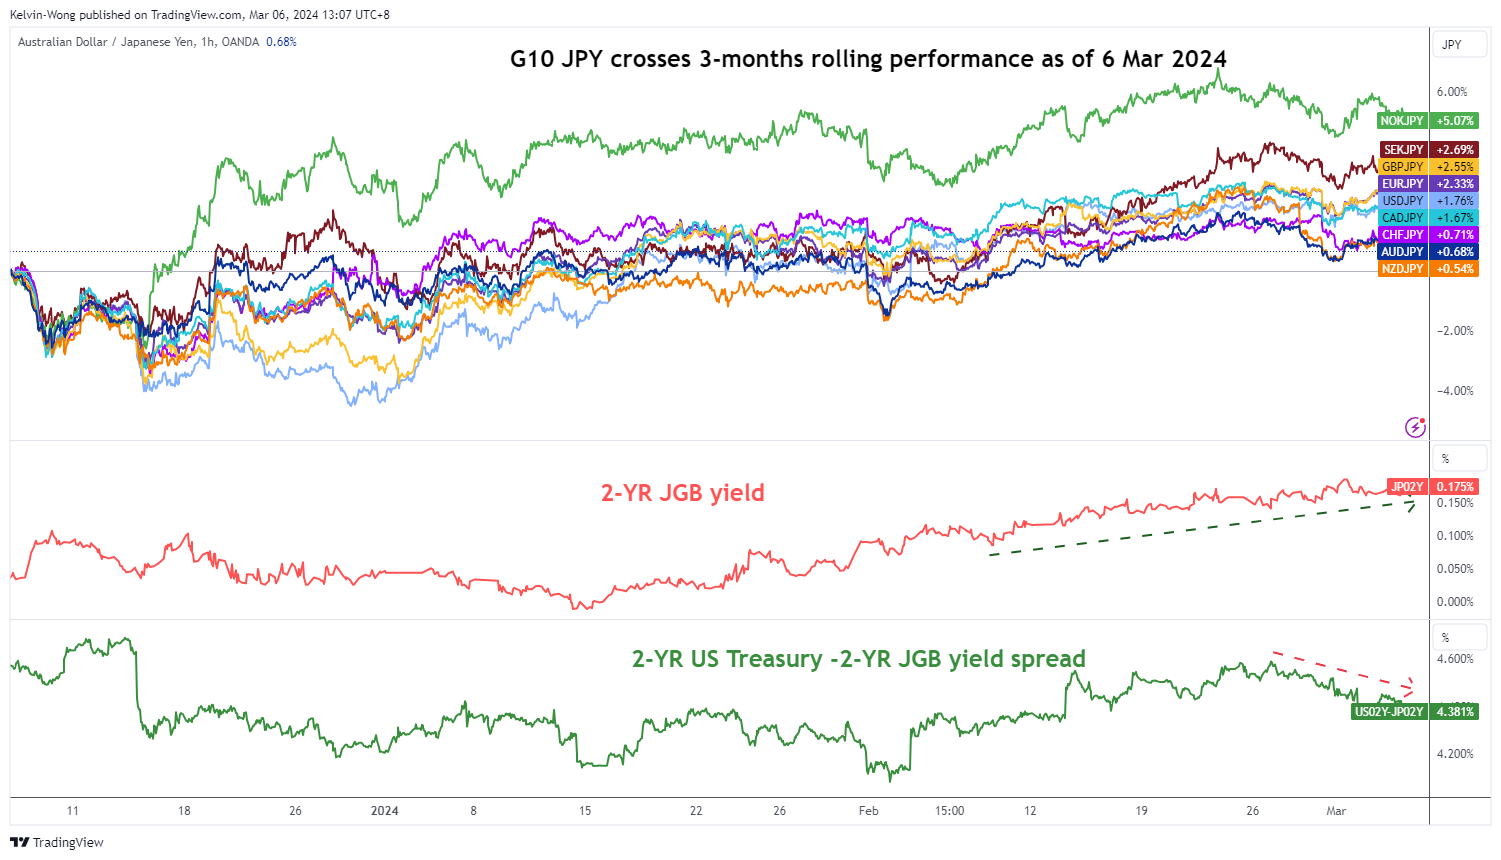
Fig 1: 3-month rolling performances of G-10 JPY crosses as of 6 Mar 2024 (Source: TradingView, click to enlarge chart)
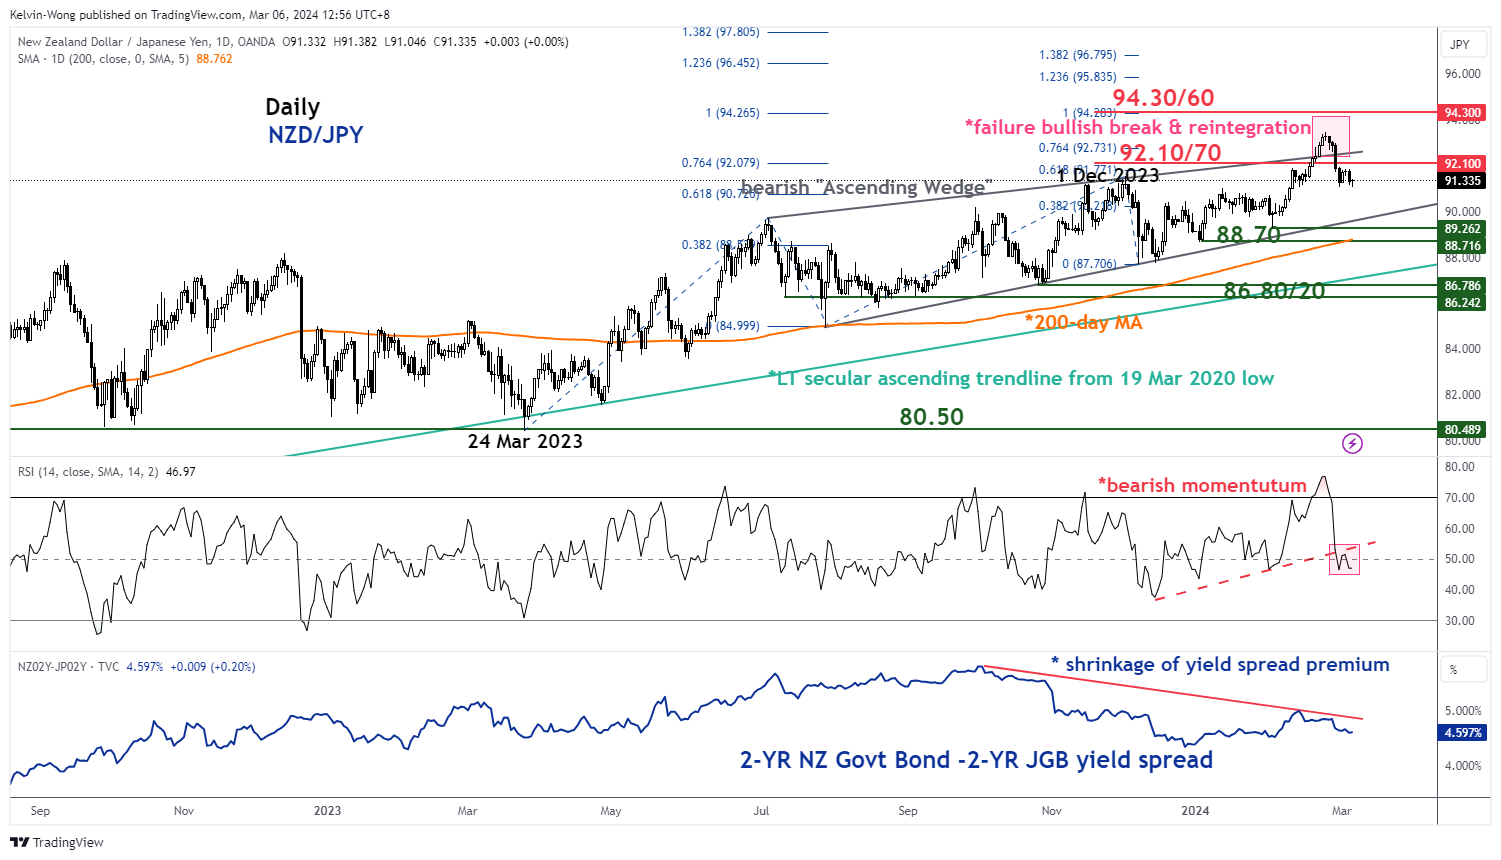
Fig 2: NZD/JPY medium-term trend as of 6 Mar 2024 (Source: TradingView, click to enlarge chart)
The NZD/JPY staged a failed bullish breakout between 20 to 23 February as its price actions did not again further upside traction and reintegrated back below the upper boundary/resistance of the medium-term bearish “Ascending Wedge” configuration on 28 February.
In addition, the daily RSI momentum indicator has staged a bearish breakdown below its parallel ascending support at around the 50 level on 29 February and remained below it so far which suggests a potential revival of medium-term bearish momentum.
Also, from a relative fixed income yield spread perspective, the yield premium between the 2-year New Zealand Government Bond over the 2-year Japanese Government Bond (JGB) has continued to shrink from 4.99% on 13 February to 4.60% currently on 6 March at this time of the writing (see Fig 2).
These observations suggest that the “attractiveness” to hold New Zealand bonds over Japanese bonds has been reduced which also may put downside pressure on the NZD/JPY cross-pair.
Watch the 92.00 key short-term resistance on NZD/JPY
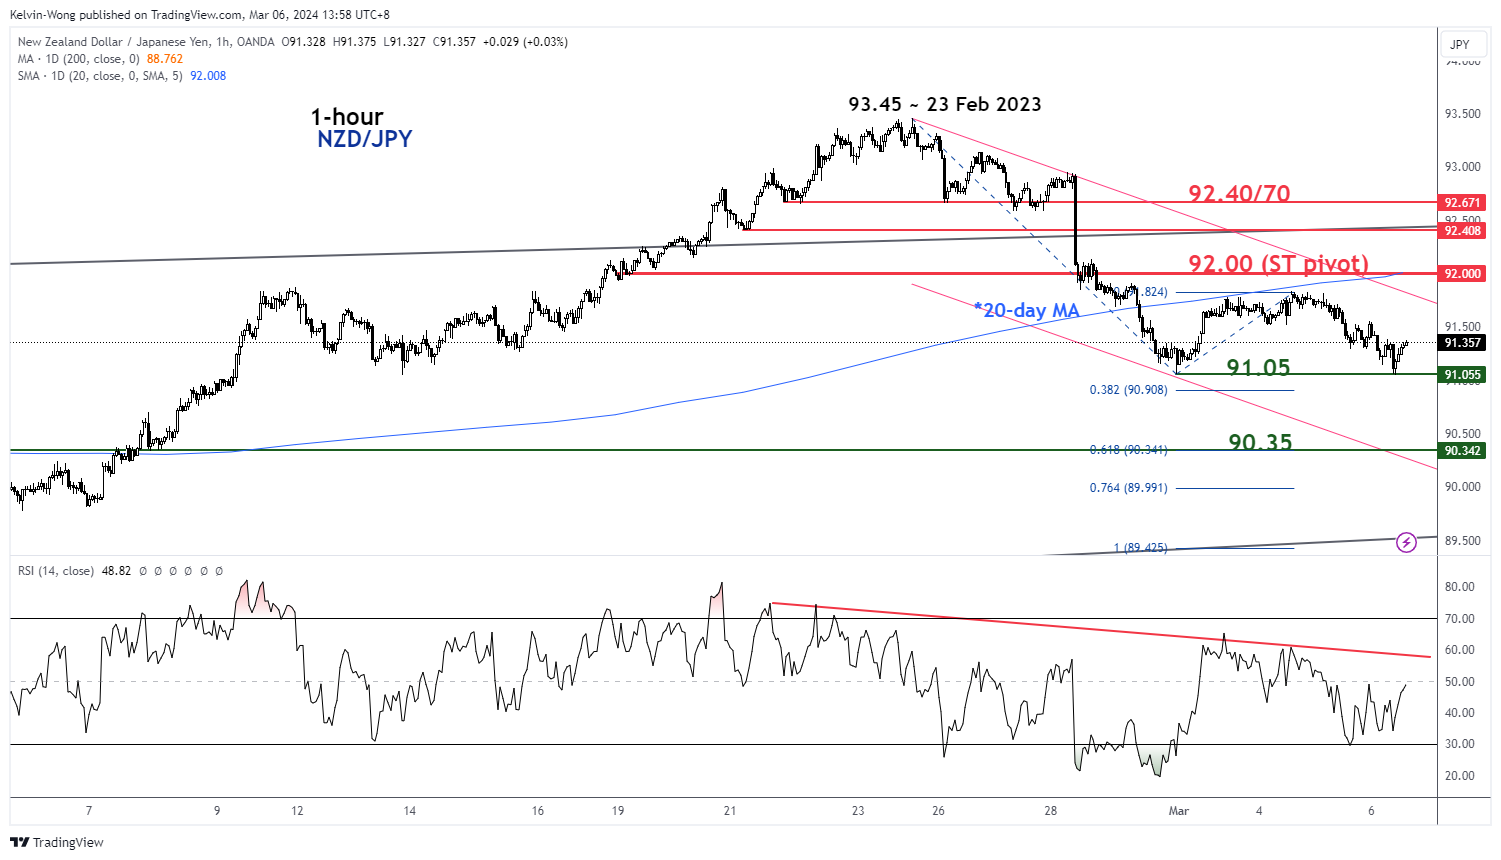
Fig 3: NZD/JPY short-term trend as of 6 Mar 2024 (Source: TradingView, click to enlarge chart)
The current price actions of NZD/JPY have evolved into a minor descending channel in place since the 23 February high of 93.45 (see Fig 3).
If the 92.00 key short-term pivotal resistance (also the 20-day moving average) is not surpassed to the upside, and a break below 91.05 may see further weakness to expose the next intermediate support at 90.35 in the first step (0.618 Fibonacci extension from 23 February 2024 high & lower boundary of the minor descending channel).
On the other hand, a clearance above 92.00 negates the bearish tone for a squeeze up to see the key medium-term resistance zone coming in at 92.40/70 (also the upper boundary of the “Ascending Wedge”).