Sample Category Title
Canadian Dollar Flat Ahead of BOC Meeting
The Canadian dollar is trading quietly on Wednesday. In the North American session, USD/CAD is trading at 1.3580, down 0.08%
On the economic calendar, the Bank of Canada holds its rate meeting. The US will release JOLTS Job Openings, which is expected to tick lower to 8.9 million in February, compared to 9.02 million a month earlier.
Bank of Canada likely to stand pat again
There isn’t much excitement ahead of today’s rate announcement from the Bank of Canada. The BOC is widely expected to hold the current cash at 5% for a fifth straight time.
BOC policy makers face a significant challenge as they chart a rate path. Canada’s economy is relatively weak, but fears of a recession have largely receded, in no small measure due to the US economy’s surprisingly strong performance. Inflation slowed to 2.9% in January, mostly due to a sharp drop in gasoline prices. This is still well above the BOC’s inflation target of 2%.
The markets are looking for a rate cut in the summer but the BOC has good reason to remain cautious before it starts to lower rates. Wage growth remains high and core inflation, which is a better indicator of inflation trends than the headline rate, is above 3%. The central bank doesn’t want to add to the misery of home owners and raise rates, but a rate cut is premature with inflation still high. This means that the BOC will likely stay on the sidelines today and wait for key economic releases before deciding on its next move.
In the US, Federal Reserve Chair Jerome Powell testifies before the Senate Banking Committee later today. Powell is expected to reiterate that inflation is moving lower but needs to come down further before the Fed will feel comfortable in lowering rates.
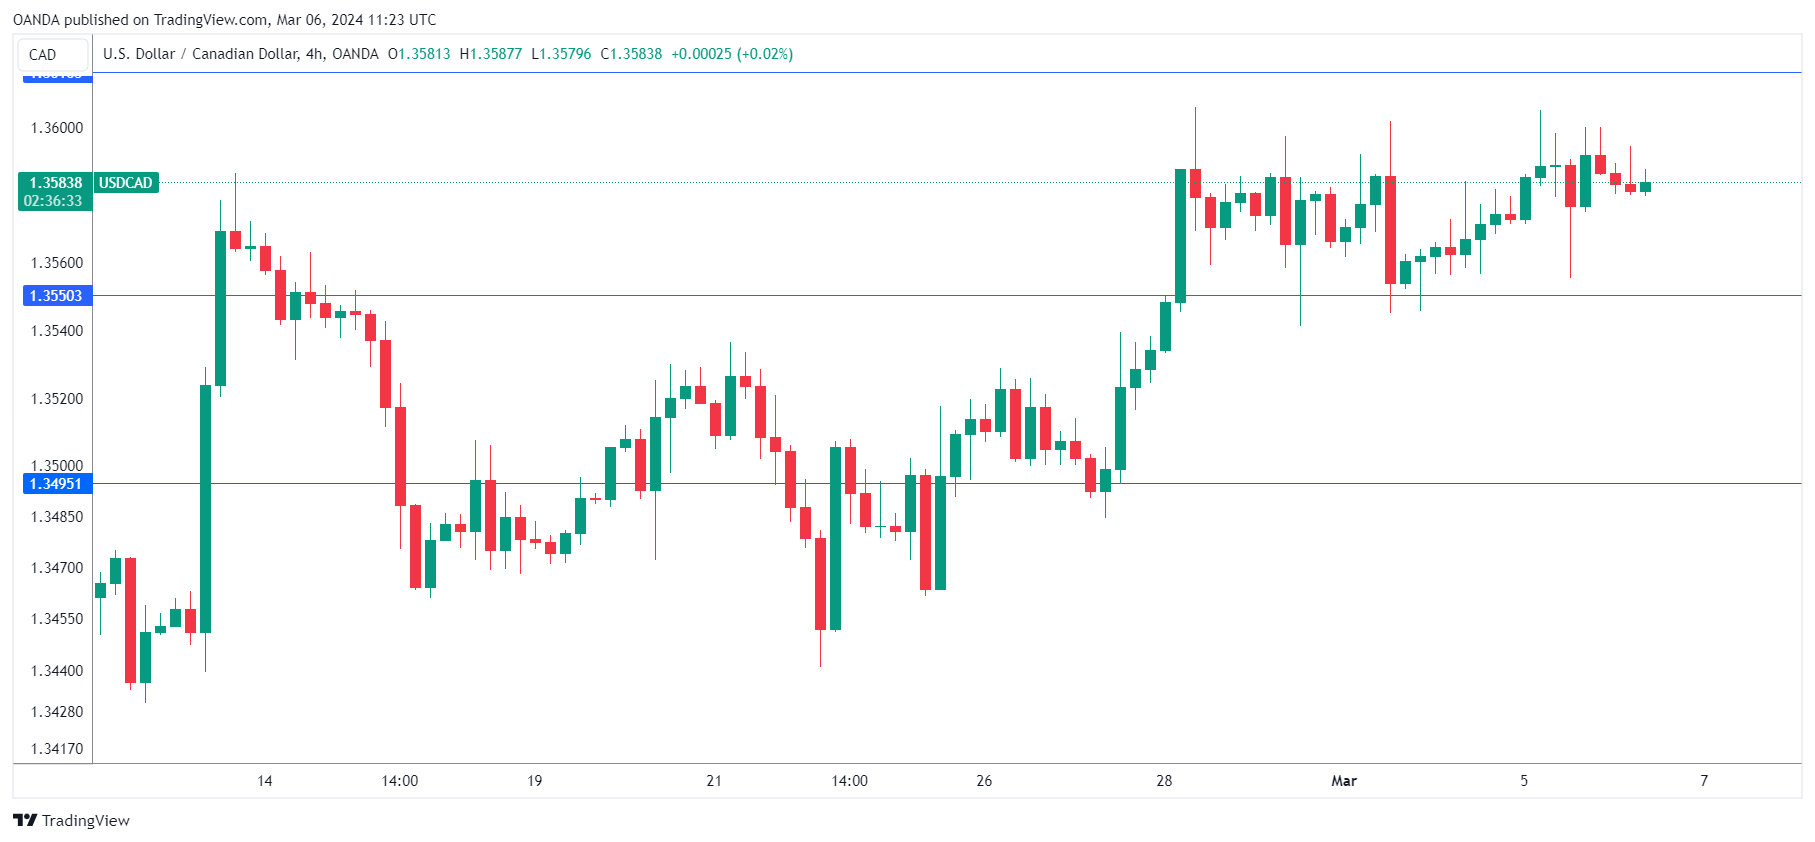
USD/CAD Technical
- USD/CAD remains range-bound. There is resistance at 1.3616 and 1.3671
- 1.3550 and 1.3495 are providing support
Gold Near All-Time High; What’s Next?
- Gold’s impressive appreciation stabilizes near record high
- The bulls might take a break, but stay in play above 2,100
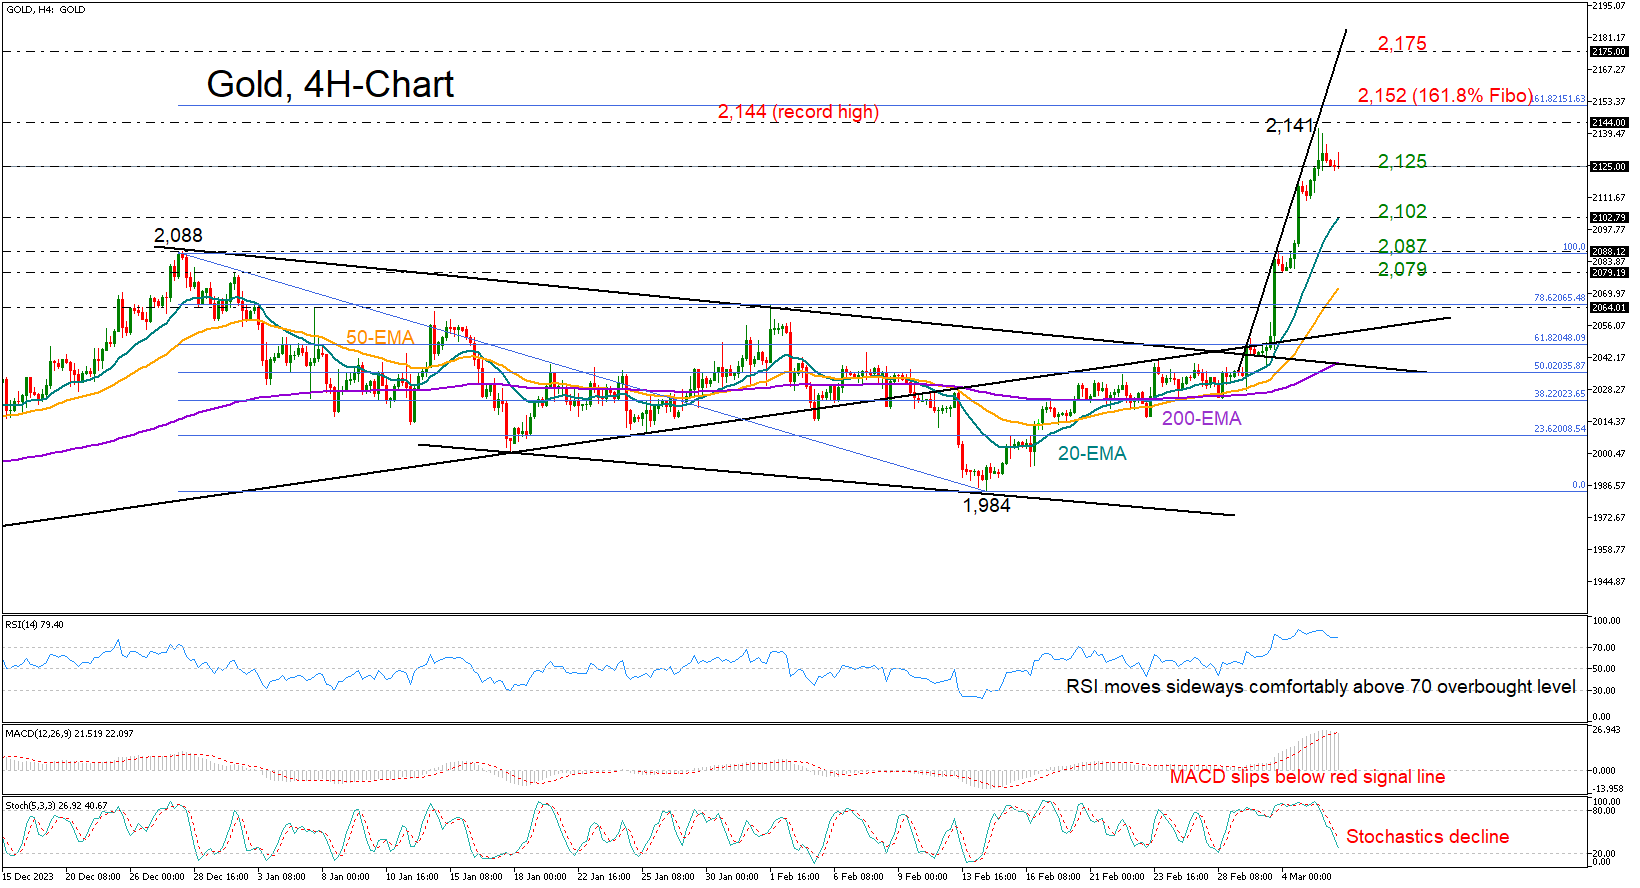
Gold bulls staged a comeback with a bang, driving the price vertically as high as 2,141 on Tuesday. This is marginally below December’s record high of 2,144 and could induce some consolidation ahead of Powell’s testimony before Congress and Friday’s US jobs data.
In the meantime, the precious metal is looking for another upturn in the four-hour chart after posting a small doji candlestick around 2,125. The technical indicators are not promising at the moment, as the MACD seems to have entered a new negative phase and the stochastic oscillator continues to trend to the downside. Moreover, the RSI keeps moving sideways within the overbought zone, suggesting that the latest bullish action might soon run out of steam.
If the bulls stay in play, the price might attempt to breach the 2,144 ceiling with scope to reach the 161.8% Fibonacci extension of the previous downtrend at 2,152. The 2,175 region might be the next target as the resistance line, which connects the March highs, is positioned around the same territory. A break higher could see a test near the 2,200 psychological mark.
In the event the price flips backwards and beneath 2,125, the price might initially stabilize somewhere between yesterday’s support zone of 2,110 and the key 20-period exponential moving average (EMA) at 2,102. Even lower, the decline might pause around December’s resistance of 2,087 and then near the key constraining area of 2,079.
All in all, gold’s rocket rally might shift into a consolidation phase near the 2023 all-time high in the coming sessions. The two candlesticks, which followed yesterday's peak and have the same body size could be interpreted as a sign of indecisiveness. Nevertheless, the big picture remains positive and as long as the price keeps trading above the 2,100 level and the 20-period EMA, more bullish actions could develop.
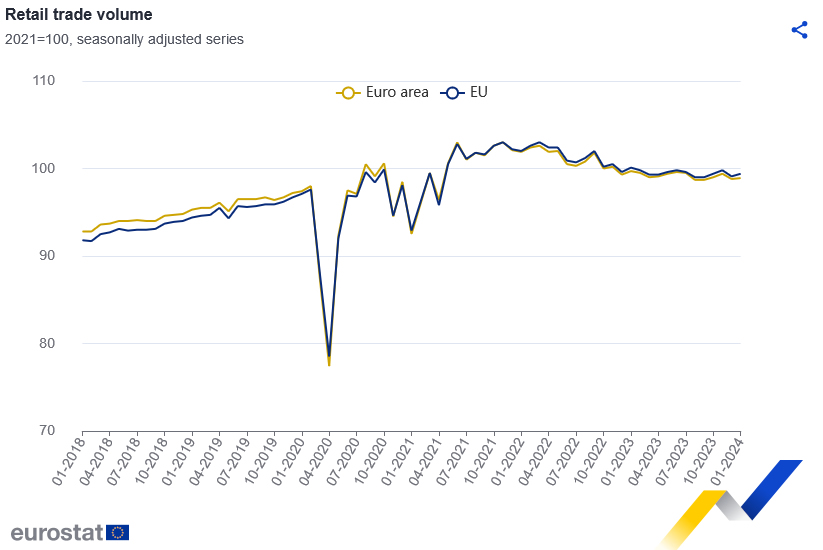
Eurozone retail sales rises 0.1% mom in Jan, EU up 0.3% mom
Eurozone retail sales volume rose 0.1% mom in January, matched expectations. The volume of retail trade increased for food, drinks, tobacco by 1.0%, decreased for non-food products (except automotive fuel) by -0.2%, increased for automotive fuel in specialised stores by 1.7%.
EU retail sales rose 0.3% mom. Among Member States for which data are available, the highest monthly increases in the total retail trade volume were recorded in Luxembourg (+7.6%), Romania (+3.8%) and Cyprus (+1.5%). The largest decreases were observed in Estonia (-2.6%), Slovakia (-1.0%) and Latvia (-0.8%).
Dollar Index in Limited Range Ahead of Key Economic Events
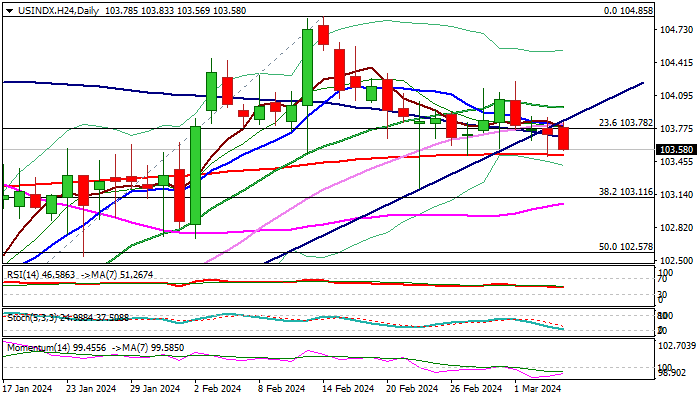
The dollar index holds in red but within a narrow range in early Wednesday, as traders reduce speed ahead of today’s key events, US labor data and the speech of Fed Chair Powell.
Weaker than expected US services PMI in February, released on Tuesday, added to negative sentiment, though dips were again contained by 200DMA (103.52) which keeps the downside protected for the third straight week.
Conflicting daily studies (momentum is negative, MA’s in mixed setup) lack clearer direction signal, suggesting that fundamentals will be key market drivers today.
Fed Chair Powell, in his testimony before Congress, is expected to reiterate the stance that the central bank will wait for more data before making decision to start easing monetary policy, as core inflation remains elevated, though this is unlikely to impact wide expectations for the first rate cut in June (current bets stand at 60%).
Releases of US Feb ADP private sector payrolls (149K f/c vs 107K Jan) and US JOLTS job openings report for January (8.8M f/c vs 9.02M in Dec) will provide more details about the condition in the US labor sector and contribute to Fed’s rate outlook.
Expect initial bearish signal on firm break of 200DMA, which would look for confirmation on extension and close below pivots at 103.11/05 (Fibo 38.2% of 100.29/104.85 rally/55DMA).
Conversely, bounce and close above 103.80 zone (broken bull-trendline/10DMA) would ease downside pressure, with lift and close above 104.00/20 zone (20DMA / Mar 1 lower top) to bring bulls back to play.
Res: 103.80; 104.02; 104.22; 104.56.
Sup: 103.52; 103.19; 103.05; 102.73.
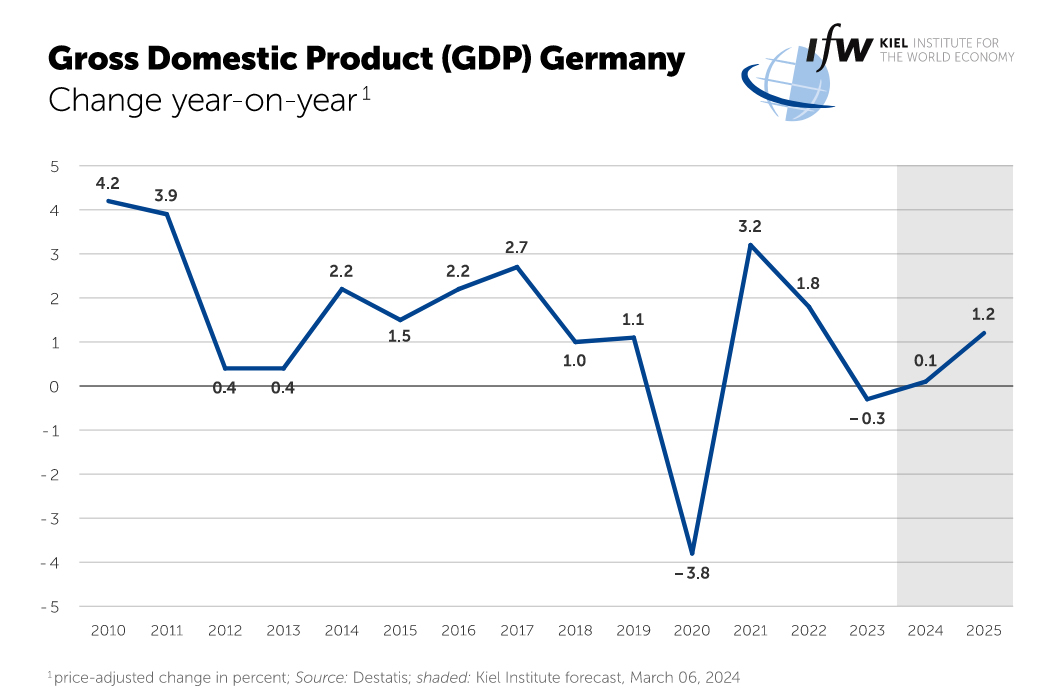
IfW slashes 2024 German growth forecast to 0.1% due to multiple challenges
Kiel Institute for the World Economy significantly downgraded its growth expectations for German economy, projecting a mere 0.1% increase in 2024, a sharp downward revision from its previous forecast of 0.9%. Slight improvement is anticipated in 2025, with growth expected to accelerate to 1.2%. On the inflation front, decline to 2.3% is projected for this year, down from 5.9% in 2023, with further reduction anticipated to 1.7% in 2025. Unemployment rate is expected to marginally decrease from 5.8% in 2024 to 5.6% in 2025.
Moritz Schularick, President of the Kiel Institute, pointed to a "whole range of factors" currently dampening sentiment and economic performance in Germany. These include global economic slowdown impacting exports, ECB's restrictive monetary policy expected to extend into the next year, and German government's austerity measures, which Schularick believes are being implemented at an inopportune time, fostering additional pessimism.
Stefan Kooths, Head of Economic Research at the Kiel Institute, added that despite gradual recovery expected over the year, the overall economic dynamism in Germany remains subdued. He underscored the emergence of signs indicating that structural issues are mainly to blame for the economic slowdown, with private investment falling short, partly due to the significant uncertainty provoked by current economic policies.
Market Analysis: EUR/USD Eyes More Gains, USD/CHF Could Rally
EUR/USD started a fresh increase above the 1.0828 resistance. USD/CHF declined and now struggling below the 0.8860 resistance.
Important Takeaways for EUR/USD and USD/CHF Analysis Today
- The Euro rallied after it broke the 1.0828 resistance against the US Dollar.
- There is a connecting bullish trend line forming with support near 1.0845 on the hourly chart of EUR/USD at FXOpen.
- USD/CHF declined below the 0.8860 and 0.8850 support levels.
- There is a key contracting triangle forming with resistance near 0.8850 on the hourly chart at FXOpen.
EUR/USD Technical Analysis
On the hourly chart of EUR/USD at FXOpen, the pair started a fresh increase from the 1.0800 zone. The Euro cleared the 1.0828 resistance to move into a bullish zone against the US Dollar, as mentioned in the previous analysis.
The bulls pushed the pair above the 50-hour simple moving average and 1.0855. Finally, the pair tested the 1.0875 resistance. A high was formed near 1.0876 and the pair is now consolidating gains. There was a move below the 23.6% Fib retracement level of the upward wave from the 1.0798 swing low to the 1.0876 high.
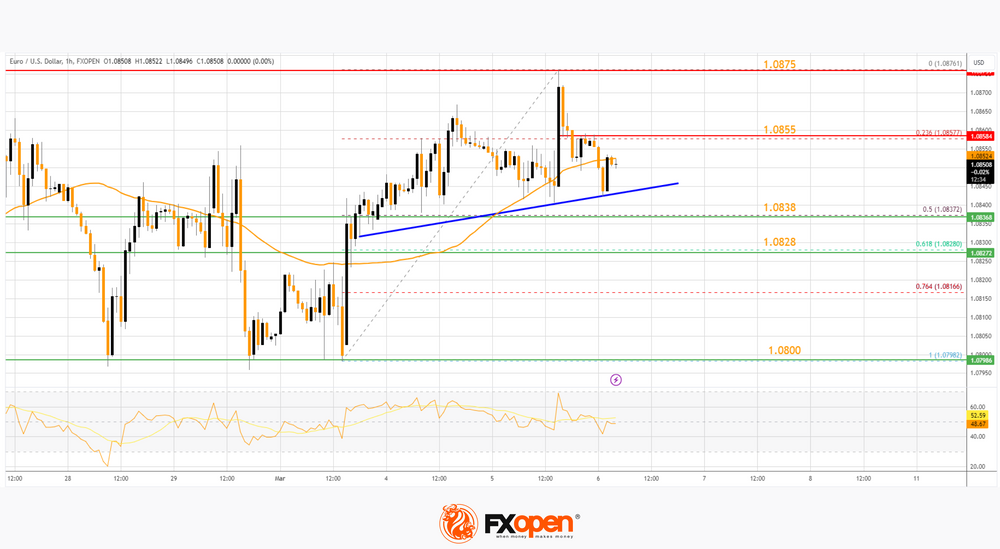
Immediate support on the downside is near a connecting bullish trend line at 1.0845. The next major support is the 50% Fib retracement level of the upward wave from the 1.0798 swing low to the 1.0876 high at 1.0838.
A downside break below the 1.0838 support could send the pair toward the 1.0800 level. Any more losses might send the pair into a bearish zone to 1.0765.
Immediate resistance on the EUR/USD chart is near the 1.0855 zone. The first major resistance is near the 1.0875 level. An upside break above the 1.0875 level might send the pair toward the 1.0920 resistance.
The next major resistance is near the 1.0940 level. Any more gains might open the doors for a move toward the 1.1000 level.
USD/CHF Technical Analysis
On the hourly chart of USD/CHF at FXOpen, the pair started a fresh decline from well above the 0.8890 zone. The US Dollar dropped below the 0.8860 support to move into a short-term negative zone against the Swiss Franc.
The bears pushed the pair below the 50-hour simple moving average and 0.8840. Finally, the bulls appeared near the 0.8800 level. A low was formed near 0.8804 and the pair is now attempting a fresh increase.
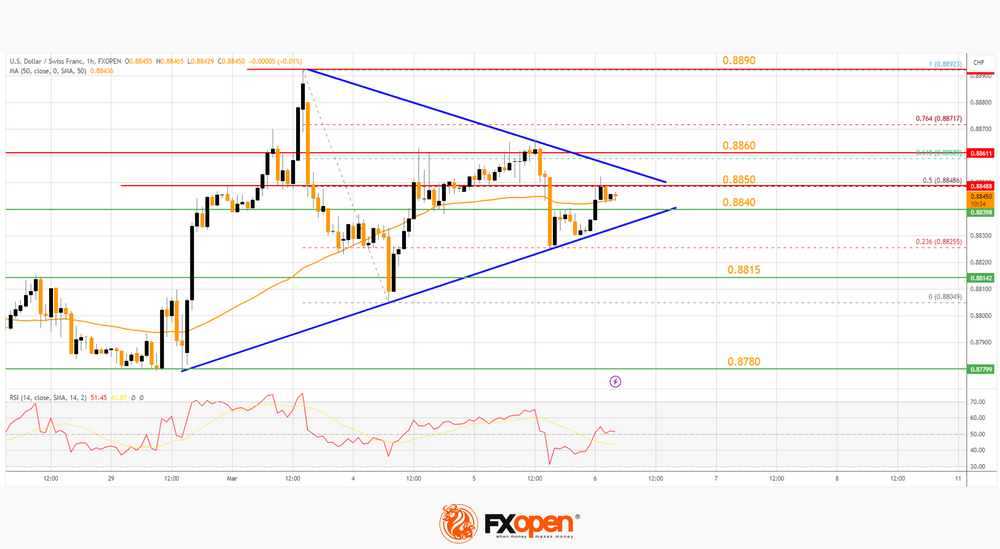
On the upside, the pair could face resistance near the 50% Fib retracement level of the downward move from the 0.8892 swing high to the 0.8804 low at 0.8850.
There is also a key contracting triangle forming with resistance near 0.8850. The next major resistance is near the 61.8% Fib retracement level of the downward move from the 0.8892 swing high to the 0.8804 low at 0.8860.
If there is a clear break above the 0.8860 resistance zone, the pair could start another increase. In the stated case, it could even surpass 0.8890.
On the downside, immediate support on the USD/CHF chart is 0.8840. The first major support is near the 0.8815 level. The next major support is near 0.8780. Any more losses may possibly open the doors for a move toward the 0.8650 level in the coming days.
Trade over 50 forex markets 24 hours a day with FXOpen. Take advantage of low commissions, deep liquidity, and spreads from 0.0 pips. Open your FXOpen account now or learn more about trading forex with FXOpen.
This article represents the opinion of the Companies operating under the FXOpen brand only. It is not to be construed as an offer, solicitation, or recommendation with respect to products and services provided by the Companies operating under the FXOpen brand, nor is it to be considered financial advice.
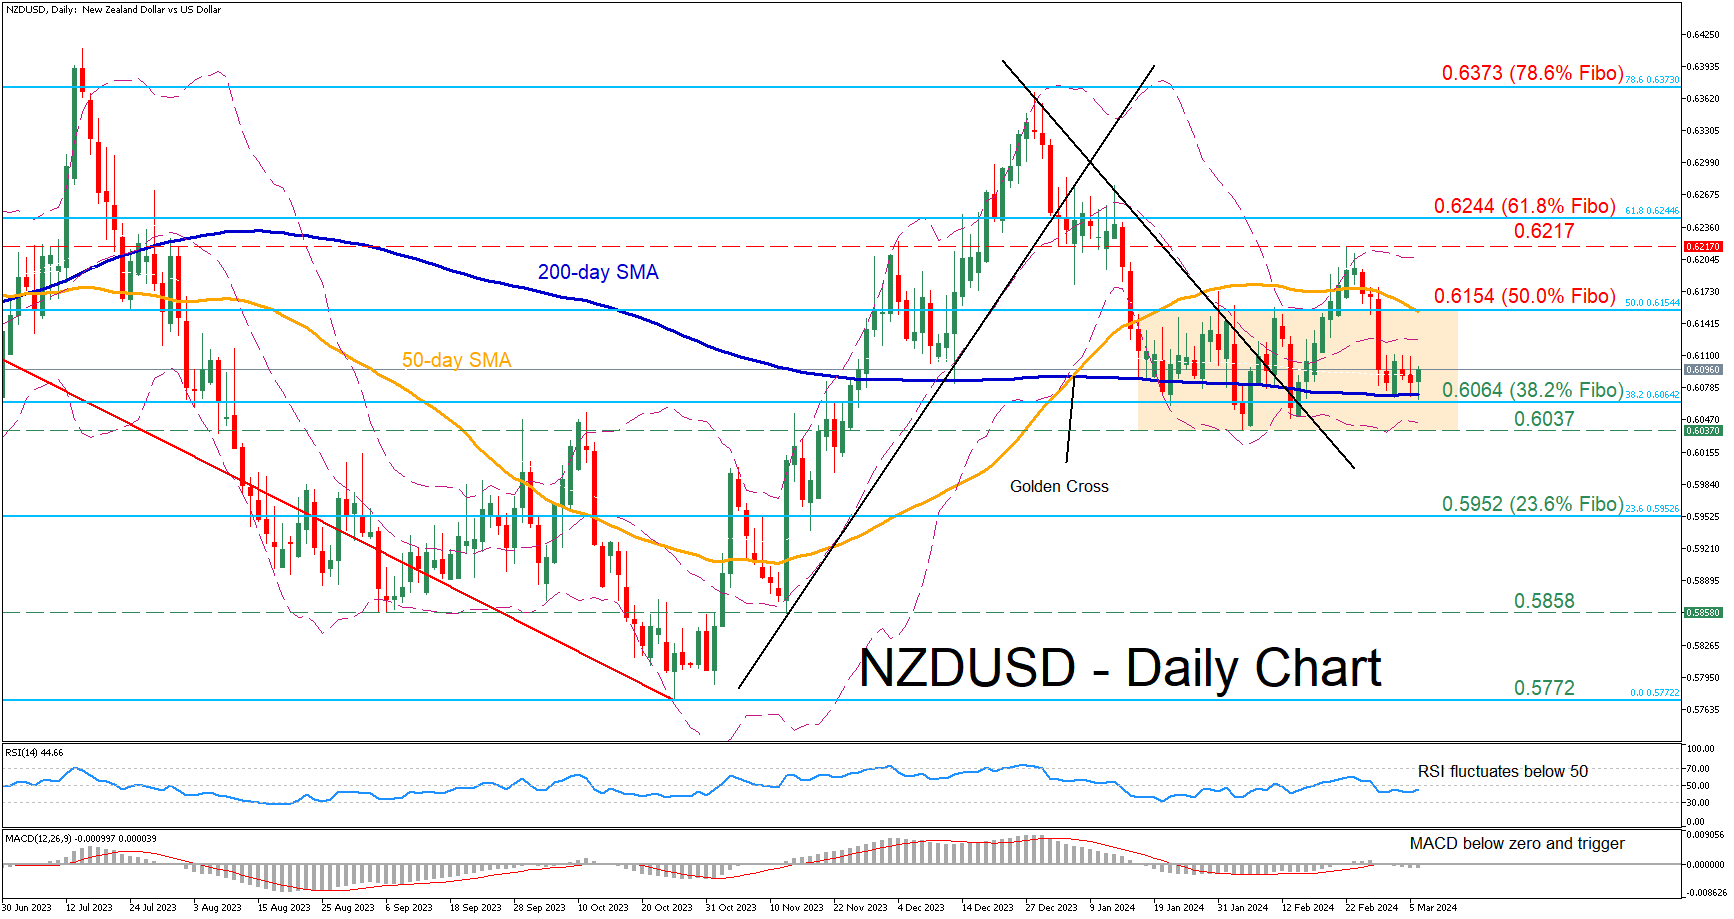
NZDUSD Stuck in a Rectangle Pattern
- NZDUSD gets rejected after claiming 50-day SMA
- But the decline meets strong support at 200-day SMA
- Oscillators remain in their negative territories
NZDUSD had been in a downtrend since its rejection at 0.6373, which is the 78.6% Fibonacci retracement of the 0.6536-0.5772 region. Despite the pair’s attempt for recovery and its temporary break above the 50-day simple moving average (SMA), it reversed back within its short-term sideways pattern.
Given that both the RSI and MACD are tilted to the downside, the price might drop below the 200-day SMA and challenge the 38.2% Fibo of 0.6064. Sliding beneath that floor, the pair could descend towards the 2024 bottom of 0.6037. A violation of that region could set the stage for the 23.6% Fibo of 0.5952.
On the flipside, should the pair rotate back higher, immediate resistance could be found at the 50.0% Fibo of 0.6154, which overlaps with the 50-day SMA. Conquering this barricade, the bulls may attack the recent rejection region of 0.6217. Further advances could then cease around the 61.8% Fibo of 0.6244.
Overall, despite the break above the 50-day SMA, NZDUSD reversed back within its rangebound structure as the 200-day SMA provided solid support. Hence, the consolidation phase is likely to resume and hold for as long as the SMAs hold their ground.
GBP/JPY Daily Outlook
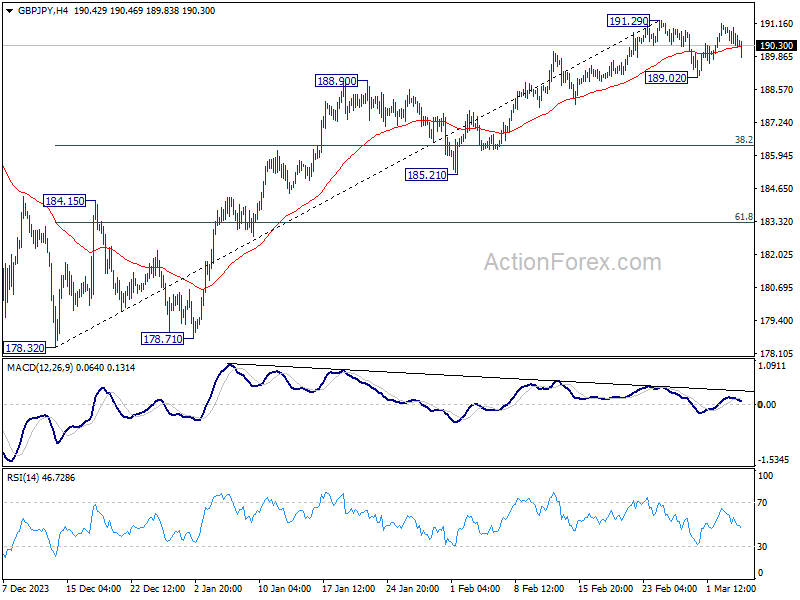
Daily Pivots: (S1) 190.29; (P) 190.69; (R1) 191.06; More.....
Intraday bias in GBP/JPY remains neutral and range trading continues. Corrective pattern from 191.29 could still extend. Break of 188.02 minor support will bring deeper fall to 38.2% retracement of 178.32 to 191.29 at 186.33, as a correction to rise from 178.32. Nevertheless, on the upside, decisive break of 191.29 will resume larger up trend, and target 195.86 long term resistance next.
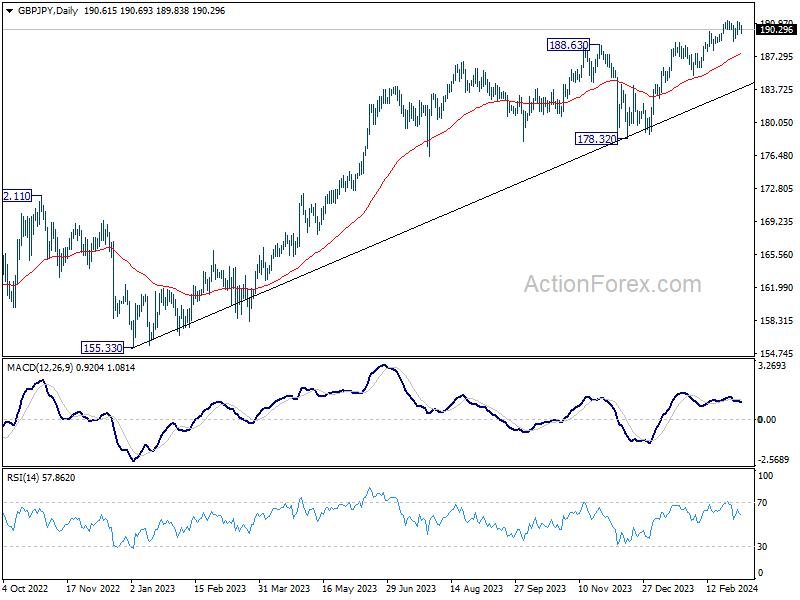
In the bigger picture, up trend from 123.94 (2020 low) is in progress. Medium term outlook will stay bullish as long as 178.32 support holds. Next target is 195.86 long term resistance (2015 high).
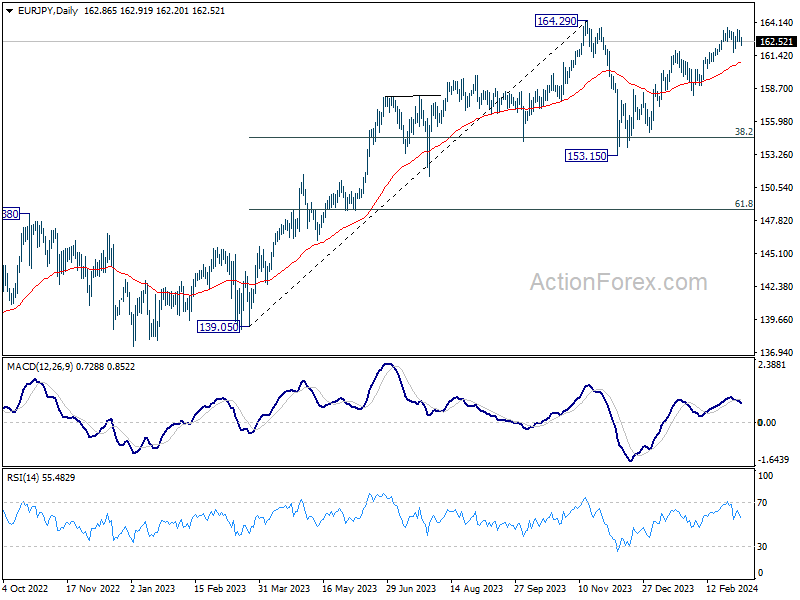
EUR/JPY Daily Outlook
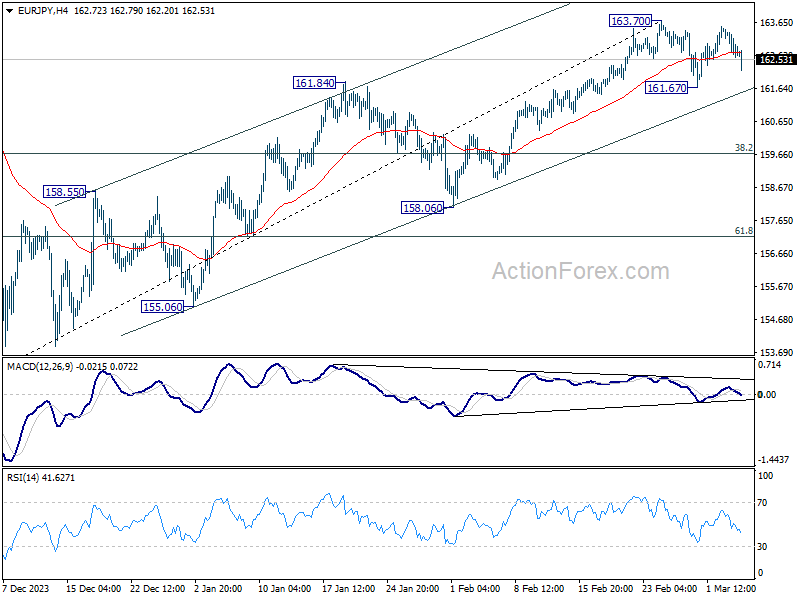
Daily Pivots: (S1) 162.54; (P) 162.99; (R1) 163.38; More...
EUR/JPY dips notably today as range trading from 163.70 extends. Intraday bias stays neutral first. On the downside, break of 161.67 minor support will bring deeper decline to 38.2% retracement of 153.15 to 163.70 at 159.66, as corrective pattern from 163.70 resumes. Nevertheless, firm break of 163.70 will resume whole rally from 153.15 to retest 164.29 high.
In the bigger picture, price actions from 164.29 medium term top are seen as a correction to rise from 139.05 only. As long as 148.38 resistance turned support holds (2022 high), larger up trend from 114.42 (2020 low) is expected to resume through 164.29 at a later stage. Next target would be 169.96 (2008 high).
EUR/GBP Daily Outlook
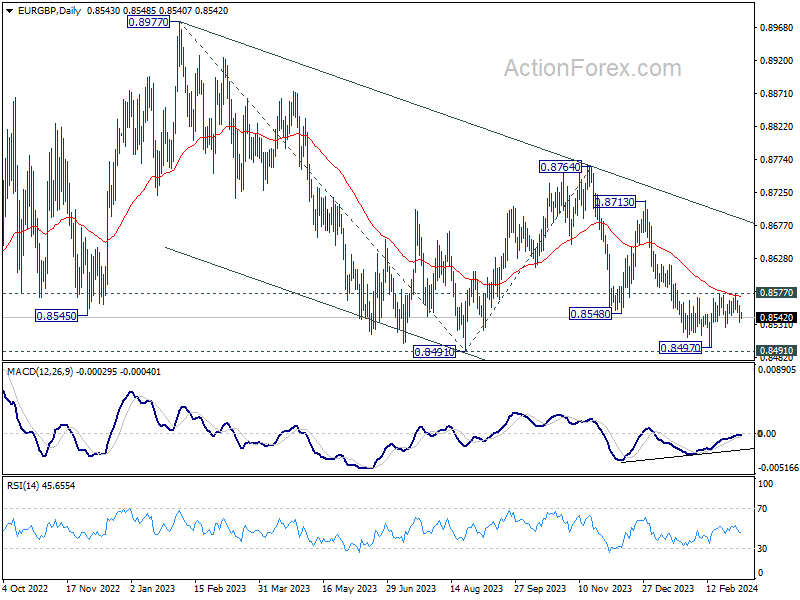
Daily Pivots: (S1) 0.8534; (P) 0.8547; (R1) 0.8559; More...
Range trading continues in EUR/GBP and intraday bias remains neutral first. Considering bullish convergence condition in D MACD, decisive break of 0.8577 and 55 D EMA (now at 0.8572) will argue that fall from 0.8764 has completed. Intraday bias will be back on the upside for rebound towards 0.8713 resistance. Nevertheless, firm break of 0.8491/7 support zone will confirm larger down trend resumption.
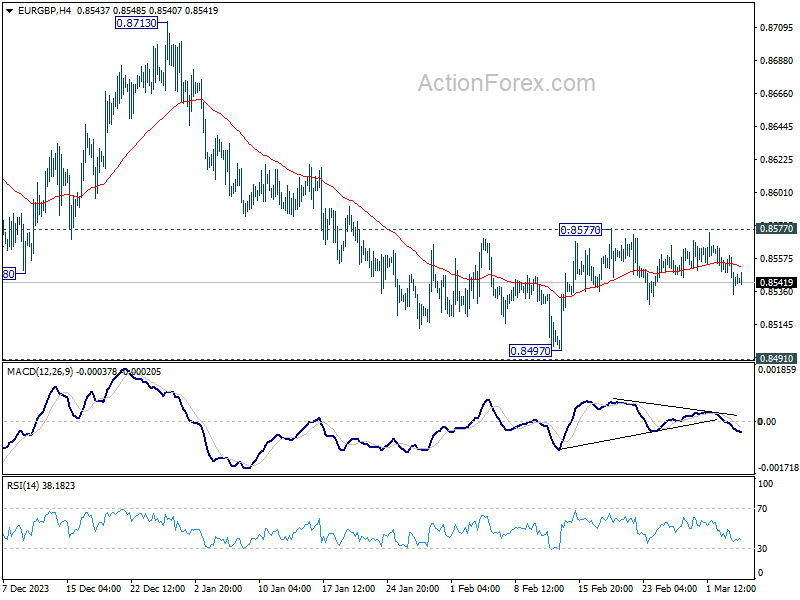
In the bigger picture, fall from 0.8764 is seen as another leg in the whole down trend from 0.9267 (2022 high). Outlook will stay bearish as long as 0.8713 resistance holds. Break of 0.8491 will target 61.8% projection of 0.8977 to 0.8491 from 0.8764 at 0.8464.