

Sample Category Title
AUD/USD Daily Report
Daily Pivots: (S1) 0.6511; (P) 0.6547; (R1) 0.6600; More...
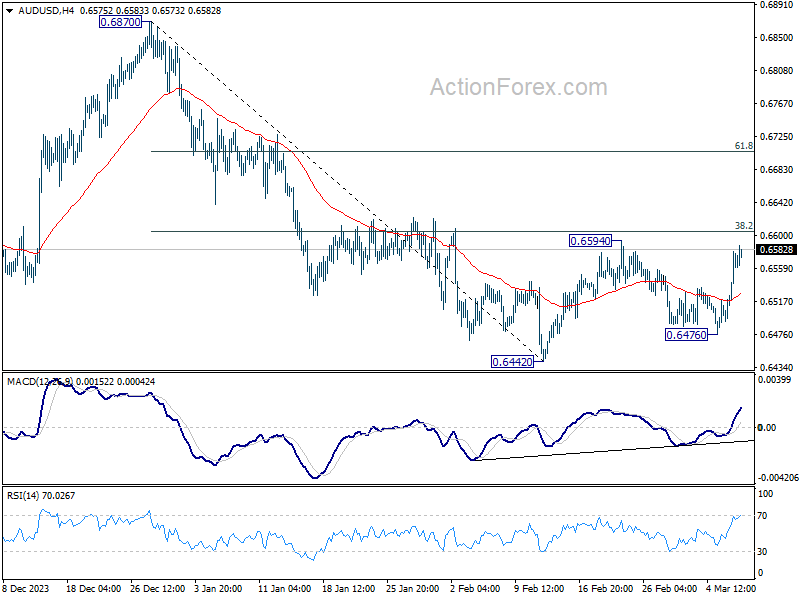
AUD/USD's strong rebound suggests that corrective pattern from 0.6442 is extending with another leg. While further rise cannot be ruled out, upside should be limited by 38.2% retracement of 0.6877 to 0.6442 at 0.6605. Break of 0.6476 support will argue that fall from 0.6870 is ready to resume through 0.6442 low. However, sustained break of 0.6605 will dampen this bearish view and bring stronger rise to 61.8% retracement at 0.6707 instead.
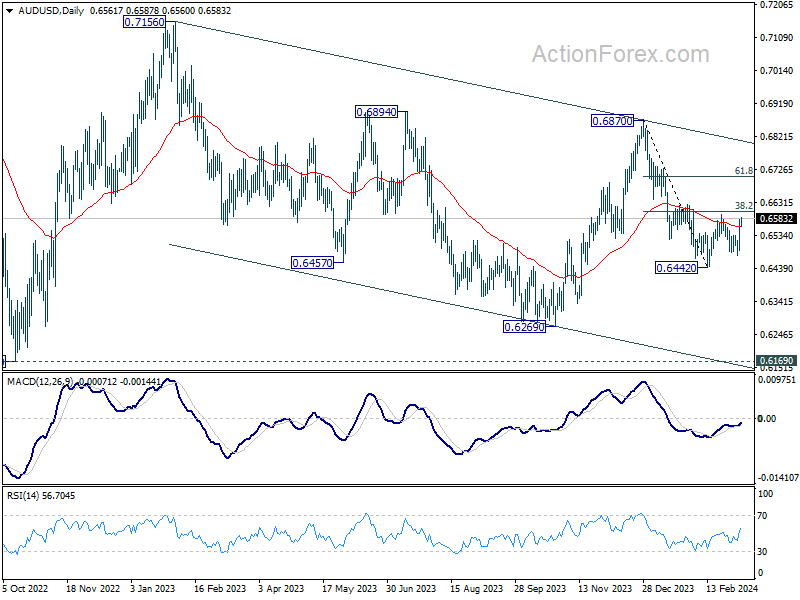
In the bigger picture, price actions from 0.6169 (2022 low) are seen as a medium term corrective pattern to the down trend from 0.8006 (2021 high). Fall from 0.7156 (2023 high) is seen as the second leg, which might still be in progress. Overall, sideway trading could continue in range of 0.6169/7156 for some more time. But as long as 0.7156 holds, an eventual downside breakout would be mildly in favor.
EUR/USD Daily Outlook
Daily Pivots: (S1) 1.0856; (P) 1.0885; (R1) 1.0929; More...
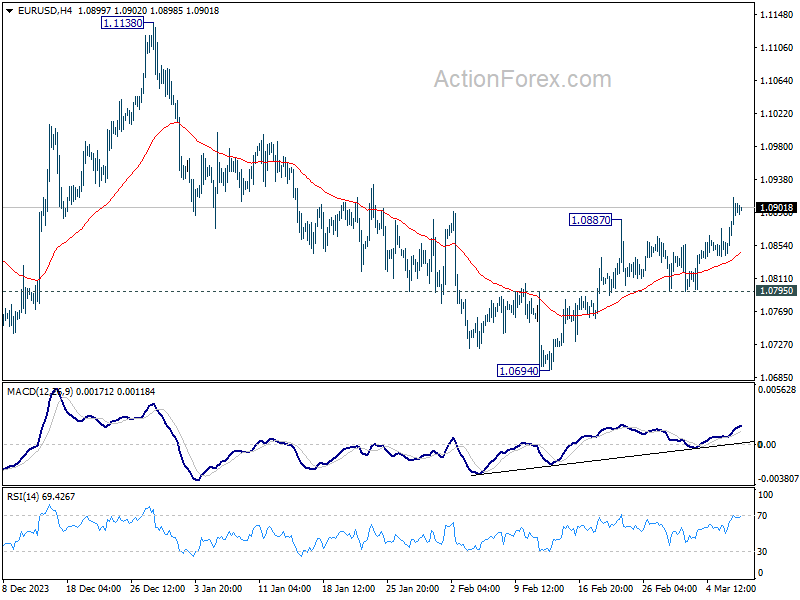
EUR/USD's break of 1.0887 confirms resumption of rebound from 1.0694. Intraday bias is back on the upside for retesting 1.1138 first. Firm break there will resume the rise from 1.0447 to retest 1.1274 high. For now, further rally is in favor as long as 1.0795 support holds, in case of retreat.
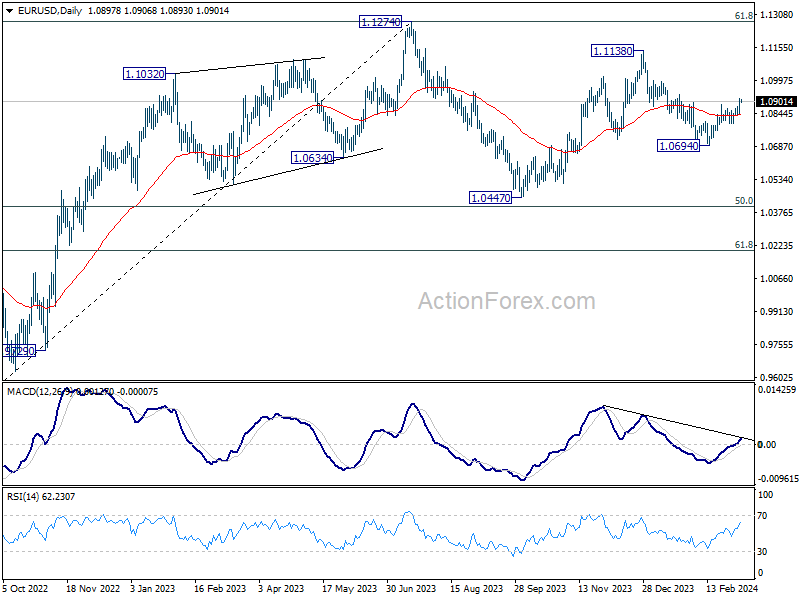
In the bigger picture, price actions from 1.1274 are viewed as a corrective pattern to rise from 0.9534 (2022 low). Rise from 1.0447 is seen as the second leg. While further rally could cannot be ruled out, upside should be limited by 1.1274 to bring the third leg of the pattern. Meanwhile, sustained break of 1.0694 support will argue that the third leg has already started for 1.0447 and possibly below.
GBP/USD Daily Outlook
Daily Pivots: (S1) 1.2694; (P) 1.2728; (R1) 1.2765; More...
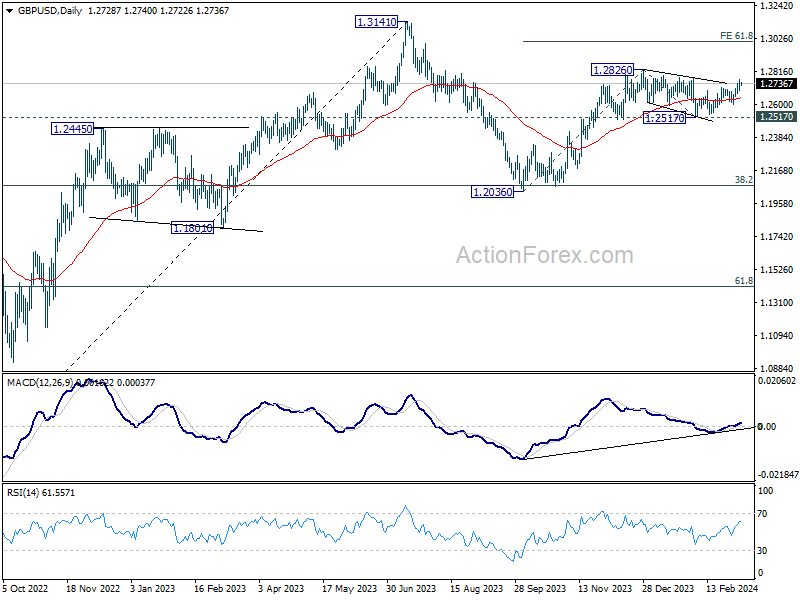
GBP/USD's rally from 1.2517 is in progress and intraday bias stays on the upside. Further rise would be seen to 1.2826 resistance first. Firm break there will resume whole rally from 1.2036, and target 61.8% projection of 1.2036 to 1.2826 from 1.2517 at 1.3005 next. For now, further rise will remain in favor as long as 1.2599 support holds, in case of retreat.
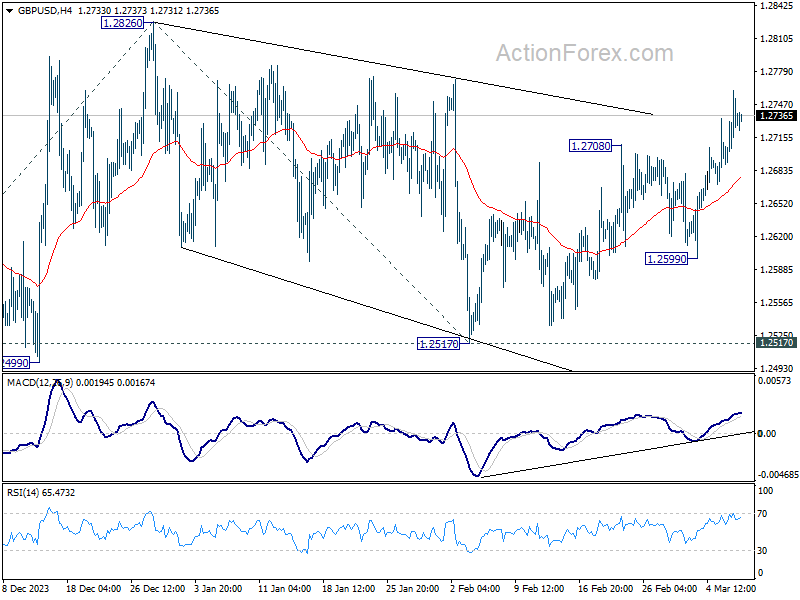
In the bigger picture, price actions from 1.3141 medium term top are seen as a corrective pattern to up trend from 1.0351 (2022 low). Rise from 1.2036 is seen as the second leg, which could be still in progress. But upside should be limited by 1.3141 to bring the third leg of the pattern. Meanwhile, break of 1.2517 support will argue that the third leg has already started for 38.2% retracement of 1.0351 (2022 low) to 1.3141 at 1.2075 again.
USD/CHF Daily Outlook
Daily Pivots: (S1) 0.8798; (P) 0.8828; (R1) 0.8850; More....
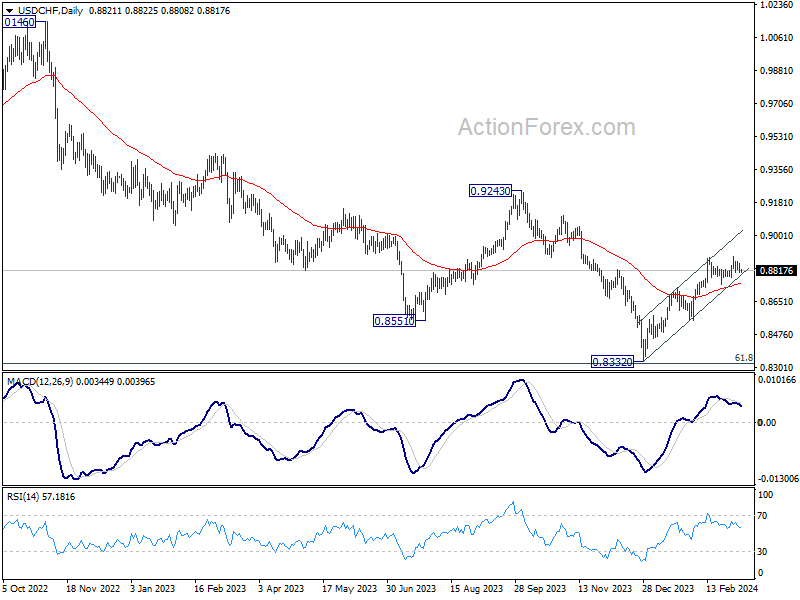
No change in USD/CHF's outlook as sideway consolidation continues. Intraday bias stays neutral at this point. Further rally remains in favor as long as 0.8741 support holds. Break of 0.8891 will resume the whole rebound from 0.8332 towards 0.9243 key resistance. Nevertheless, break of 0.8741 support will turn bias back to the downside for deeper pullback.
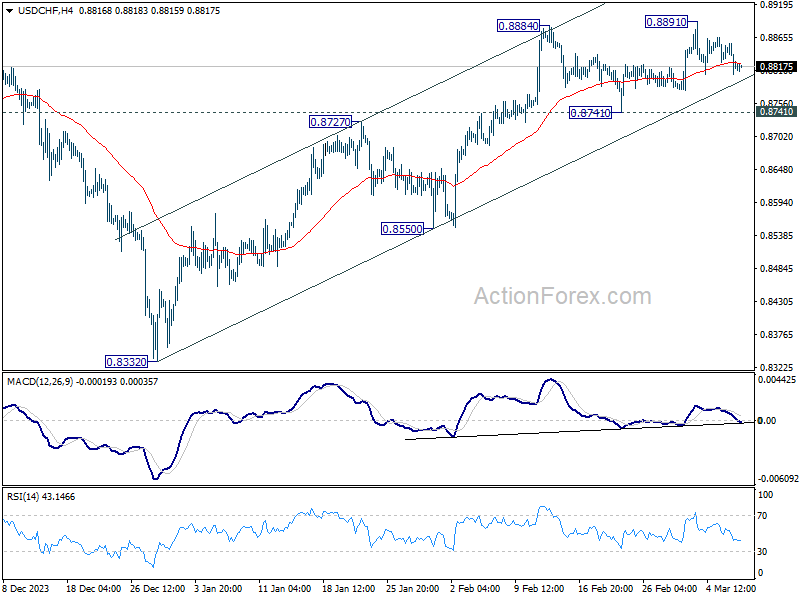
In the bigger picture, a medium term bottom should be formed at 0.8332, on bullish convergence condition in W MACD, just ahead of 0.8317 long term fibonacci support. It's still early to decide if the larger down trend from 1.0146 (2022 high) is reversing. But further rise should be seen to 0.9243 resistance even as a correction.
Technical Outlook and Review
DXY:
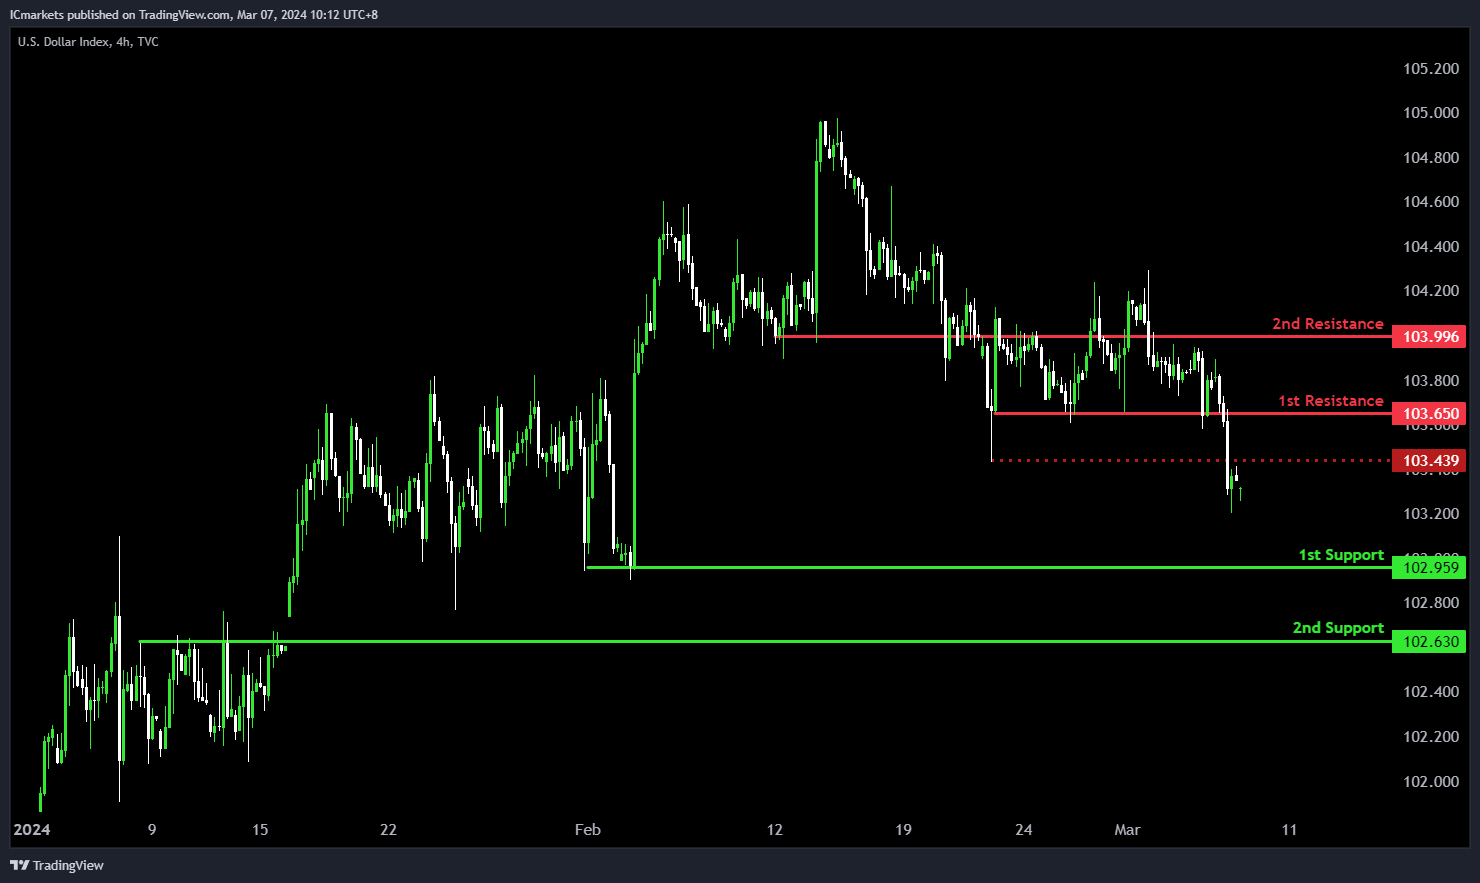
The DXY chart exhibits a bearish momentum, suggesting a potential continuation towards the 1st support level.
The 1st support at 102.95 is significant as a multi-swing low support, indicating its historical importance as a level where buying interest has emerged, potentially providing support to the price.
Furthermore, the 2nd support at 102.63 is characterized as a pullback support, reinforcing its significance as a level where buyers may intervene to prevent further decline.
On the resistance side, the 1st resistance level at 103.65 is identified as a pullback resistance, suggesting its historical importance as a barrier where selling pressure may increase, potentially limiting upward movement in the short term.
Additionally, the 2nd resistance at 103.99 is noted as an overlap resistance, further reinforcing its significance as a level where selling interest may intensify.
EUR/USD:
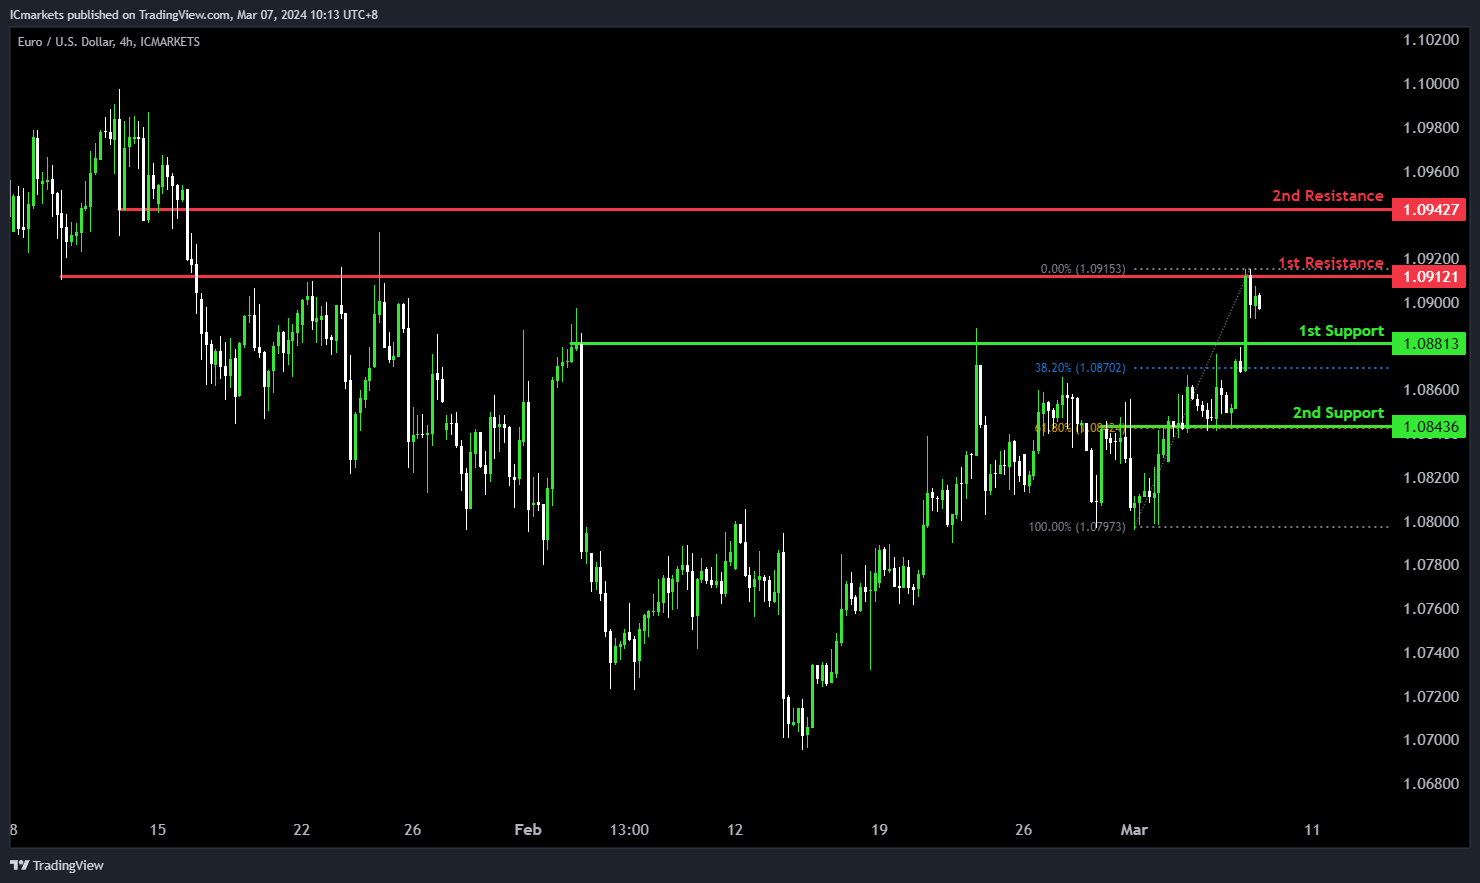
The EUR/USD chart currently demonstrates bullish momentum, suggesting a potential scenario where the price may drop further to the 1st support in the short term before bouncing from there and rising to the 1st resistance.
The 1st support level at 1.0881 is significant as a pullback support, coinciding with the 38.20% Fibonacci Retracement level, indicating its historical significance as a level where buying interest has emerged, potentially providing support to the price.
Additionally, the 2nd support at 1.0843 is identified as an overlap support, further reinforcing its importance as a level where buyers may intervene to prevent further decline, aligning with the 61.80% Fibonacci Retracement level.
On the resistance side, the 1st resistance level at 1.0912 is identified as an overlap resistance, suggesting its historical importance as a barrier where selling pressure may increase, potentially limiting upward movement in the short term.
Furthermore, the 2nd resistance at 1.0942 is noted as a pullback resistance, indicating its significance as a level where selling interest may intensify, potentially capping the upward movement of prices.
EUR/JPY:
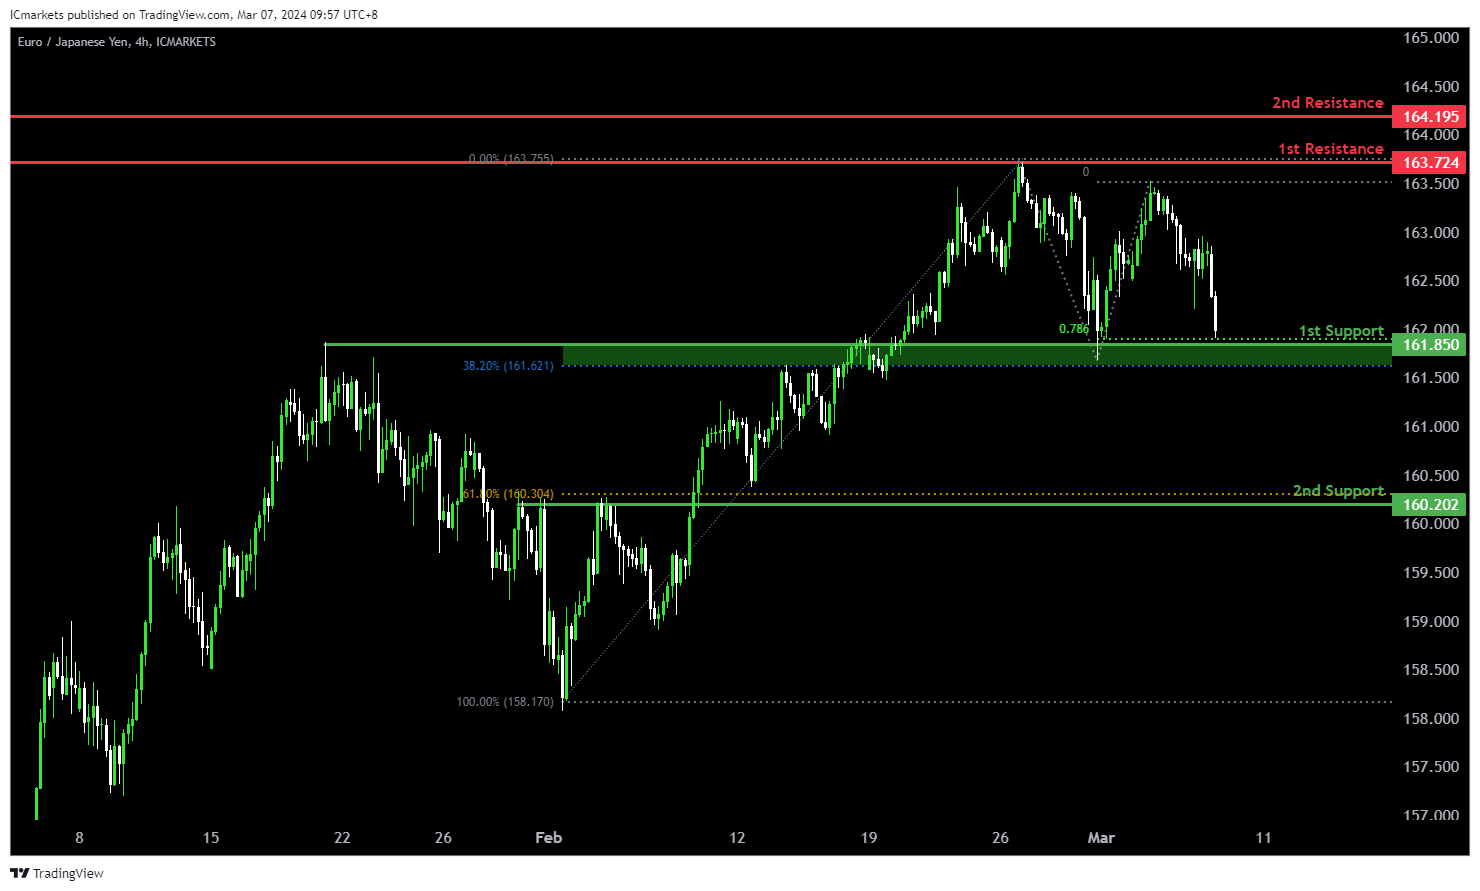
The EUR/JPY chart currently indicates a bearish momentum, suggesting a potential continuation of the downward trend. Several factors support the possibility of a bearish movement towards the 1st support level.
The 1st support at 161.850 aligns with an overlap support, the 78.60% Fibonacci Projection, and the 38.20% Fibonacci Retracement level, indicating a significant historical level where buying interest may emerge. Additionally, the 2nd support at 160.202 corresponds to a pullback support and the 61.80% Fibonacci Retracement, further reinforcing its importance as a potential area of support.
On the resistance side, the 1st resistance level at 163.724 is characterized by a multi-swing high resistance, suggesting a historical barrier to upward movement. Furthermore, the 2nd resistance level at 164.205 aligns with a swing high resistance, adding to its significance as a potential barrier to further bullish movement.
EUR/GBP:
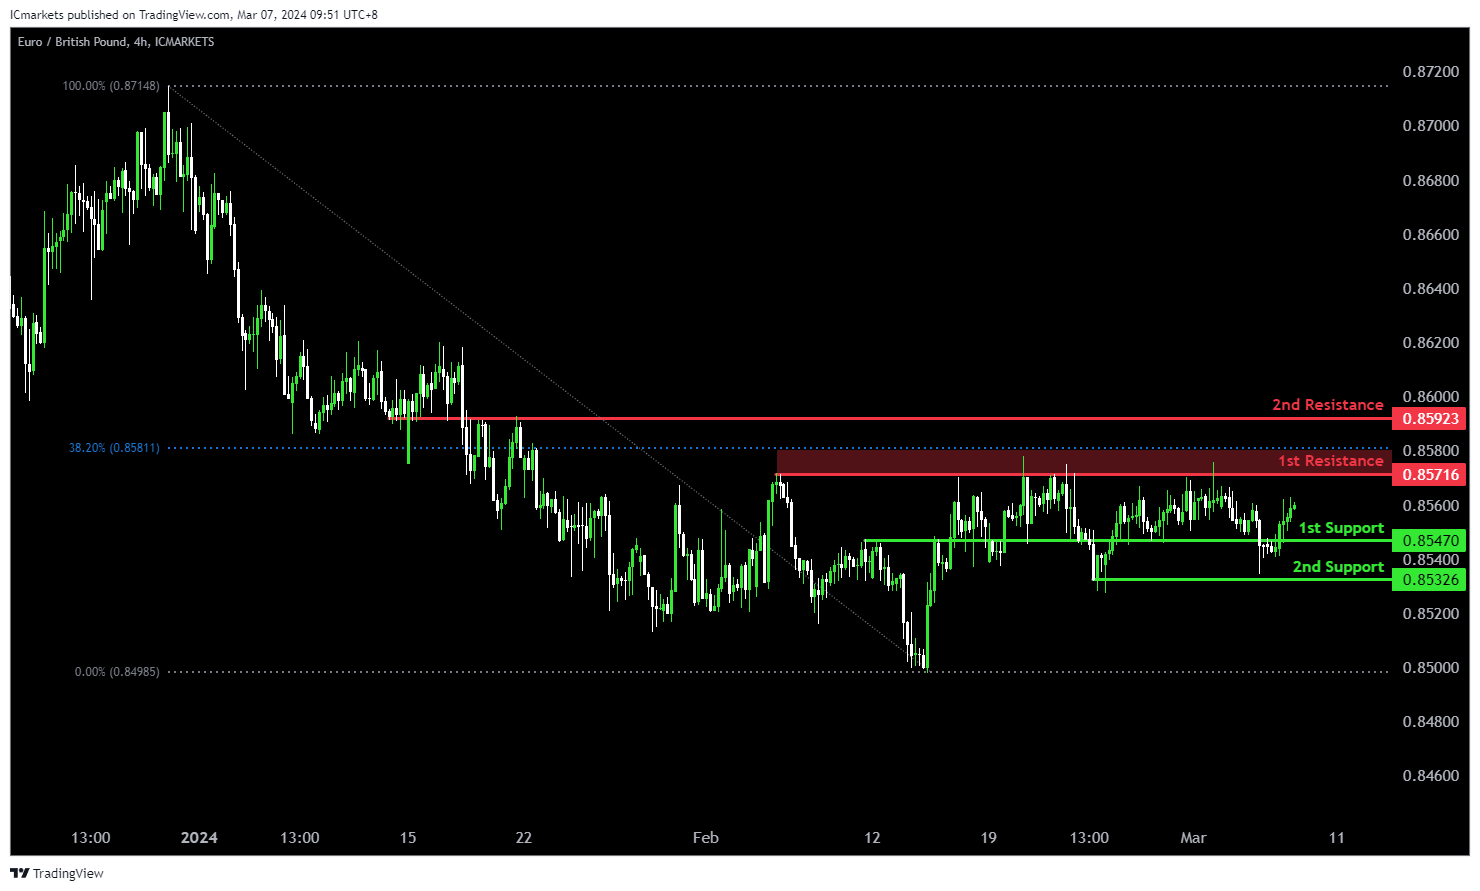
The EUR/GBP chart demonstrates a bullish momentum, indicating a potential continuation of the upward trend. Several factors support the possibility of a bullish movement towards the 1st resistance level.
The 1st support at 0.85470 is identified as a pullback support, suggesting a historical level where buying interest may emerge. Additionally, the 2nd support at 0.85326 corresponds to a swing low support, further reinforcing its importance as a potential area of support.
On the resistance side, the 1st resistance level at 0.85716 aligns with a swing high resistance and the 38.20% Fibonacci Retracement level, indicating a historical barrier to upward movement. Furthermore, the 2nd resistance level at 0.85923 is characterized by an overlap resistance, adding to its significance as a potential barrier to further bullish movement.
GBP/USD:
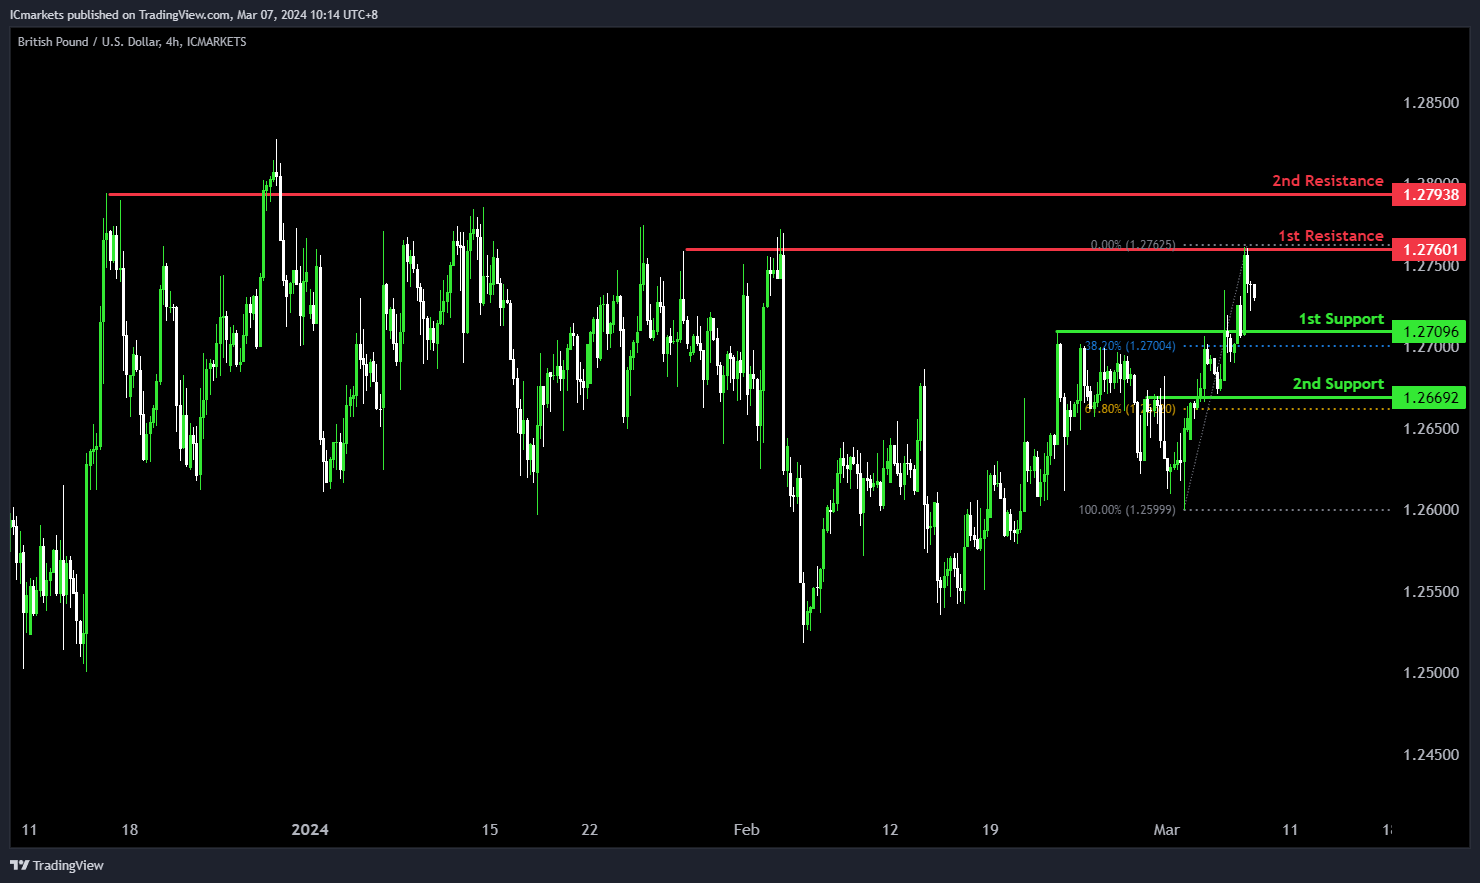
The GBP/USD chart currently exhibits bullish momentum, indicating a potential scenario where the price may drop further to the 1st support in the short term before bouncing from there and rising to the 1st resistance.
The 1st support level at 1.2709 is identified as a pullback support, suggesting its historical significance as a level where buying interest has emerged to support the price.
Additionally, the 2nd support at 1.2669 is characterized as an overlap support, reinforcing its importance as a level where buyers may intervene to prevent further decline.
On the resistance side, the 1st resistance level at 1.2760 is identified as a multi-swing high resistance, indicating its historical importance as a barrier where selling pressure may increase, potentially limiting upward movement in the short term.
Furthermore, the 2nd resistance at 1.2793 is noted as a pullback resistance, suggesting its significance as a level where selling interest may intensify, potentially capping the upward movement of prices.
GBP/JPY:
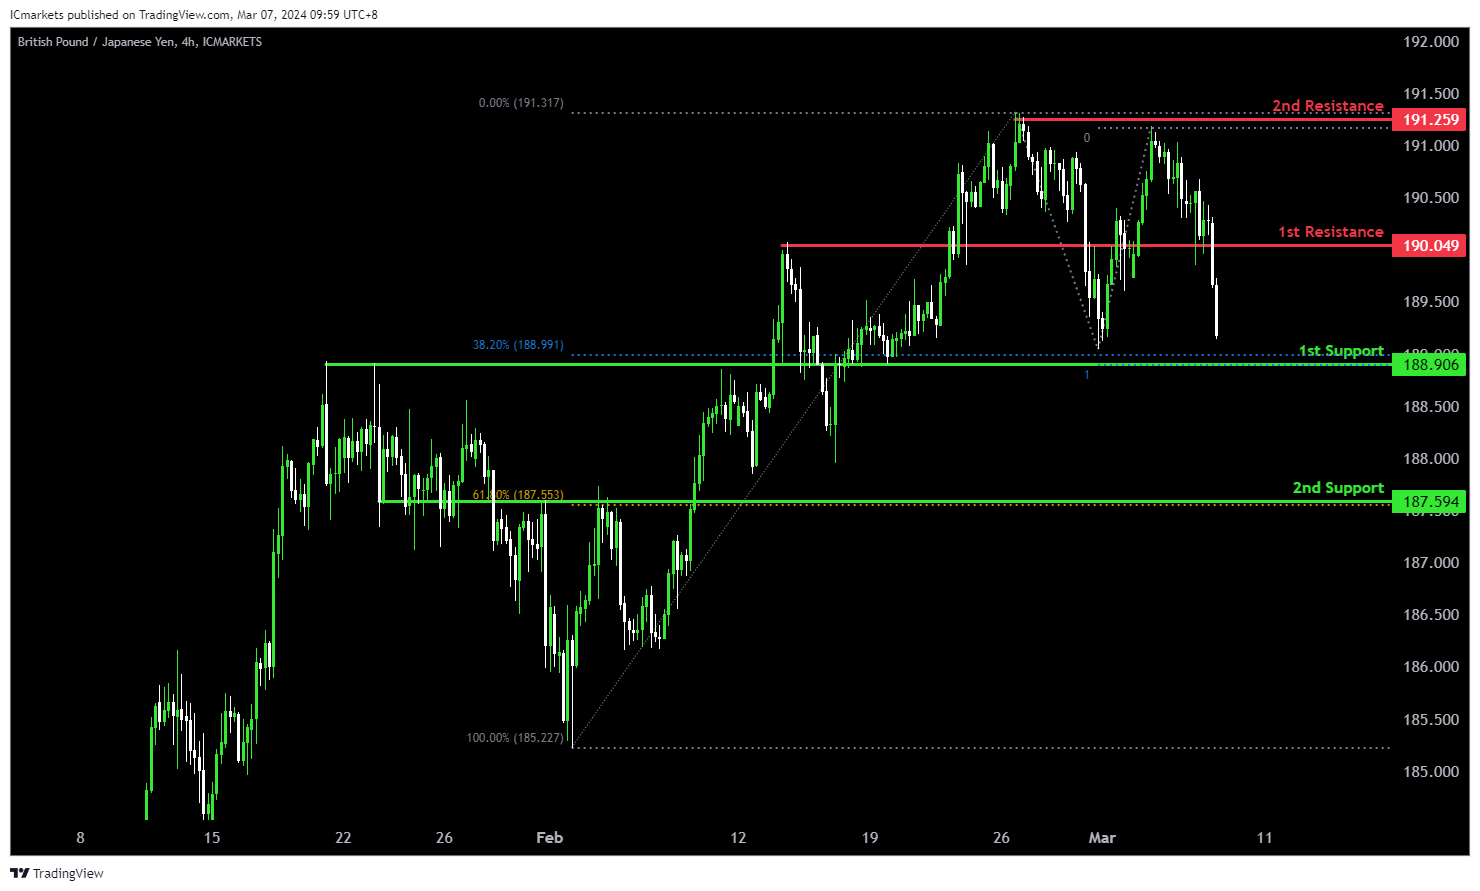
The GBP/JPY chart currently exhibits a bearish momentum, suggesting a potential continuation of the downward trend. Several factors support the possibility of a bearish movement towards the 1st support level.
The 1st support at 188.906 aligns with a pullback support and the 38.20% Fibonacci Retracement level, indicating a significant historical level where buying interest could emerge. Additionally, the confluence with the 100% Fibonacci Projection strengthens this support zone.
Moreover, the 2nd support at 187.594 corresponds to an overlap support and the 61.80% Fibonacci Retracement level, further reinforcing its importance as a potential area of support.
On the resistance side, the 1st resistance level at 190.049 is identified as a pullback resistance, suggesting a historical barrier to upward movement. Additionally, the 2nd resistance level at 191.259 aligns with a swing high resistance, adding to its significance as a potential barrier to further bullish movement.
USD/CHF:
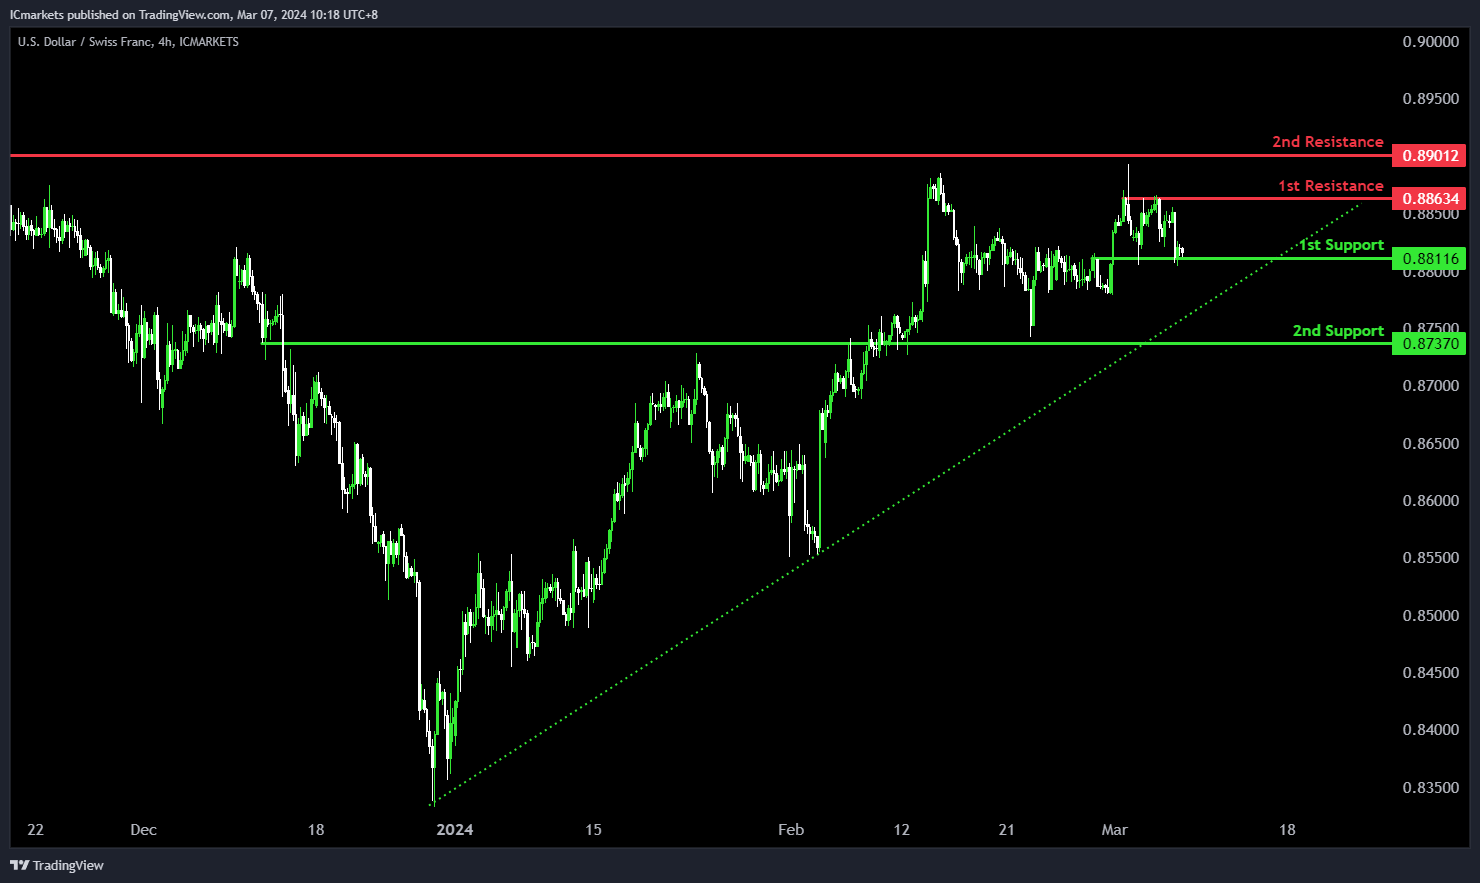
The USD/CHF chart maintains a bullish momentum, attributed to its presence within a bullish ascending channel.
There’s a potential scenario where the price could decline further to the 1st support in the short term before rebounding and ascending towards the 1st resistance.
The 1st support level at 0.8811 is identified as an overlap support, signifying its historical significance as a level where buying interest has emerged to support the price.
Furthermore, the 2nd support at 0.8737 is characterized as another overlap support, reinforcing its importance as a level where buyers may intervene to prevent further decline.
On the resistance side, the 1st resistance level at 0.8863 is identified as a multi-swing high resistance, suggesting its historical importance as a barrier where selling pressure may increase, potentially limiting upward movement in the short term.
Additionally, the 2nd resistance at 0.8901 is noted as an overlap resistance, indicating its significance as a level where selling interest may intensify.
USD/JPY:
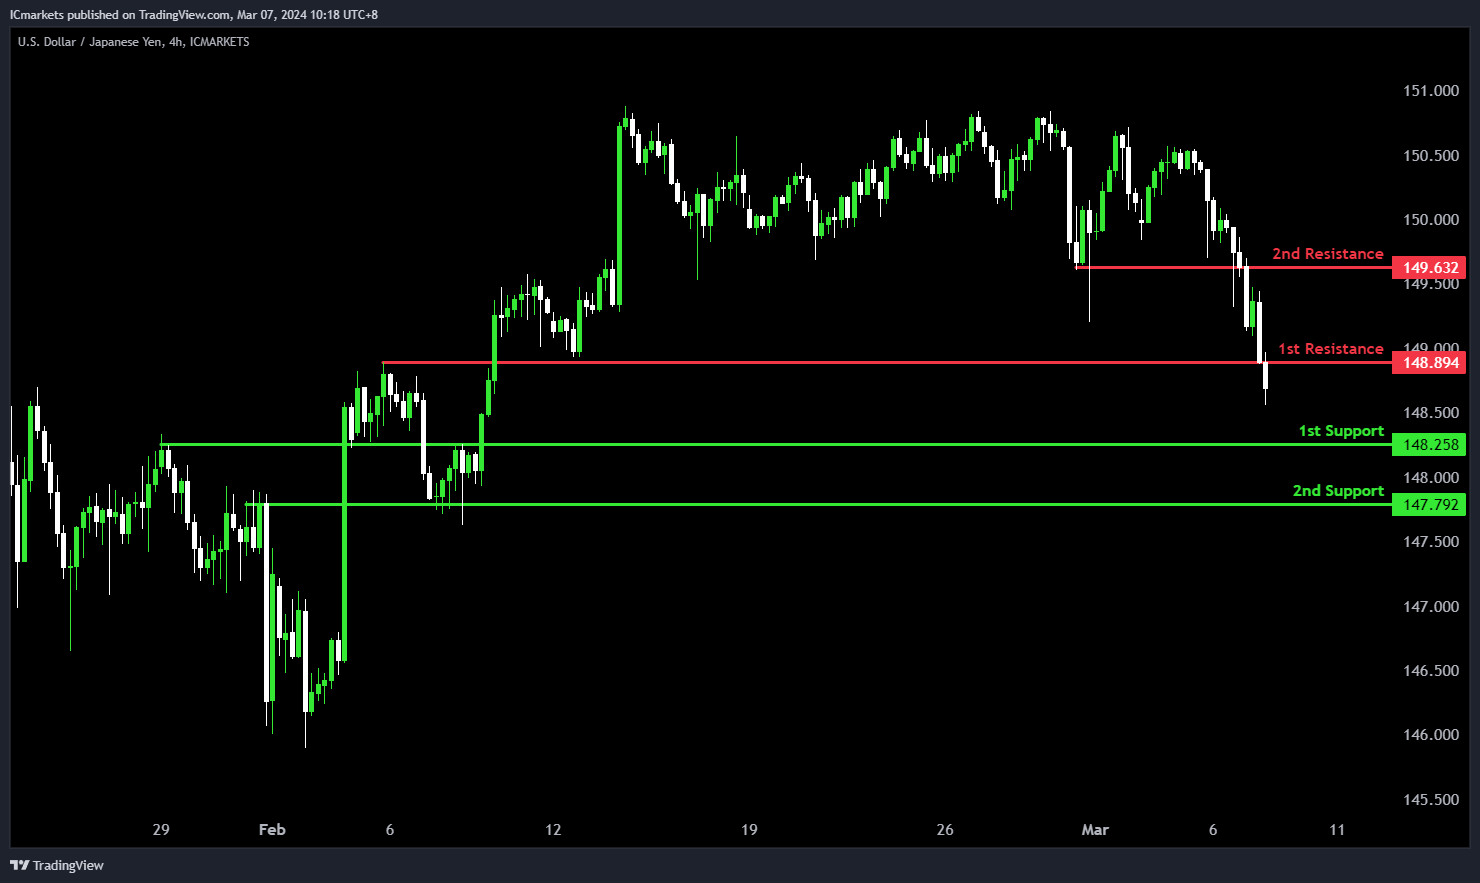
The USD/JPY chart currently exhibits a bearish momentum, suggesting a potential scenario of a bearish continuation towards the 1st support.
The 1st support level at 148.25 is identified as a pullback support, indicating its historical significance as a level where buying interest has emerged to support the price.
Additionally, the 2nd support at 147.79 is characterized as an overlap support, reinforcing its importance as a level where buyers may intervene to prevent further decline.
On the resistance side, the 1st resistance level at 148.89 is identified as a pullback resistance, suggesting its historical importance as a barrier where selling pressure may increase, potentially limiting upward movement in the short term.
Furthermore, the 2nd resistance at 149.63 is noted as another pullback resistance, indicating its significance as a level where selling interest may intensify.
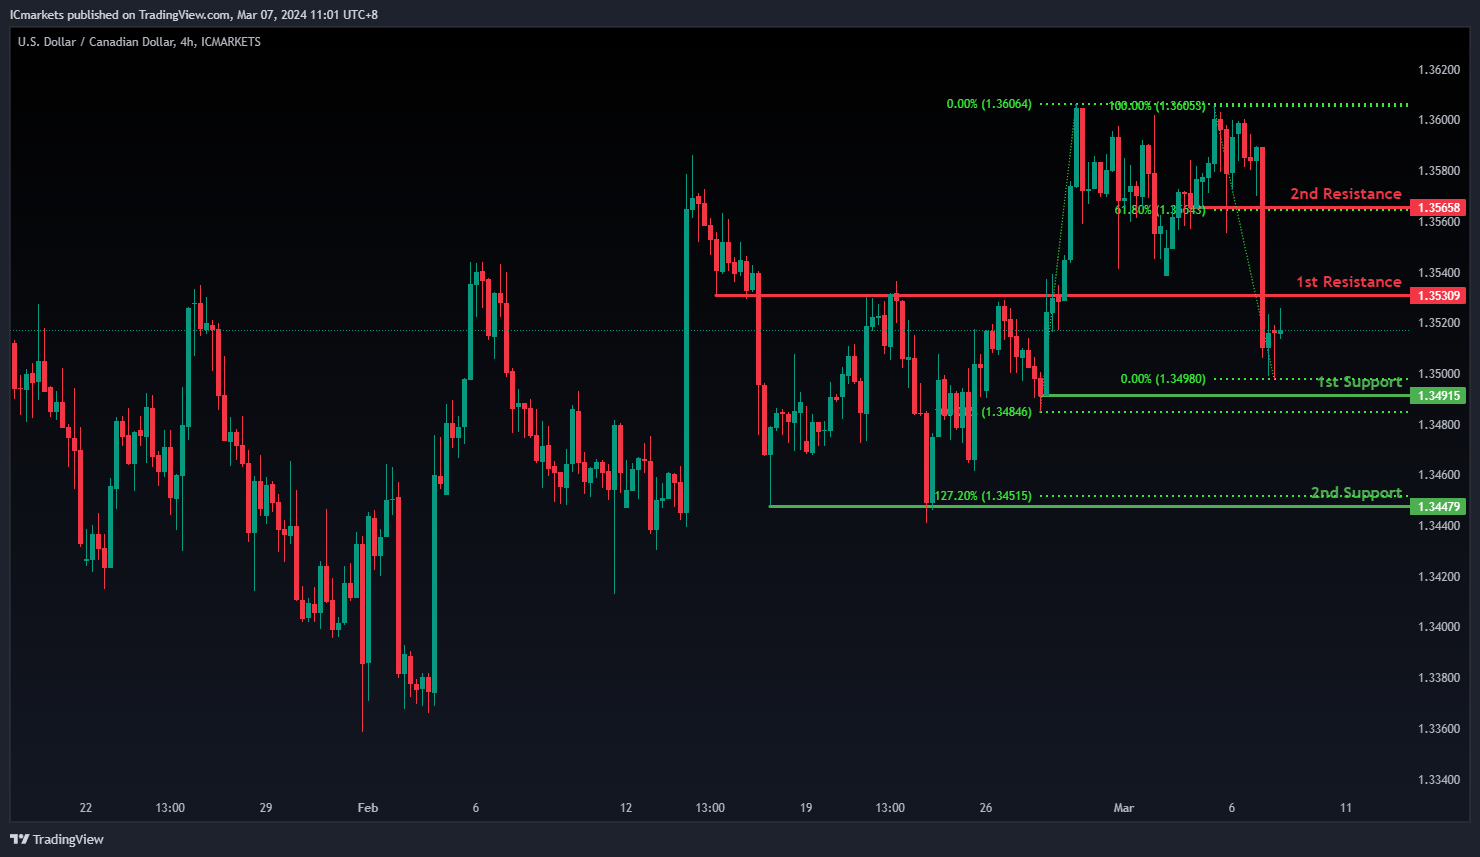
USD/CAD:
The USD/CAD chart currently exhibits an overall bearish momentum. In this context, there is a potential scenario for price to fall towards the 1st support.
The 1st support level at 1.3491 is identified as a pullback support. Further below, the 2nd support level at 1.3447 is also marked as a pullback support that aligns close to the 127.20% Fibonacci Extension level, reinforcing its significance as a key support level.
To the upside, the 1st resistance level at 1.3530 is identified as an overlap resistance. Higher up, the 2nd resistance level at 1.3565 is marked as a pullback resistance that aligns with the 61.80% Fibonacci retracement level, further highlighting its importance as a potential resistance zone.
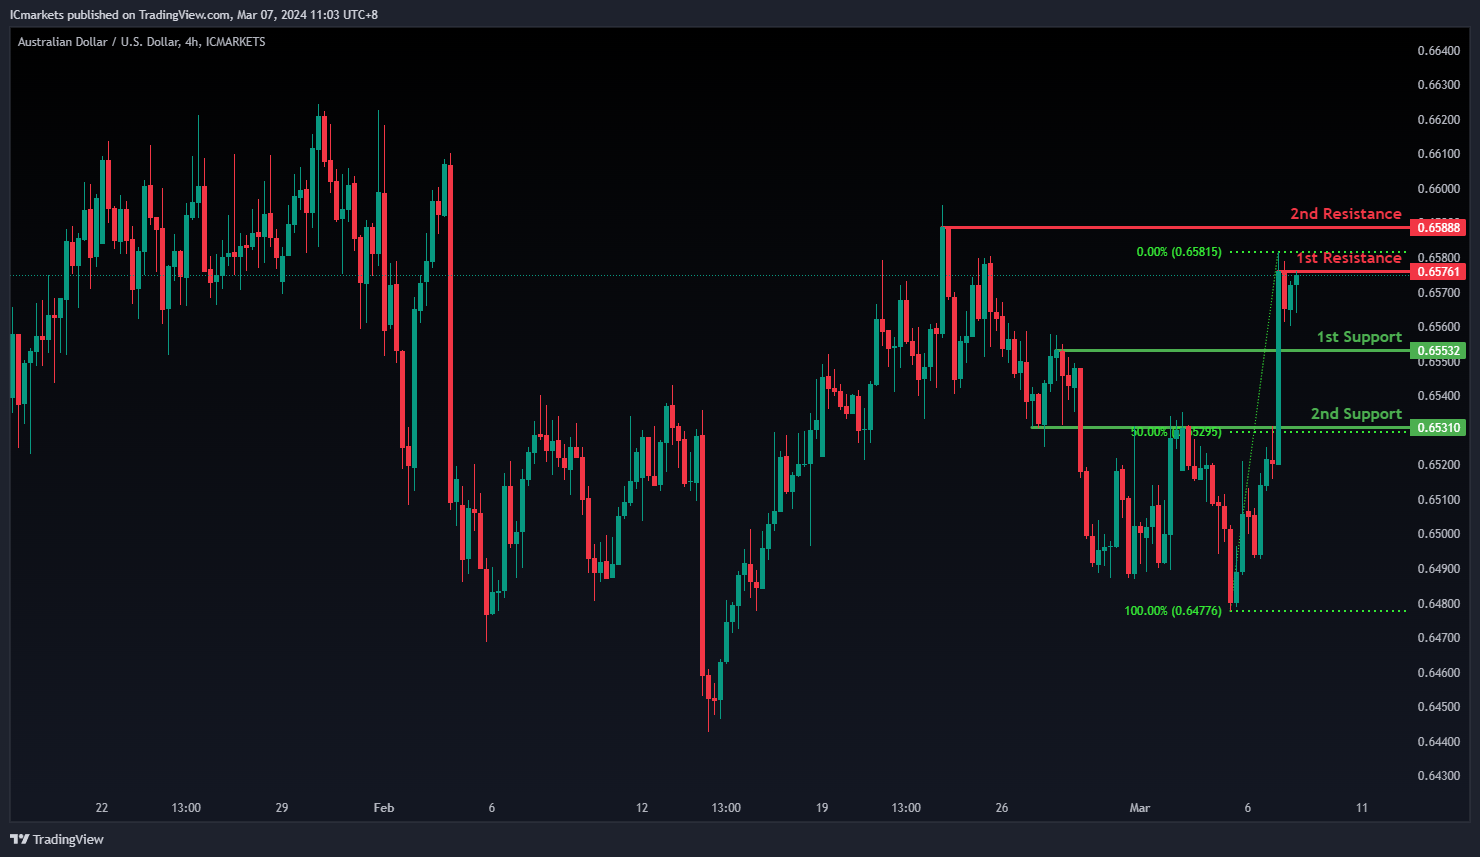
AUD/USD:
The AUD/USD chart currently exhibits an overall bullish momentum. In this context, there is a potential scenario for price to break above the 1st resistance and rise towards the 2nd resistance.
The 1st resistance level at 0.6576 is identified as a pullback resistance. Higher up, the 2nd resistance level at 0.6588 is also noted as a swing-high resistance, further highlighting its importance as a potential resistance zone.
To the downside, the 1st support level at 0.6553 is identified as a pullback support. Further below, the 2nd support level at 0.6531 is marked as an overlap support that aligns with the 50.00% Fibonacci Retracement level, further emphasizing its importance as a potential support zone.
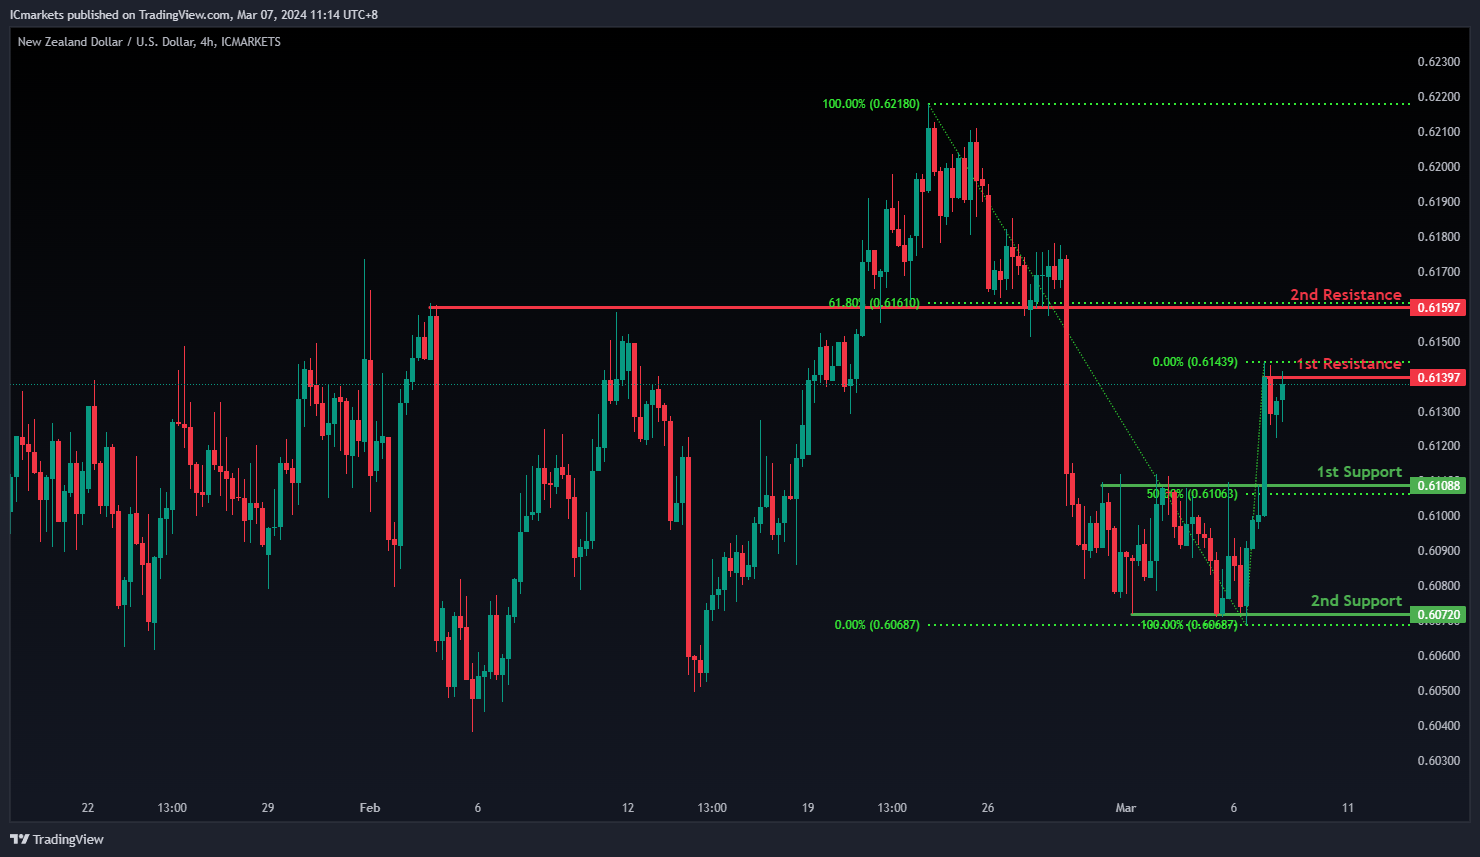
NZD/USD
The NZD/USD chart currently exhibits an overall bullish momentum. In this context, there is a potential scenario for price to break above the 1st resistance and rise towards the 2nd resistance.
The 1st resistance level at 0.6139 is identified as a pullback resistance. Higher up, the 2nd resistance level at 0.6159 is noted as an overlap resistance that aligns with the 61.80% Fibonacci Retracement level, further highlighting its importance as a potential resistance zone.
To the downside, the 1st support level at 0.6108 is identified as a pullback support that aligns with the 50.00% Fibonacci Retracement level. Further below, the 2nd support level at 0.6072 is also marked as a pullback support, further emphasizing its importance as a potential support zone.
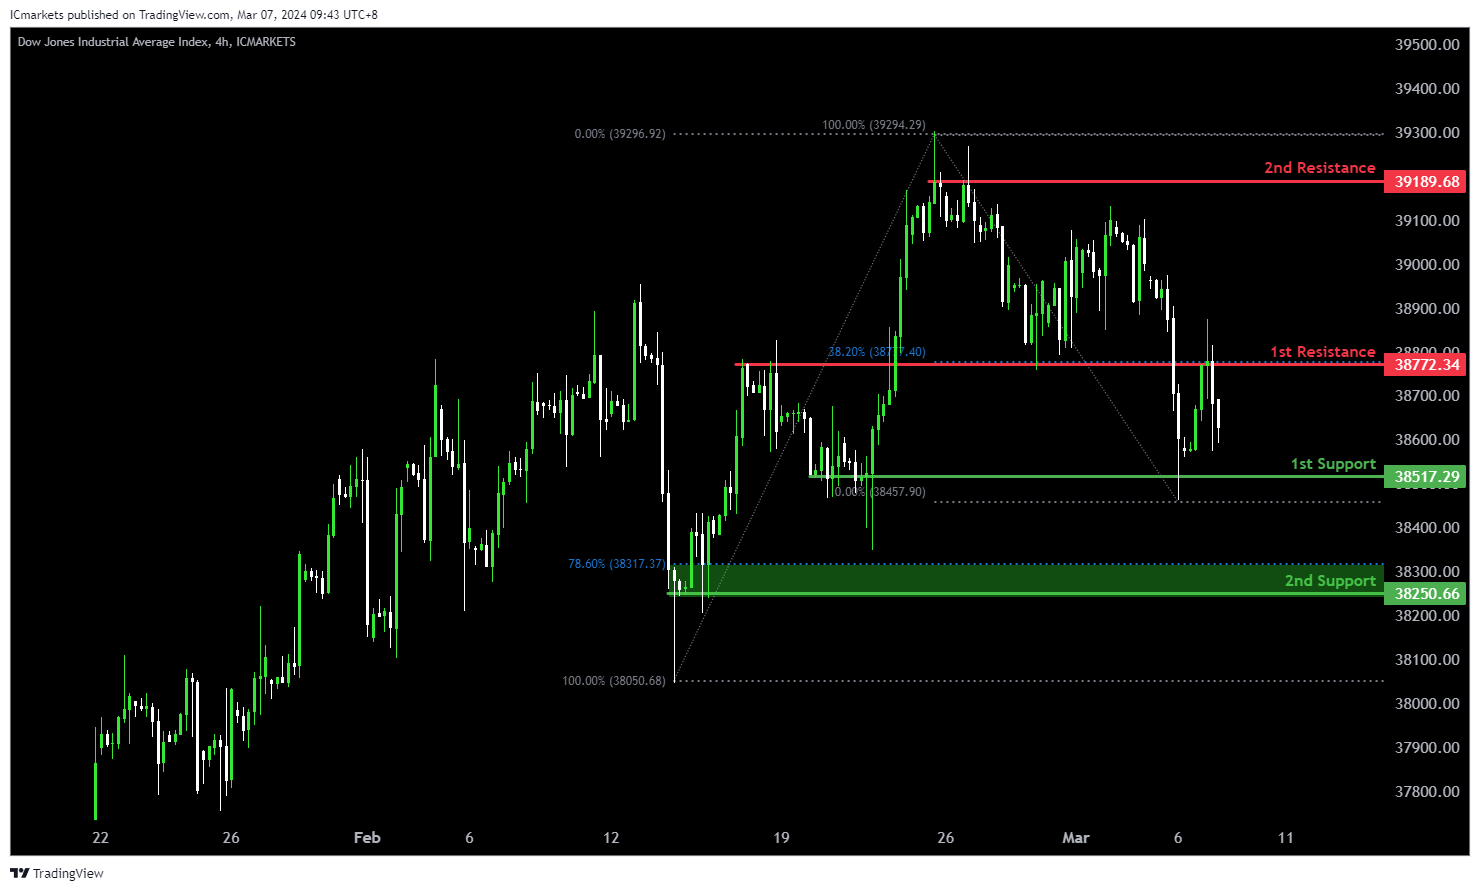
DJ30:
The DJ30 chart currently demonstrates a bearish momentum, indicating a potential continuation of the downward trend. Several factors support the possibility of a bearish movement towards the 1st support level.
The 1st support at 38517.29 corresponds to a swing low support, suggesting a significant historical level where buying interest might emerge. Additionally, the 2nd support at 38250.66 aligns with another swing low support and the 78.60% Fibonacci Retracement level, further reinforcing its significance as a potential area of support.
On the resistance side, the 1st resistance level at 38772.34 is characterized as an overlap resistance, indicating a historical barrier to upward movement. Furthermore, the confluence with the 38.20% Fibonacci Retracement adds to its significance as a potential barrier to further bullish movement.
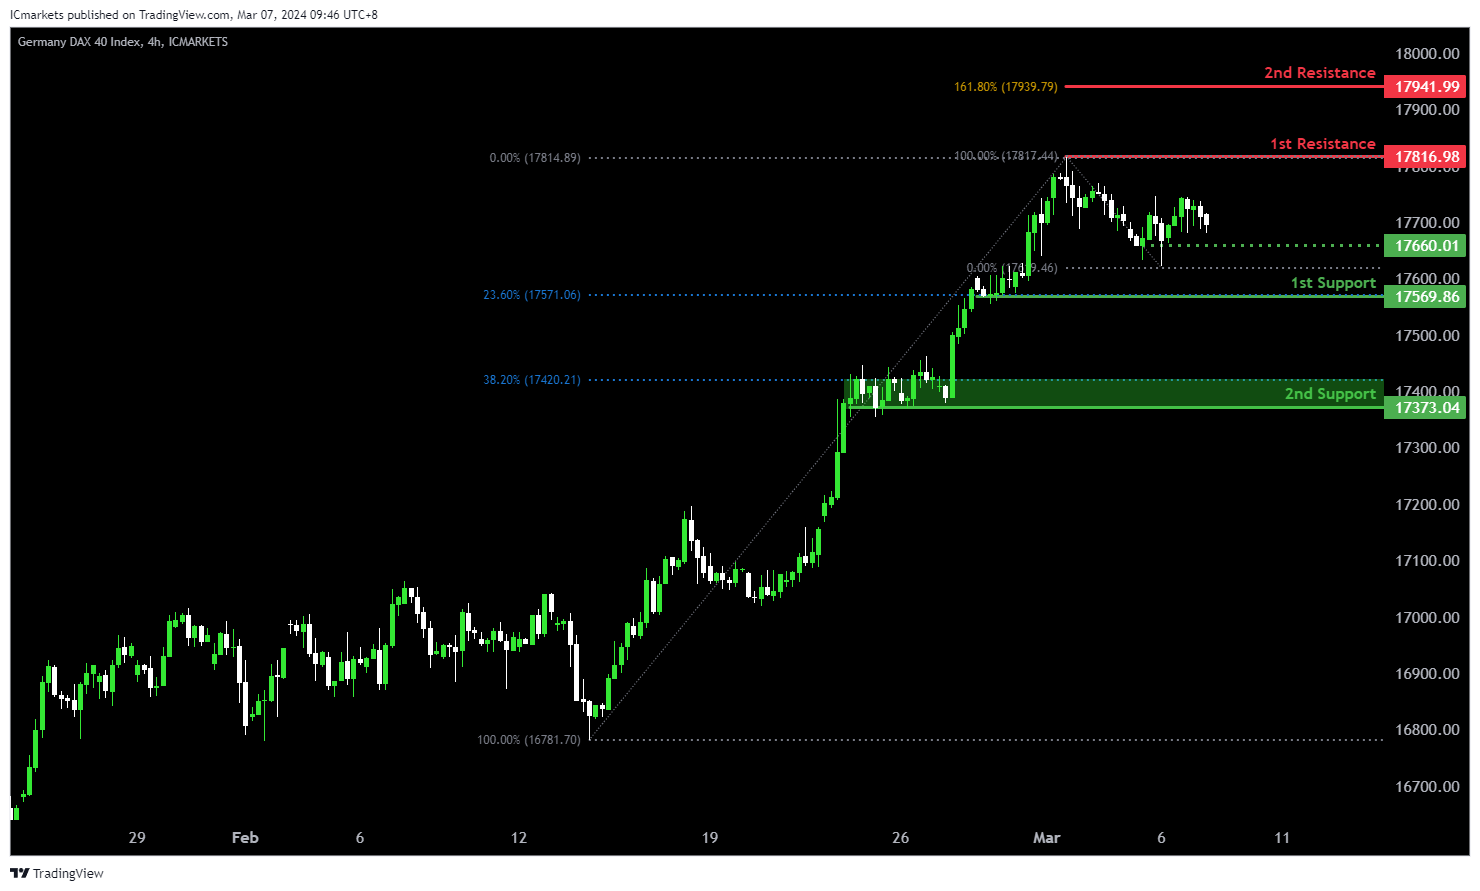
GER40:
The GER40 chart currently demonstrates a bearish momentum, suggesting a potential continuation of the downward trend. Several factors support the possibility of a bearish movement towards the 1st support level.
The 1st support at 17569.86 corresponds to a swing low support, indicating a significant historical level where buying interest might emerge. Additionally, the 2nd support at 17373.04 aligns with another swing low support and the 38.20% Fibonacci Retracement level, further reinforcing its significance as a potential area of support.
On the resistance side, the 1st resistance level at 17816.98 is characterized as a swing high resistance, suggesting a historical barrier to upward movement. Furthermore, the confluence with the 161.80% Fibonacci Extension adds to its significance as a potential barrier to further bullish movement.
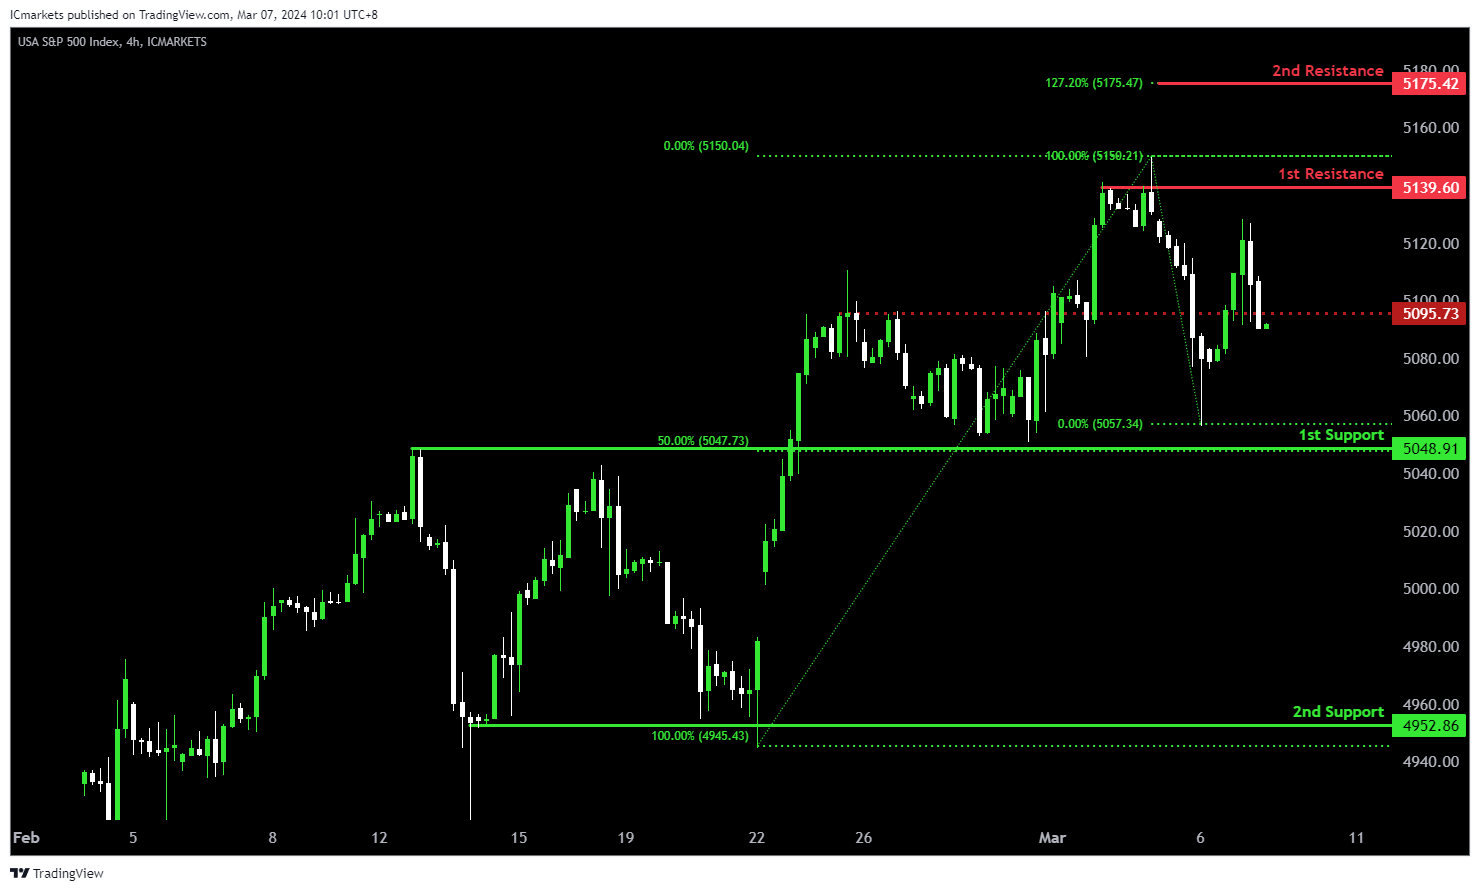
US500:
The US500 chart currently reflects a bearish momentum, suggesting a potential continuation of the downward trend. Several factors support the possibility of a bearish movement towards the 1st support level.
The 1st support at 5048.91 aligns with a pullback support and the 50% Fibonacci Retracement level, indicating a significant historical level where buying interest may emerge. Additionally, the 2nd support at 4952.86 corresponds to a swing low support, further reinforcing its importance as a potential area of support.
On the resistance side, the 1st resistance level at 5139.60 is identified as a swing high resistance, suggesting a historical barrier to upward movement. Furthermore, the 2nd resistance level at 5175.42 coincides with the 127.20% Fibonacci Extension, adding to its significance as a potential barrier to further bullish movement. Additionally, the intermediate resistance at 5095.7 is characterized as a swing high resistance, providing additional reinforcement to the resistance structure.
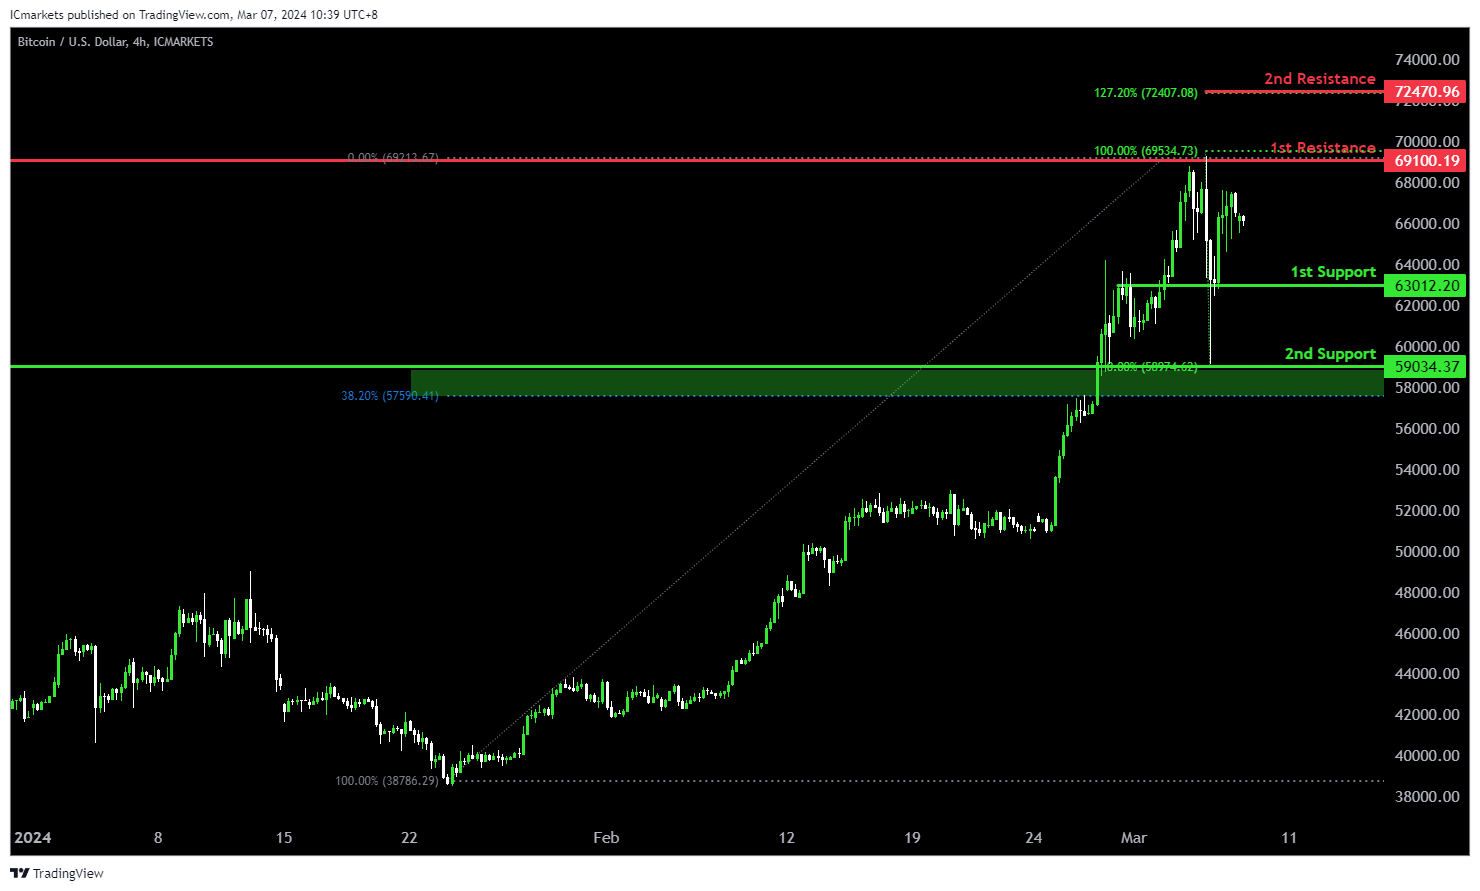
BTC/USD:
The BTC/USD chart currently indicates a bullish momentum, suggesting a potential continuation of the upward trend. Several factors support the possibility of a bullish movement towards the 1st resistance level.
The 1st support at 63012.20 aligns with an overlap support, indicating a significant historical level where buying interest may emerge. Additionally, the 2nd support at 59034.37 corresponds to a pullback support and the 38.20% Fibonacci Retracement level, further reinforcing its importance as a potential area of support.
On the resistance side, the 1st resistance level at 69100.19 is identified as a swing high resistance, suggesting a historical barrier to upward movement. Moreover, the 2nd resistance level at 72470.96 coincides with the 127.20% Fibonacci Extension, adding to its significance as a potential barrier to further bullish movement.
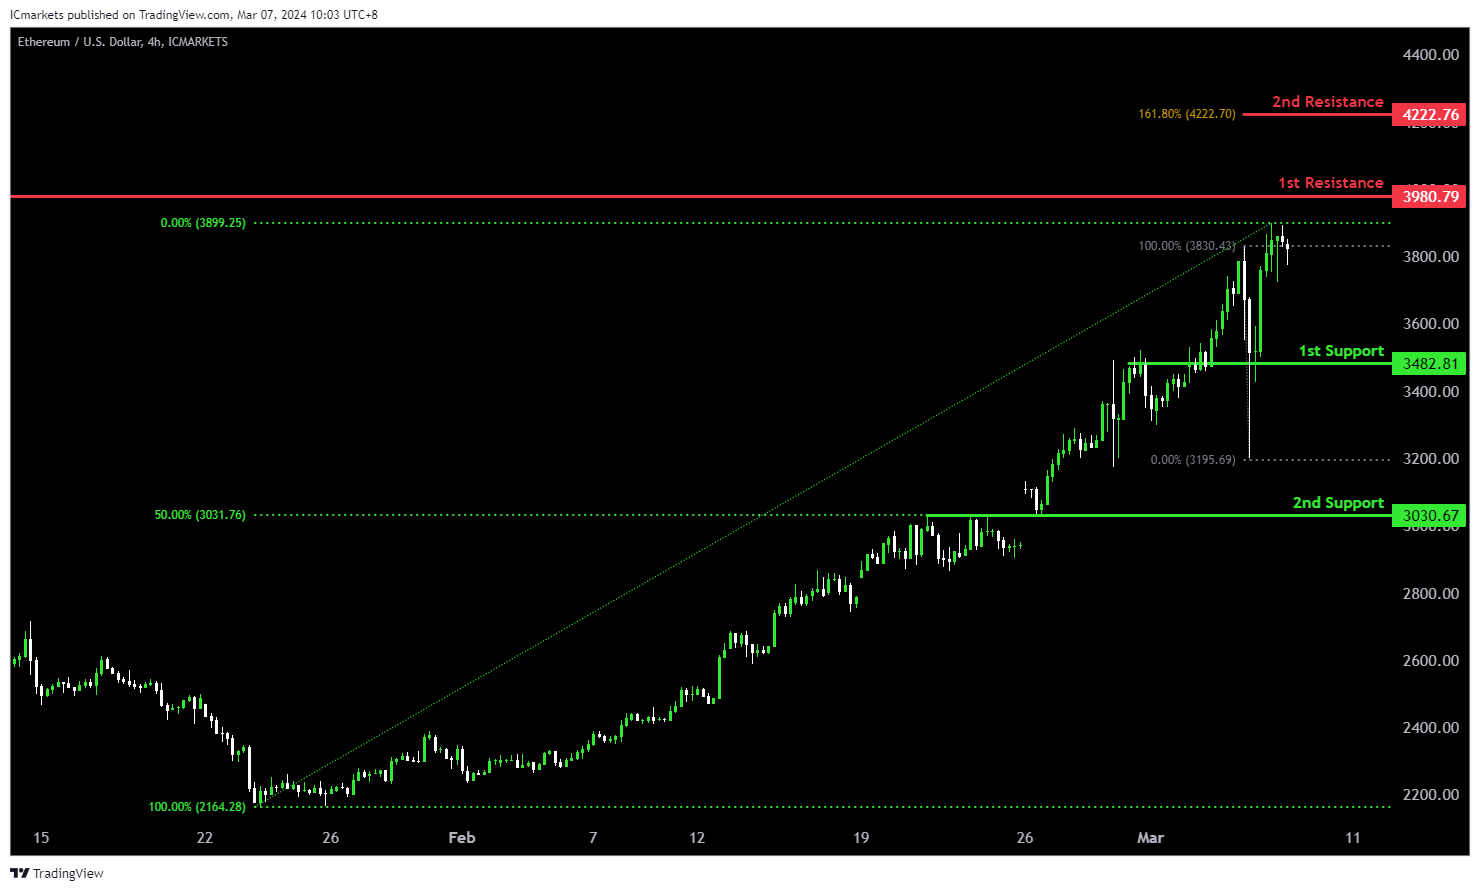
ETH/USD:
The ETH/USD chart currently exhibits bullish momentum, supported by several factors contributing to the upward movement.
The 1st support at 3482.81 aligns with an overlap support, indicating a significant historical level where buying interest is present. Additionally, the 2nd support at 3030.67 corresponds to another overlap support and coincides with the 50% Fibonacci Retracement level, further reinforcing its significance as a potential area of support.
On the resistance side, the 1st resistance level at 3980.79 is characterized as an overlap resistance, suggesting a historical barrier to upward movement. Furthermore, the 2nd resistance level at 4222.76 aligns with the 161.80% Fibonacci Extension, adding to its significance as a potential barrier to further bullish movement.
WTI/USD:
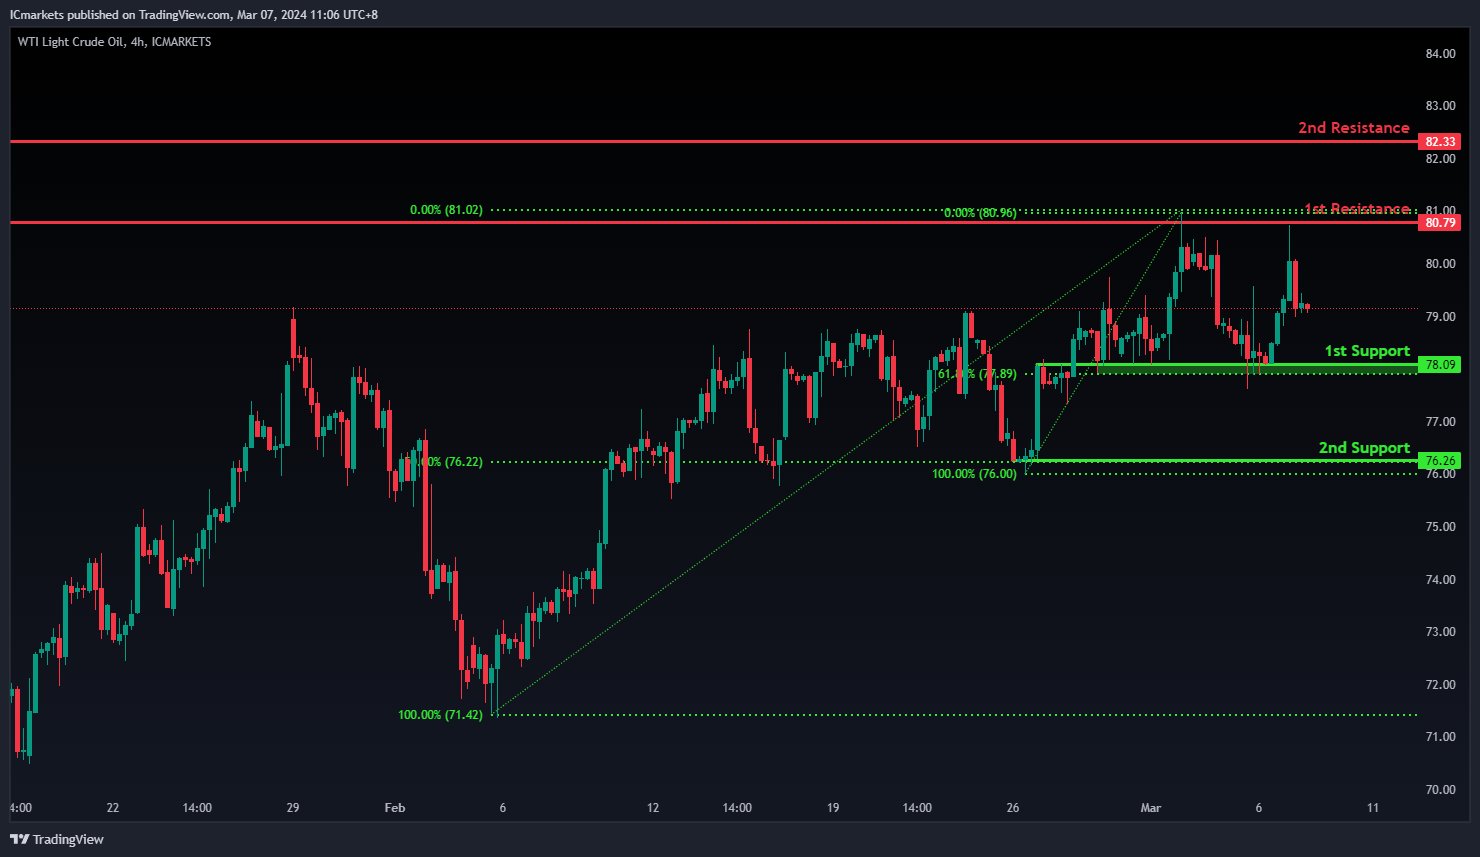
The WTI (West Texas Intermediate) oil chart currently exhibits an overall bullish momentum. However, there is a potential scenario for price to fall towards the 1st support before making a bullish bounce and rise towards the 1st resistance.
The 1st support level at 78.09 is identified as an overlap support that aligns with the 61.80% Fibonacci Retracement level. Further below, the 2nd support level at 76.26 is marked as a pullback support that aligns with the 50.00% Fibonacci Retracement level, reinforcing its significance as a key support level.
To the upside, the 1st resistance level at 80.79 is identified as an overlap resistance. Higher up, the 2nd resistance level at 82.33 is marked as a pullback resistance, further highlighting its importance as a potential resistance zone.
XAU/USD (GOLD):
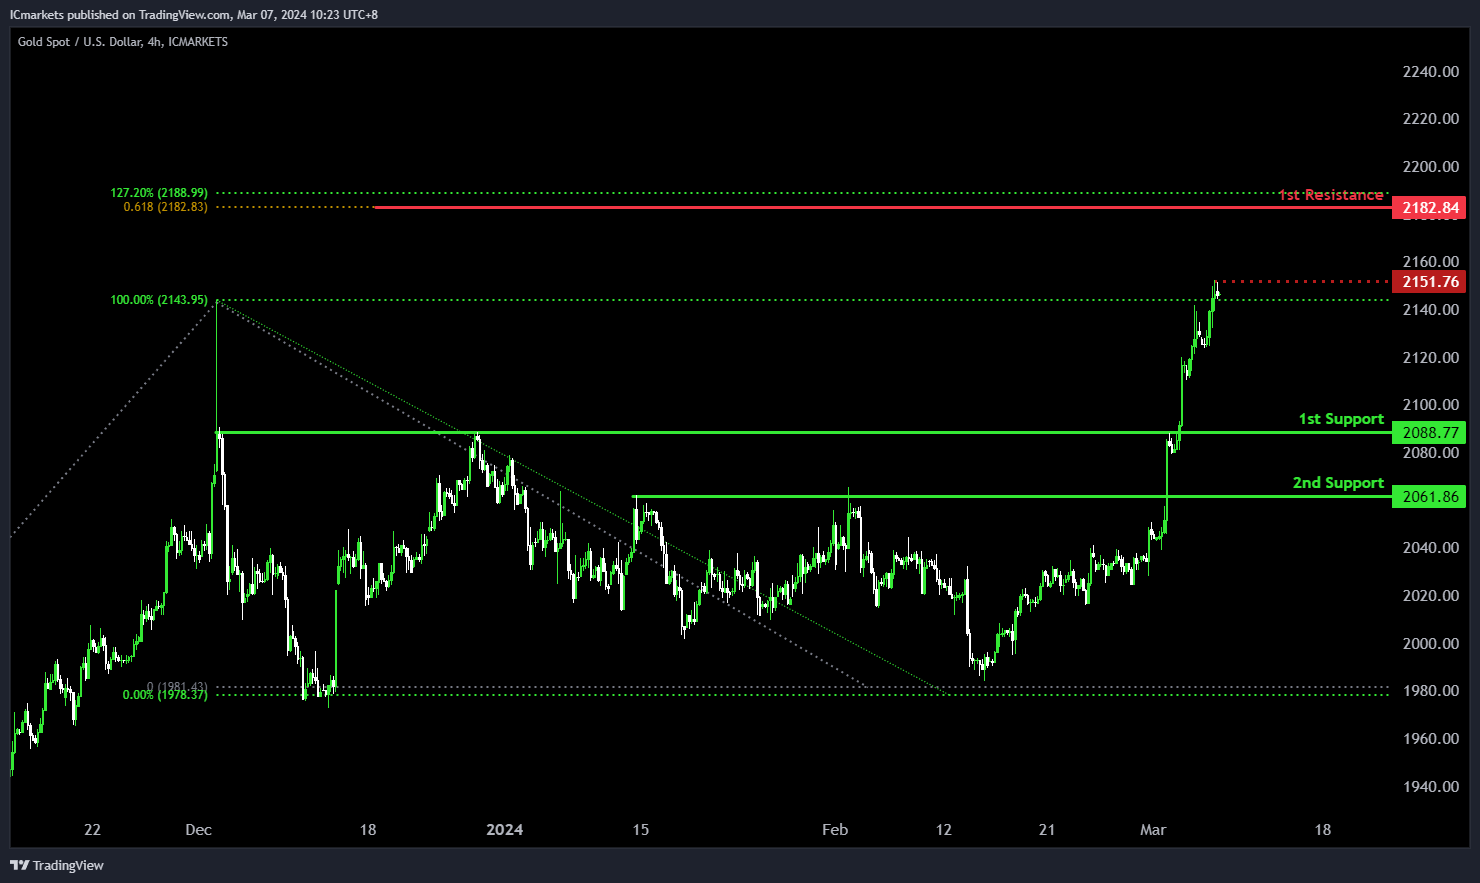
The XAUUSD (Gold) chart currently demonstrates bullish momentum, suggesting a potential scenario of a drop further to the 1st support in the short term before bouncing from there and rising to the 1st resistance.
The 1st support level at 2088.77 is identified as a pullback support, indicating its historical significance as a level where buying interest has emerged to support the price.
Furthermore, the 2nd support at 2061.86 is characterized as another pullback support, reinforcing its importance as a level where buyers may intervene to prevent further decline.
On the resistance side, the 1st resistance level at 2182.84 is highlighted, corresponding to the 61.80% Fibonacci Projection. This level may act as a barrier where selling pressure could increase, potentially limiting upward movement.
Additionally, the intermediate resistance at 2151.76 is noted as a swing high resistance, further solidifying its significance as a level where selling interest may intensify.
USD/JPY Daily Outlook
Daily Pivots: (S1) 148.98; (P) 149.53; (R1) 149.97; More...
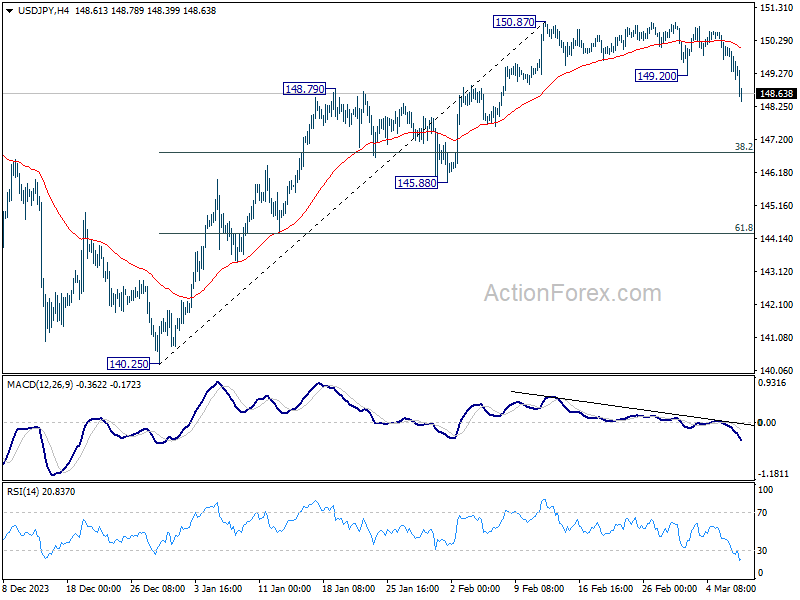
Intraday bias in USD/JPY back on the downside with strong break of 149.20 support. Fall from 150.87 could either be correcting the rise from 140.25, or completely reversing it. In either case, deeper decline is expected to 38.2% retracement of 140.25 to 150.87 at 146.81. Sustained break there will bolster the latter case, and target 61.8% retracement at 144.30 and below. For now, risk will stay on the downside as long as 150.87 resistance holds, in case of recovery.
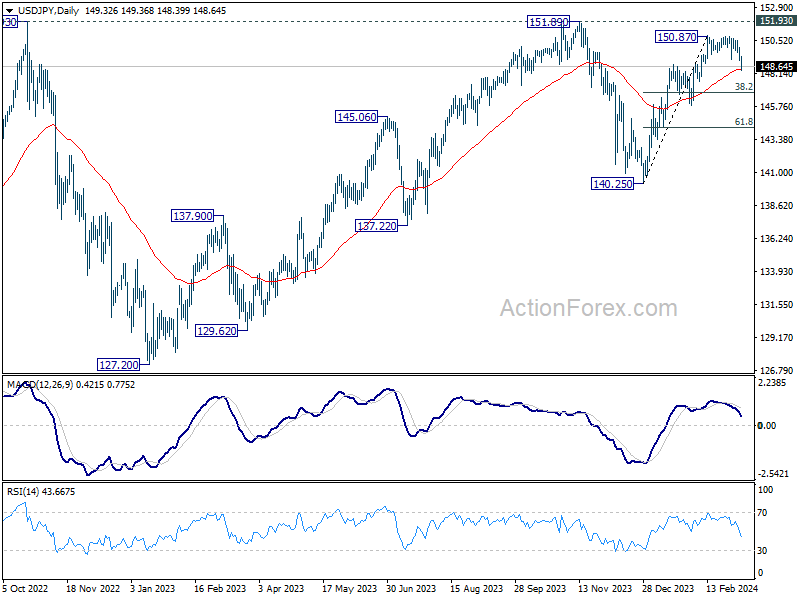
In the bigger picture, outlook is mixed up as fall from 150.87 accelerates lower. Sustained trading below 55 D EMA (now at 148.45) will open up the case that corrective pattern from 151.89 (2023 high) is extending, with fall from 150.87 as the third leg. In this case, deeper decline would be seen to 140.25 support or below. Nevertheless, strong bounce from 55 D EMA will retain near term bullishness for at least another take on 151.89.
Dollar’s Slide Deepens, Yen Bolstered by Wage Optimism, Euro Awaits ECB
Dollar fell sharply overnight and the broad-based decline extended into Asian session today. Some analysts attributed this selloff to Fed Chair Jerome Powell's commentary during his Congressional testimony. Powell's mention of needing "a little bit more data" before contemplating rate cuts has ignited a wave of speculation among investors and analysts alike, interpreting this statement as an implicit nod towards the possibility of a rate cut as soon as May. However, such expectations seem to be only minimally mirrored in Fed funds futures, which currently peg the likelihood of May cut at a modest 20%. Instead, Dollar's weakness seems more intricately tied to the extended decline in treasury yields, coupled with sustained appetite for riskier assets across global markets.
Meanwhile, Japanese Yen embarked on a significant rally today, spurred by the latest wages growth data from Japan, which exceeded expectations and marked the highest increase since last June. This robust wage growth intensified speculation around rate hike by BoJ at this month's meeting. Adding fuel to the fire, remarks from BoJ board member Junko Nakagawa have lent further credence to the prospect of imminent monetary tightening. The positive momentum for Yen is also supported by encouraging developments within Japan's labor market. Notably UA Zensen, Japan's foremost industrial labor group, reported that 25 of its member unions have successfully secured their wage demands in full from management. The culmination of these wage negotiations over the next week is eagerly anticipated, setting the stage for BoJ's policy decision on March 19.
As for the week, Yen is currently the standout performer. Australian and New Zealand Dollars are trailing closely behind, buoyed by China's better-than-expected trade data. Conversely, Dollar languishes at the bottom of the performance chart, with Swiss Franc and Canadian Dollar also facing downward pressures. Euro and the Sterling occupy the middle ground, with all eyes set on the impending ECB rate decision and its accompanying economic projections for further directional cues.
Technically, USD/JPY's firm break of 149.20 is probably a leading signal of near term bearish signal in Yen pairs. Attention will now be on 161.67 support in EUR/JPY and 189.02 support in GBP/JPY. Decisive break of these levels will open up deeper, broad-based decline in Yen pairs, even as a corrective pullback.
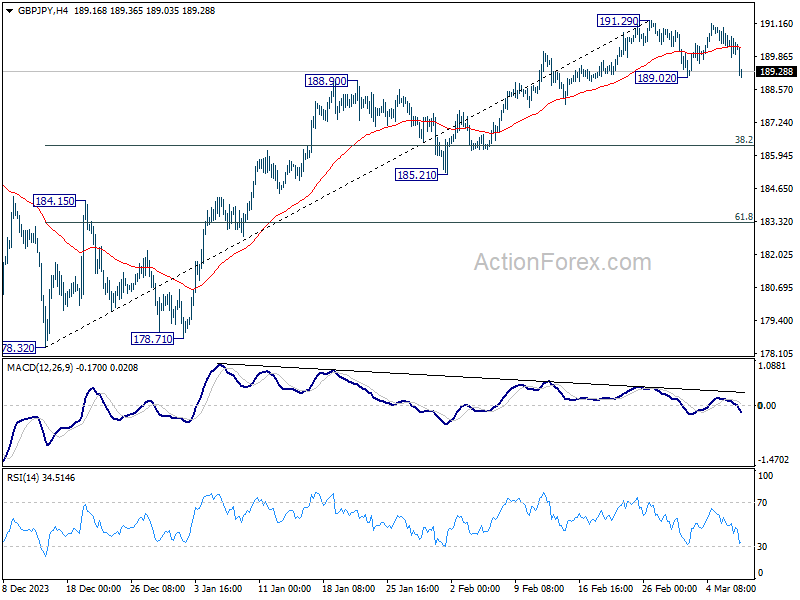
In Asia, at the time of writing, Nikkei is down -1.00%. Hong Kong HSI is down -0.56%. China Shanghai SSE is down -0.23%. Singapore Strait Times is down -0.08%. Japan 10-year JGB yield is up 0.0170 at 0.735. Overnight, DOW rose 0.20%. S&P 500 rose 0.51%. NASDAQ rose 0.58%. 10-year yield fell -0.033 to 4.104.
BoJ's Nakagawa: Promising cycle of wages and inflation on the horizon
BoJ board member Junko Nakagawa highlighted a promising outlook for wage growth, expressed confidence in the emergence of a positive cycle between inflation and wages, a prerequisite for the central bank to exit negative interest rate.
"We can say that prospects for the economy to achieve a positive cycle of inflation and wages are in sight," she stated, pointing to a shift in the wage-setting behavior of companies as a sign of economic optimism.
According to Nakagawa, there are "clear signs of change in how companies set wages," with businesses increasingly inclined to offer annual pay raises in response to the ongoing labor shortages. This adjustment marks a significant departure from previous practices and suggests that companies are prepared to propose wage increases surpassing those of the previous year.
"Japan is moving steadily towards sustainably and stably achieving our 2% inflation target," she remarked.
Japan's nominal wage growth hits seven-month high, real wages still in decline
Japan's nominal wage growth surged by 2.0% yoy in January, surpassing expectations of 1.3%, and marking the most substantial growth since last June. This also represents a notable acceleration from the revised 0.8% increase observed in December.
The surge in wages largely stems from a significant 16.2% yoy advance in special payments, which include winter bonuses. Regular or base salaries maintained steady growth rate of 1.4% yoy, consistent with the previous month's performance. Meanwhile, overtime pay, a key indicator of labor demand and economic activity, showed slight improvement of 0.4% yoy, recovering from revised decline of -1.2% yoy in the prior period.
Real wages declined by 0.6% yoy, marking a continued decrease in purchasing power for Japanese workers. However, the pace of decline was the joint-slowest since December 2022, indicating stabilization in the erosion of real earnings.
China's exports jump 7.1% yoy in Jan-Feb, imports rise 3.5% yoy
Title: China's Trade Performance Surpasses Expectations Amid PBOC's Supportive Measures
China's trade figures for the combined period of January and February have remarkably exceeded expectations, with exports rising by 7.1% yoy , surpassing the anticipated 1.9% increase. Imports also showed a robust performance, climbing 3.5% yoy, which beat the forecast of 1.5% growth.
This led to trade surplus of USD 125.2B, not only exceeding the expected USD 110.3B but also marking an increase from last year's USD 103.8B during the same period.
Separately, Pan Gongsheng, PBoC, pointed out yesterday that there was room for further reductions in banks' reserve requirement ratios the percentage of reserves banks are required to hold against deposits. Such a move would free up additional liquidity for lending and investment, potentially stimulating economic activity.
Fed's Beige Book reveals modest economic growth and easing labor market tightness
Fed's Beige Book report noted "slight to modest" increase in economic activity across various districts. Specifically, eight districts reported slight to modest growth, three observed no change, and one experienced slight softening in economic conditions.
In the realm of consumer spending, the report indicates slight downturn, especially concerning retail goods. This trend is attributed to a "heightened price sensitivity" among consumers, who are increasingly opting to trade down and shift their spending away from discretionary goods. Manufacturing activity remained "largely unchanged", with disruptions in shipping through the Red Sea and Panama Canal reportedly having minimal overall impact.
The report also highlights persistent price pressures, although some districts observed moderation in inflation. Businesses are finding it increasingly difficult to pass higher costs onto customers, who are becoming more resistant to price increases. Labor market conditions have shown further signs of improvement, with nearly all districts reporting increased labor availability and enhanced employee retention.
Fed's Kashkari sees two, or maybe just one rate cut this year
Minneapolis Fed President Neel Kashkari has refined his expectations for interest rate cuts in 2024, now leaning towards possibility of fewer reductions due to robust economic data emerging since the year's start.
Initially forecasting two rate cuts for the year, Kashkari expressed in a WSJ Live interview that current economic indicators might necessitate only a single cut. "I was at two in December," he remarked. "It's hard to see, with the data that's come in, that I'd be saying more cuts than I had in December, or potentially one fewer, but I haven't decided."
Kashkari emphasized that Fed's "base case scenario" no longer includes further rate hikes. He suggested that should inflation persist beyond current projections, Fed's immediate response would be to maintain the existing interest rates for "an extended period of time." rather than implementing additional increases.
Euro mixed awaiting ECB's rate cut perspective
ECB is widely anticipated to maintain main refinancing rate at 4.50% and deposit rate at 4.00% in today's meeting. There is clear consensus among officials on the plan for rate cuts this year. However, the timing and pace of these reductions remain subjects of debate among them.
Economists generally agree on a June timeline for the initial rate reduction, citing that current economic indicators do not yet justify an earlier move. Also, ECB is expected to await further wage data due in May, rendering an April cut less probable.
Key points of interest in today's meeting include: the possibility of a rate cut being actually discussed, any indicative changes in the statement towards policy easing, and, importantly, the new economic projections. These projections are key to understanding the ECB's confidence in returning inflation to its 2% symmetric target within a feasible timeframe.
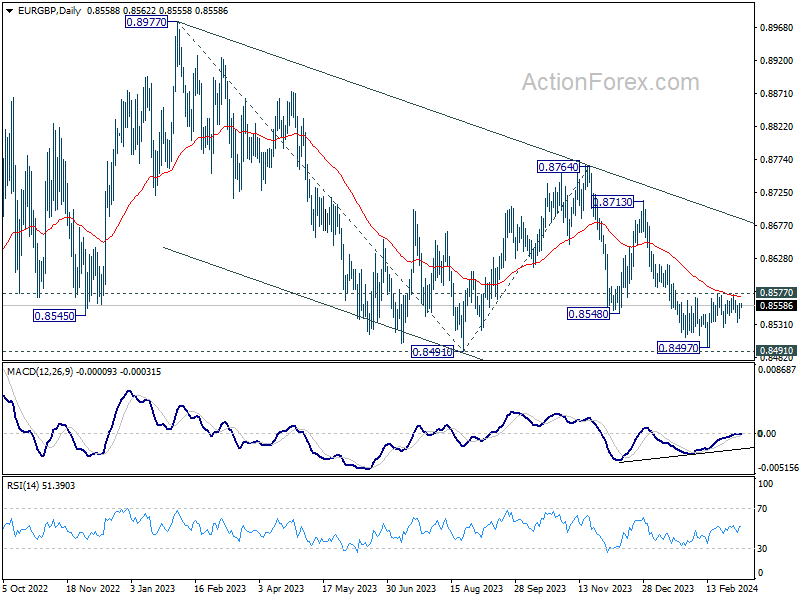
Euro's performance this week has been mixed, registering gains against Dollar, Swiss Franc, and Canadian Dollar, but falling short against other major counterparts. A significant focal point will be EUR/GBP's response to the ECB's decisions.
Decisive break of 0.8577 resistance and sustained trading above 55 D EMA (now at 0.8571) will argue that fall from 0.8764 has completed at 0.8497, after successfully defending 0.8491 medium term support (2023 low). In this case, near term outlook will be turned bullish for stronger rise back towards 0.8713/8764 resistance zone.
On the data front
Swiss unemployment rate and foreign currency reserves, and Germany factory orders will be released in European sesision. Later in the day, Canada will release building permits and trade balance; US will release jobless claims and trade balance.
USD/JPY Daily Outlook
Daily Pivots: (S1) 148.98; (P) 149.53; (R1) 149.97; More...
Intraday bias in USD/JPY back on the downside with strong break of 149.20 support. Fall from 150.87 could either be correcting the rise from 140.25, or completely reversing it. In either case, deeper decline is expected to 38.2% retracement of 140.25 to 150.87 at 146.81. Sustained break there will bolster the latter case, and target 61.8% retracement at 144.30 and below. For now, risk will stay on the downside as long as 150.87 resistance holds, in case of recovery.
In the bigger picture, outlook is mixed up as fall from 150.87 accelerates lower. Sustained trading below 55 D EMA (now at 148.45) will open up the case that corrective pattern from 151.89 (2023 high) is extending, with fall from 150.87 as the third leg. In this case, deeper decline would be seen to 140.25 support or below. Nevertheless, strong bounce from 55 D EMA will retain near term bullishness for at least another take on 151.89.
Economic Indicators Update
| GMT | Ccy | Events | Actual | Forecast | Previous | Revised |
|---|---|---|---|---|---|---|
| 21:45 | NZD | Manufacturing Sales Q4 | -0.70% | -2.80% | ||
| 23:30 | JPY | Labor Cash Earnings Y/Y Jan | 2.00% | 1.30% | 1.00% | 0.80% |
| 00:30 | AUD | Trade Balance (AUD) Feb | 11.03B | 11.50B | 10.96B | 10.74B |
| 03:00 | CNY | Trade Balance (USD) Feb | 125.2B | 110.3B | 75.3B | |
| 03:00 | CNY | Trade Balance (CNY) Feb | 891B | 620B | 541B | |
| 06:45 | CHF | Unemployment Rate Feb | 2.20% | 2.20% | ||
| 07:00 | EUR | Germany Factory Orders M/M Jan | -6.00% | 8.90% | ||
| 08:00 | CHF | Foreign Currency Reserves (CHF) Feb | 662B | |||
| 13:15 | EUR | ECB Main Refinancing Rate | 4.50% | 4.50% | ||
| 13:30 | CAD | Trade Balance (CAD) Jan | 0.3B | -0.3B | ||
| 13:30 | CAD | Building Permits M/M Jan | 2.10% | -14% | ||
| 13:30 | USD | Initial Jobless Claims (Mar 1) | 212K | 215K | ||
| 13:30 | USD | Trade Balance (USD) Jan | -63.2B | -62.2B | ||
| 13:30 | USD | Nonfarm Productivity Q4 | 3.20% | 3.20% | ||
| 13:30 | USD | Unit Labor Costs Q4 | 0.50% | 0.50% | ||
| 13:45 | EUR | ECB Press Conference | ||||
| 15:00 | USD | Fed's Chair Powell testifies | ||||
| 15:30 | USD | Natural Gas Storage | -42B | -96B |
Euro mixed awaiting ECB’s rate cut perspective
ECB is widely anticipated to maintain main refinancing rate at 4.50% and deposit rate at 4.00% in today's meeting. There is clear consensus among officials on the plan for rate cuts this year. However, the timing and pace of these reductions remain subjects of debate among them.
Economists generally agree on a June timeline for the initial rate reduction, citing that current economic indicators do not yet justify an earlier move. Also, ECB is expected to await further wage data due in May, rendering an April cut less probable.
Key points of interest in today's meeting include: the possibility of a rate cut being actually discussed, any indicative changes in the statement towards policy easing, and, importantly, the new economic projections. These projections are key to understanding the ECB's confidence in returning inflation to its 2% symmetric target within a feasible timeframe.
Euro's performance this week has been mixed, registering gains against Dollar, Swiss Franc, and Canadian Dollar, but falling short against other major counterparts. A significant focal point will be EUR/GBP's response to the ECB's decisions.
Decisive break of 0.8577 resistance and sustained trading above 55 D EMA (now at 0.8571) will argue that fall from 0.8764 has completed at 0.8497, after successfully defending 0.8491 medium term support (2023 low). In this case, near term outlook will be turned bullish for stronger rise back towards 0.8713/8764 resistance zone.
China’s exports jump 7.1% yoy in Jan-Feb, imports rise 3.5% yoy
China's trade figures for the combined period of January and February have remarkably exceeded expectations, with exports rising by 7.1% yoy , surpassing the anticipated 1.9% increase. Imports also showed a robust performance, climbing 3.5% yoy, which beat the forecast of 1.5% growth.
This led to trade surplus of USD 125.2B, not only exceeding the expected USD 110.3B but also marking an increase from last year's USD 103.8B during the same period.
Separately, Pan Gongsheng, PBoC, pointed out yesterday that there was room for further reductions in banks' reserve requirement ratios the percentage of reserves banks are required to hold against deposits. Such a move would free up additional liquidity for lending and investment, potentially stimulating economic activity.
Dollar Index (DXY) Should Continue Lower
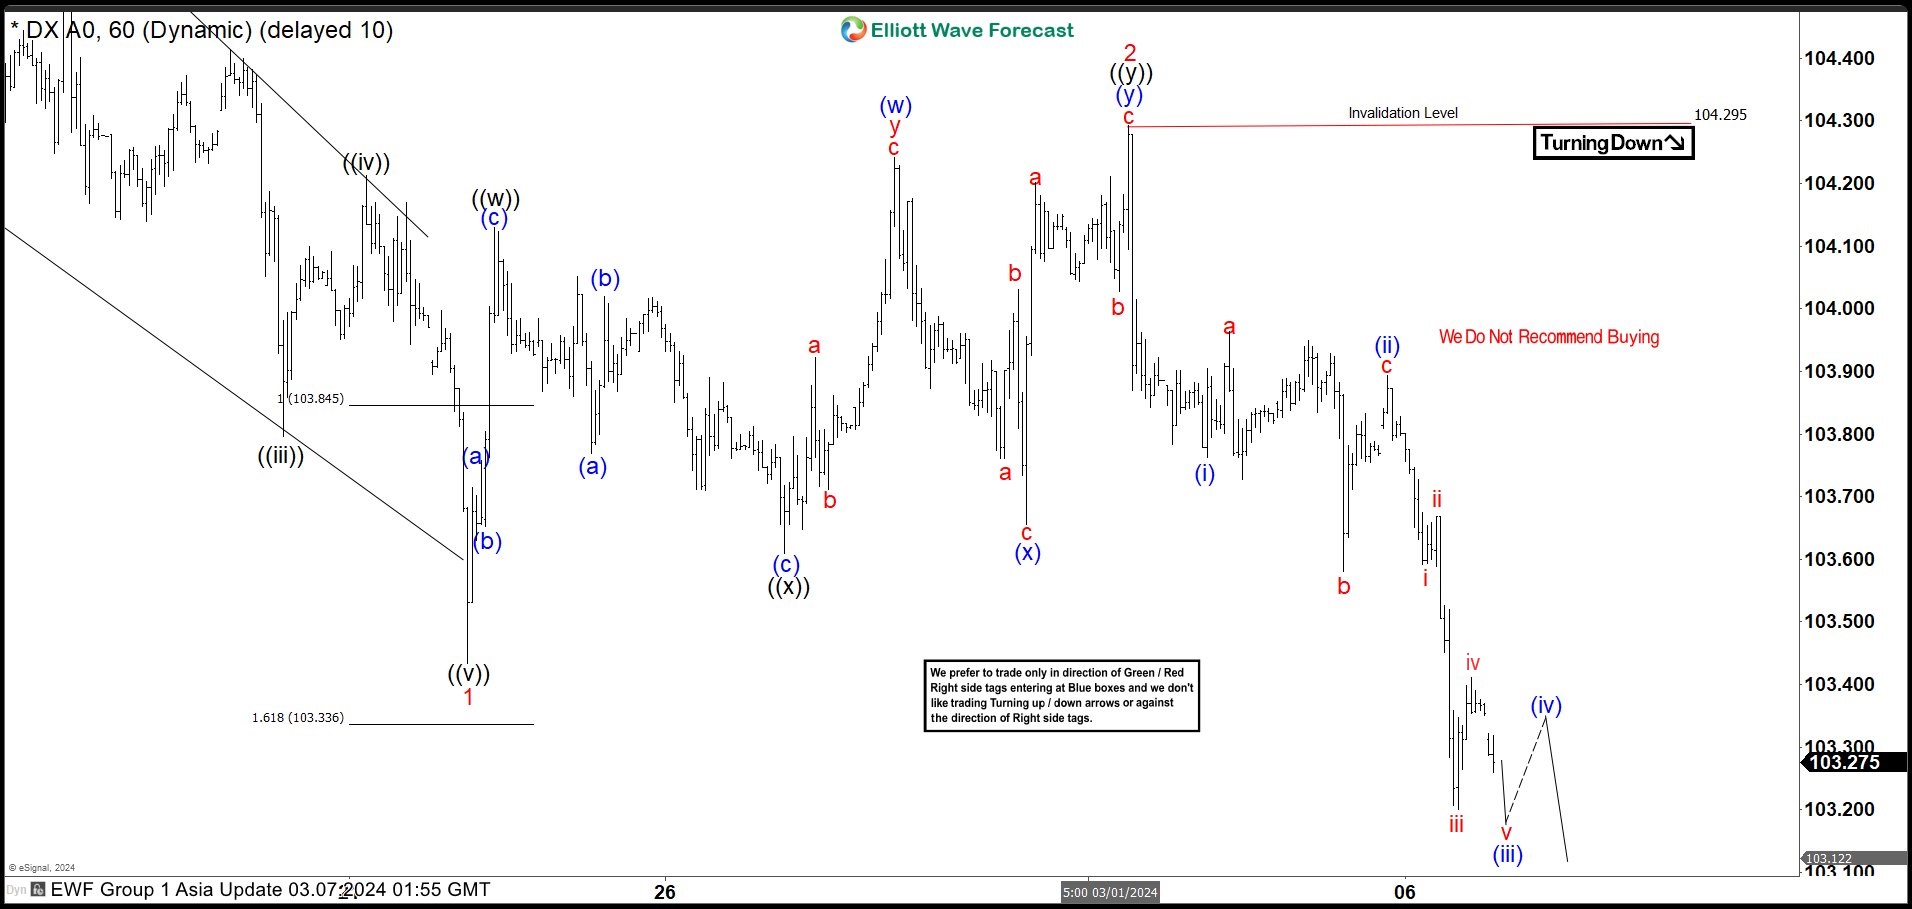
Short Term cycle in Dollar Index (DXY) shows an incomplete bearish sequence from 2.14.2024 high favoring further downside. Down from 2.14.2024 high, wave 1 ended at 103.43 as an impulsive structure. Wave ((i)) ended at 104.18 and wave ((ii)) ended at 104.67. Wave ((iii)) lower ended at 103.79 and rally in wave ((iv)) ended at 104.21. Final leg wave ((v)) lower ended at 103.43 which completed wave 1 in higher degree. The Index then corrected in wave 2 with internal subdivision as a double three Elliott Wave structure.
Up from wave 1, wave ((w)) ended at 104.13 and dips in wave ((x)) ended at 103.6. Internal subdivision of wave ((x)) subdivided into a zigzag structure. Down from wave ((w)), wave (a) ended at 103.76 and wave (b) ended at 104. Wave (c) lower ended at 103.6 which completed wave ((x)). The Index then turned higher in wave ((y)) as a double three. Up from wave ((x)), wave (w) ended at 104.24 and wave (x) ended at 103.65. Wave (y) higher ended at 104.29 which completed wave ((y)) of 2 in higher degree. The Index has extended lower in wave 3. Down from wave 2, wave (i) ended at 103.76 and wave (ii) ended at 103.89. Expect the Index to extend lower and rally to fail in 3, 7, or 11 swing for further downside.
Dollar Index (DXY) 60 Minutes Elliott Wave Chart
DXY Elliott Wave Video
https://www.youtube.com/watch?v=EbT-iOyCdD0