

Sample Category Title
(ECB) Monetary policy decisions
The Governing Council today decided to keep the three key ECB interest rates unchanged. Since the last Governing Council meeting in January, inflation has declined further. In the latest ECB staff projections, inflation has been revised down, in particular for 2024 which mainly reflects a lower contribution from energy prices. Staff now project inflation to average 2.3% in 2024, 2.0% in 2025 and 1.9% in 2026. The projections for inflation excluding energy and food have also been revised down and average 2.6% for 2024, 2.1% for 2025 and 2.0% for 2026. Although most measures of underlying inflation have eased further, domestic price pressures remain high, in part owing to strong growth in wages. Financing conditions are restrictive and the past interest rate increases continue to weigh on demand, which is helping push down inflation. Staff have revised down their growth projection for 2024 to 0.6%, with economic activity expected to remain subdued in the near term. Thereafter, staff expect the economy to pick up and to grow at 1.5% in 2025 and 1.6% in 2026, supported initially by consumption and later also by investment.
The Governing Council is determined to ensure that inflation returns to its 2% medium-term target in a timely manner. Based on its current assessment, the Governing Council considers that the key ECB interest rates are at levels that, maintained for a sufficiently long duration, will make a substantial contribution to this goal. The Governing Council's future decisions will ensure that policy rates will be set at sufficiently restrictive levels for as long as necessary.
The Governing Council will continue to follow a data-dependent approach to determining the appropriate level and duration of restriction. In particular, the Governing Council's interest rate decisions will be based on its assessment of the inflation outlook in light of the incoming economic and financial data, the dynamics of underlying inflation and the strength of monetary policy transmission.
Key ECB interest rates
The interest rate on the main refinancing operations and the interest rates on the marginal lending facility and the deposit facility will remain unchanged at 4.50%, 4.75% and 4.00% respectively.
Asset purchase programme (APP) and pandemic emergency purchase programme (PEPP)
The APP portfolio is declining at a measured and predictable pace, as the Eurosystem no longer reinvests the principal payments from maturing securities.
The Governing Council intends to continue to reinvest, in full, the principal payments from maturing securities purchased under the PEPP during the first half of 2024. Over the second half of the year, it intends to reduce the PEPP portfolio by €7.5 billion per month on average. The Governing Council intends to discontinue reinvestments under the PEPP at the end of 2024.
The Governing Council will continue applying flexibility in reinvesting redemptions coming due in the PEPP portfolio, with a view to countering risks to the monetary policy transmission mechanism related to the pandemic.
Refinancing operations
As banks are repaying the amounts borrowed under the targeted longer-term refinancing operations, the Governing Council will regularly assess how targeted lending operations and their ongoing repayment are contributing to its monetary policy stance.
***
The Governing Council stands ready to adjust all of its instruments within its mandate to ensure that inflation returns to its 2% target over the medium term and to preserve the smooth functioning of monetary policy transmission. Moreover, the Transmission Protection Instrument is available to counter unwarranted, disorderly market dynamics that pose a serious threat to the transmission of monetary policy across all euro area countries, thus allowing the Governing Council to more effectively deliver on its price stability mandate.
The President of the ECB will comment on the considerations underlying these decisions at a press conference starting at 14:45 CET today.
USD/JPY Outlook: Japanese Yen Accelerates Dains vs Dollar on Growing Signals of BoJ Policy Shift
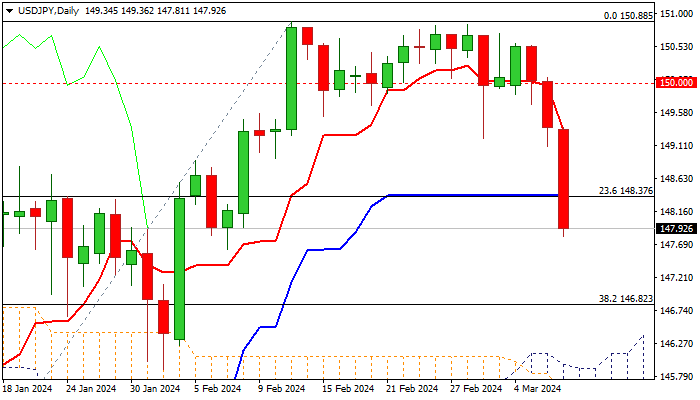
Bears accelerate on Thursday (USDJPY was down 1% in Asian / European session) extending steep fall into third straight day.
Fresh weakness broke below initial Fibo support at 148.37 (23.6% of 140.25/150.88 rally, reinforced by daily Kijun-sen) generating initial reversal signal and warning of deeper drop.
Bears cracked 100DMA (147.81) which produced some headwinds, with break lower to open way towards targets at 146.82 (Fibo 38.2%) and 146.10 (200DMA).
Momentum indicator on daily chart is heading south, deeper into negative territory and contributes to negative near-term outlook.
Japanese yen strengthened (on track for the biggest daily gain vs US dollar this year) on growing speculations that the Bank of Japan could start raising interest rates this month and further signals that the Fed would start cutting interest rates in coming months, which further deflated the greenback.
Res: 148.37; 149.00; 149.34; 150.00.
Sup: 147.62; 147.33; 146.82; 146.10.
SPX 500 Technical: Bulls Getting Tired
In the past two weeks, the US SPX 500 has continued its pace of acceleration and hit another fresh all-time of 5,150 on Monday, 4 March.
However, under the surface, there are signs of weakness from a sector rotation perspective. The SPX 500 is broken down into 11 key sectors and relative performance among the sectors such as “aggressive” over “defensive” tends to form a leading indication towards the movement of the S&P 500 based on past price actions.
Potential underperformance of Consumer Discretionary over Consumer Staples
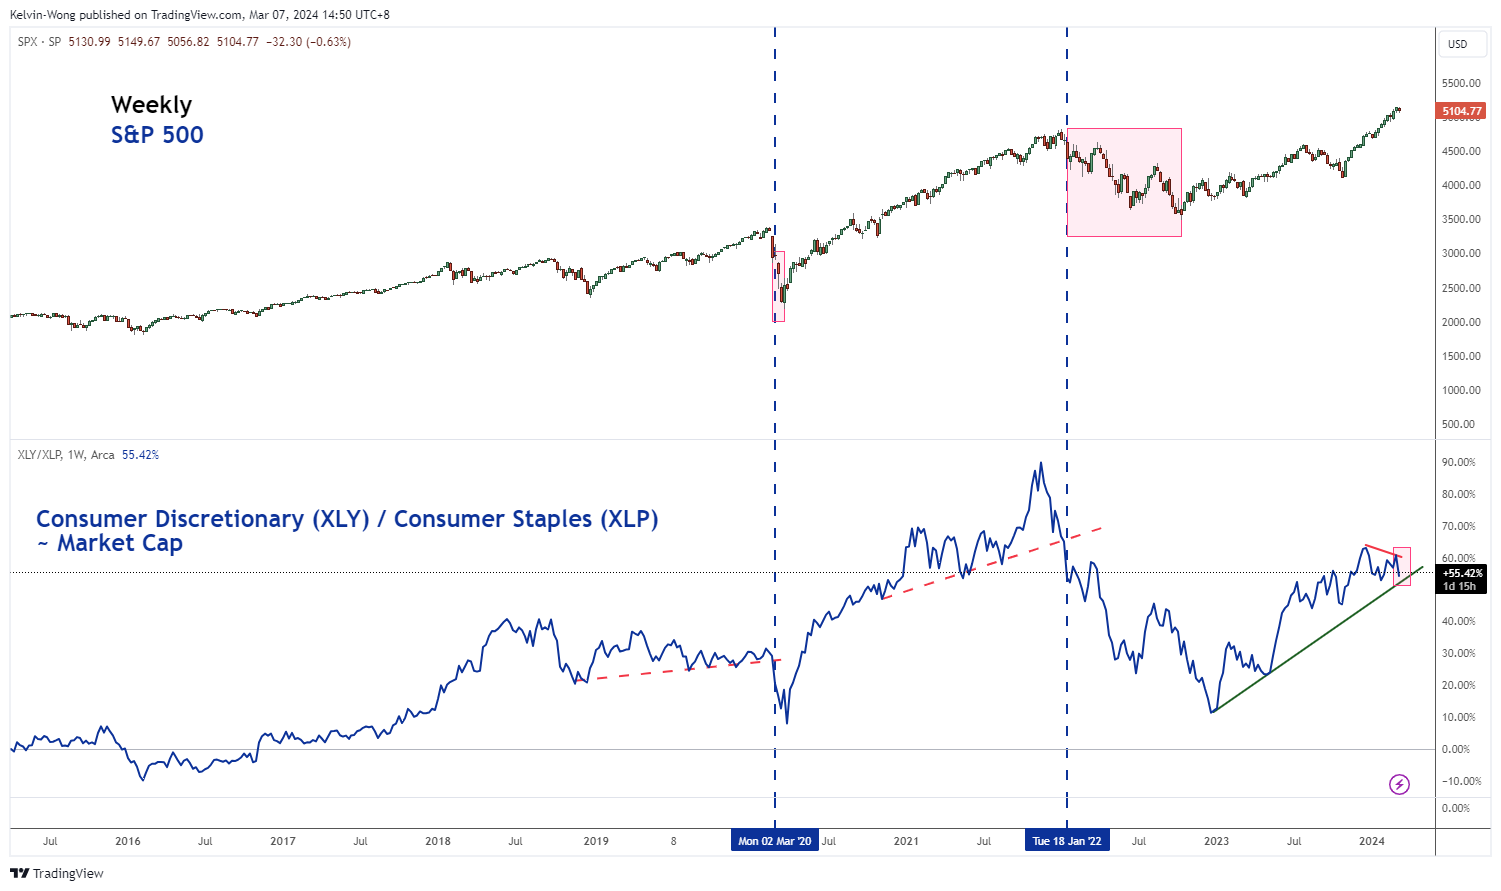
Fig 1: S&P Consumer Discretionary/Consumer Staples ratio major trend as of 7 Mar 2024 (Source: TradingView, click to enlarge chart)
The Consumer Discretionary sector is considered as a high beta “aggressive” sector as its performance in general moves directly with the cyclical trend of the economy. In contrast, the Consumer Staples sector is a lower beta sector that is being labeled as “defensive” because its movement is less synchronized directly with a typical economic cycle.
By plotting the ratio of the Consumer Discretionary sector exchange-traded fund (XLY) over the Consumer Staples sector exchange-traded fund (XLP), we can have a visual quantitative relative performance historical chart.
Next, overlayed the weekly ratio chart of XLY/XLP with the SPX 500 (see Fig 1), we can detect two recent underperformances of the XLY over XLP (the ratio broke below its support) that led to a multi-week corrective decline inflicted on the SPX 500.
On the week of 2 March 2020, the XLY/XLP ratio broke below its key support, and thereafter the S&P 500 shed -22%. The next occasion was on the week of 18 January 2022 where the XLY/XLP broke down below its support followed by a -18% decline in the SPX 500 over the next nine months.
Right now, the current price actions of the XLY/XLP ratio have inched lower in the past two weeks and are about to seek a retest on its key support in place since the week of 19 December 2022. Also, before the current retest of its support, it has shaped a lower high which increases the risk of a looming underperformance of Consumer Discretionary over Consumer Staples that in turn may trigger a potential multi-week corrective decline on the SPX 500.
Watch the key resistance of 5,150 on the SPX 500
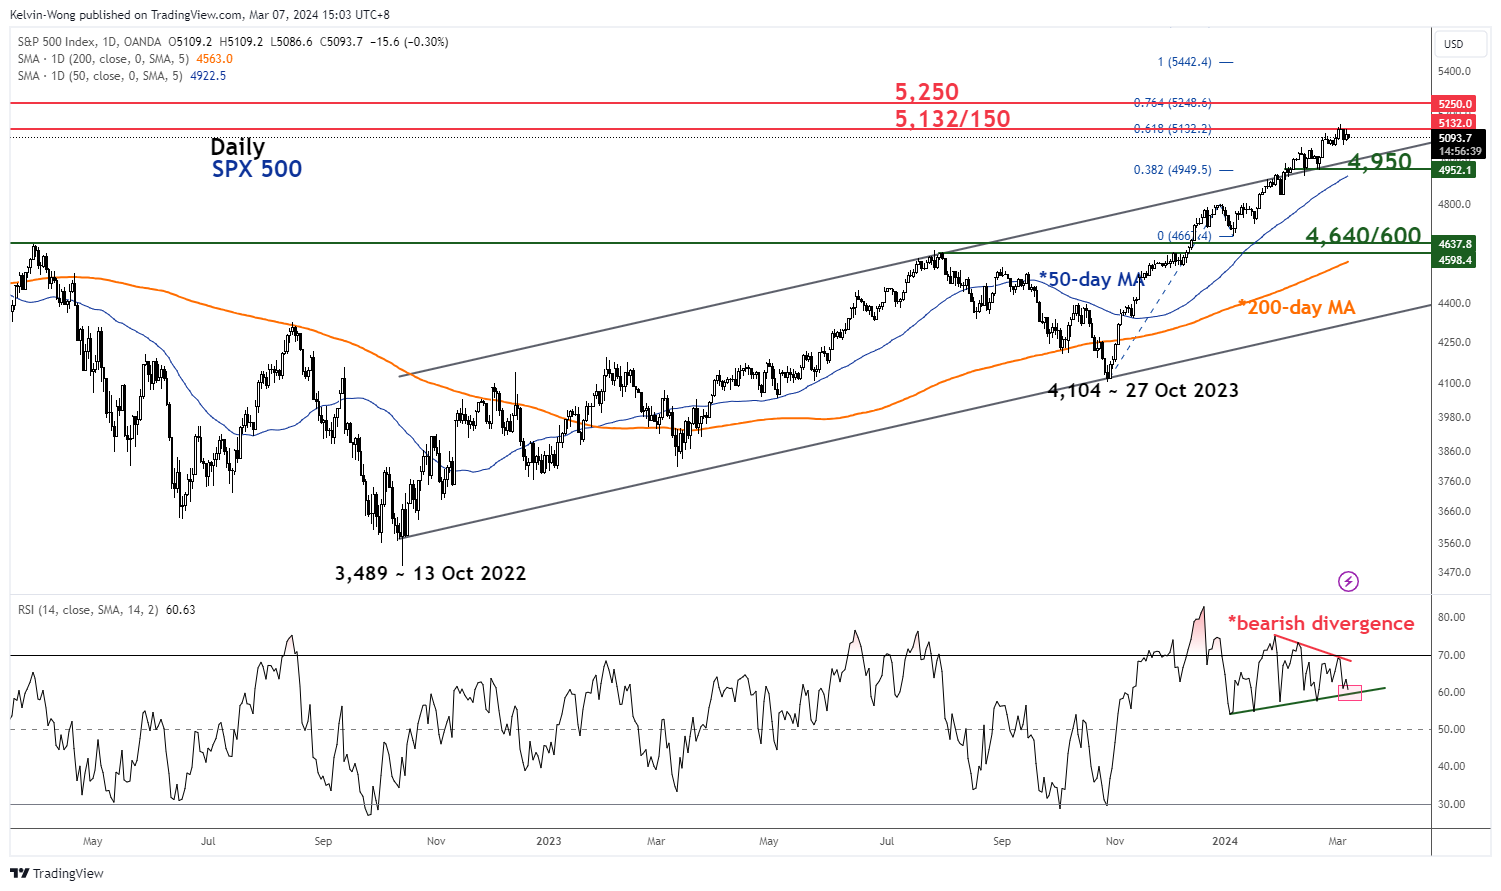
Fig 2: US SPX 500 medium-term & major trends as of 7 Mar 2024 (Source: TradingView, click to enlarge chart)
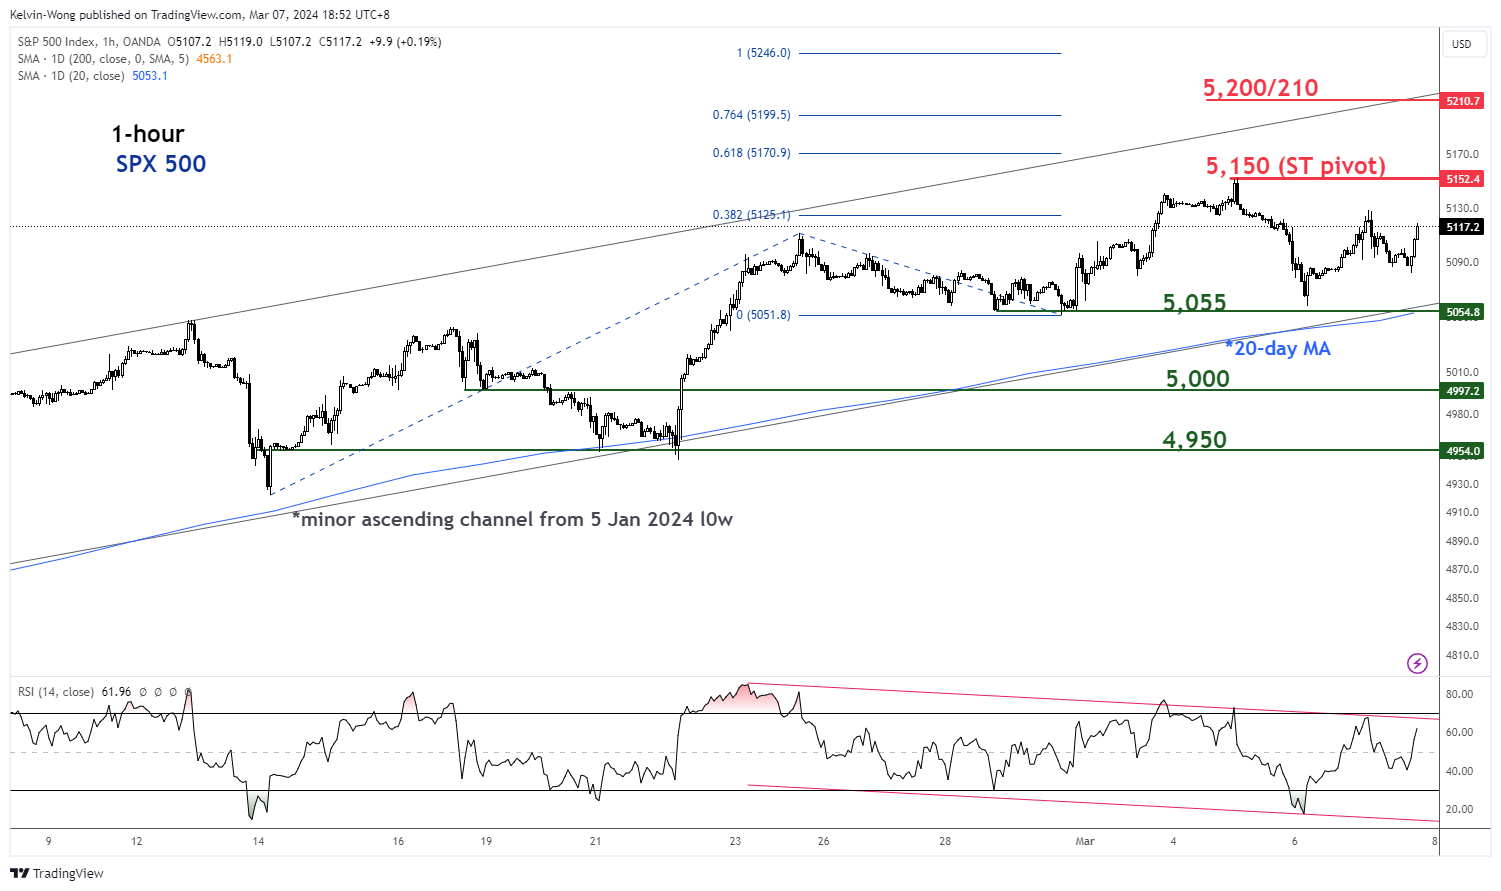
Fig 3: US SPX 500 short-term trend as of 7 Mar 2024 (Source: TradingView, click to enlarge chart)
The daily RSI momentum indicator of the SPX 500 has flashed out a persistent bearish divergence condition at its overbought region since 9 February 2024 which indicates a slowdown in medium-term upside momentum.
If the 5,150 key pivotal resistance on the SPX 500 is not surpassed to the upside, and a break below the 5,055 near-term support (also the 20-day moving average) may trigger the start of a multi-week corrective decline that exposes the next intermediate supports at 5,000 and 4,950 in the first step.
On the flip side, a clearance above 5,150 invalidates the bearish scenario for the continuation of the impulsive upmove sequence for the next intermediate resistance to come in at 5,200/210.
Euro in Holding Pattern Ahead of ECB Decision
ECB expected to hold rates at 4%
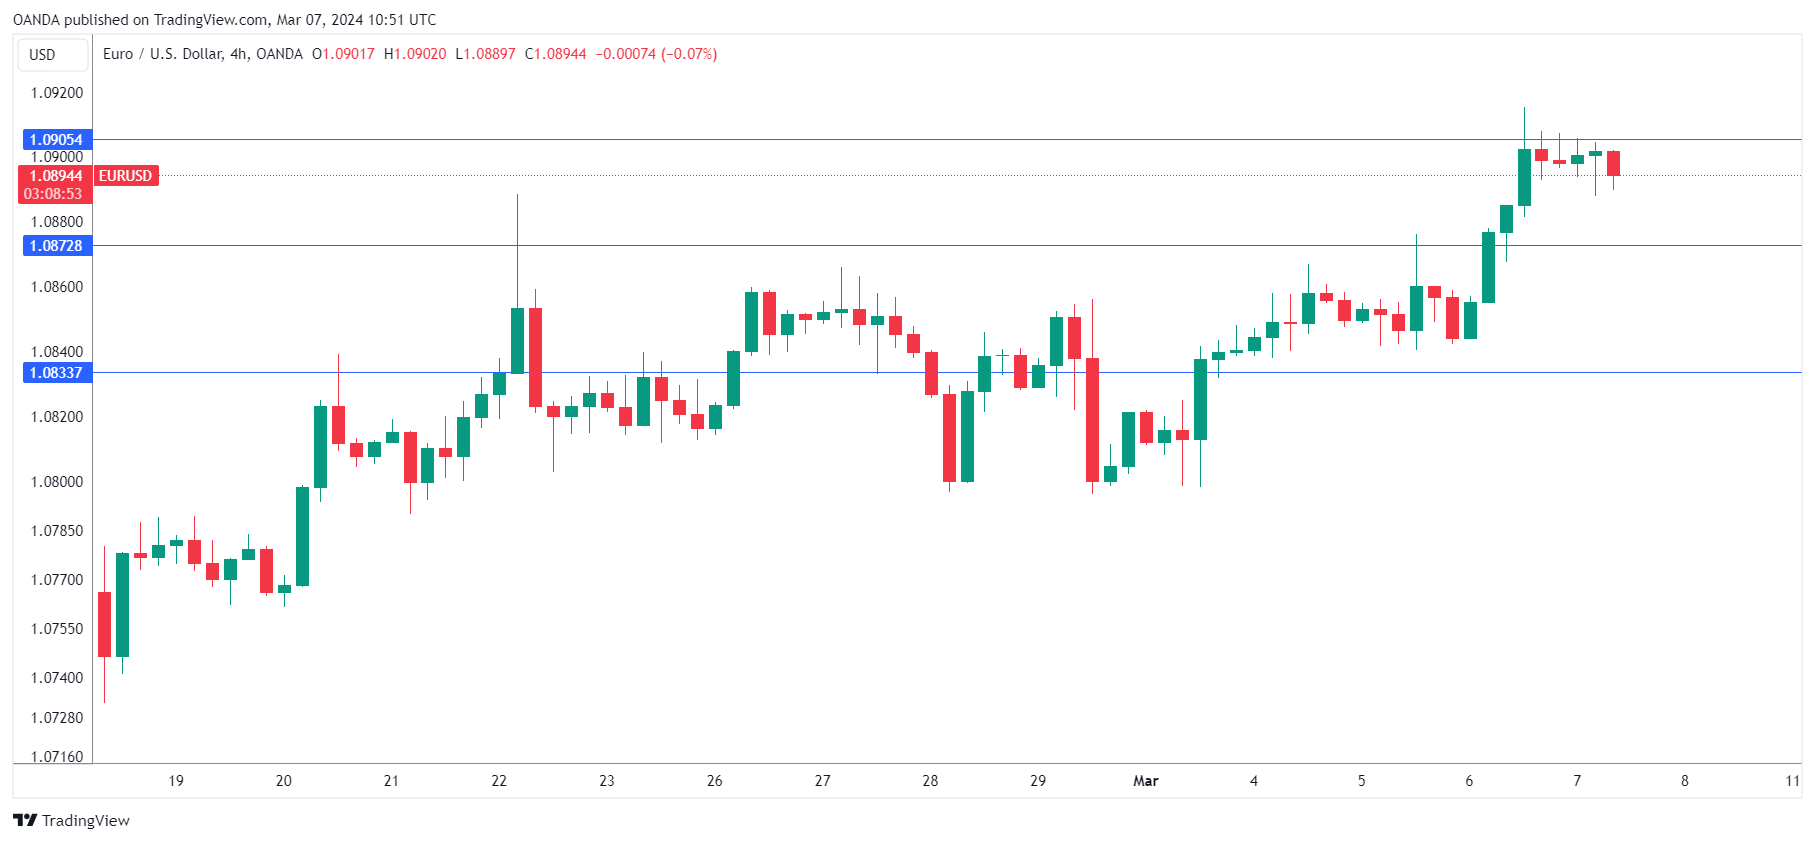
The euro is barely making a peep on Thursday, ahead of the European Central Bank’s decision later in the day. In the European session, EUR/USD is trading at 1.0894, down 0.04%.
ECB expected to hold rates
The ECB is expected to follow the Federal Reserve’s pause and hold the deposit rate at 4.0% for a fourth straight time. Have ECB rates peaked? The answer seems yes, but ECB policy makers are unlikely to confirm that tightening is over, as concerns remain that inflation is not yet beaten. CPI is down to 2.6%, but core CPI is at 3.1% and service inflation is running around 4%.
Inflation is on a downtrend, but the battle to bring down inflation to the ECB’s 2% target is not over. In what sounds like a Jerome Powell sound bite, ECB members have been saying that there is no rush to lower rates. The markets have priced in 90 points in cuts for 2024, with a first cut expected in June.
The ECB will likely hold rates again today, which means that investors will be focused on the central bank’s economic outlook. The ECB is expected to revise lower its inflation forecast and ECB President Lagarde will likely address the inflation outlook in her press conference.
More of the same from Powell on the Hill
Anyone looking for some insights about rate policy from Federal Reserve Chair Powell’s testimony on Capitol Hill on Wednesday was no doubt disappointed. Powell essentially doubled-down on a script we’ve heard before, which is that the Fed is planning to cut interest rates this year but please don’t hold your breath, as inflation is not where it needs to be and the Fed will remain cautious.
Powell did not give any hints about the timing of a rate cut except to say that the timing was not yet right. Powell said that the Fed would carefully monitor data and the economic outlook before making any moves and that the Fed had to first gain “greater confidence that inflation is moving sustainably toward 2 percent”.
Powell signaled that rates have likely peaked, saying that the Fed’s “policy rate is likely at its peak for this tightening cycle”. This means that the Fed’s rate path will probably remain in a holding pattern of “higher for longer” until the Fed sees clear evidence that inflation has been subdued. The markets have priced in three rate cuts this year, with June the likely date for the initial cut.
EUR/USD Technical
- EUR/USD is testing resistance at 1.0905. Above, there is resistance at 1.0944
- 1.0872 and 1.0833 are providing support
Gold Reaches Unprecedented High Amid Economic Uncertainties
Gold trading reached a significant milestone on Thursday, with prices hitting an all-time high of $2150.00 per Troy ounce. This remarkable surge was propelled by a confluence of factors. These include the decline in US government bond yields, the weakening US dollar, and speculation about a potential interest rate cut by the US Federal Reserve in response to emerging economic challenges.
The expectation of monetary policy easing stems from the Federal Reserve's ongoing evaluation of the economy's condition, highlighted by Federal Reserve Chair Jerome Powell's hint at potential policy adjustments in 2024. The timing of such interventions is critical to achieving a balanced approach without precipitating or lagging behind the economy's actual needs.
Recent labour market data, including ADP's February employment growth figures, fell short of expectations, shifting focus to forthcoming reports on unemployment rates, Non-Farm Payroll (NFP) statistics, and average earnings. These reports are critical for assessing the employment market's condition and will significantly influence the Fed's decision-making process.
Gold's rally is further supported by its inverse relationship with the US dollar, gaining momentum from the currency's current weakness. Moreover, the surge in physical demand for gold from global central banks in January, which saw purchases double compared to December, underscores the metal's appeal as a hedge against geopolitical risks and potential economic downturns.
Technical analysis of gold (XAU/USD)
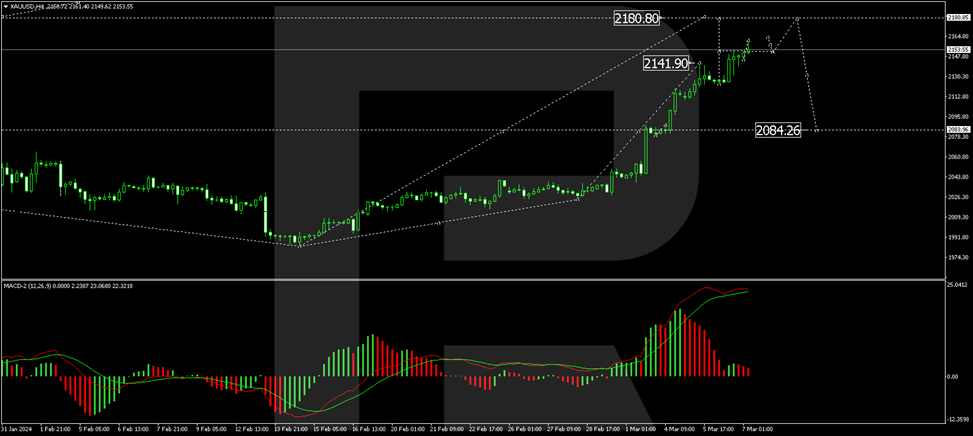
The H4 chart analysis of XAU/USD reveals the progression of the fifth growth wave, with a pivotal correction to 2124.00 following the achievement of a local target at 2141.90. Today's trading has seen the market surpassing the peak of this wave, establishing a consolidation range above the 2153.00 level. A breakout above this consolidation could signal further growth towards 2180.80, which was identified as the initial target. This bullish scenario is supported by the MACD indicator, which remains above zero, indicating sustained upward momentum.
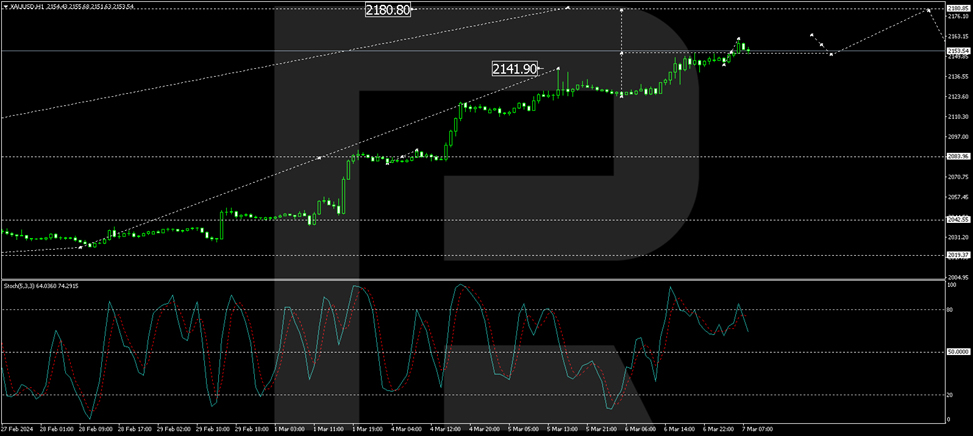
On the H1 chart, gold prices have consolidated around the 2152.00 mark. An upward move from this consolidation phase is expected to initiate a growth wave towards 2160.60. Subsequent correction to 2152.00 and a potential rise to 2180.00 are anticipated. The Stochastic oscillator supports this outlook, suggesting a brief retreat to 50 before rallying back to 80, reflecting continued bullish sentiment in the market.
EURUSD Wipes Out Half of January’s Downfall
- EURUSD peaks in overbought zone; trend signals still positive
- ECB rate announcement comes center stage at 13:15 GMT
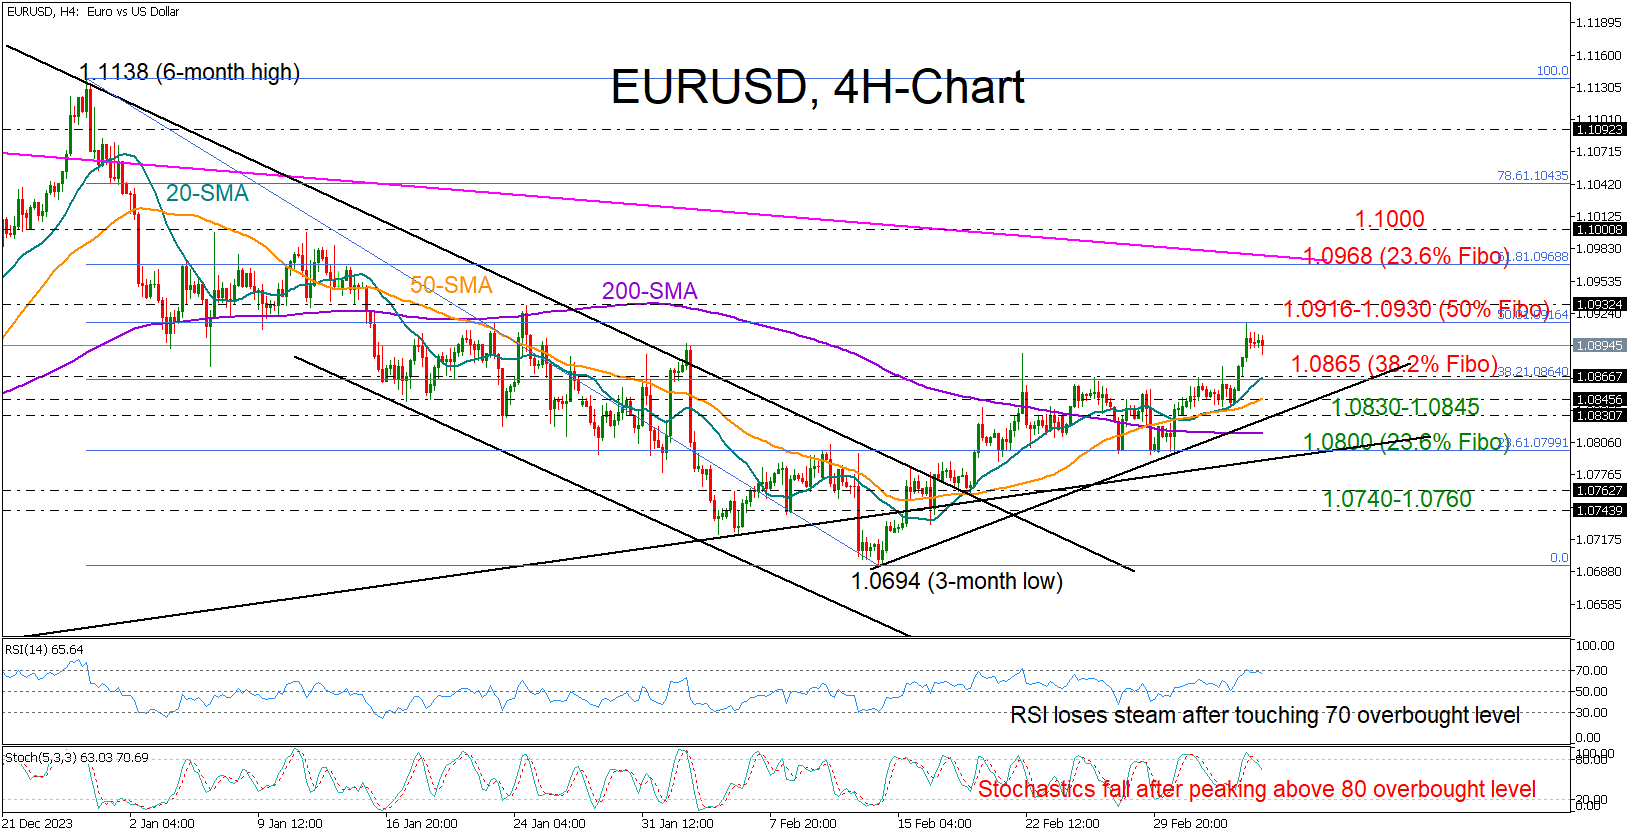
EURUSD resumed its recovery phase on Wednesday, rising as high as 1.0914 – the highest level since January – before easing slightly lower again.
The pair seems to have met overbought conditions in the four-hour chart as both the RSI and the Stochastic oscillator are pivoting lower after peaking around 70 and 80, respectively. Interestingly, the warning signals came after the price faced a strong rejection near the 50% Fibonacci retracement of the previous downtrend, shifting the focus back to the downside.
The 38.2% Fibonacci mark of 1.0865, where the 20-period simple moving average (SMA) is placed, is now under the spotlight. A close beneath that constraining zone might press the price straight to the tentative support trendline from February’s lows at 1.0830, unless the 50-period SMA blocks the way down beforehand. Even lower, the bears could drive towards the 23.6% Fibonacci level of 1.0800, a break of which could generate more losses to 1.0740-1.760.
On the other hand, trend signals provide a ray of hope that the ongoing bullish wave might gain extra legs. The pair has printed a new higher high and the recent bullish cross between the 20- and 50-period SMAs could be a signal of more progress ahead. Nevertheless, buyers would like to see a decisive bounce above the 1.0916-1.0930 resistance zone before they stage a rally towards the 61.8% Fibonacci level of 1.0968 and the 1.1000 psychological number.
In brief, EURUSD’s short-term bullish pattern seems healthy for now, with the price expected to take a breather before continuing higher.
AUD/USD Outlook: Aussie Dollar Rallies for the Second Day and Pressure Pivotal Barriers
AUDUSD advances for the second day, underpinned by weaker US dollar and higher iron ore prices.
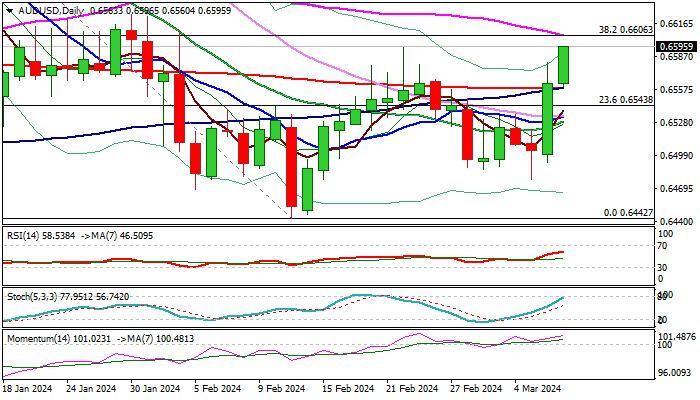
The pair hit two-week high and pressure key barriers at 0.6600 zone (near-term range top / Fibo 38.2% of 0.6871/0.6442 descend / 55DMA).
Sustained break here is needed to signal an end of sideways phase and continuation of recovery from 0.6442 (2024 low, posted on Feb 13) and open way for attack at daily cloud (spanned between 0.6642 and 0.6685) and 0.6707 (Fibo 61.8% of 0.6871/0.6442) in extension.
Immediate bullish bias expected to remain in play while broken 200DMA (0.6559) holds
Improving daily studies support the action, as positive momentum strengthens and MA’s turned to bullish setup, with break above converged 100/200 DMA’s (on track to make bull-cross) to additionally boost bulls.
Better than expected economic data from Australia and China are supportive for the Aussie dollar, while the greenback came under increased pressure from relatively dovish remarks from Fed Powell.
Res: 0.6606; 0.6624; 0.6642; 0.6685.
Sup: 0.6559; 0.6543; 0.6526; 0.6492.
AUDUSD Surges Within Critical Levels
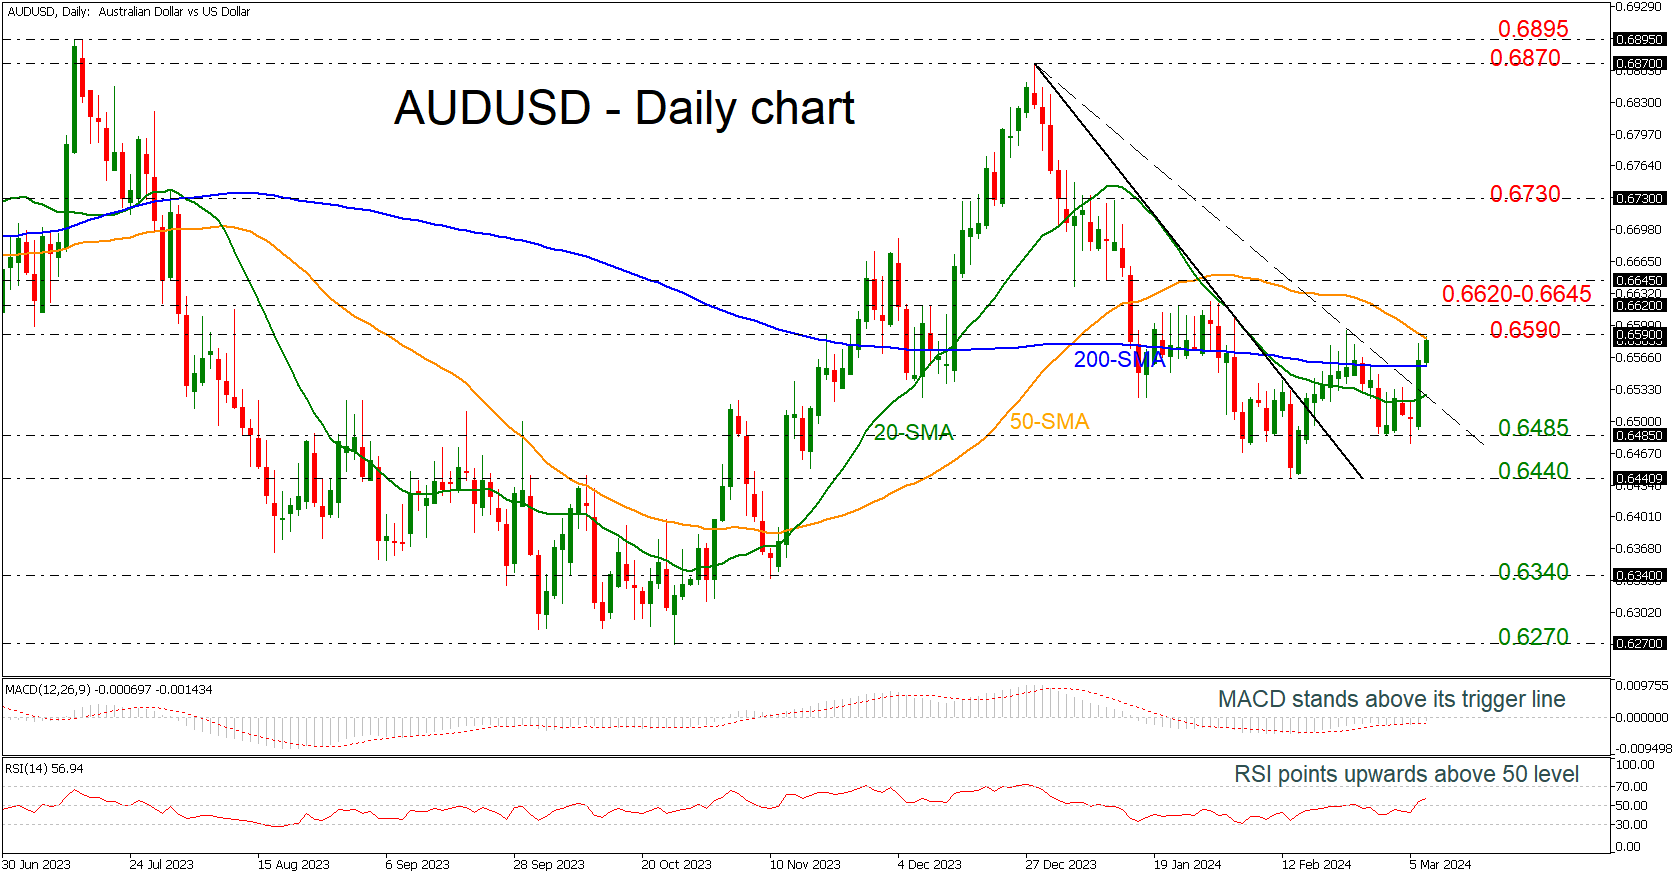
- AUDUSD rebounds off 0.6485 and surpasses downtrend line
- MACD and RSI indicate more upside pressure
AUDUSD has been experiencing a new up leg over the last couple of days, surpassing above the short-term downtrend line and the flat 200-day simple moving average (SMA), meeting the 50-day SMA near the 0.6590 critical resistance.
Technically, the MACD oscillator is standing above its trigger line in the bearish region, while the RSI is pointing upwards above the neutral threshold of 50.
If the market manages to overcome the key region of 0.6590 then it may open the way for more bullish actions towards the 0.6620-0.6645 area ahead of the 0.6790 barricade, taken from the highs on January 9.
On the flip side, a decline beneath the 200- and the 20-day SMAs may increase speculation of a neutral phase, hitting the 0.6485 and 0.6440 support lines. Even lower, the market may switch to a strongly negative one, diving towards the 0.6340 bar.
All in all, AUDUSD is looking neutral in the near-term timeframe, but the break above the downtrend line may add some optimism for traders for some increases.
USDJPY Correction Picks up speed
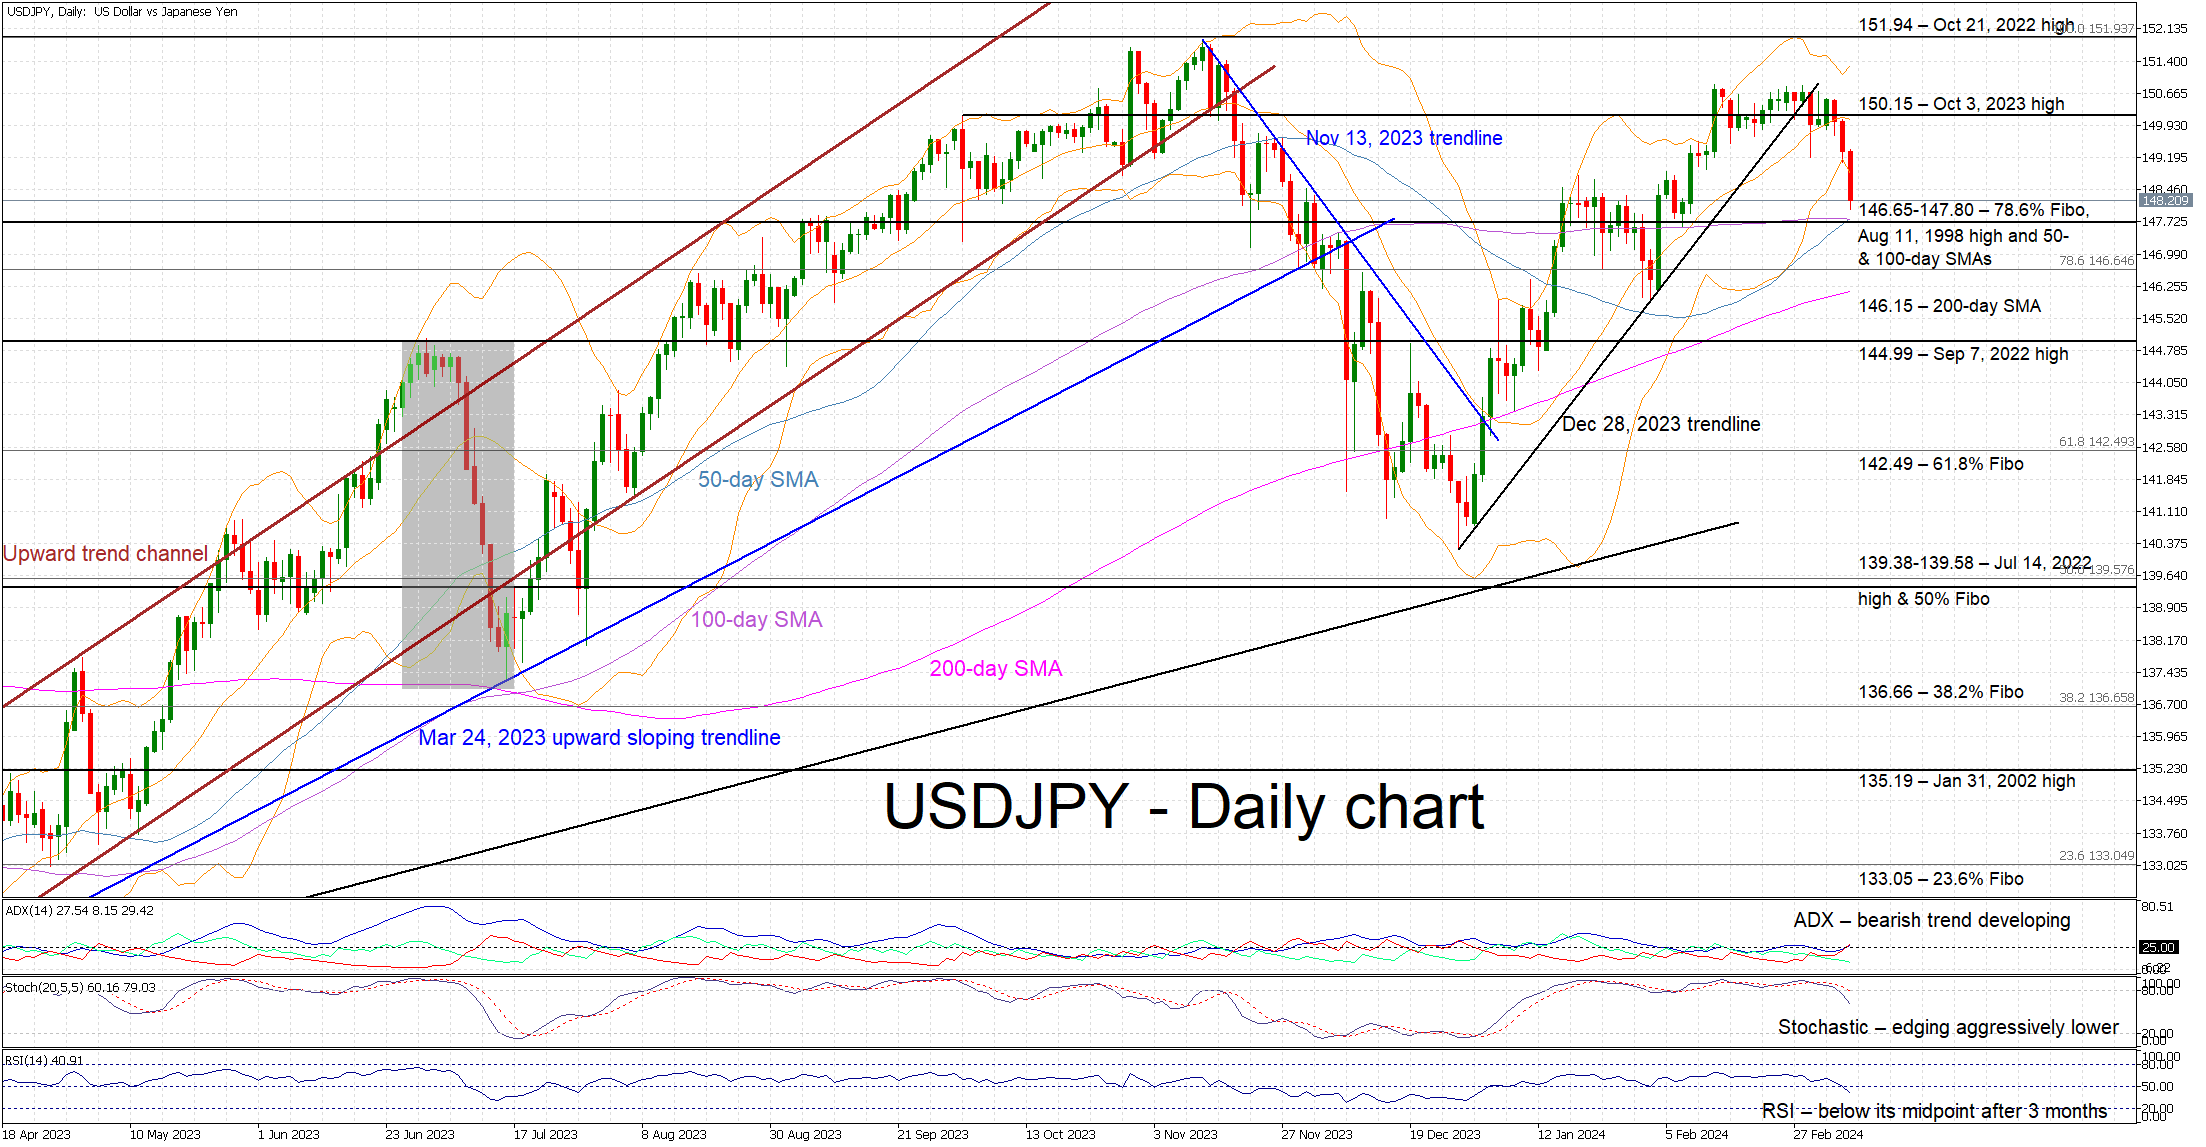
- USDJPY is edging aggressively lower today and closing in on a key support area
- This is the bears' first attempt to push USDJPY significantly below the 150 level
- Momentum indicators support the current correction
USDJPY is recording its third consecutive red candle as recent comments by BoJ members are potentially opening the door to a monetary policy move in the upcoming gathering. USDJPY has managed to drop below the 150 threshold and is getting closer to the busy 146.65-147.80 support area.
In the meantime, the momentum indicators are supportive of the correction. More specifically, the Average Directional Movement Index (ADX) climbed above the 25 threshold and is thus signalling a developing bearish trend in USDJPY. Similarly, the RSI has dropped below its 50-midpoint for the first time in more than 3 months. More importantly, the stochastic oscillator has broken below its overbought (OB) territory and is edging aggressively lower.
Should the bulls remain patient, they could try to regain market control and lead USDJPY again higher towards the October 3, 2023 high at 150.15. If successful, they could then stage a rally towards the October 21, 2022 high at 151.94 and potentially open the door to a new 30-year high.
On the flip side, the bears are keen for the current correction to continue and are possibly preparing to test the support set by the 146.65-147.80 area, which is populated by the 78.6% Fibonacci retracement of the October 21, 2022 - January 16, 2023 downtrend, the August 11, 1998 high, and the 50- and 100-day simple moving averages (SMAs). Even lower, the bears could push USDJPY towards the 144.99 level, provided they overcome the 200-day SMA at 146.15.
To sum up, USDJPY is edging aggressively lower with the bears hoping that the current correction continues with some help from the momentum indicators.
Gold XAU/USD Sets a Historical Record Exceeding $2160 per Ounce
The previous high was around USD 2,135, but gold rose above USD 2,160 an ounce this morning, reaching its highest level ever, as Treasury yields weakened on hopes that the US Federal Reserve will soon begin cutting interest rates.
In a speech yesterday, the Fed chief offered no clarity, saying it would likely be appropriate to ease policy restrictions "at some point this year."
Traders now see a 70% chance of a Fed rate cut in June.
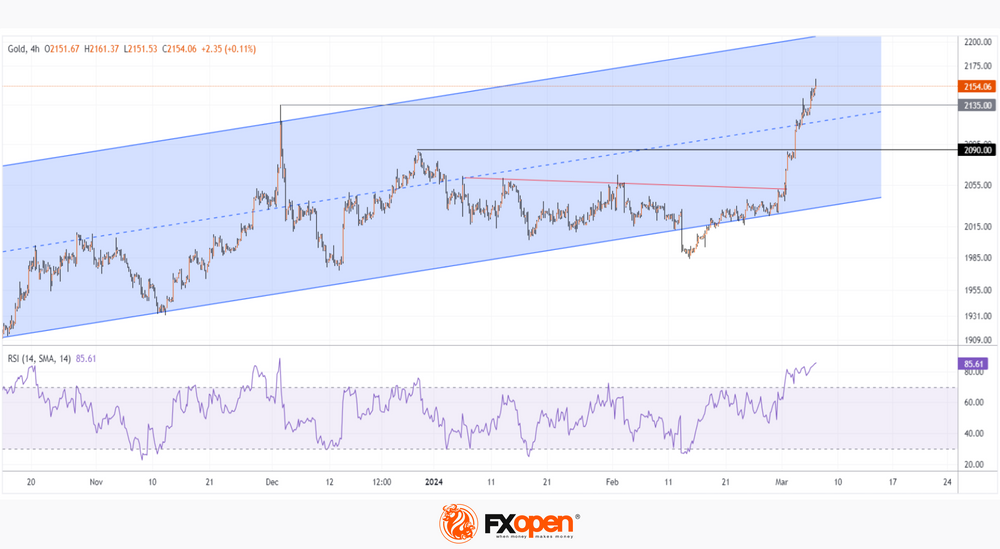
Technical analysis of the XAU/USD chart shows that:
→ the price of gold is in an ascending channel (shown in blue);
→ after a false breakout of its lower border, the price confidently overcame the downward trend line (shown in red) and resistance 2,090;
→ a strong upward impulse led to the RSI indicator entering the extreme overbought zone.
Although the blue ascending channel leaves room for growth to its upper limit, the rise in the price of gold by more than 5% since the first days of March leaves the market vulnerable to a correction — for instance, to the median line of the ascending channel.
James Steel, chief precious metals analyst at HSBC, also says that gold's upward trajectory may slow down. He believes record high prices could cool physical demand for the metal, especially from central banks.
Start trading commodity CFDs with tight spreads. Open your trading account now or learn more about trading commodity CFDs with FXOpen.
This article represents the opinion of the Companies operating under the FXOpen brand only. It is not to be construed as an offer, solicitation, or recommendation with respect to products and services provided by the Companies operating under the FXOpen brand, nor is it to be considered financial advice.