

Sample Category Title
USD/JPY Mid-Day Outlook
Daily Pivots: (S1) 150.28; (P) 150.52; (R1) 150.76; More...
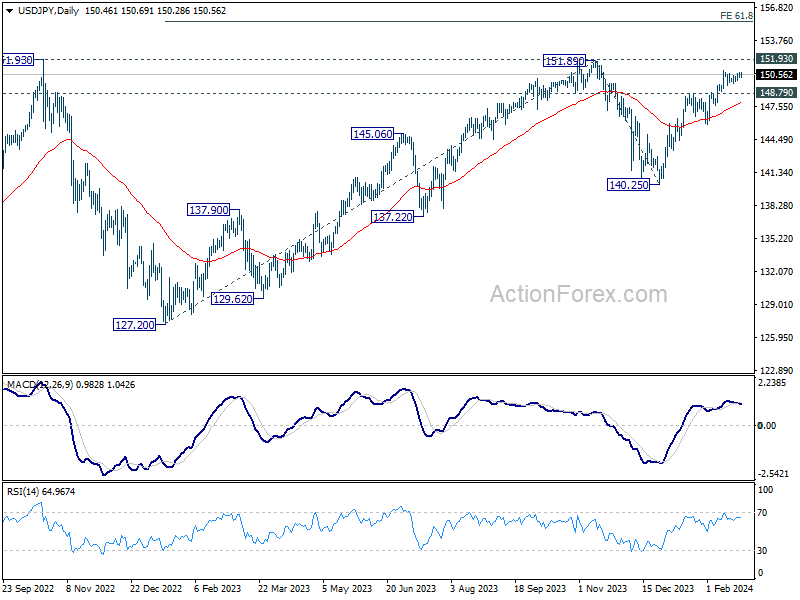
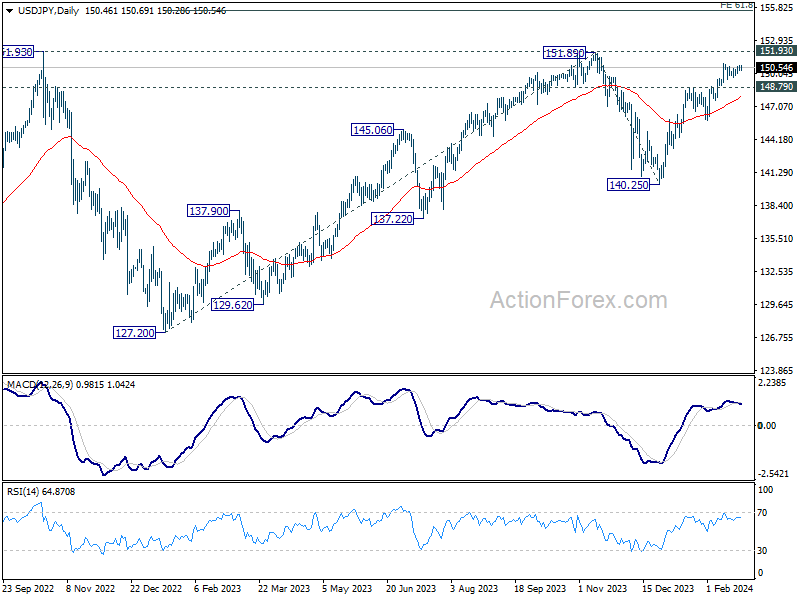
USD/JPY is staying in range below 150.87 and intraday bias remains neutral. In case of another retreat, downside should be contained by 148.79 resistance turned support to bring rebound. On the upside, break of 150.87 will resume 140.25 to 151.89/93 key resistance zone. Decisive break there will confirm larger up trend resumption of 155.50 projection level next.
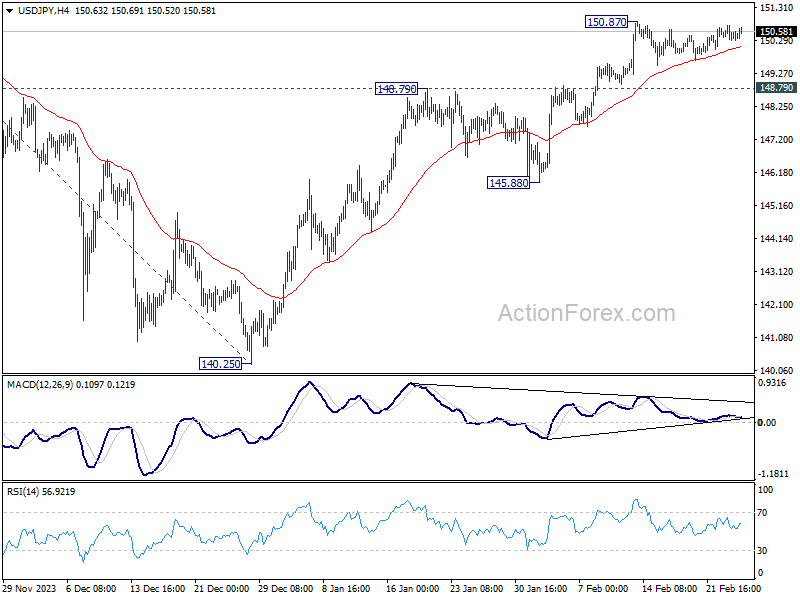
In the bigger picture, rise from 140.25 is seen as resuming the trend from 127.20 (2023 low). Decisive break of 151.89/.93 resistance zone will confirm this bullish case and target 61.8% projection of 127.20 to 151.89 from 140.25 at 155.50. However, break of 148.79 resistance turned support will delay this bullish case, and extend the corrective pattern from 151.89 with another falling leg
GBP/USD Mid-Day Outlook
Daily Pivots: (S1) 1.2647; (P) 1.2674; (R1) 1.2699; More...
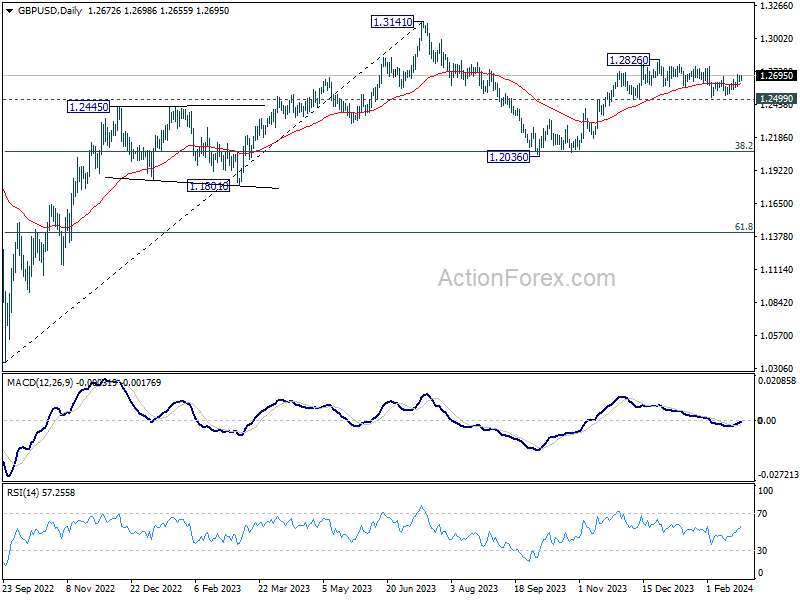
GBP/USD is still capped below 1.2708 temporary top and intraday bias remains neutral first. On the upside, break of 1.2708 resistance will indicate that correction from 1.2826 has completed. Intraday bias will be back on the upside for retesting 1.2826. Nevertheless, decisive break of 1.2499 will argue that whole rise from 1.2036 has completed and turn near term outlook bearish.
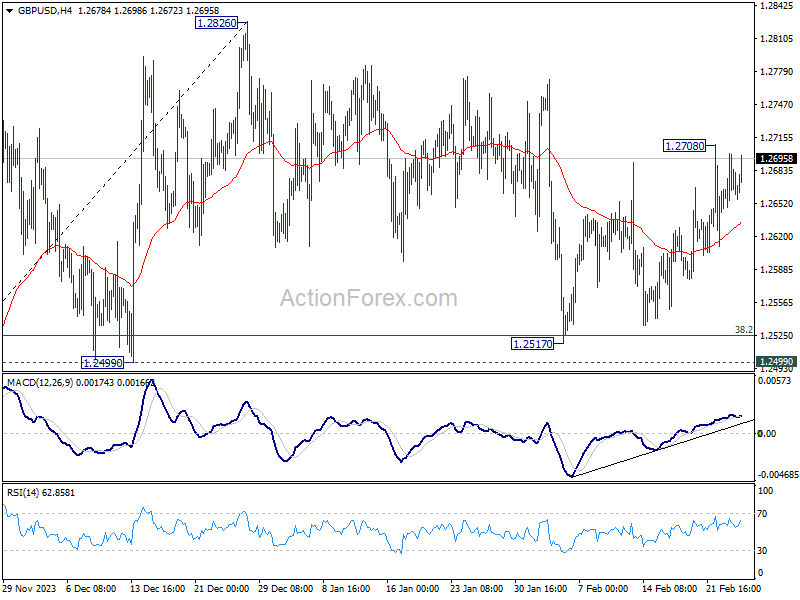
In the bigger picture, price actions from 1.3141 medium term top are seen as a corrective pattern to up trend from 1.0351 (2022 low). Rise from 1.2036 is seen as the second leg, which could be still in progress. But upside should be limited by 1.3141 to bring the third leg of the pattern. Meanwhile, break of 1.2499 support will argue that the third leg has already started for 38.2% retracement of 1.0351 (2022 low) to 1.3141 at 1.2075 again.
Euro Gains Traction as Markets Eye Japan CPI, Commodity Currencies Lag
The global financial markets are overall very quiet today, marked by a noticeable absence of significant economic data releases or impactful news. Euro emerges as the frontrunner, leading European majors higher, while Yen sees a slight dip in anticipation of Japan's CPI data set to be released tomorrow. Commodity currencies are on the weaker side, particularly highlighted by New Zealand Dollar's early sell-off. Dollar, meanwhile, is mixed as it awaits new drivers that could provide fresh momentum.
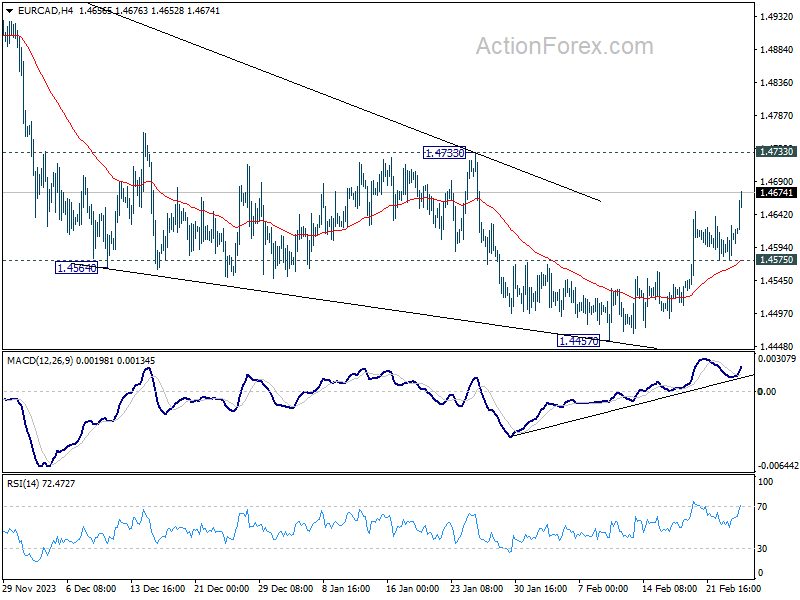
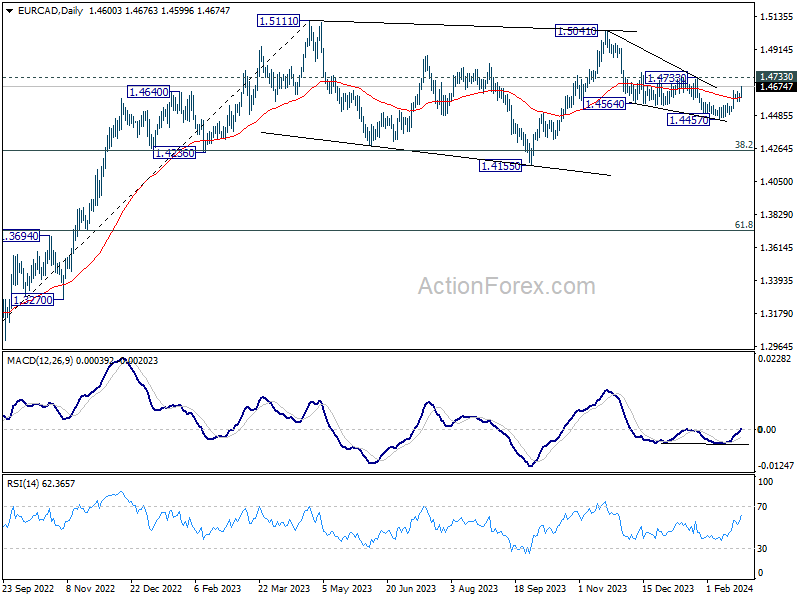
Technically, EUR/CAD's rebound from 1.4457 resumed today and it's on track to test 1.4733 resistance. Corrective fall from 1.5041 is seen as completed with three waves down. Rise from 1.4155 is probably resuming. Sustained break of 1.4733 will strengthen this bullish case and target 1.5041 resistance next. This will now remain the favored case long as 1.4575 support holds.
In Europe, at the time of writing, FTSE is down -0.28%. DAX is up 0.07%. CAC is down -0.34%. UK 10-year yield is up 0.0114 at 4.051. Germany 10-year yield is up 0.016 at 2.385. Earlier in Asia, Nikkei rose 0.35%. Hong Kong HSI fell -0.54%. China Shanghai SSE fell -0.48%. Singapore Strait Times fell -0.43%. Japan 10-year yield fell -0.0305 to 0.691.
Nikkei reaches new heights as Yen declines before Japan's CPI
Nikkei index surged to new record today, signaling robust appetite for risk among Japanese investors, while Yen faces downward pressure, in particular against European majors. Consumer inflation data is in the spotlight in the upcoming Asian session.
Core CPI, which excludes food prices, is forecasted to decelerate from 2.3% to 1.8% in January, below BoJ's 2% target for the first time in nearly two years. However, for the BoJ, the crucial figure lies in the core-core CPI (excluding both food and energy), which is awaited to see if it will decelerate from December's 3.7%.
Governor Kazuo Ueda has consistently highlighted the significance of the outcomes from this year's annual wage negotiations as a pivotal factor in determining the timeline for phasing out the negative interest rate policy.
With large businesses scheduled to conclude wage talks with unions on March 13, just days before BoJ's next meeting on March 18-19, March is seen by some as a candidate for a rate hike. Yet, April, with the availability of new economic projections, remains a more plausible window for such policy adjustments.
However, any unexpected strength in the inflation report could fuel speculation about an earlier rate hike.
USD/JPY has been losing much momentum after breaking 150 handle. Threat of intervention by Japan could be a major factor keeping USD/JPY bulls from aggressive buying. Nevertheless, rally from 140.25 is still in tact as long as 148.79 support holds. But the path to 151.89/93 resistance zone would be slow.
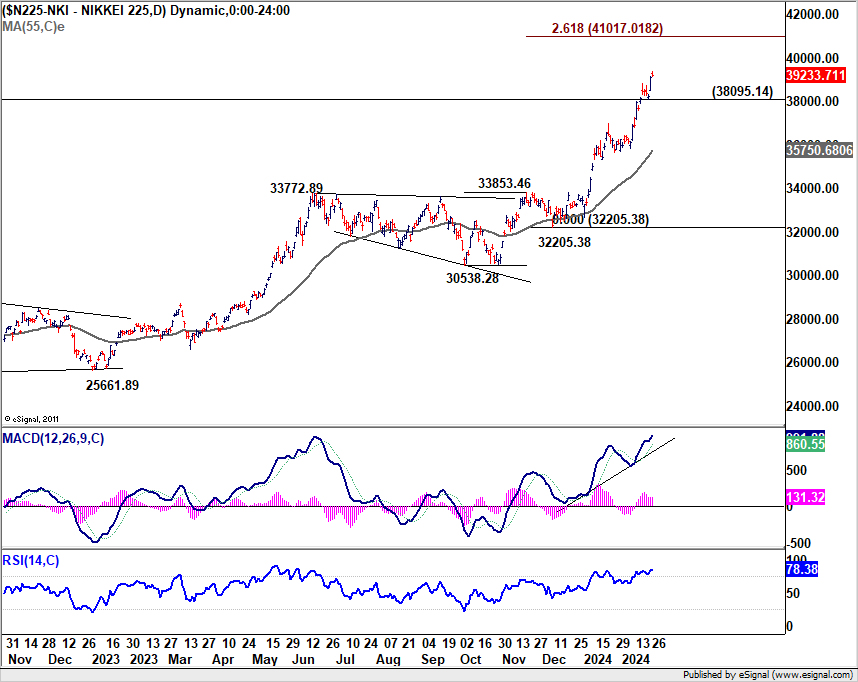
As for Nikkei, it should be rather undeterred by the inflation data. Near term outlook will stay bullish as long as 38095.14 support holds. Next target is 40k psychological level, or even further to 261.8% projection of 30538.28 to 33853.46 from 32205.38 at 41017.01.
GBP/USD Mid-Day Outlook
Daily Pivots: (S1) 1.2647; (P) 1.2674; (R1) 1.2699; More...
GBP/USD is still capped below 1.2708 temporary top and intraday bias remains neutral first. On the upside, break of 1.2708 resistance will indicate that correction from 1.2826 has completed. Intraday bias will be back on the upside for retesting 1.2826. Nevertheless, decisive break of 1.2499 will argue that whole rise from 1.2036 has completed and turn near term outlook bearish.
In the bigger picture, price actions from 1.3141 medium term top are seen as a corrective pattern to up trend from 1.0351 (2022 low). Rise from 1.2036 is seen as the second leg, which could be still in progress. But upside should be limited by 1.3141 to bring the third leg of the pattern. Meanwhile, break of 1.2499 support will argue that the third leg has already started for 38.2% retracement of 1.0351 (2022 low) to 1.3141 at 1.2075 again.
Economic Indicators Update
| GMT | Ccy | Events | Actual | Forecast | Previous | Revised |
|---|---|---|---|---|---|---|
| 23:50 | JPY | Corporate Service Price Index Y/Y Jan | 2.10% | 2.40% | 2.40% | |
| 15:00 | USD | New Home Sales M/M Jan | 685K | 664K |
Nikkei reaches new heights as Yen declines before Japan’s CPI
Nikkei index surged to new record today, signaling robust appetite for risk among Japanese investors, while Yen faces downward pressure, in particular against European majors. Consumer inflation data is in the spotlight in the upcoming Asian session.
Core CPI, which excludes food prices, is forecasted to decelerate from 2.3% to 1.8% in January, below BoJ's 2% target for the first time in nearly two years. However, for the BoJ, the crucial figure lies in the core-core CPI (excluding both food and energy), which is awaited to see if it will decelerate from December's 3.7%.
Governor Kazuo Ueda has consistently highlighted the significance of the outcomes from this year's annual wage negotiations as a pivotal factor in determining the timeline for phasing out the negative interest rate policy.
With large businesses scheduled to conclude wage talks with unions on March 13, just days before BoJ's next meeting on March 18-19, March is seen by some as a candidate for a rate hike. Yet, April, with the availability of new economic projections, remains a more plausible window for such policy adjustments.
However, any unexpected strength in the inflation report could fuel speculation about an earlier rate hike.
USD/JPY has been losing much momentum after breaking 150 handle. Threat of intervention by Japan could be a major factor keeping USD/JPY bulls from aggressive buying. Nevertheless, rally from 140.25 is still in tact as long as 148.79 support holds. But the path to 151.89/93 resistance zone would be slow.
As for Nikkei, it should be rather undeterred by the inflation data. Near term outlook will stay bullish as long as 38095.14 support holds. Next target is 40k psychological level, or even further to 261.8% projection of 30538.28 to 33853.46 from 32205.38 at 41017.01.
US Dollar Eyes PCE Inflation Data After CPI Scare
- Core PCE price index to be crucial for markets amid sticky inflation fears
- Income and consumption to be watched too as US economy stays hot
- But can further upside surprises boost the dollar on Thursday, 13:30 GMT
Will PCE gauge ease or fuel inflation worries?
Even though the Fed has made great progress in its bid to bring inflation in the US under control, the next phase to get it all the way down to 2% is proving to be a little more difficult. The CPI measure of inflation has been stuck above 3.0% for some time now and core CPI was unchanged at 3.9% in January.
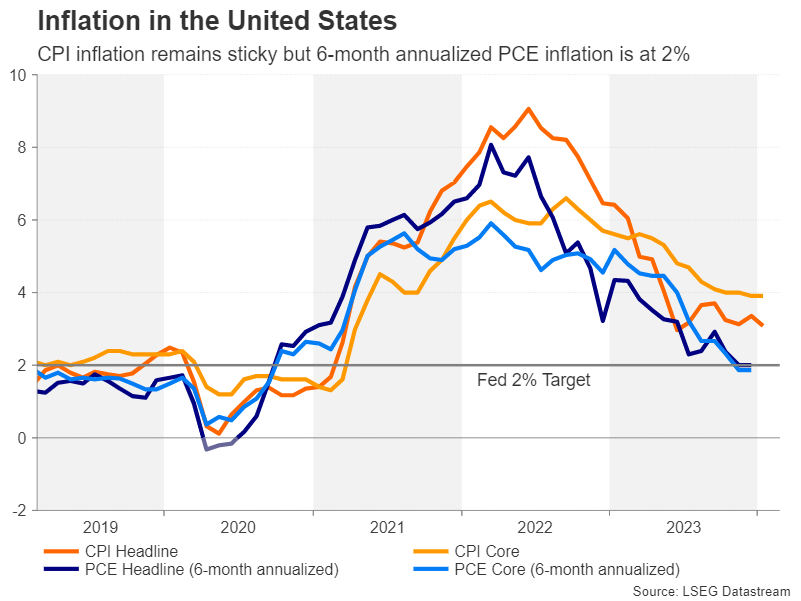
The inflation picture according to the Fed’s preferred PCE measure has been somewhat more encouraging lately, particularly when focusing on the six-month annualized rate. The headline PCE price index stood bang on the Fed’s 2.0% target in December and the core PCE price index was at 1.9% by this metric. However, the year-on-year rates still have some ground to cover and came in at 2.6% and 2.9%, respectively, in December.
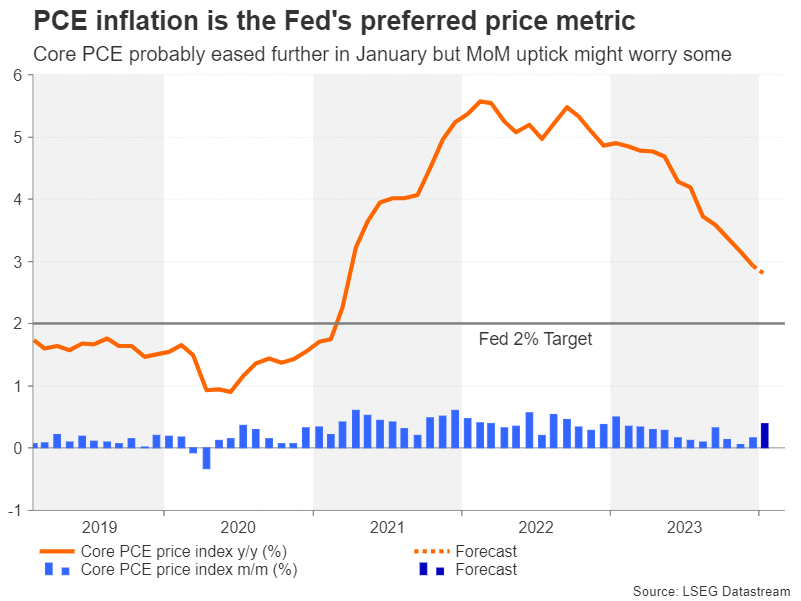
For January, the core PCE price index is forecast to have cooled slightly lower to 2.8%, although the month-on-month rate is projected to have picked up to 0.4%. A stronger-than-expected reading, particularly in the month-on-month rate, would likely further stoke fears about high inflation rearing its ugly head again.
The big repricing
The recent run of upbeat indicators out of the world’s largest economy has put markets in a spin, prompting a sharp rethink on the expected Fed rate path. Markets were pricing almost seven rate cuts for this year at one point in January. A month later, those dovish bets have been scaled down to less than four cuts.
On the bright side, investors are now better aligned with the Fed’s thinking, although there is still some repricing to go as the Fed’s latest dot plot predicted three 25-bps rate cuts in 2024. Any further upside surprises in the inflation data following the CPI and PPI beats have the potential to spark some volatility across the major asset classes, including bonds and equities.
Can the dollar extend its uptrend?
Treasury yields have been steadier lately but could resume their rally if there’s another hotter-than-expected inflation print. A jump in yields could be enough to inject some life into the US dollar, which has been drifting lower over the past 10 days, even against the beleaguered yen.
The pair has been struggling to advance past the 150 level, losing momentum as it approaches the November peak of 151.92 yen. A strong PCE report might be what it takes to jumpstart the stalled uptrend and push the dollar to a new high above 152 yen.
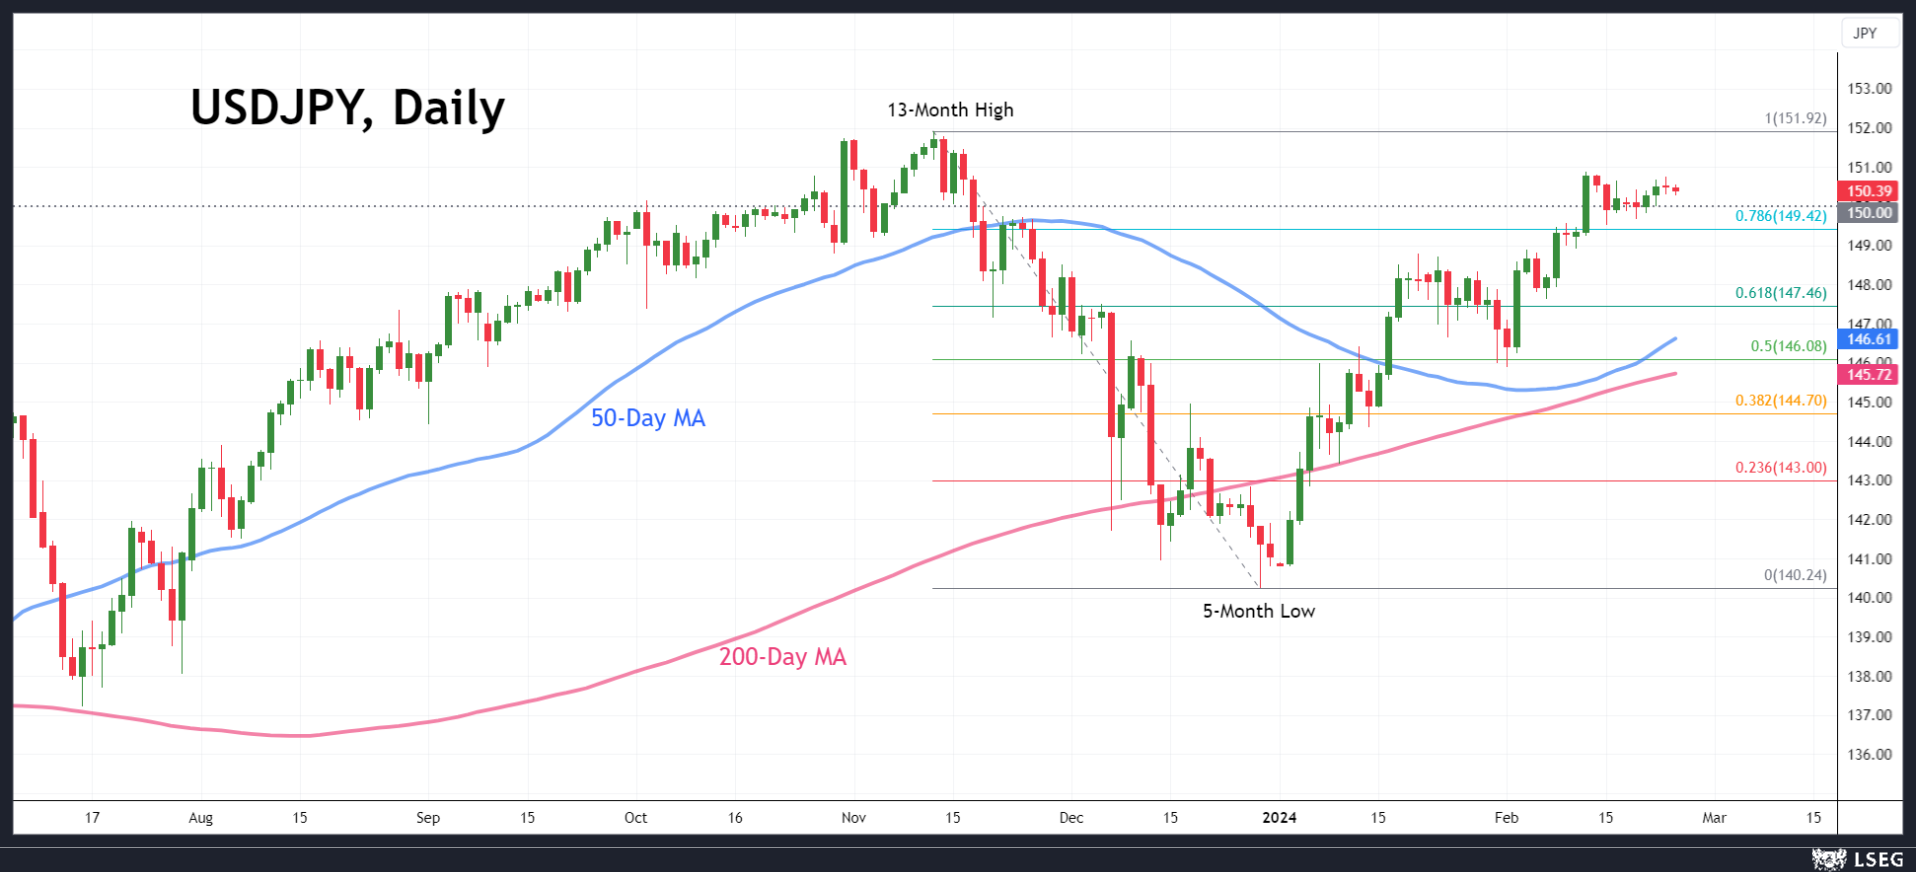
However, there are significant downside risks too for the greenback in the event of a miss in the core PCE price index. Whilst there are signs that the dollar’s latest upswing is running out of steam, it has nevertheless rebounded by around 2.5% against a basket of currencies this year and by more than 6% against the yen. A selloff could therefore stretch at least until the 50-day moving average in the 146.60 region if it turns into a negative correction.
Slowing consumption could be a good thing
Investors will also be watching the latest numbers on personal income and personal consumption that will be released alongside the PCE price indices. Personal income is expected to have increased by 0.4% m/m in January versus 0.3% in December. More importantly, personal consumption is forecast to have risen at a more moderate pace of 0.2% in January after surging by 0.7% in December.
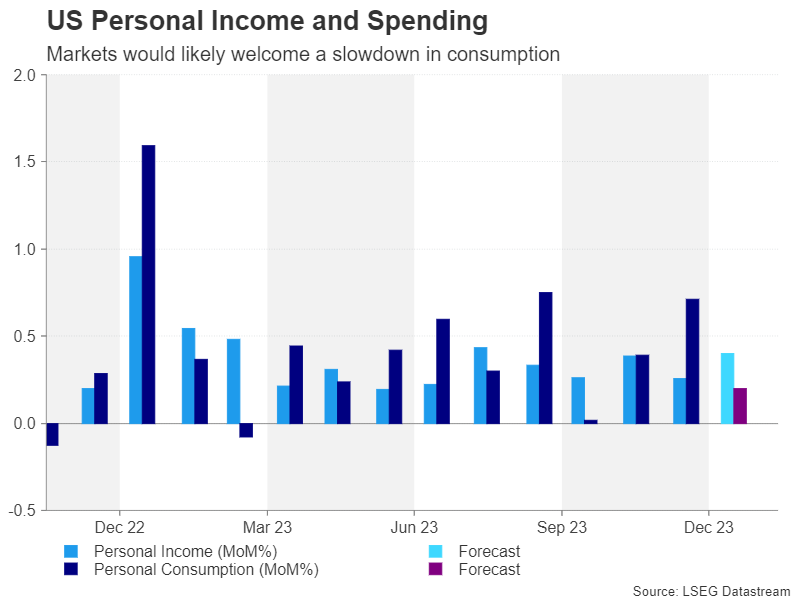
A slowdown in consumer spending could ease concerns about an overheating economy and so would likely be welcomed by equity markets, though not so much by the dollar. However, markets would not react as positively if there’s a sudden deterioration in consumption as investors are positioned for a soft landing in the US economy. Anything that questions that view would weigh on risk sentiment.
Also coming up
In other data due this week, durable goods orders for January will be watched on Tuesday, along with the consumer confidence index for February. On Wednesday, the second estimate of Q4 GDP might attract some attention, though no change is anticipated to the advance estimate of 3.3% annualized growth.
Closing the week on Friday will be the ISM manufacturing PMI for Friday. It’s expected that manufacturing activity improved slightly in February, with the PMI edging up to 49.5.
Gold Battles With 50-day SMA
- Gold rebounds strongly from its 2024 low
- Challenges 50-day SMA and ascending trendline
- Momentum indicators turn neutral-to-positive
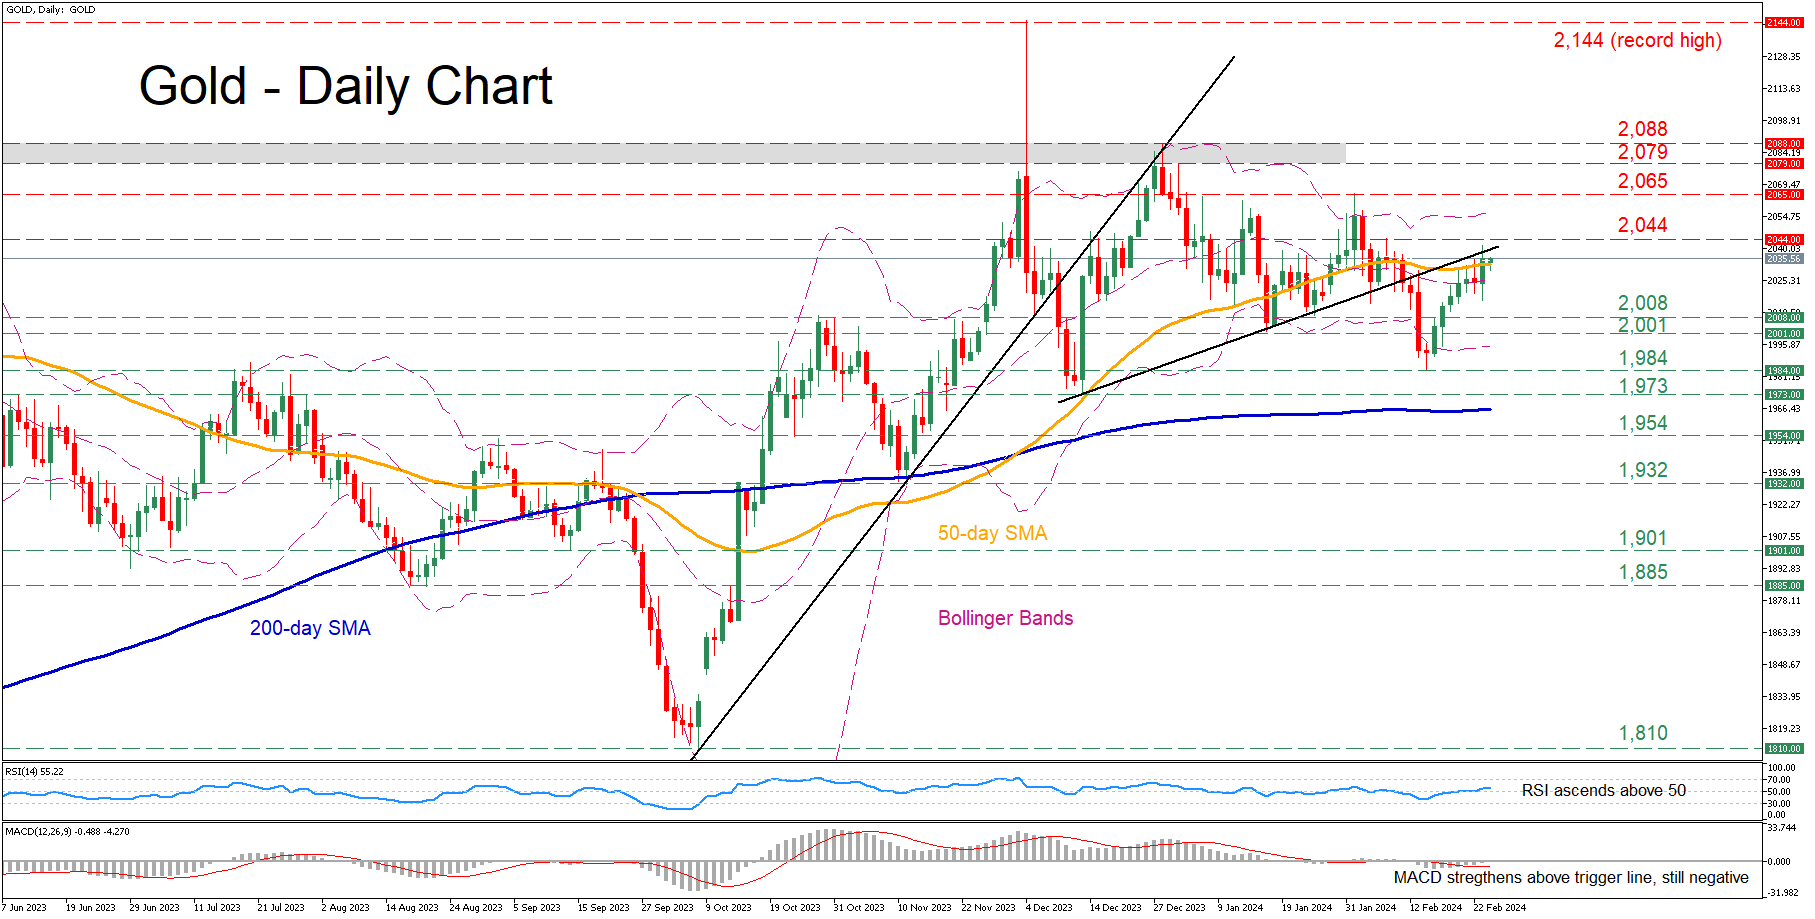
Gold has been regaining ground in the past few sessions, following its bounce off the 2024 bottom of 1,984. Although the price has recouped a significant part of its losses, it has currently stalled at the congested region that includes the 50-day simple moving average (SMA) and the ascending trendline that connects the higher lows since December.
Should bullish pressures persist, bullion could challenge the 2,044 hurdle, which acted as resistance both in December and February. Failing to halt there, the price may advance towards the February high of 2,065. An upside violation of that zone could open the door for the crucial 2,079-2,088 range.
Alternatively, if the price reverses back lower, the January support zones of 2,008 and 2,001 could act as the first lines of defence. Further declines might then cease around the 2024 bottom of 1,984. Even lower, the December low of 1,973 could provide downside protection.
In brief, gold has been in a recovery mode in the past two weeks, but the 50-day SMA has been repeatedly curbing its upside. Hence, a break above the latter is needed for the price to extend its rebound towards all-time highs.
Ethereum as Crypto Growth Driver
Market picture
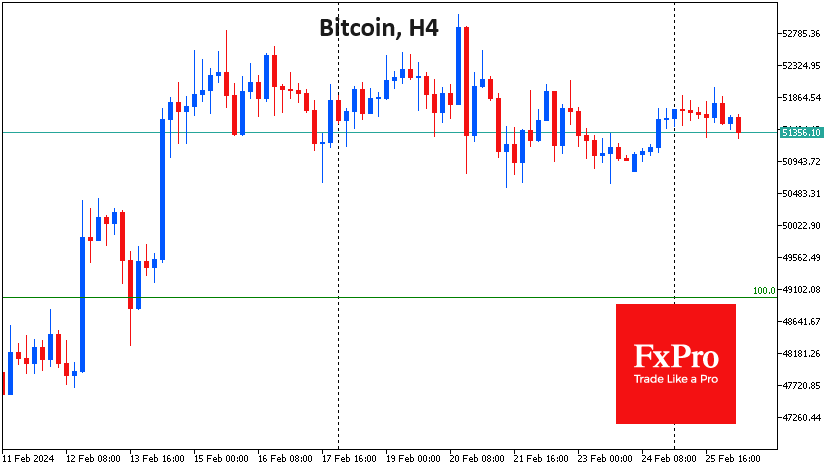
The crypto market settles at a $2 trillion cap level, up 0.8% on the day. Altcoins are once again driving growth, while the first coin is flat, losing 0.5% in 24 hours, and Ethereum is up 2.5%. BNB adds just under 2%, enjoying a resurgence of interest in cryptocurrency trading. XRP and Cardano both lose 1%, dragging the market back down.
Bitcoin and Ethereum are the cryptocurrencies of choice for institutional speculators. Their obvious trade right now is betting on the approval of spot ETFs on ETH. Speculators are cautiously locking in profits in BTC, which has previously rallied on the same theme.
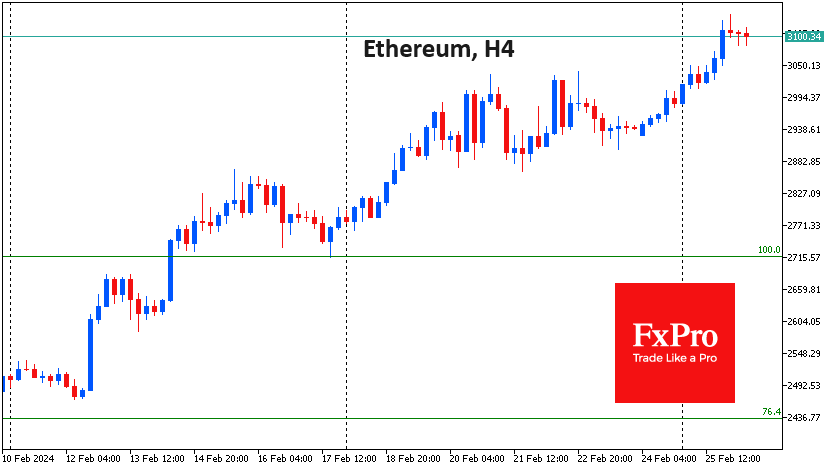
Remember that Ethereum’s market capacity is smaller than Bitcoin’s, which has a three times bigger market cap. This means that the price is more sensitive to changes in sentiment. Ethereum has gained 40% in 30 days, the best performance among the top 10 coins.
News background
About 90% of the bitcoins purchased by spot ETFs have gone to Coinbase’s custodial platform, its CEO Brian Armstrong said. He stated that the exchange’s custody service has accumulated more than $36 billion in BTC. The growing ETF market suggests that institutional capital is seriously considering bitcoin as one of the most reliable assets.
If the US SEC does not approve a spot Ethereum ETF in May 2024, it will do so by mid-2025, said attorney Scott Jonsson. Bloomberg analyst James Seyffarth believes the SEC won’t take as long to process Ethereum ETF applications as it did with BTC, as a significant portion of the applications could be based on Bitcoin ETFs. S&P Ratings expects the SEC to approve applications to launch the ETF in May.
The court approves a $4.3 billion payment by Binance exchange to the US Department of Justice as part of a plea deal. According to the signed agreement, the platform agreed to take significant steps to ensure continued compliance with US laws.
According to CryptoSlam, total sales of non-replaceable tokens (NFTs) on the Solana network have surpassed $5 billion, with 43 million NFT transactions. The Solana blockchain has more than 2.2 million buyers and 1.6 million sellers of NFTs.
Internet forum Reddit invests surplus funds in Bitcoin and Ethereum. The cryptocurrency investment strategy started back in 2022.
WTI Oil: Oil Price Extends Weakness on Fading Fed Rate Cut Expectations
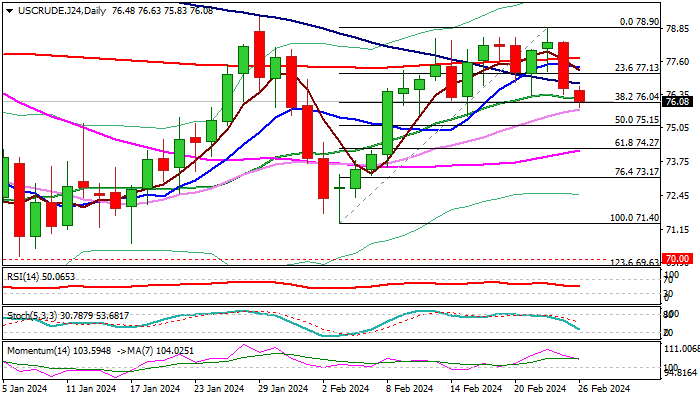
WTI oil price fell further in early Monday trading, in extension of Friday’s 2.2% drop, as the sentiment soured on signals that higher than expected US inflation may delay Fed rate cuts.
Fresh weakness emerged after several upside rejections and repeated failure to register a weekly close above important Fibo resistance at $78.13 (38.2% retracement of $95.00/$67.70 downtrend), which left a platform at $78.50/90 zone.
Near-term structure weakened as the price broke below a cluster of converged daily MA’s (200/10/100/ 20) and bullish momentum is fading, with formation of bearish engulfing pattern on weekly chart, adding to negative signals.
Bears cracked pivotal Fibo support at $76.04 (38.2% of $71.40/$78.90) with close below this level to further boost fresh bears for attack at $75.34/15 (daily Kijun-sen / 50% retracement) loss of which to confirm reversal.
Falling 10DMA ($76.75) offers solid resistance which should keep the upside protected and keep near-term bears intact.
Res: 76.99; 77.65; 78.50; 79.27.
Sup: 76.17; 75.81; 74.97; 74.12.
XAU/USD: Geopolitical Tensions Continue to Support Gold Price
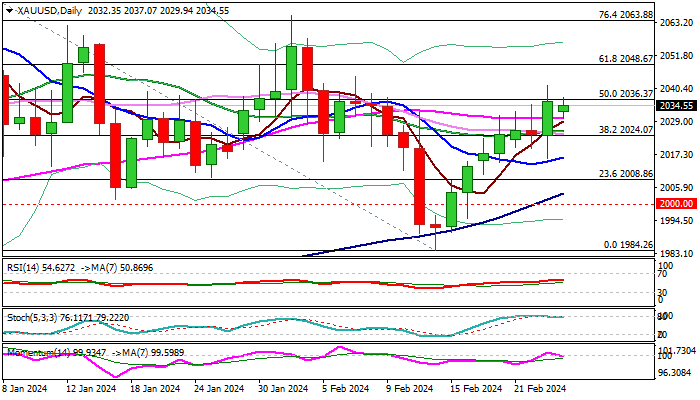
Gold stands at the front foot at the start of the week and holds near two-week high ($2041) posted on Friday.
Growing tensions in the Middle East and overall negative geopolitical picture, continue to fuel safe haven demand and boost metal’s price, along with neutral / negative near-term outlook for the US dollar.
Technical picture on daily chart is improving, as moving averages turned to full bullish configuration, though overbought stochastic and flat momentum requires caution.
Last week’s gains completed reversal pattern on weekly chart, adding to positive signal, which looks for verification on sustained break of cracked $2036 pivot (50% retracement of $2088/$1984 / 10WMA).
Near-term bias is expected to remain with bulls while the price stays above $2024 (daily Kijun-sen / broken Fibo 38.2%) and keep in focus next target at $2048 (Fibo 61.8%), guarding $2065 (Feb 1 high).
Markets await release of key US economic indicators this week (Q4 GDP on Wednesday and PCE price index on Thursday) which are expected to provide more details about Fed’s next steps regarding interest rates and generate fresh direction signals.
Res: 2041; 2048; 2057; 2065.
Sup: 2024; 2016; 2008; 2003.
NZD/USD Technical Analysis: Bearish Start To News-heavy Week
After 8 consecutive days of growth, the price of NZD/USD is forming a bearish candle this morning, thereby indicating possible concerns among market participants at the beginning of a week full of important economic news:
→ On Wednesday, at 4:00 GMT+3, the RBNZ decision on interest rates will be published. There will also be a press conference by the leadership of the Central Bank.
→ On the same day, at 16:30 GMT+3, news about US GDP is expected.
→ On Thursday, at 16:30 GMT+3, inflation data in the United States will be published, namely Core PCE Price Index GMT+3.
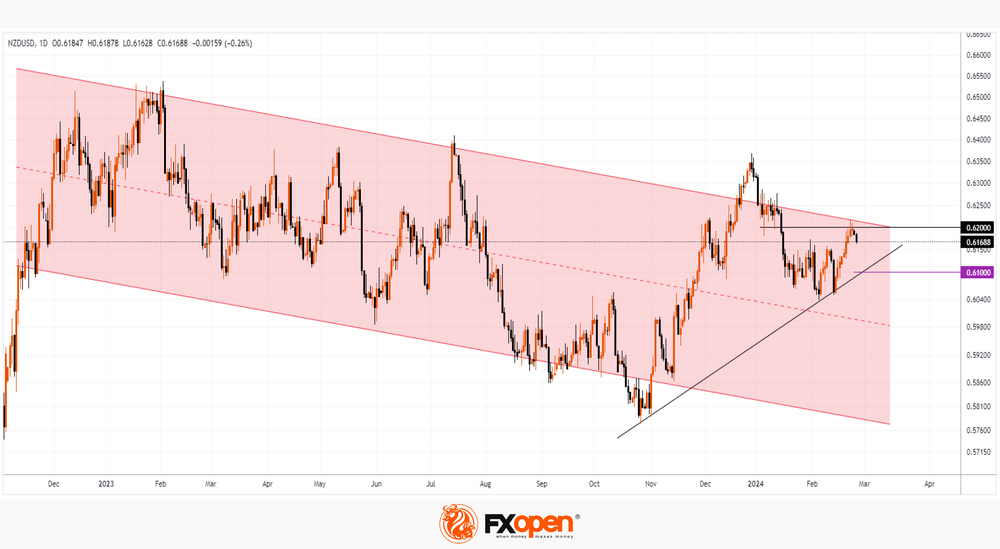
Note that in 2023, the NZD/USD price behaved bearishly, forming a downward channel (shown in red).
Technical analysis of the NZD/USD price chart provides confirmation of bearish sentiment in the form of a test of the 0.62 level — which showed support in early January and now appears to be resisting.
If the news acts as a driver for downward momentum:
→ the price of NZD/USD may fall towards the trend line shown in black. It is enhanced by the psychological level of 0.61.
→ This could result in a strategic reversal downwards from the area where the upper border of the red channel lies.
Be prepared for spikes in volatility throughout the week.
Trade over 50 forex markets 24 hours a day with FXOpen. Take advantage of low commissions, deep liquidity, and spreads from 0.0 pips. Open your FXOpen account now or learn more about trading forex with FXOpen.
This article represents the opinion of the Companies operating under the FXOpen brand only. It is not to be construed as an offer, solicitation, or recommendation with respect to products and services provided by the Companies operating under the FXOpen brand, nor is it to be considered financial advice.