Sample Category Title
BoE Bailey: Market’s rate cut outlook not unreasonable, yet unendorsed
In a session with the Treasury Select Committee today, BoE Governor Andrew Bailey acknowledged that It's "not unreasonable" for the market to think about reductions in interest rates this year
However, he was quick to qualify this by stating that MPC "do not endorse the market curve" forecasting such cuts, adding that "we are not making a prediction of when or by how much" BoE cuts interest rates.
Bailey pointed to "encouraging signs" in key economic indicators, but stressed the importance of "sustained progress" in tackling inflation.
Addressing recent data indicating the UK's entry into a technical recession in the latter half of the previous year, Bailey downplayed its impact, describing the downturn as "very weak" and pointing to "distinct signs of an upturn."
Australian Dollar Shrugs after RBA Minutes, China Rate Cut
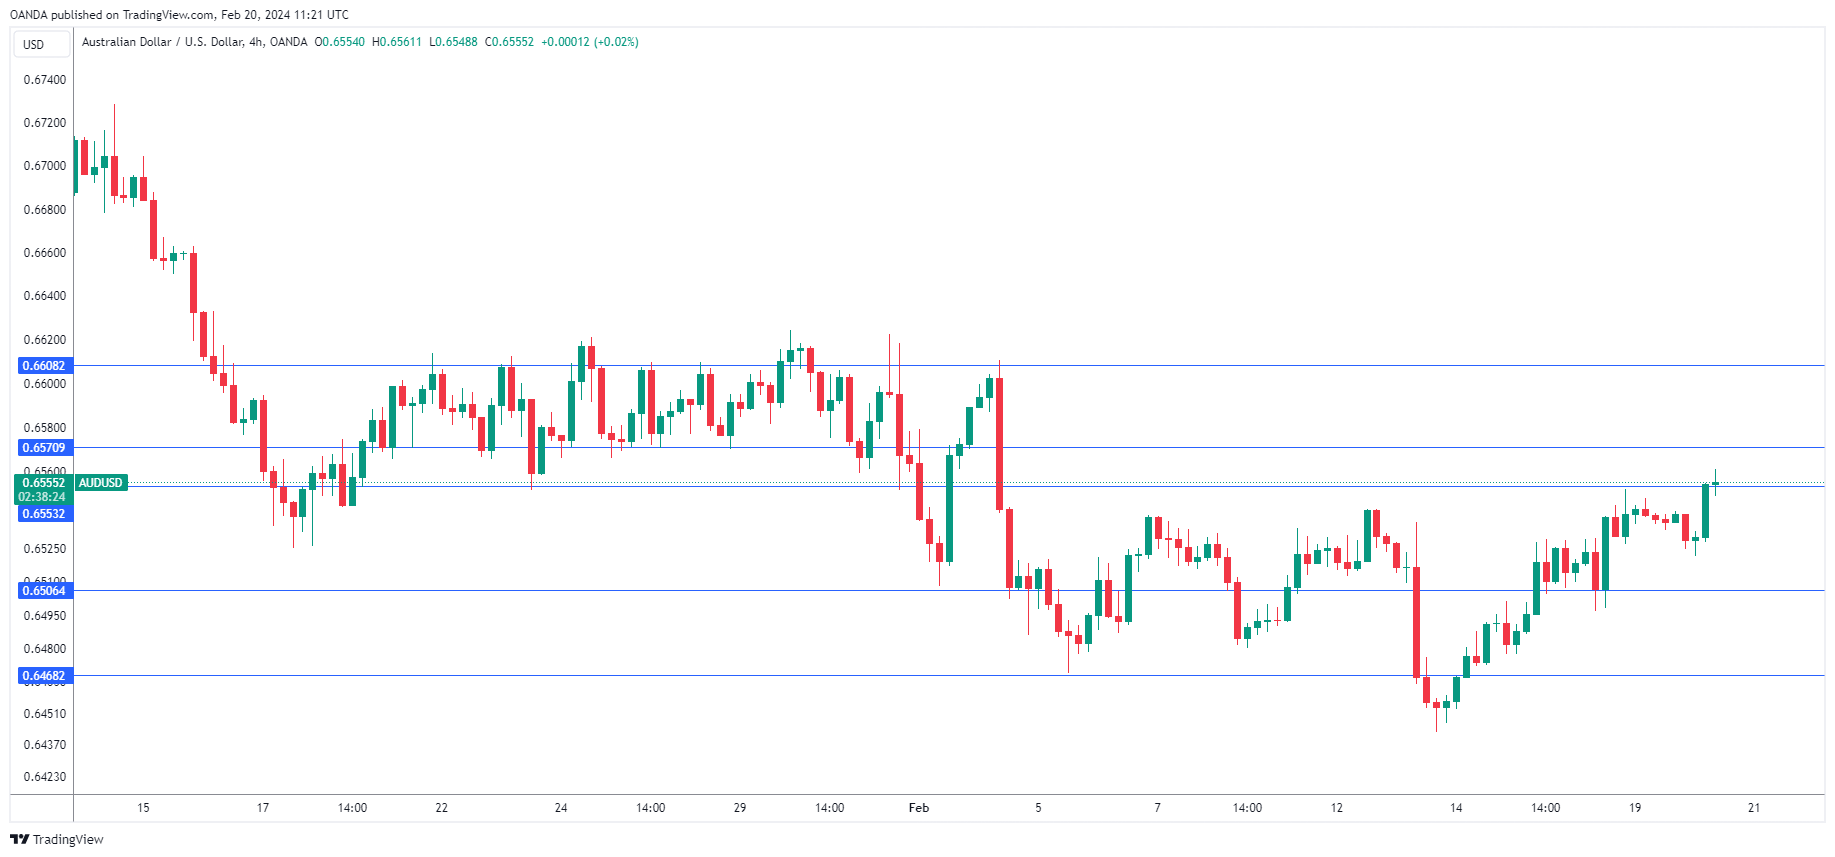
The Australian dollar continues to rally and has extended its gains for a fifth successive day. In the European session, AUD/USD is trading at 0.6550, up 0.19%.
Minutes: RBA considered raising rates
The minutes of the RBA’s February meeting were released earlier today. At the meeting, there RBA maintained the cash rate at 4.35%, as expected. The minutes indicated that some members supporting raising interest rates by a quarter-point. This was due to a concern about sticky inflation.
The RBA has raised rates only once since June, which has led to the markets pricing in rate cuts later this year. The RBA has pushed back against these expectations as inflation is running at 4.1%, well above the 1-3% target band. The central bank expects the inflation battle to be a long one, projecting that inflation will only fall back to 3% in mid-2025 and 2% by 2026.
At the February meeting, the RBA warned that it was prepared to raise rates. The minutes noted that the central bank expects the economy to continue to cool and it is prepared to lower rates if economic activity falls more than expected.
The minutes indicated that there is significant uncertainty over the economic outlook and the direction of inflation. Given this backdrop, the RBA has been forced to send mixed messages to the markets, stating that rate cuts and rate hikes both remain on the table. What will likely determine which direction the RBA eventually takes will be dependent on key data, such as the wage price index which will be released on Wednesday.
China cuts 5-year LPR
In a surprise move, the People’s Bank of China cut the five-year loan prime rate by a quarter point to 3.95%, the largest rate cut since 2019. Lower rates should translate into a reduction in mortgage rates for homeowners and support the troubled property sector. Still, the move is not considered a game-changer for the Chinese economy and the Australian dollar isn’t showing much of a response.
AUD/USD Technical
- AUD/USD put pressure on support at 0.6506 earlier. Next, there is support at 0.6468
- 0.6570 and 0.6608 are the next resistance lines
Gold Rises But Within a Downward Channel
Gold rallied for the fourth consecutive session to reach $2023, recovering almost all the losses suffered the week before on the back of the inflation report. Gold’s ability to rally suggests continued domestic demand, as some investors are clearly rushing to buy back any losses.
At the same time, however, we note that since the beginning of the year, gold has been characterised by solid selloffs on the news, forming a smooth downtrend. In the context of this downtrend, a rise to $2040-2045, which is the upper boundary of the bearish range, looks quite acceptable.
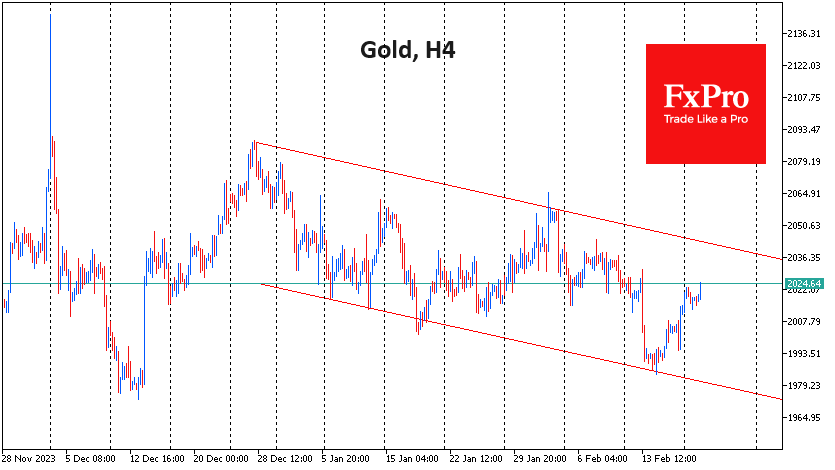
The area around $2035 – the highs of two weeks ago – also appears to be a crucial intermediate level. Confident buying from this level would be the first important signal that the recent correction is over and that gold is ready to make a fresh assault on the highs.
Much more important, however, will be the behaviour of gold as it approaches the $2050 level, where the reversal of the decline in late January took place. Consolidation at this level would confirm the breakdown of the downtrend and set the stage for a move towards $2100 and the subsequent renewal of historic highs.
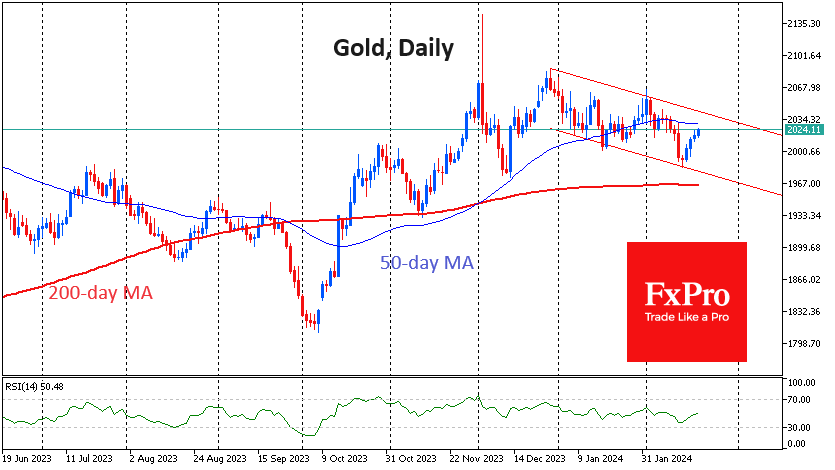
However, as long as gold is trading within the downtrend, there is a greater chance of a breakdown or even an acceleration of the downtrend.
Among the fundamental factors, the potential for growth could be provided by the fall in the dollar if Fed officials show a softening of their position, bringing the start of interest rate cuts closer.
On the bearish side, equities could come under pressure following the optimistic rally in the tech giants and the news of a sharp slowdown in economic activity. We also do not rule out the possibility that the recent support measures for the Chinese stock market and property sector will cool demand for gold as a safe-haven for investors from that part of the world.
Is the US 100 Cash Index Close to a Correction?
- US 100 index is in red today, testing the support set by a key trendline
- It remains a tad below its all-time high as the market looks for new bullish catalysts
- Stochastic oscillator is trying to send a bearish message
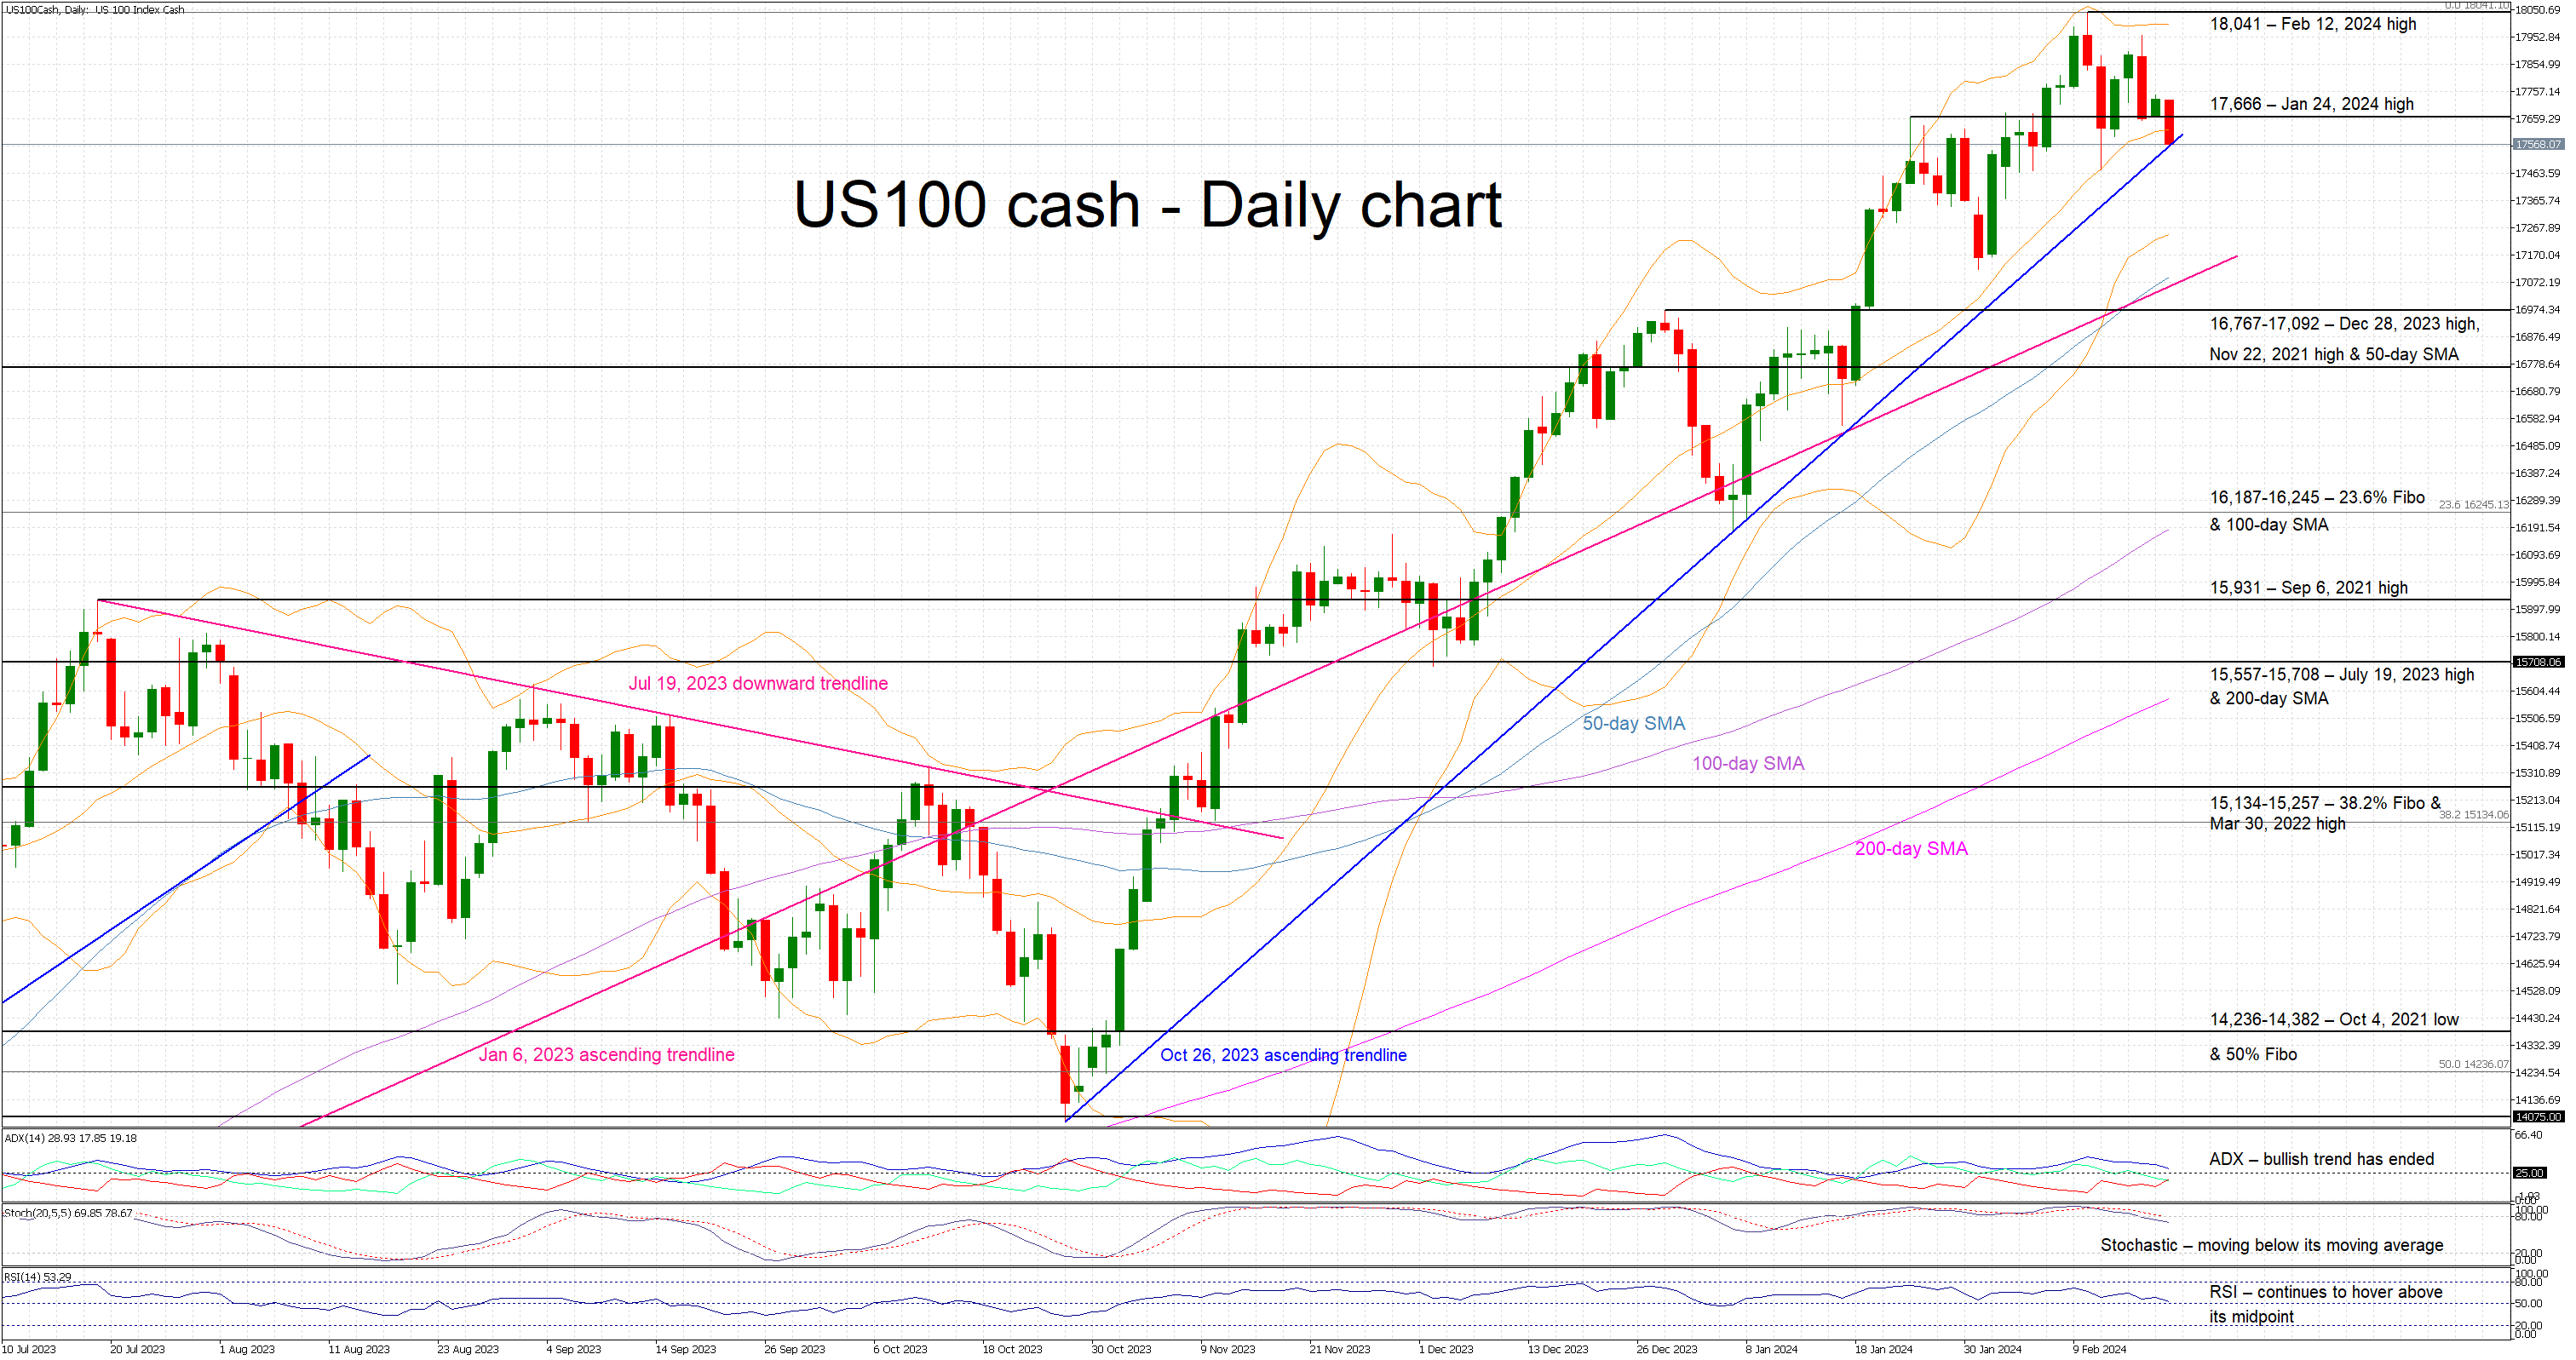
The US 100 cash index is lower today, testing the support set by the October 26, 2023 ascending trendline but remaining very close to its February 12, 2024 high of 18,041. The journey higher has almost been a straight line, raising questions on the soundness of this upleg and potentially opening the door for a sizeable correction if the bears manage to take over control of the US 100 index.
Such a possibility is not really that far-fetched considering the current stance of the momentum indicators. More specifically, the stochastic oscillator has broken below both its moving average and overbought territory. Should this move pick up pace, it could be seen as a strong bearish signal. Additionally, the RSI could be possibly preparing for a decent break below its 50-midpoint for the first time in 2024. Interestingly, the Average Directional Movement Index (ADX) has not yet made up its mind, as it continues its downward move towards its 25-threshold.
Should the bulls remain confident, they could try to protect their gains and gradually lead the US 100 index above the January 24, 2024 high at 17,666. If successful, they could have the chance to test the February 12, 2024 high at 18,041 and then record a new all-time high, with the 18,500 level being their next likely target.
On the flip side, the bears are trying to retake the market reins. They could try to push the US 100 index below the October 26, 2023 trendline and then, provided that they overcome the January 6, 2023 trendline, the bears could stage a correction towards the busy 16,767-17,092 area. This is populated by the December 28, 2023 high, the November 22, 2021 high and the 50-day simple moving average (SMA), and it is expected to prove a strong support area.
To sum up, the US 100 cash index is in the red today as the bears are pinning their hopes on the momentum indicators signalling a much-delayed correction.
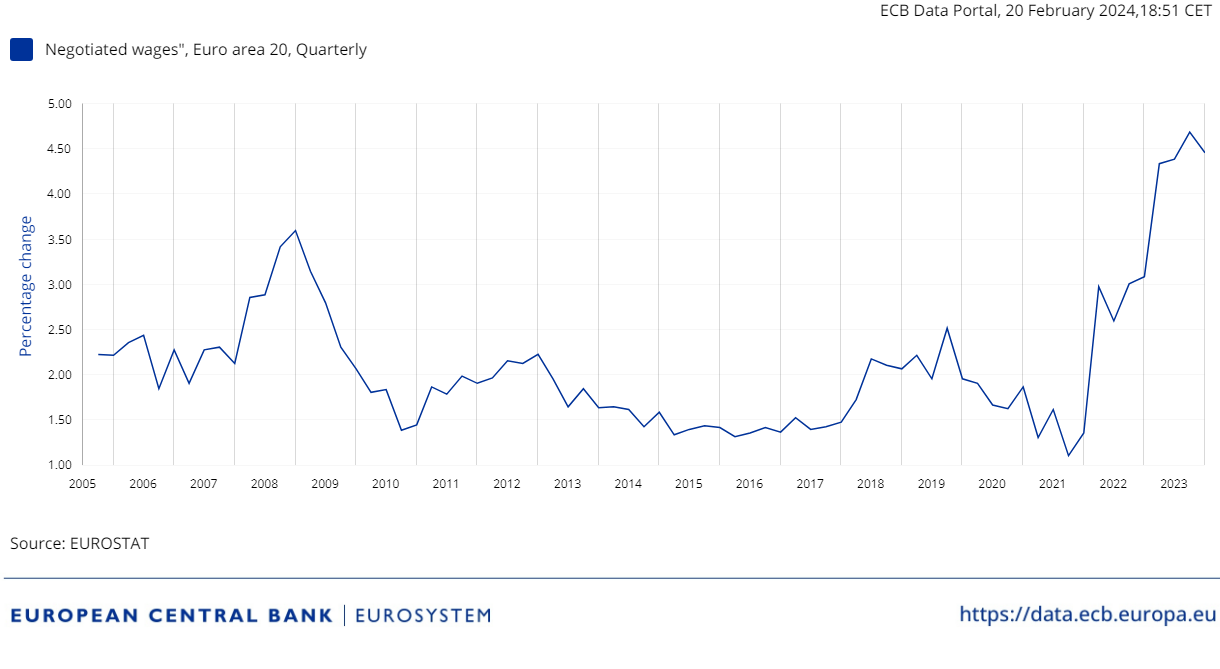
ECB wage growth data: A glimpse of hope but no trigger for immediate rate cuts
ECB released data today indicating a slight decrease in negotiated wage growth to 4.46% in Q4, marking a downturn from the previous quarter's record high of 4.69%. This development, though modest, is likely to be greeted positively by ECB policymakers, signaling a potential onset of wage growth deceleration anticipated throughout the year.
Despite the reduction, the magnitude of the drop is not substantial enough to prompt ECB to consider an immediate rate cut in March. The data presents a cautious optimism rather than a clear-cut rationale for policy easing. If ECB's more hawkish members advocate for further evidence of wage growth deceleration, preferring to wait for the next wage data release in May, the likelihood shifts towards a rate cut in June, rather than April, as the more plausible timeline for monetary policy adjustment.
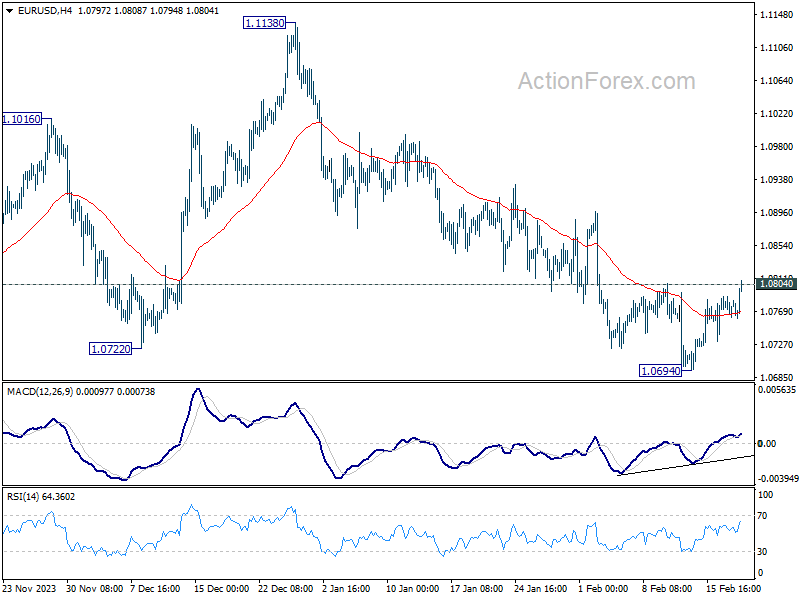
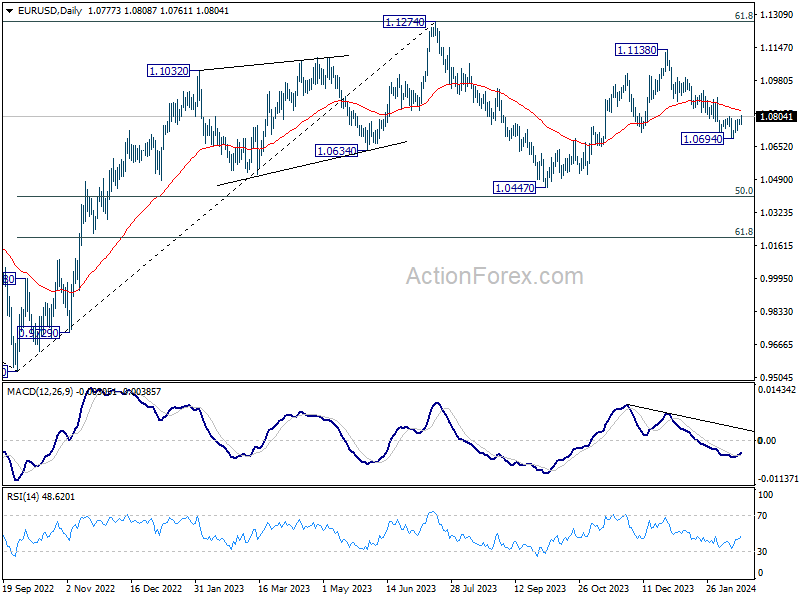
EUR/USD bounces further in European session and the break of 1.0804 resistance argues that a short term bottom was formed at 1.0694, on bullish convergence condition in 4H MACD. Further rebound is now in favor to 55 D EMA (now at 1.0832). Sustained break there will argue that whole fall from 1.1138 has completed and bring stronger rally back to this resistance.
USDCHF Regains Some Power, But Still at Risk
- USDCHF gets rejected near familiar resistance
- Short-term bias remains positive but probably too weak
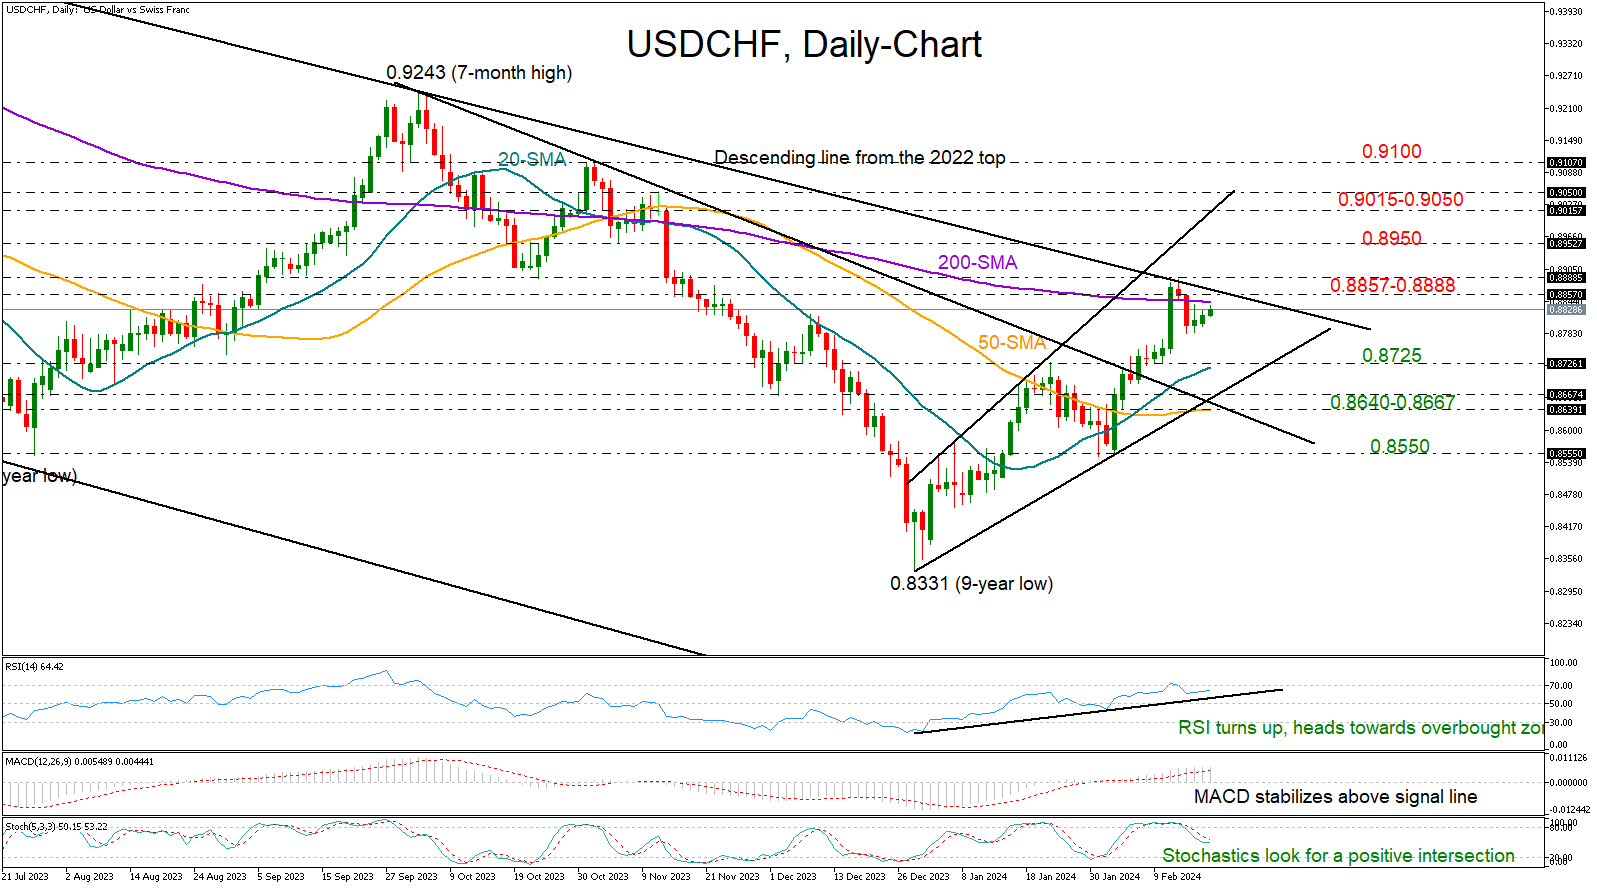
USDCHF has been in the green almost every week since the plunge to a nine-year low of 0.8331 at the end of December, but the bullish wave was not strong enough to overcome the descending trendline from the 2022 top last week.
The bulls, however, have not totally abandoned the battle. They are currently trying to recoup their latest pullback to stage another fight within the 0.8857-0.8888 area.
From a technical perspective, the short-term bias is still skewed to the upside as the RSI is comfortably above its 50 neutral mark, though the indicator is also a short distance below its 70 overbought level, suggesting that upside pressures might fade soon.
A solid move above the 0.8888 bar could encourage a rally towards the 0.8950 constraining zone. Running higher, the pair may attempt to pierce through the resistance line at 0.9015 and climb the 0.9050 barrier with scope to reach October’s obstacle near the 0.9100 psychological level.
In the event the pair faces another failure near its 200-day simple moving average (SMA) and the 0.8860 region, sellers could enter the market with force, sinking the price towards its 20-day SMA at 0.8725 and January’s high. Slightly lower, the trendline zone of 0.8640-0.8667 may protect the market from a potential slump to 0.8550.
All in all, USDCHF has been on an uptrend so far this year, but its short-term outlook remains fragile as a long-term barrier is still a threat at 0.8888.
Crypto Market Growth Halted Amid Capital Inflows
Market picture
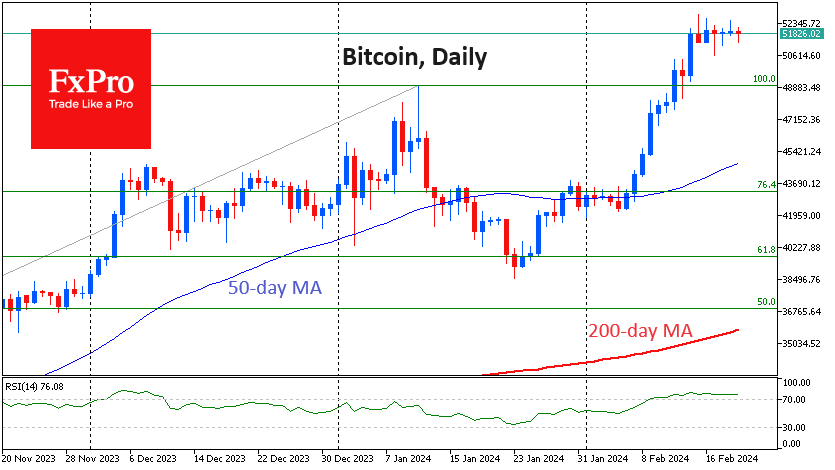
The crypto market has corrected 0.46% in the last 24 hours, fluctuating within a narrow range without a clear direction. Bitcoin is down 1% but up 3.7% over seven days, Ethereum is flat for the day but up 10.6% over the week. The top coins are mixed with BNB +2% and Solana -2.5%.
Bitcoin is currently drawing its fourth daily candle with opening and closing levels close to each other. Such sideways consolidations are characteristic of strong bull markets, as opposed to corrective pullbacks on smoother rallies.
Ethereum hit local highs on rumours of a positive regulatory decision before the end of March. Bloomberg analyst James Seyffarth bet 4 ETH that the SEC will not approve a spot Ethereum ETF next month.
According to data from CoinShares, investment in crypto funds rose by a record $2.452 billion last week, following inflows of $1.116 billion the previous week. Bitcoin investments increased by $2.424 billion, Ethereum by $21 million, Cardano lost $6 million, and Solana lost $1.6 million.
Since the beginning of the year, crypto funds have seen inflows of an impressive $5.2 billion, with total AUM rising to $67 billion, the highest since December 2021.
News background
Bitcoin will see institutional support in the next three to six months, according to Coinbase. Bitcoin ETFs could eventually become a major competitor to gold funds.
According to IntoTheBlock, there is an 85% chance that Bitcoin will reach a new all-time high within the next six months. Five factors could contribute to this: the halving of the price, ETFs, monetary easing, the US election, and companies accumulating BTC as part of their treasuries.
Former CIA contractor Edward Snowden, who has been living in Russia since 2013, called bitcoin the most significant achievement of the financial system in the entire existence of money and means of exchange.
Amberdata admitted that Ethereum will outpace Bitcoin in terms of growth due to more constructive deflationary policies. The supply of ETH has been decreasing since September 2022, thanks to the update of The Merge, as well as the implementation of a mechanism to burn part of the commissions. During this time, around 0.36 million ETH, or 0.3% of the total supply of 120 million coins, have been removed from circulation.
Bearish Yields Could Send US Dollar Lower
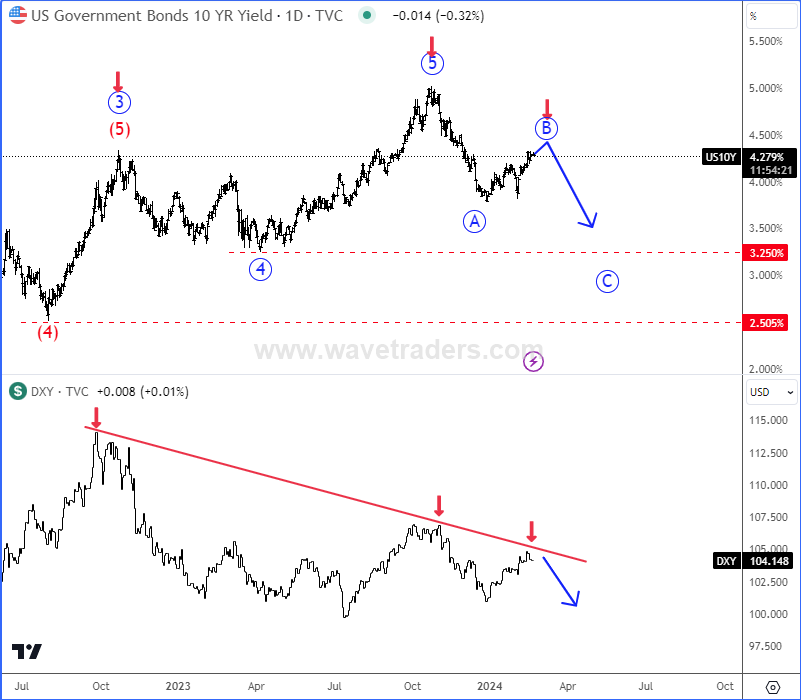
US Yields have topped back in October 2023 with sharp leg down, which is from Elliott wave perspective first leg A of a deeper A-B-C decline that can send the price back to the former wave 4 area to 3.25% - 2.5%.
At the same time, we can see US dollar Index - DXY also turning down due to a positive correlation with Yields, we just saw some divergence in 2023.
https://www.youtube.com/watch?v=1Z9PiQG6auc
EURJPY on the Rise Above 162.00, But for How Long?
- EURJPY posts new 3-month high
- Momentum indicators are gaining ground
- Positive structure remains intact above short- and long-term diagonal lines
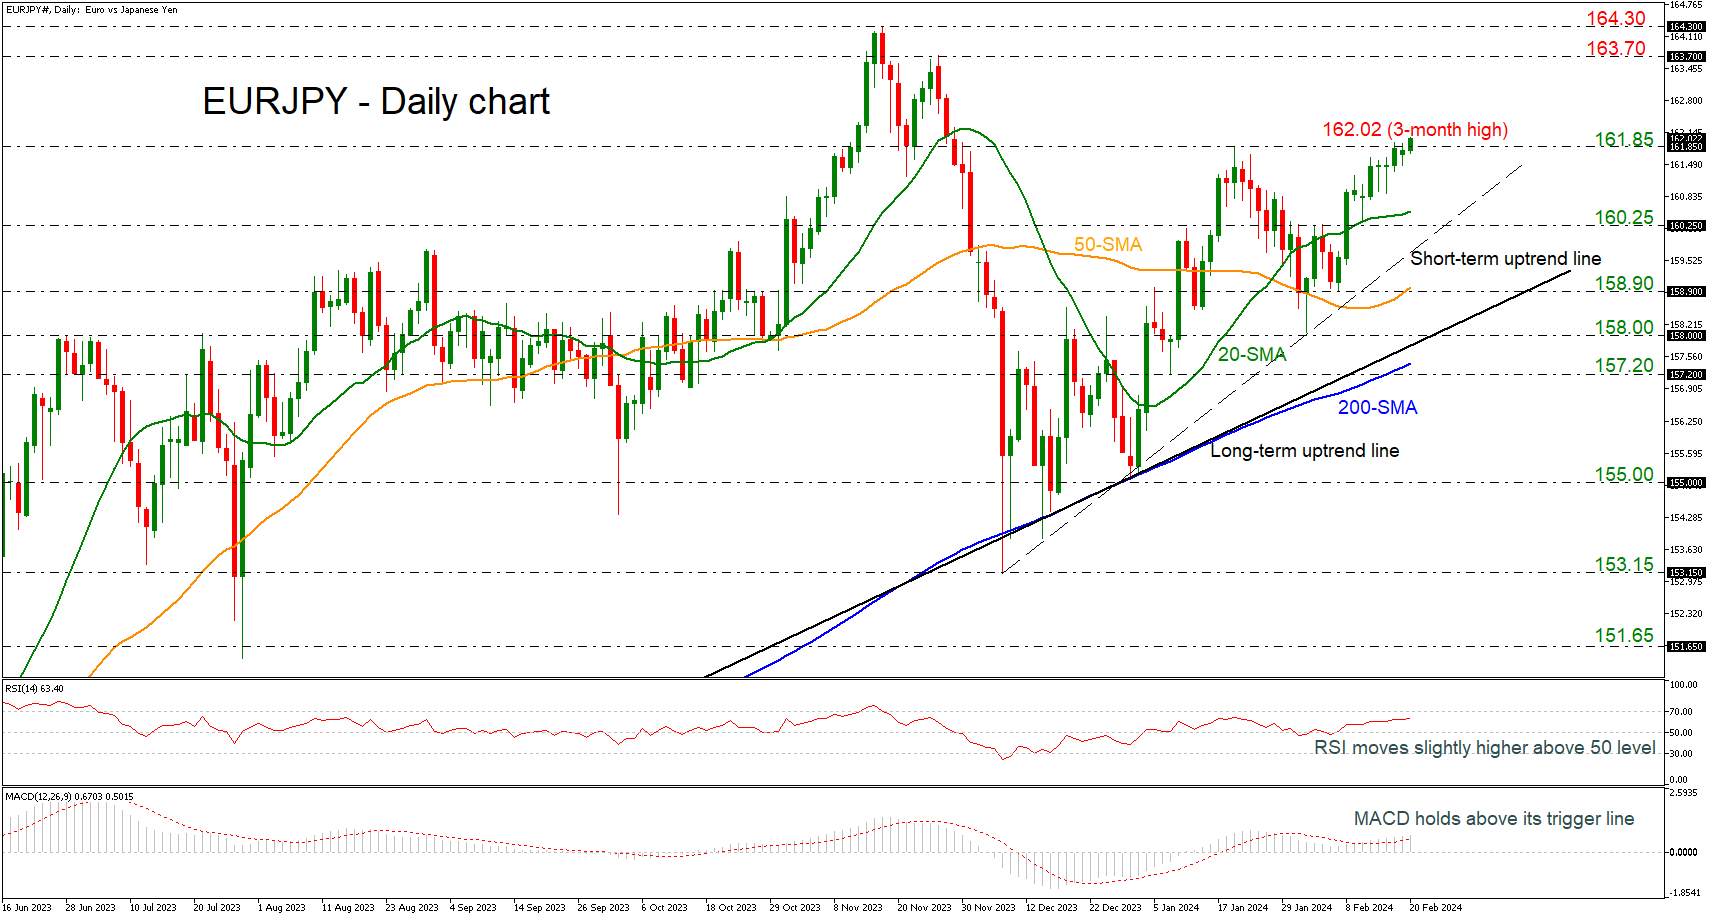
EURJPY is skyrocketing above the 162.00 round number, recording a fresh three-month high. The market is completing a strong bullish rally after the bounce off the 158.90 support level, posting the tenth consecutive green day.
To attract new buyers, the bulls will have to surpass today’s high and move beyond the 163.70 resistance level, taken from the peak on November 27. Another successful battle there could see the price jumping into the 164.30 barricade, registered on November 16.
Technically, the RSI indicator is trying to strengthen its positive momentum above the neutral threshold of 50, approaching the 70 level, while the MACD is extending its move above its trigger and zero lines.
Hence, a downside correction could still be possible in the coming sessions. If the pair slumps below the 20-day simple moving average (SMA) at 160.50 and the 160.25 support level, it could stabilize near the short-term ascending trend line at 159.90. Otherwise, the sell-off could expand towards the 50-day SMA at 158.90. Yet only a clear close below the long-term uptrend line of around 158.00 would disappoint medium-term traders.
Summing up, EURJPY is looking strongly bullish in the short- and long-term timeframes. To boost buying confidence, the pair will need to have a closing day above 161.85.
GBP/JPY Daily Outlook
Daily Pivots: (S1) 188.88; (P) 189.17; (R1) 189.44; More...
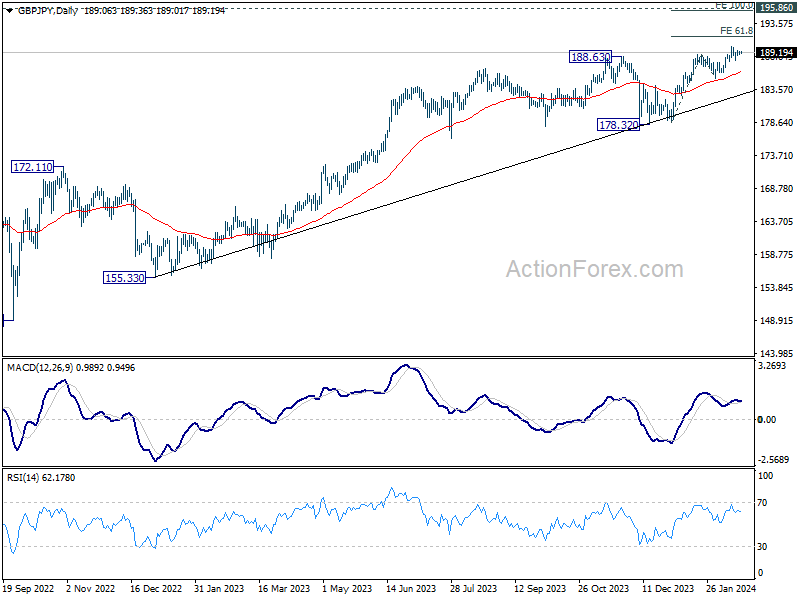
GBP/JPY is still extending range trading below 190.05 and intraday bias remains neutral. Further rally is expected with 187.83 minor support intact. Break of 190.05 will target 61.8% projection of 178.71 to 188.90 from 185.21 at 191.50. However, break of 187.83 will turn bias to the downside for deeper correction back to 185.21 support instead.
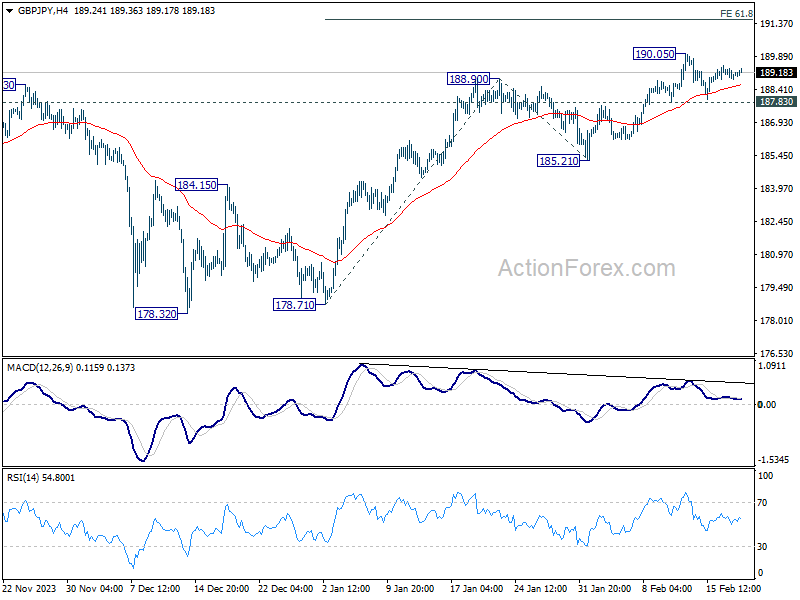
In the bigger picture, up trend from 123.94 (2020 low) in in progress. Medium term outlook will stay bullish as long as 178.32 support holds. Next target is 195.86 long term resistance (2015 high).