

Sample Category Title
USD/CHF Daily Outlook
Daily Pivots: (S1) 0.8802; (P) 0.8819; (R1) 0.8841; More....
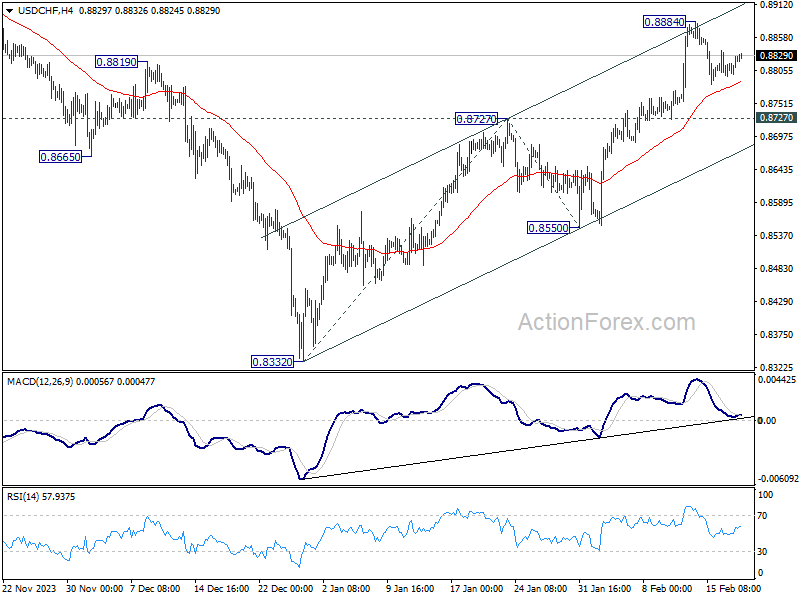
Intraday bias in USD/CHF remains neutral as consolidation from 0.8884 is still extending. Further rally is expected as long as 0.8727 resistance turned support holds. On the upside, break of 0.8885 will resume the rise from 0.8332 and target and 100% projection of 0.8332 to 0.8727 from 0.8550 at 0.8954. However, sustained break of 0.8727 will dampen this bullish view, and turn bias back to the downside for 0.8550 support instead.
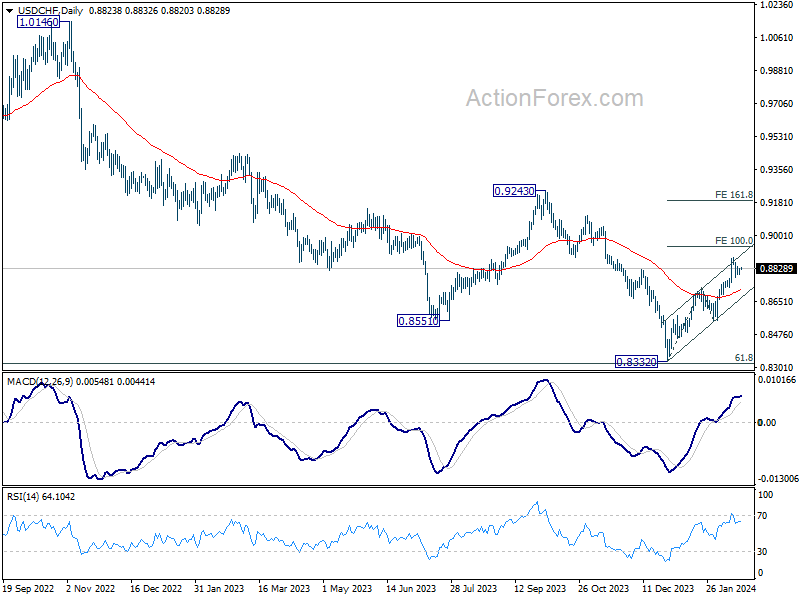
In the bigger picture, a medium term bottom should be formed at 0.8332, on bullish convergence condition in W MACD, just ahead of 0.8317 long term fibonacci support. It's still early to decide if the larger down trend from 1.0146 (2022 high) is reversing. But further rise should be seen to 0.9243 resistance even as a correction.
USD/JPY Daily Outlook
Daily Pivots: (S1) 149.93; (P) 150.09; (R1) 150.30; More...
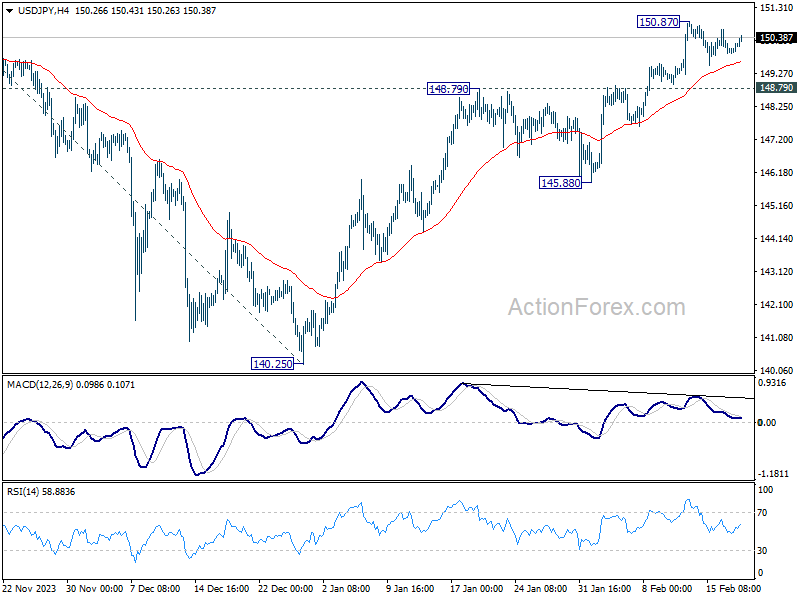
Intraday bias in USD/JPY remains neutral as consolidation from 150.87 is still extending. In case of another retreat, downside should be contained by 148.79 resistance turned support to bring another rally. Above 150.87 will resume the rise from 140.25 to 151.89/93 key resistance zone. Decisive break there will confirm larger up trend resumption of 155.50 projection level next. However, firm break of 148.79 will turn bias to the downside for 145.88 support.
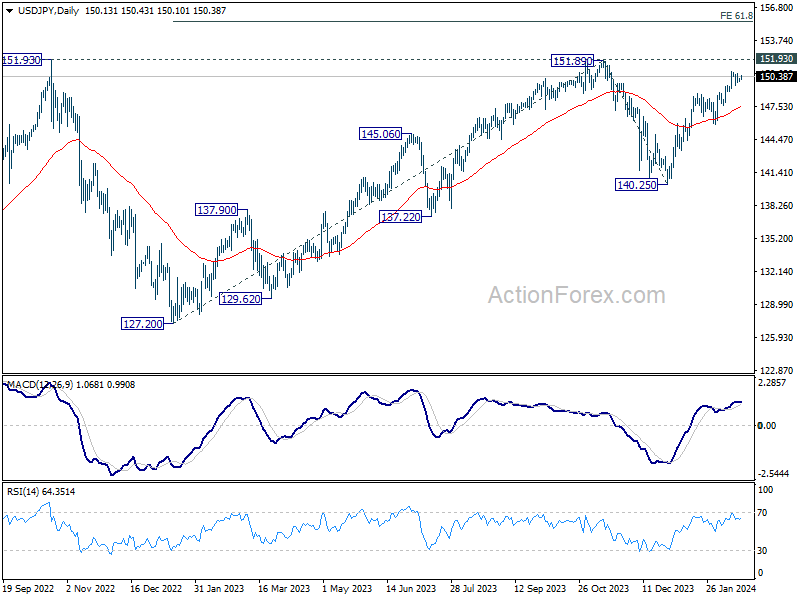
In the bigger picture, fall from 151.89 is seen as a correction to the rally from 127.20, which might have completed at 140.25 already. Firm break of 151.89/93 resistance zone will confirm up trend resumption, and next target will be 61.8% projection of 127.20 to 151.89 from 140.25 at 155.50. This will now remain the favored case as long as 140.25 support holds.
AUD/USD Daily Report
Daily Pivots: (S1) 0.6527; (P) 0.6540; (R1) 0.6553; More...
No change in AUD/USD's outlook as consolidation from 0.6442 is extending. Intraday bias remains neutral for the moment. Stronger recovery cannot be ruled out, but outlook will remain bearish as long as 0.6621 resistance holds. Break of 0.6642 will resume the decline from 0.6870 towards 0.6269 low.
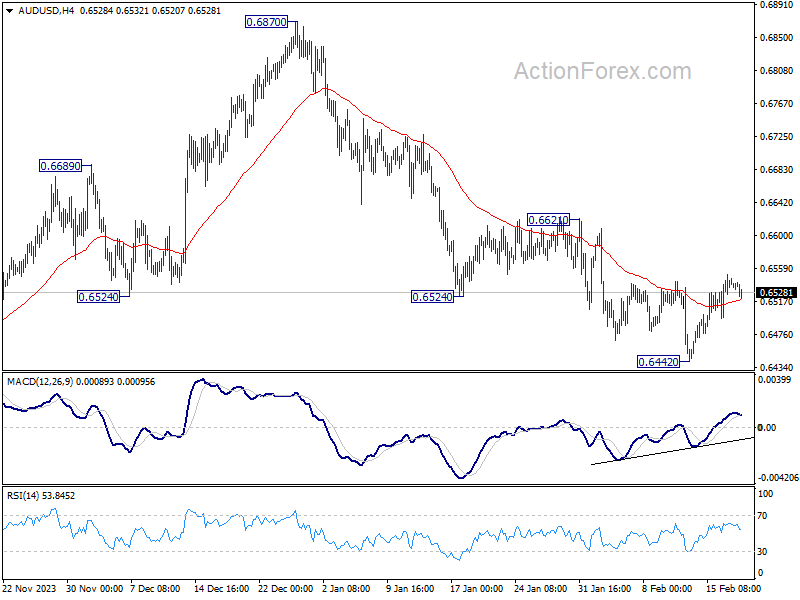
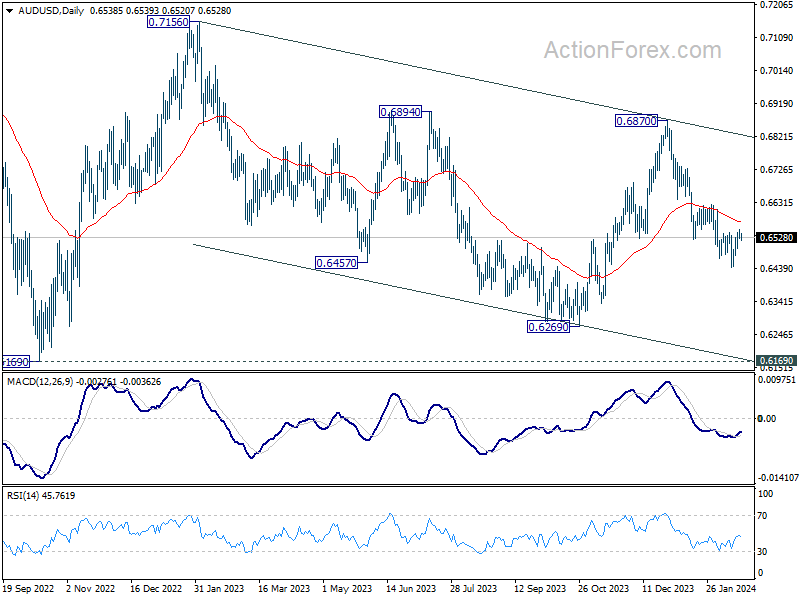
In the bigger picture, price actions from 0.6169 (2022 low) are seen as a medium term corrective pattern to the down trend from 0.8006 (2021 high). Fall from 0.7156 (2023 high) is seen as the second leg, which might still be in progress. Overall, sideway trading could continue in range of 0.6169/7156 for some more time. But as long as 0.7156 holds, an eventual downside breakout would be mildly in favor.
USD/CAD Daily Outlook
Daily Pivots: (S1) 1.3473; (P) 1.3485; (R1) 1.3503; More...
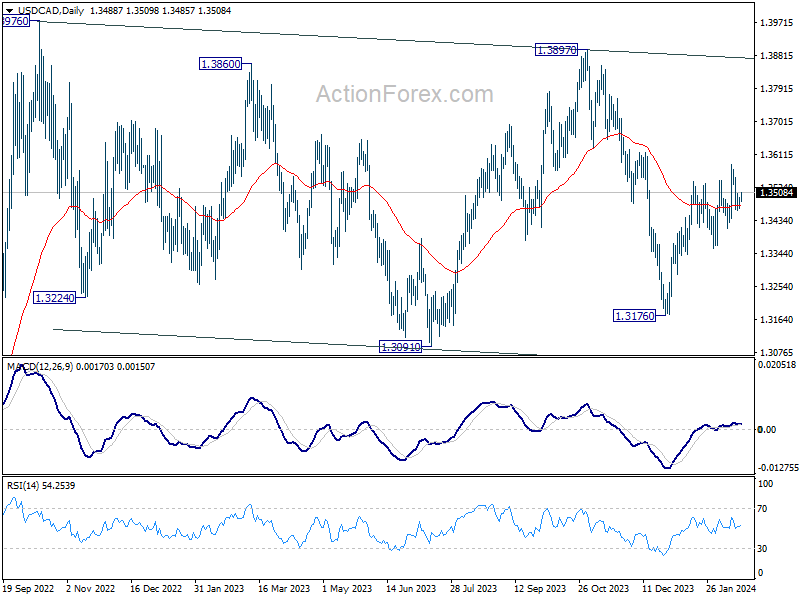
USD/CAD is still bounded in range below 1.3585 and intraday bias remains neutral. More consolidations could be seen, but further rally is expected as long as 1.3357 support holds. On the upside, firm break of 1.3585 will resume the rebound from 1.3176 for 1.3897 resistance.
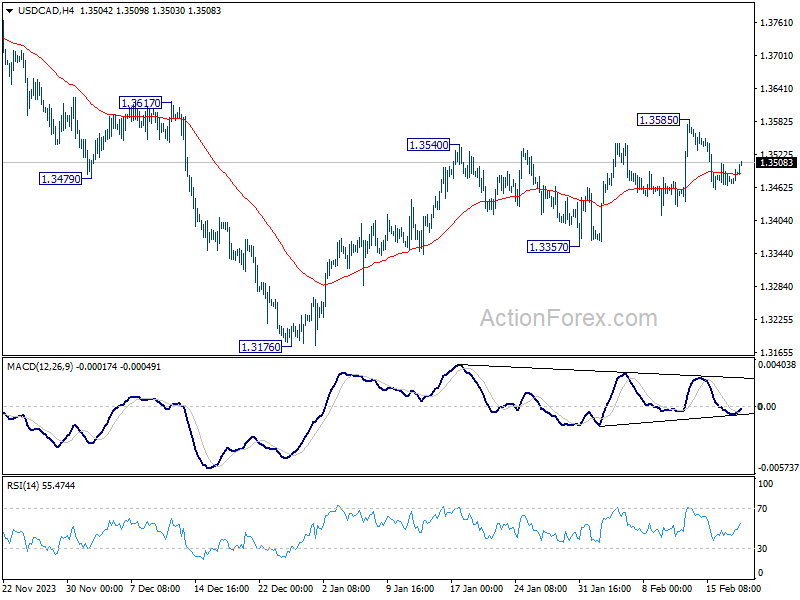
In the bigger picture, price actions from 1.3976 (2022 high) are viewed as a corrective pattern only. In case of another fall, strong support should emerge above 1.2947 resistance turned support to bring rebound. Overall, larger up trend from 1.2005 (2021 low) is still expected to resume through 1.3976 at a later stage.
China’s Rate Cut Meets Indifferent Markets, Canada CPI Takes Center Stage
The financial markets are rather calm in Asian session today, while major currency pairs and crosses largely engage in a phase of consolidation. This tranquility comes in the wake of China's surprising decision to significantly lower its mortgage reference interest rate, a move designed to provide a much-needed boost to the struggling property sector and, by extension, the broader economy. Despite the potential implications of such a policy shift, reaction across the markets was relatively muted, with only the offshore Yuan registering slight gains.
Australian Dollar, in particular, remained indifferent to the news surrounding China's development. Aussie is also similarly unresponsive to RBA's hawkish minutes. Commodity currencies and Yen are currently leaning towards the softer side. On the other hand, Dollar shows signs of strengthening, trailed by Swiss Franc and Sterling, with Euro displaying mixed performance.
The focal point of the day shifts towards Canada, where January CPI data is eagerly awaited. This upcoming report is expected to reveal modest reduction in headline inflation to 3.3%, primarily driven by decreasing gasoline prices and softening in food price inflation. Despite this anticipated dip, core inflation figures—encompassing CPI median, trimmed, and common—are projected to remain elevated, hovering between 3.6% and 3.8%.
These figures suggest that BoC is unlikely to hasten towards an interest rate reduction. The central bank is likely to seek more pronounced and sustained decline in core inflation rates towards a sub-3% level before considering any easing of monetary policy. This scenario seems improbable to realize within the first quarter of the year.
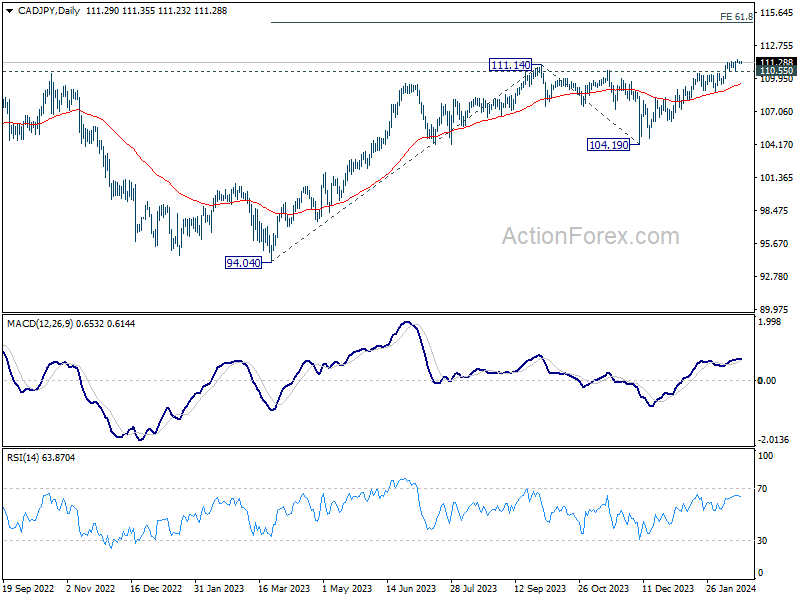
On the technical analysis front, CAD/JPY's up trend is still in progress despite sluggish upside momentum. Further rally is expected as long as 110.55 support holds. Next target is 61.8% projection of 94.04 to 111.14 from 104.19 at 114.75. Break of 110.55 will bring retreat back to 55 D EMA (now at 109.49), before staging another rally.
In Asia, at the time of writing, Nikkei is down -0.25%. Hong Kong HSI is down -0.27%. China Shanghai SSE is up 0.02%. Singapore Strait Times is up 0.07%. Japan 10-year JGB yield is down -0.002 at 0.728.
RBA minutes: High costs of persistent inflation may necessitate additional rate hike
RBA minutes from the February 5-6 meeting revealed that the Board considered both an 25bps rate hike and maintaining the current rate. The choice to hold rates was influenced by a perceived reduction in the risk that inflation would fail to revert to the target range "within a reasonable timeframe." However, the potential repercussions of inflation not normalizing as anticipated were deemed "potentially very high," leaving the door open for future rate increases.
Central to the decision was the observation that moderation in inflation over preceding months had been "slightly larger than previously expected". Global experiences had also provided "additional confidence" on the disinflation trend. Additionally, incoming data suggested "weaker than previously expected" labor market conditions and consumer spending.
The assessment of risks surrounding the economic outlook as "broadly balanced". RBA emphasized the importance of remaining vigilant, opting to monitor evolving risks closely before making further policy adjustments. The acknowledgment of the high "costs" associated with inflation remaining above target for too long underscores the cautious stance, with members unanimously agreeing on the necessity to "not to rule out a further increase" in the cash rate target.
China announces historic reduction in benchmark mortgage rates, Yuan higher
In an effort to revitalize its beleaguered property sector and inject vitality into the broader national economy, China has taken larger than expected action by reducing a crucial reference rate for mortgage loans.
PBoC announced a significant cut in five-year loan prime rate to 3.95% from 4.20%. This move surpassed market expectations of a more modest reduction of 5 to 15 basis points. Notably, this adjustment also represents the largest cut in the five-year LPR since its inception in 2019 .
Conversely, one-year LPR, which serves as a barometer for market lending rates, was left unchanged at 3.45%. T
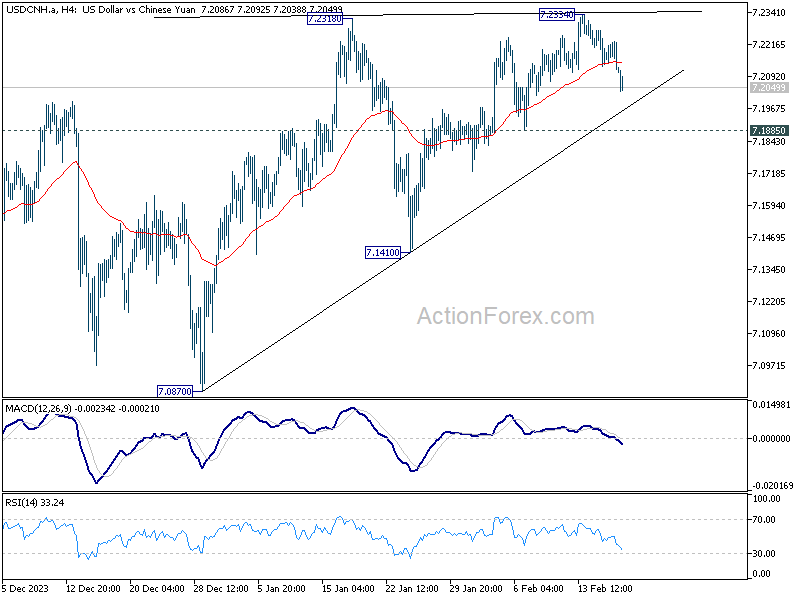
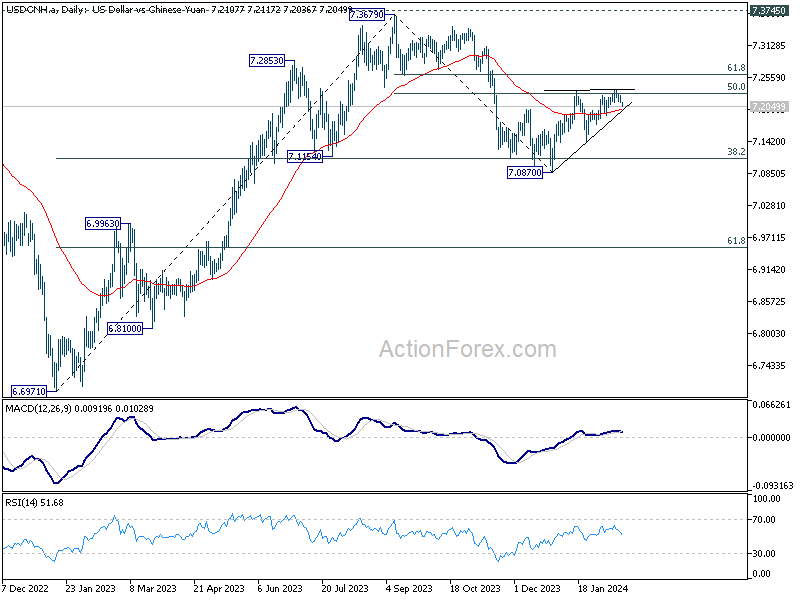
In the aftermath of this announcement, the offshore Chinese Yuan sees modest appreciation. Technically, focus will now on whether USD/CNH's current fall would push it through 7.1885 support. If realized, that would bolster the case that corrective recovery from 7.0870 has completed with three waves up to 7.2334. That would set the stage for further decline back to retest 7.0870 low in the near term.
Looking ahead
Swiss trade balance and Eurozone current account will be released in European session. BoE's monetary policy report hearings would be a major focus. Later in the data, Canada's CPI data will take the spotlight.
USD/CAD Daily Outlook
Daily Pivots: (S1) 1.3473; (P) 1.3485; (R1) 1.3503; More...
USD/CAD is still bounded in range below 1.3585 and intraday bias remains neutral. More consolidations could be seen, but further rally is expected as long as 1.3357 support holds. On the upside, firm break of 1.3585 will resume the rebound from 1.3176 for 1.3897 resistance.
In the bigger picture, price actions from 1.3976 (2022 high) are viewed as a corrective pattern only. In case of another fall, strong support should emerge above 1.2947 resistance turned support to bring rebound. Overall, larger up trend from 1.2005 (2021 low) is still expected to resume through 1.3976 at a later stage.
Economic Indicators Update
| GMT | Ccy | Events | Actual | Forecast | Previous | Revised |
|---|---|---|---|---|---|---|
| 00:30 | AUD | RBA Meeting Minutes | ||||
| 01:15 | CNY | PBoC 1Y Loan Prime Rate | 3.45% | 3.45% | 3.45% | |
| 01:15 | CNY | PBoC 5Y Loan Prime Rate | 3.95% | 4.10% | 4.20% | |
| 07:00 | CHF | Trade Balance (CHF) Jan | 2.35B | 1.25B | ||
| 09:00 | EUR | Eurozone Current Account (EUR) Dec | 20.3B | 24.6B | ||
| 13:30 | CAD | CPI M/M Jan | 0.40% | -0.30% | ||
| 13:30 | CAD | CPI Y/Y Jan | 3.30% | 3.40% | ||
| 13:30 | CAD | CPI Median Y/Y Jan | 3.60% | 3.60% | ||
| 13:30 | CAD | CPI Trimmed Y/Y Jan | 3.60% | 3.70% | ||
| 13:30 | CAD | CPI Common Y/Y Jan | 3.80% | 3.90% |
Technical Outlook and Review
DXY:
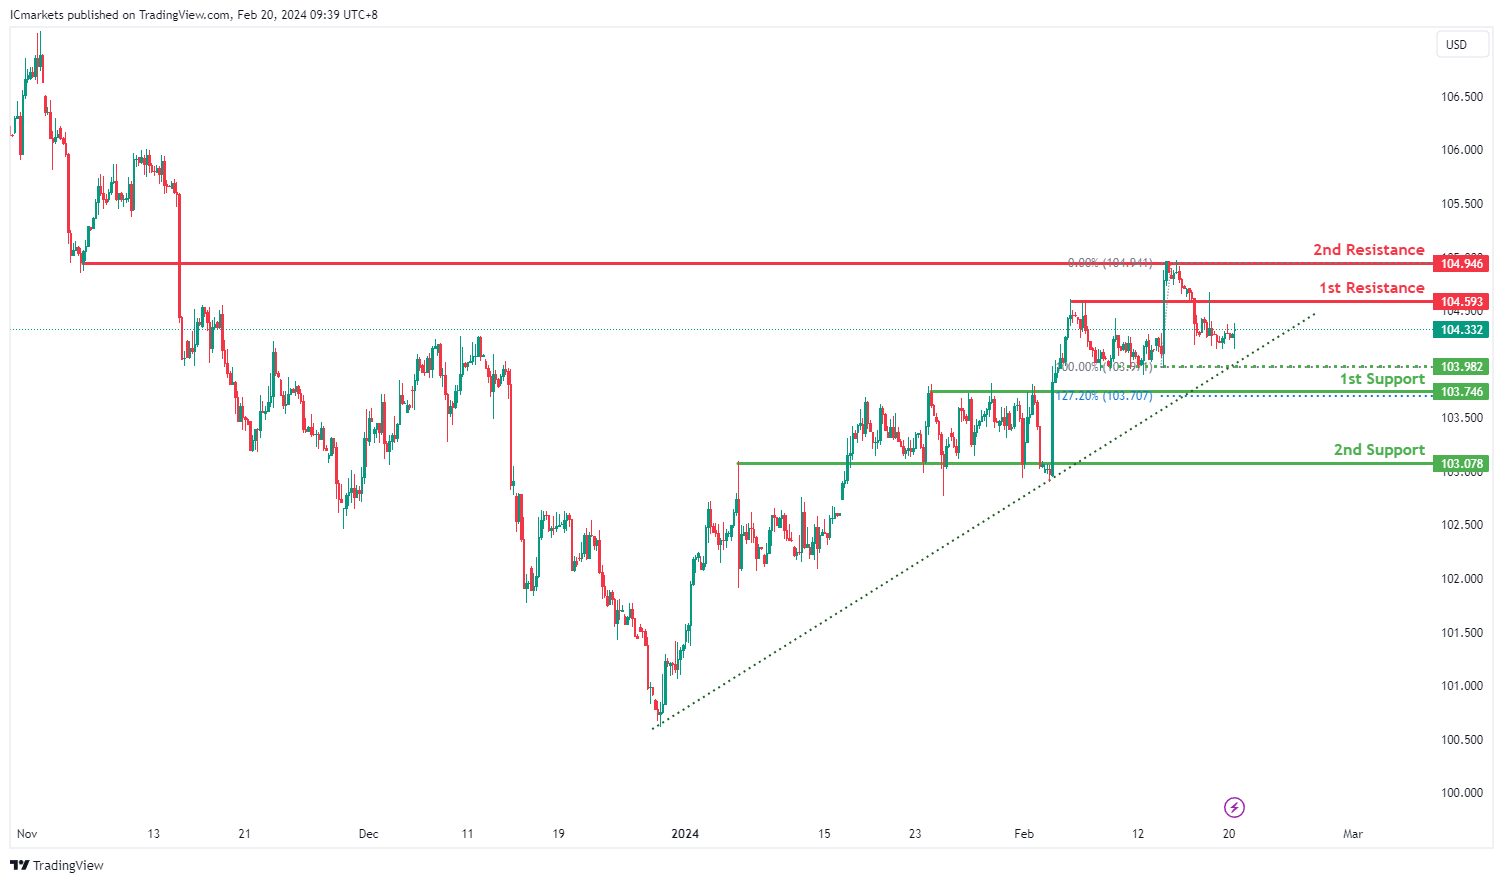
For DXY, the current momentum on the chart is assessed as bullish, with several factors contributing to this outlook. One notable factor is that the price is currently positioned above a major ascending trend line, indicating potential for further bullish momentum.
Looking ahead, the price could potentially experience a bullish bounce off the 1st support level, which is identified at 103.74. This level is considered a pullback support, suggesting that buyers might step in to defend this area, especially given the overall bullish sentiment.
Additionally, the 2nd support level is noted at 103.07, characterized as an overlap support. This further reinforces the potential for support in the event of a pullback, adding to the bullish case.
On the resistance side, the 1st resistance level is identified at 104.59, categorized as an overlap resistance. This level may act as a barrier where selling pressure could increase, potentially leading to a pause or reversal in the bullish trend.
Furthermore, the 2nd resistance level stands at 104.94, also considered an overlap resistance. This level provides additional resistance overhead and could serve as a target for bullish moves if the price continues its upward trajectory.
EUR/USD:
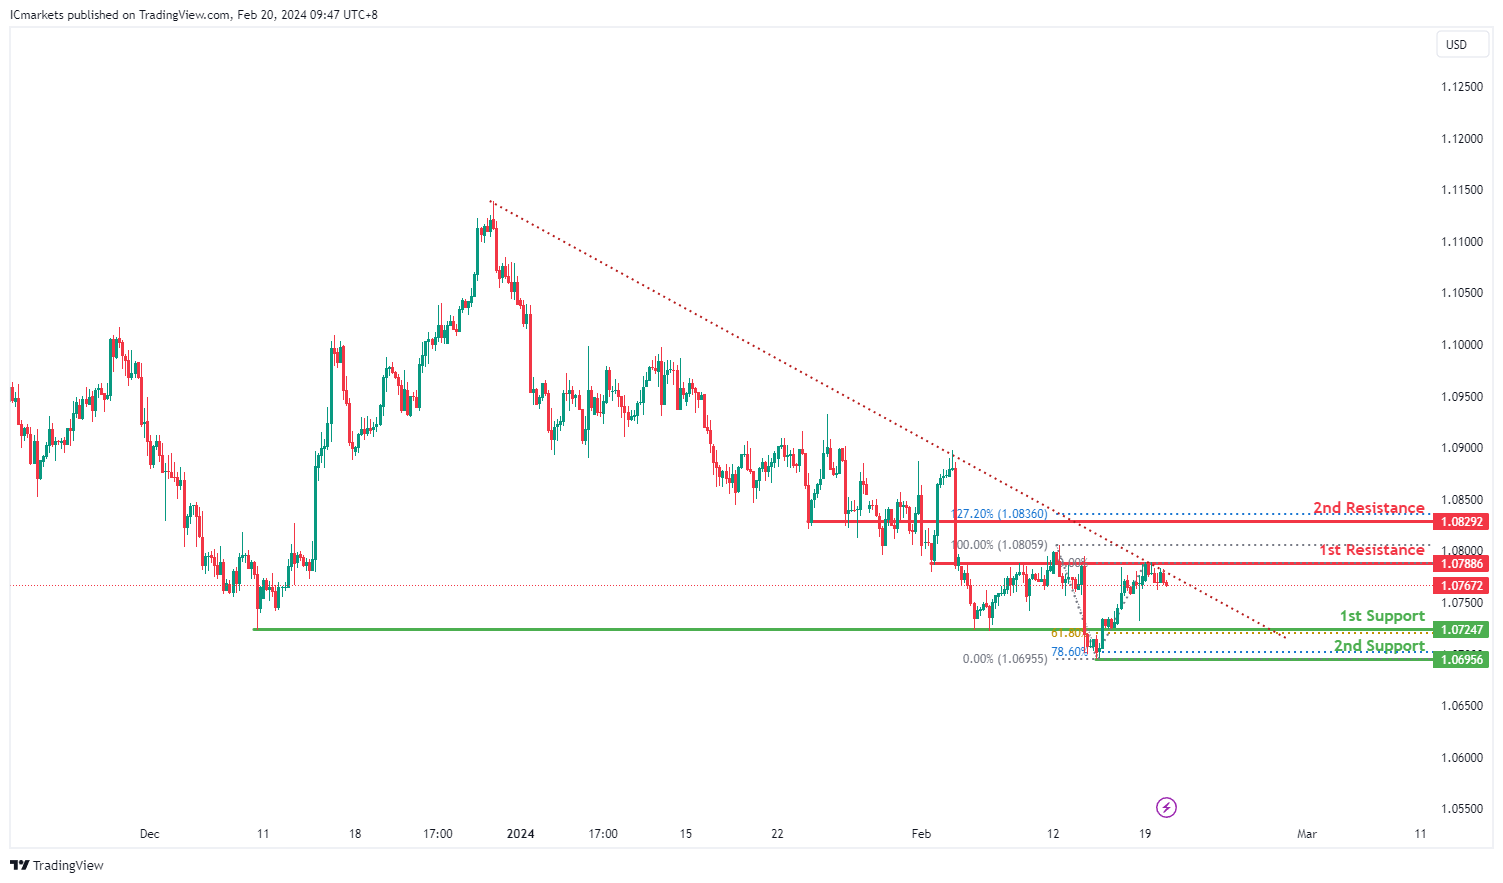
For EUR/USD, the current momentum on the chart is characterized as bearish, with several factors contributing to this outlook. One significant factor is that the price is currently within a bearish descending channel, indicating a downtrend.
Considering the potential price action, there’s a likelihood for a bearish continuation towards the 1st support level, which is identified at 1.0724. This level is deemed significant as it represents an overlap support and coincides with the 61.80% Fibonacci retracement level, adding to its significance as a potential area of support where buyers might step in.
Furthermore, the 2nd support level is situated at 1.0695, which is marked as a swing low support and corresponds to the 78.60% Fibonacci retracement level. This reinforces the potential for support at this level and adds to the bearish case for a continuation towards lower levels.
On the resistance side, the 1st resistance level is identified at 1.0788, characterized as an overlap resistance. This level may act as a barrier where selling pressure could increase, potentially causing the price to reverse or consolidate.
Additionally, the 2nd resistance level stands at 1.0829, categorized as an overlap resistance and coinciding with the 127.20% Fibonacci extension level. This level provides additional resistance overhead and could serve as a target for bearish moves if the price attempts a bounce but fails to breach higher resistance levels.
EUR/JPY:
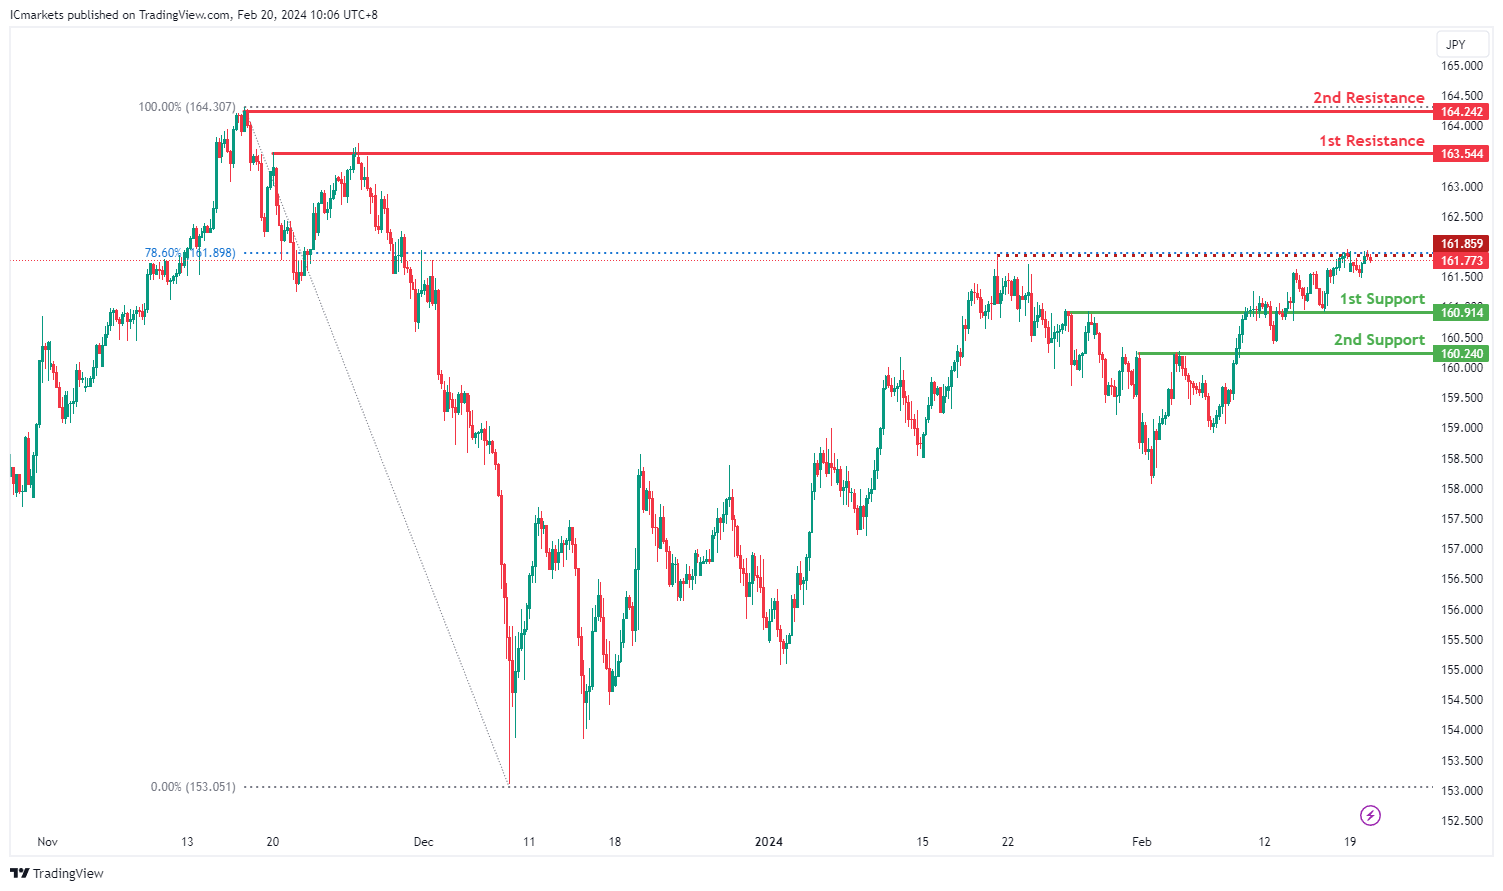
The EUR/JPY chart currently exhibits a bearish overall momentum, driven by several factors contributing to the downward trend. However, there is a potential short-term rise towards the 1st resistance level before a reversal back towards the 1st support level.
The 1st support level at 160.914 is significant as it aligns with an overlap support, indicating a historical level where buying interest has emerged in the past. This level suggests a strong potential support zone where the price may find temporary stability.
Additionally, the 2nd support level at 160.220 corresponds to a pullback support, reinforcing its importance as a potential level where buyers could step in to support the price.
On the resistance side, the 1st resistance level at 163.544 is identified as a multi-swing high resistance, indicating a historical point where selling pressure has been significant. This level may act as a barrier to further upward movement in the short term.
Further up, the 2nd resistance level at 164.242 aligns with a swing high resistance, adding to its significance as a potential point where selling interest may intensify.
An intermediate resistance level at 161.86 is also identified, which aligns with a pullback resistance and the 78.60% Fibonacci Retracement, providing additional reinforcement to the resistance structure.
EUR/GBP:
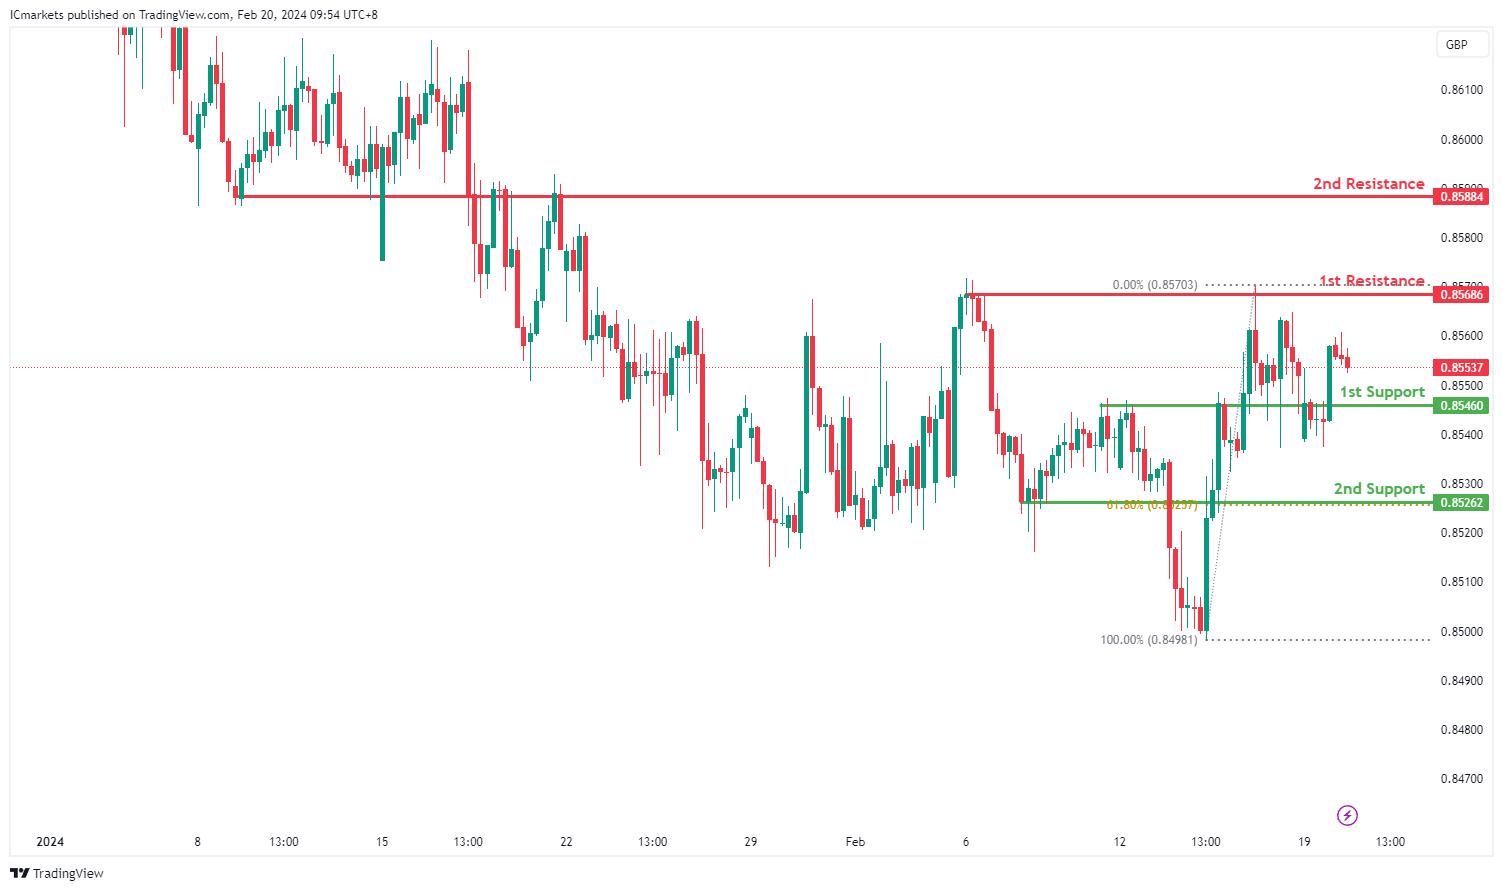
The EUR/GBP chart currently reflects a bearish momentum, suggesting a continued downward trend. Several factors contribute to this sentiment, indicating the potential for further decline towards the 1st support level.
The 1st support level at 0.85460 is significant as it aligns with an overlap support, indicating a historical level where buying interest has emerged in the past. This level serves as a strong potential support zone where the price could find stability or experience a bounce.
Moreover, the 2nd support level at 0.85262 corresponds to both a pullback support and the 61.80% Fibonacci Retracement, further reinforcing its significance as a potential support area. This confluence of support factors suggests increased buying interest at this level.
On the resistance side, the 1st resistance level at 0.85686 is identified as a pullback resistance, suggesting a historical point where selling pressure may intensify. This level may act as a barrier to upward movement, potentially leading to further downside momentum.
Further up, the 2nd resistance level at 0.85884 aligns with an overlap resistance, adding to its significance as a potential point where selling interest could strengthen.
GBP/USD:
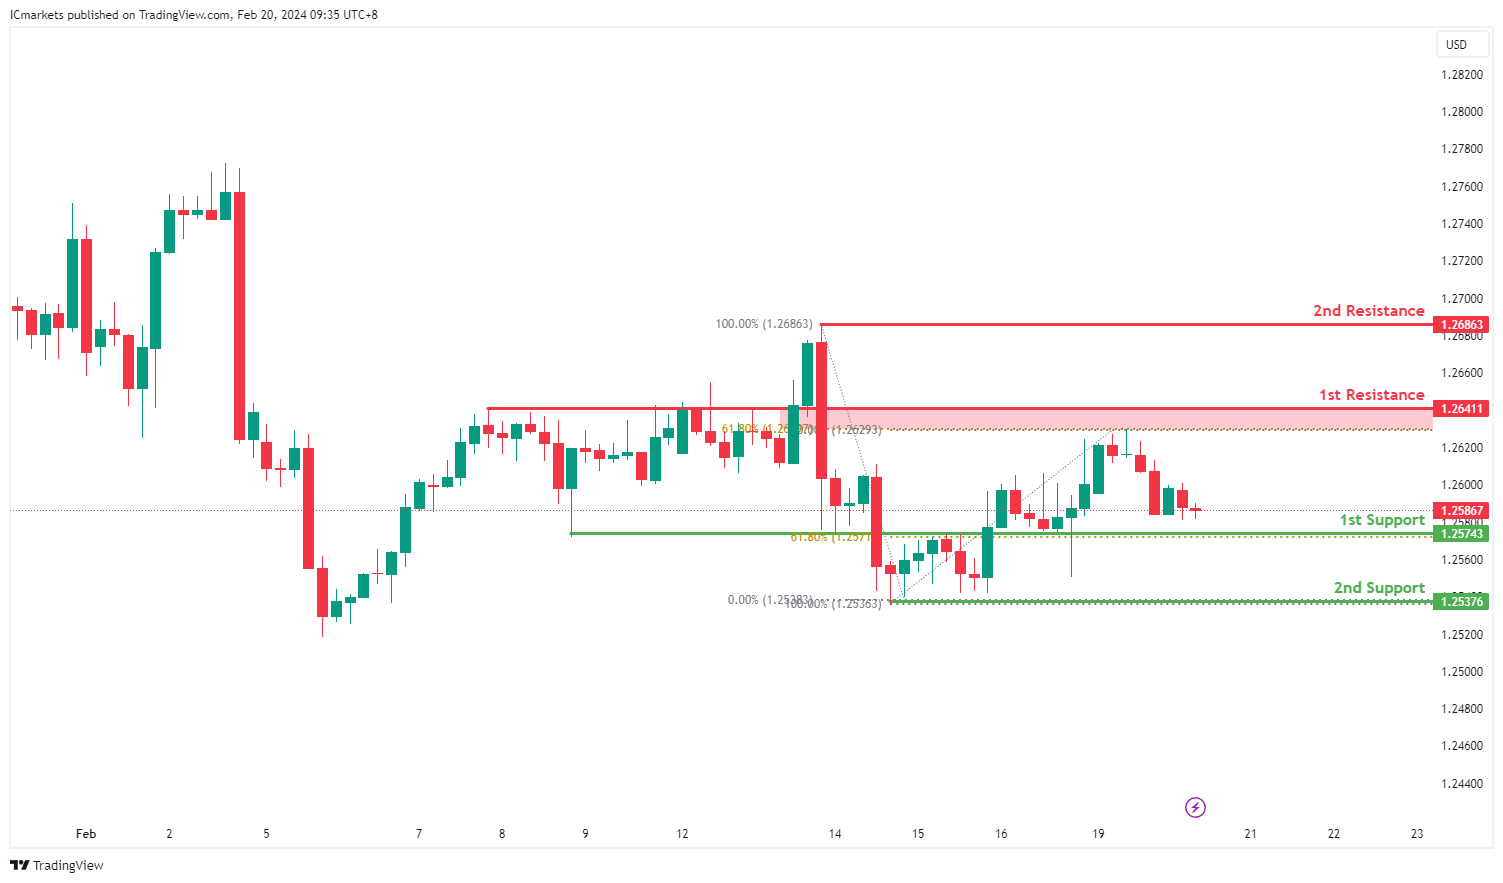
For GBP/USD, the current momentum on the chart is described as bullish. Here are the identified levels and reasons supporting potential price movements:
The 1st support at 1.2574 is considered an overlap support, indicating a historical area where buyers have previously entered the market. Additionally, it coincides with the 61.80% Fibonacci retracement level, adding confluence and significance to the support level.
The 2nd support at 1.2537 is identified as a multi-swing low support, suggesting that it has been a level where buyers have stepped in multiple times in the past. It provides further reinforcement for potential support.
On the resistance side, the 1st resistance at 1.2641 is characterized as an overlap resistance, indicating a historical area where selling pressure has been prevalent. This level also coincides with the 61.80% Fibonacci retracement level, adding to its significance as a potential barrier to further upside movement.
Finally, the 2nd resistance at 1.2686 is marked as a swing high resistance, suggesting that it has acted as a significant barrier to upward price movements. It adds further resistance overhead, potentially capping bullish advances.
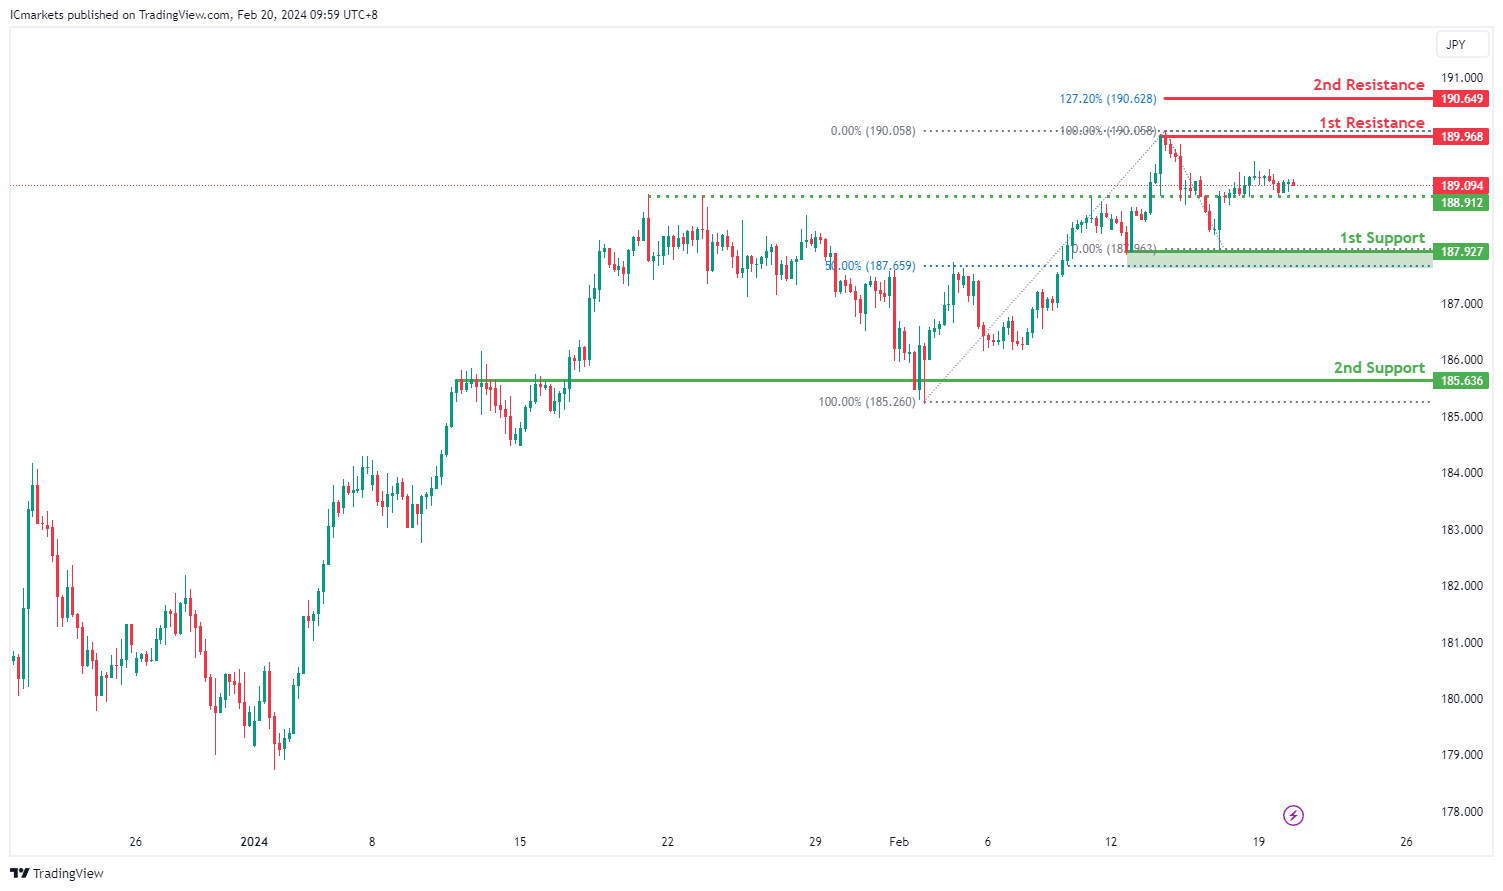
GBP/JPY:
The GBP/JPY chart currently indicates a neutral momentum, suggesting a lack of clear directional bias. There are several key levels identified that may influence potential price movements, indicating the possibility of fluctuation between the 1st resistance and 1st support levels.
The 1st support level at 187.927 is significant as it aligns with both an overlap support and the 50% Fibonacci Retracement. This convergence suggests a strong historical level where buying interest has emerged in the past, potentially providing support to the price if tested.
Additionally, the 2nd support level at 185.636 corresponds to another overlap support, further reinforcing its importance as a potential support zone. This level indicates a significant historical area where buyers have previously intervened to support the price.
On the resistance side, the 1st resistance level at 189.968 is identified as a swing high resistance, suggesting a historical point where selling pressure may increase. This level could act as a barrier to further upward movement, potentially leading to a reversal or consolidation.
An intermediate support level at 190.649 is also identified, aligning with the 127.20% Fibonacci Retracement. This level could provide additional support to the price if tested, potentially influencing price action in the short term.
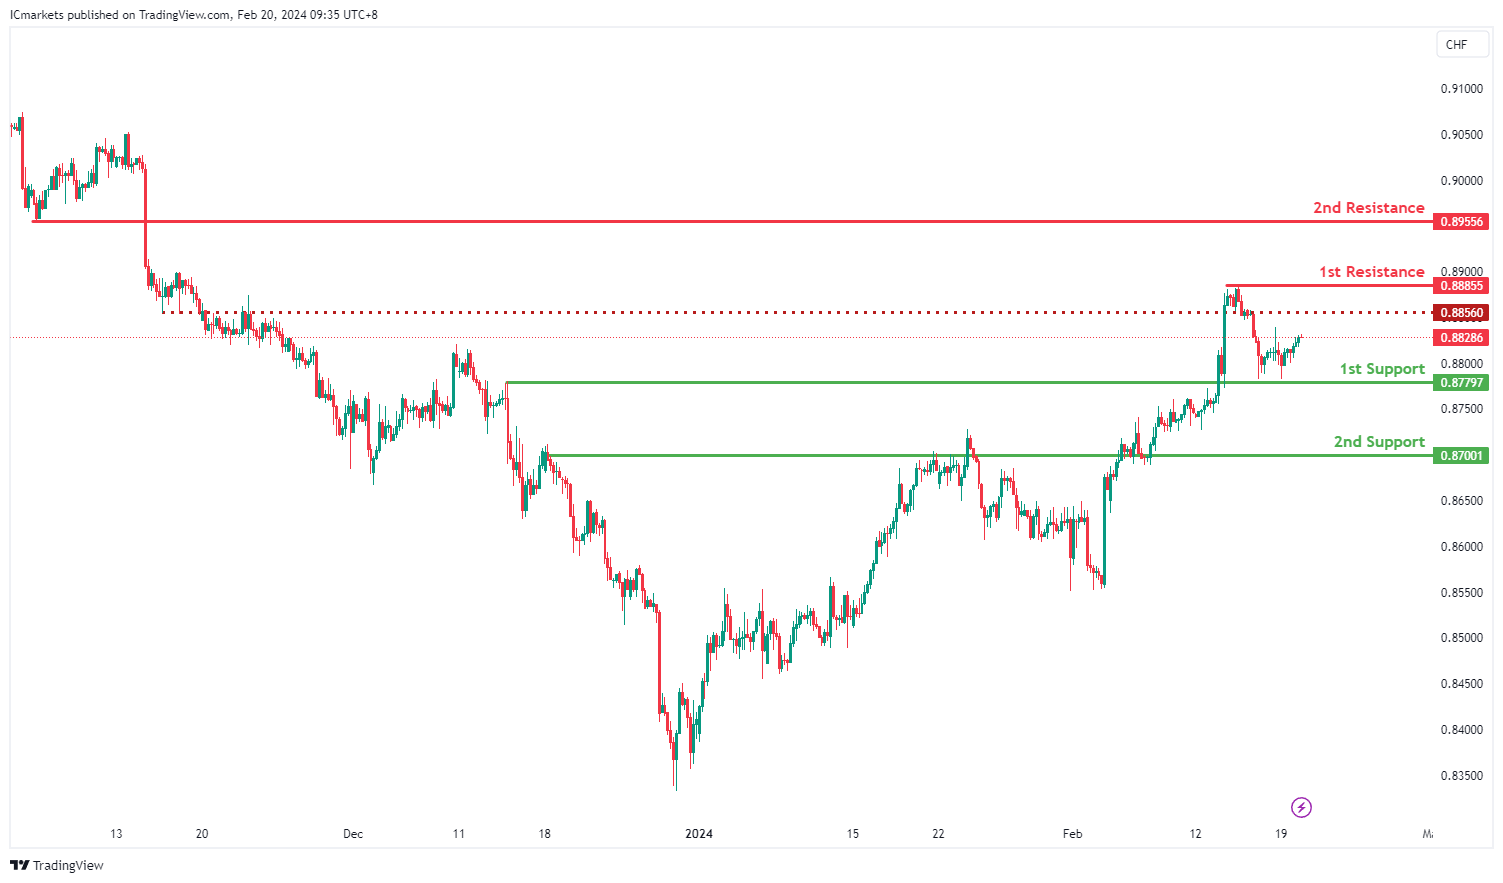
USD/CHF:
For USD/CHF, the current momentum on the chart is described as bullish. Here are the identified levels and reasons supporting potential price movements:
The 1st support at 0.8779 is considered an overlap support, indicating a historical area where buyers have previously entered the market. This level provides initial reinforcement for potential downside movements.
The 2nd support at 0.8700 is also identified as an overlap support, further strengthening its significance as a level where buyers have historically been active. It provides additional support in case of a deeper retracement.
On the resistance side, the 1st resistance at 0.8885 is characterized as a multi-swing high resistance, suggesting that it has acted as a significant barrier to upward price movements. Traders often pay close attention to such levels as they represent areas where selling pressure has been strong in the past.
The 2nd resistance at 0.8955 is marked as a pullback resistance, indicating that it may pose a challenge to further upward movements after an initial bounce. This level adds further resistance overhead, potentially limiting bullish advances.
Additionally, an intermediate resistance at 0.8856 is identified as a pullback resistance, providing an additional hurdle for bullish continuation.
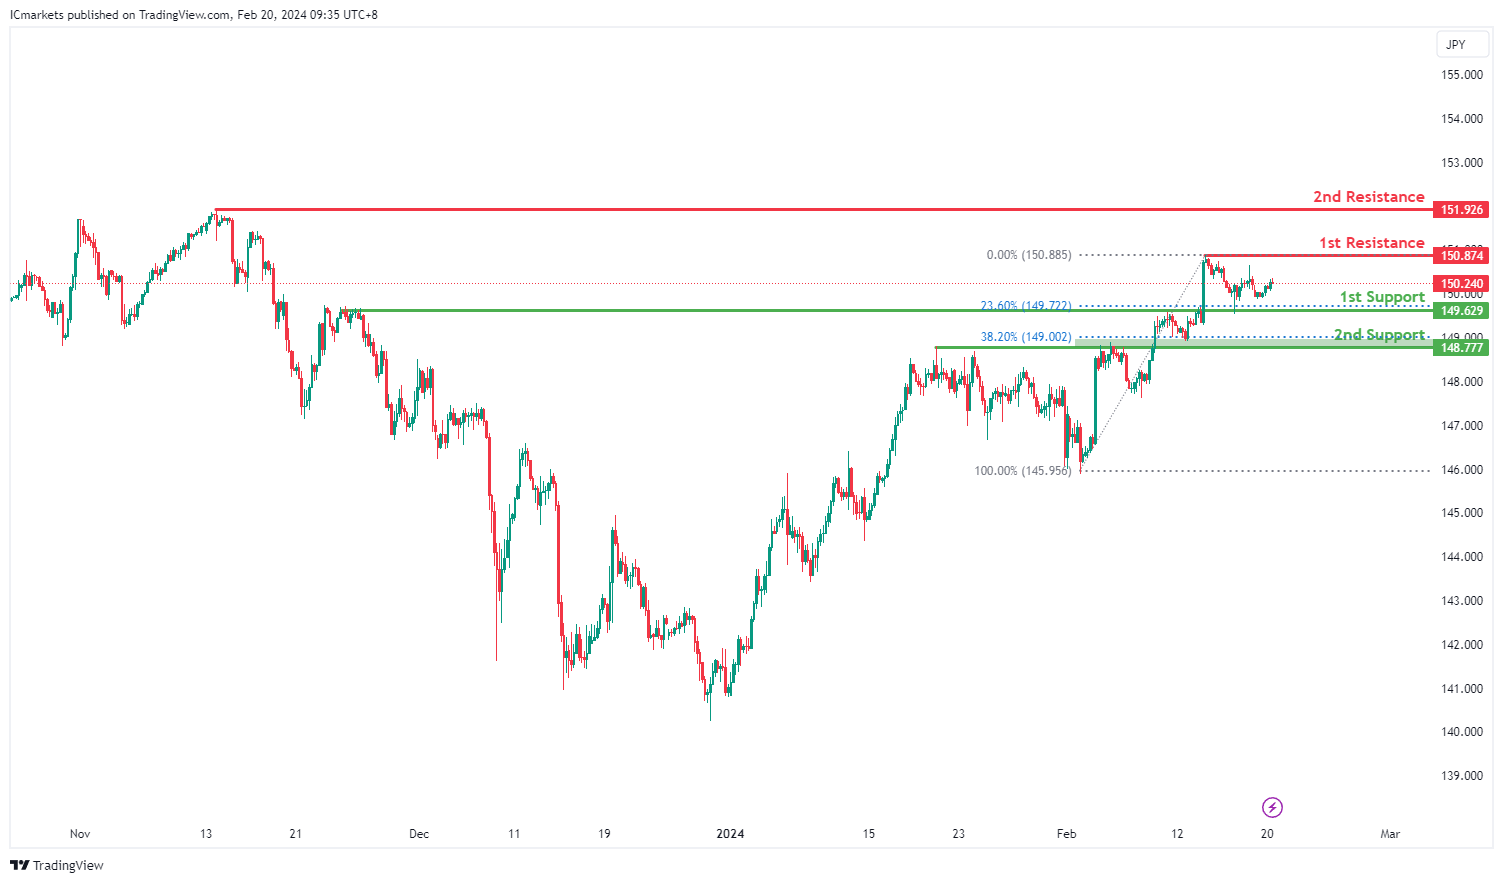
USD/JPY:
For USD/JPY, the current momentum on the chart is described as bullish. Here are the identified levels and reasons supporting potential price movements:
The 1st support at 149.62 is identified as an overlap support, indicating a historical level where buyers have previously entered the market. This level is reinforced by the presence of the 23.60% Fibonacci Retracement, adding significance to the support zone.
The 2nd support at 148.77 is also characterized as an overlap support, further strengthening its importance as a level where buying interest has historically been observed. The presence of the 38.20% Fibonacci Retracement adds additional confluence to this support level.
On the resistance side, the 1st resistance at 150.87 is identified as a swing high resistance. This level suggests that it has acted as a significant barrier to upward price movements in the past, indicating potential selling pressure near this level.
The 2nd resistance at 151.92 is also marked as a swing high resistance, further confirming its importance as a historical point where selling interest has been strong. Traders often pay attention to such levels as they may represent areas where selling pressure could intensify.
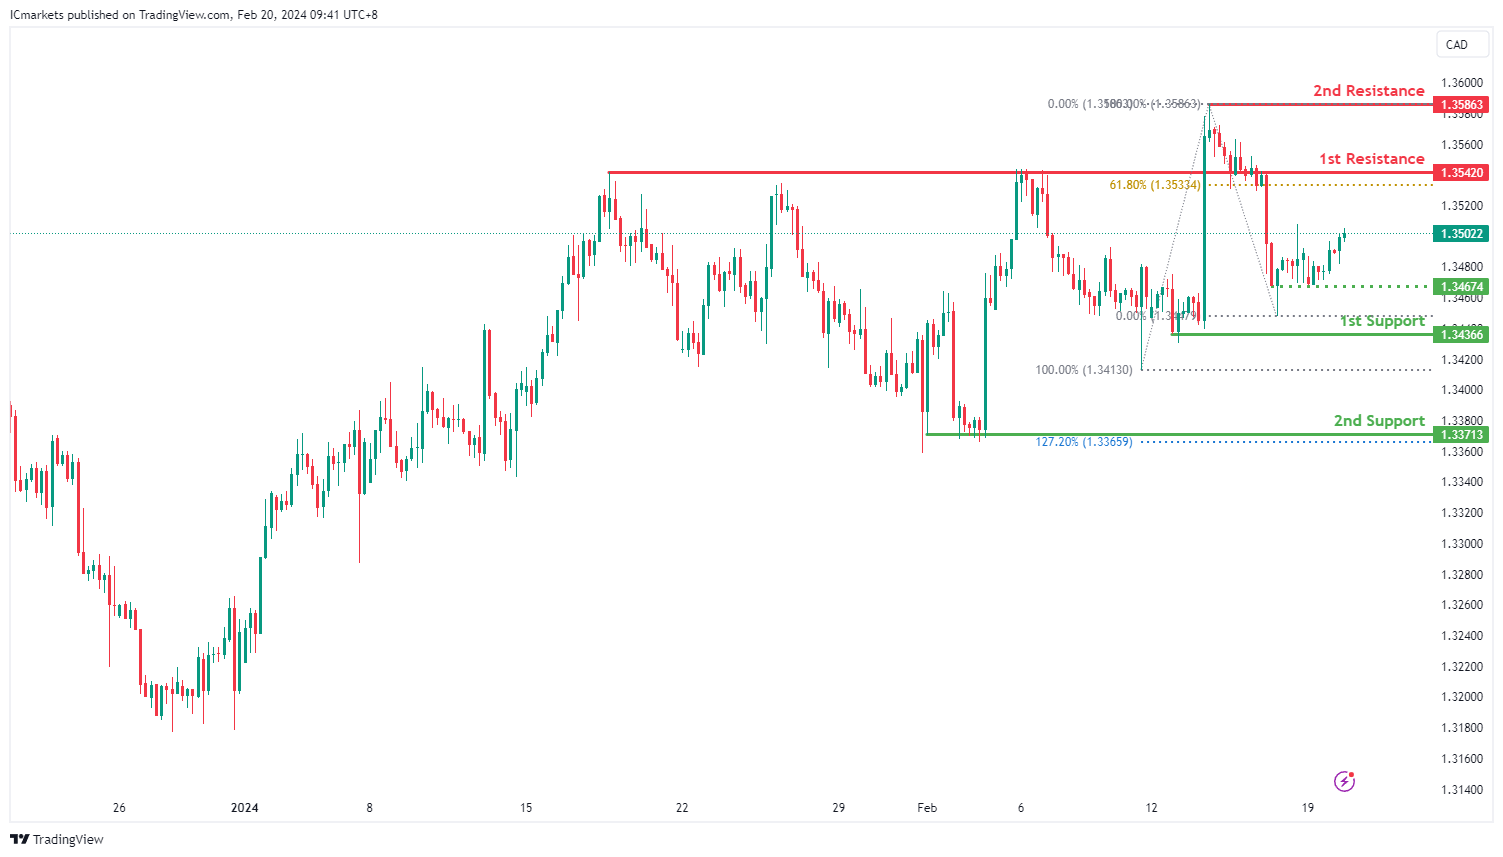
USD/CAD:
The USD/CAD chart currently exhibits an overall bullish momentum. In this context, there is a potential scenario for price to rise towards the 1st resistance.
The 1st resistance level at 1.3542 is identified as an overlap resistance that aligns close to the 61.80% Fibonacci Retracement level. Higher up, the 2nd resistance level at 1.3586 is noted as a swing-high resistance, further highlighting its importance as a potential resistance point.
To the downside, the intermediate support level at 1.3467 is identified as a pullback support while the 1st support level at 1.3436 is also marked as a pullback support. Further below, the 2nd support level at 1.3371 is also noted as a pullback support that aligns close to the 127.20% Fibonacci Extension level, further emphasizing its importance as a potential support zone.
AUD/USD:
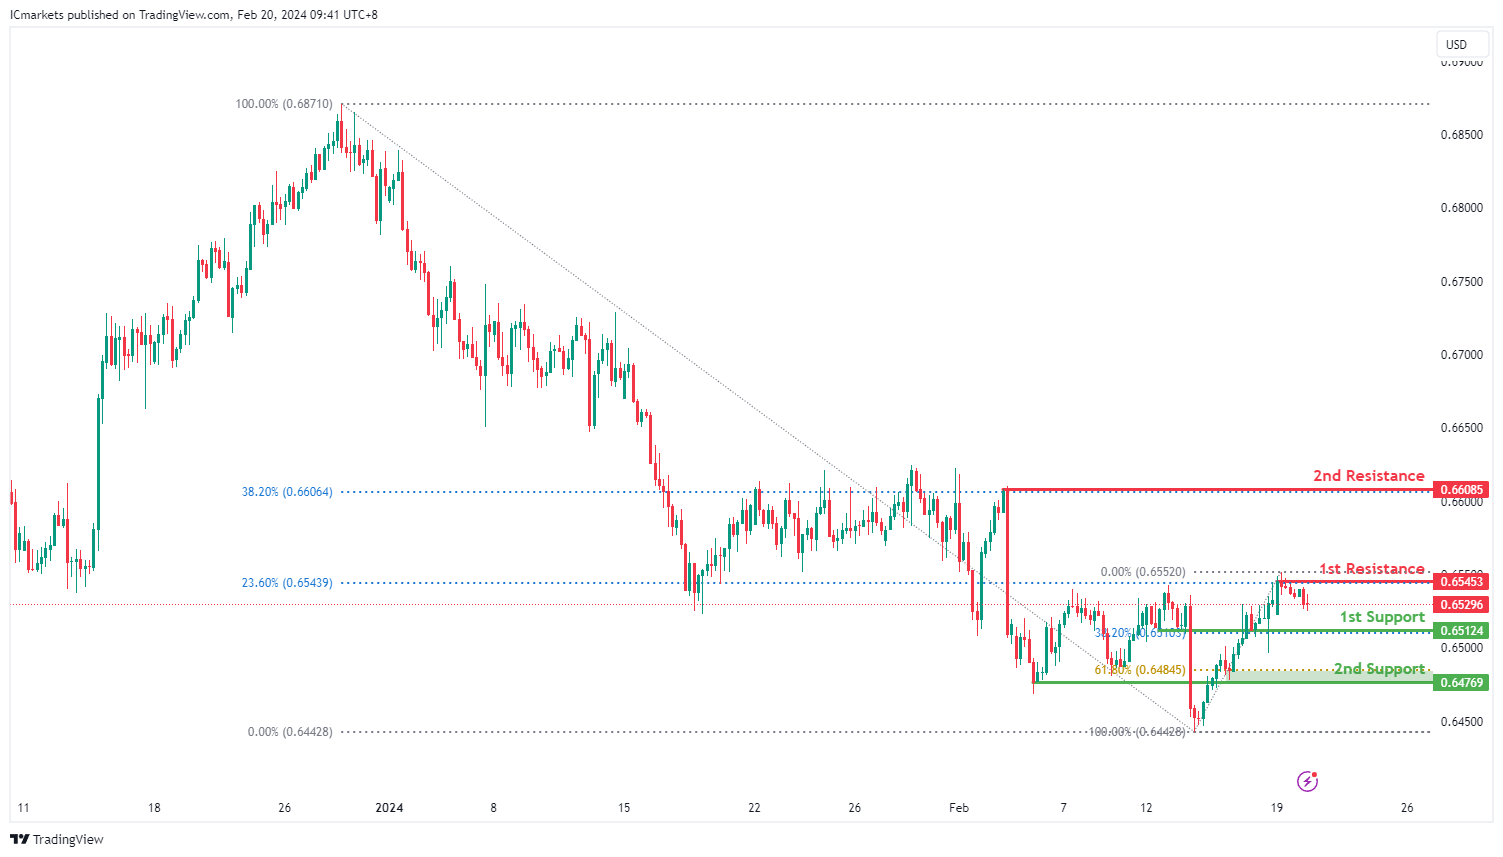
The AUD/USD chart currently exhibits a neutral bias. In this context, there is a potential scenario for price to fluctuate between the 1st resistance and the 1st support.
The 1st resistance level at 0.6545 is identified as a pullback resistance that aligns with the 23.60% Fibonacci Retracement level. Higher up, the 2nd resistance level at 0.6608 is also marked as a pullback resistance that aligns with the 38.20% Fibonacci Retracement level, further highlighting its importance as a potential resistance point.
To the downside, the 1st support level at 0.6512 is identified as pullback support that aligns with the 38.20% Fibonacci Retracement level. Further below, the 2nd support level at 0.6476 is also noted as a pullback resistance that aligns close to the 61.80% Fibonacci Retracement level, further emphasizing its importance as a potential support zone.
NZD/USD
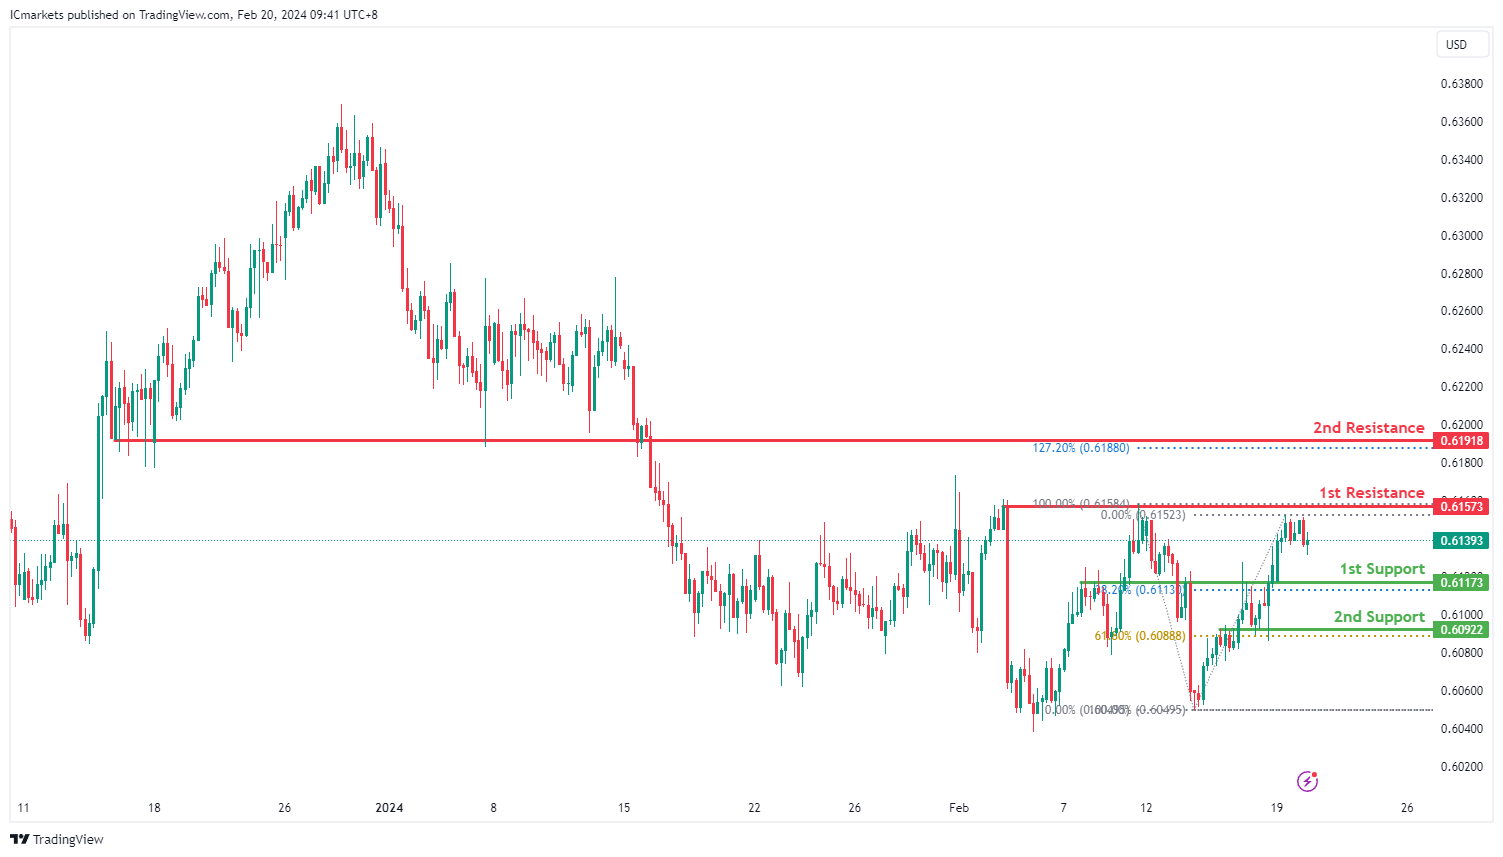
The NZD/USD chart currently exhibits a neutral bias. In this context, there is a potential scenario for price to fluctuate between the 1st resistance and the 1st support.
The 1st resistance level at 0.6157 is identified as a pullback resistance. Higher up, the 2nd resistance level at 0.6191 is also marked as a pullback resistance that aligns with the 127.20% Fibonacci Extension level, further highlighting its importance as a potential resistance point.
To the downside, the 1st support level at 0.6117 is identified as an overlap support that aligns with the 38.20% Fibonacci Retracement level. Further below, the 2nd support level at 0.6092 is also noted as an overlap support that aligns with the 61.80% Fibonacci Retracement level, further emphasizing its importance as a potential support zone.
DJ30:
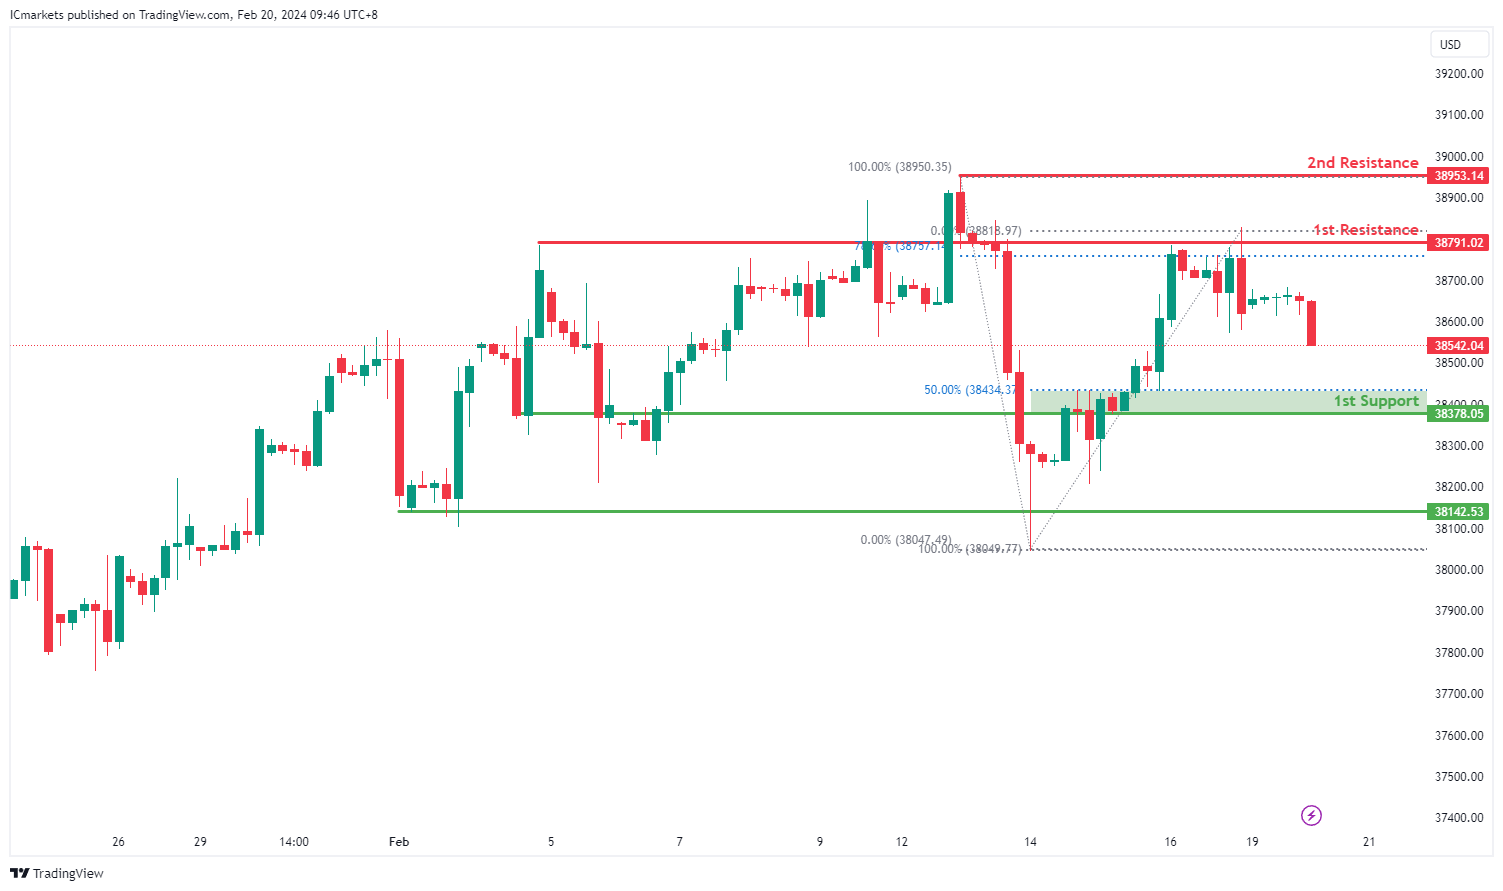
The DJ30 chart currently demonstrates a bearish momentum, indicating a prevailing downward trend. However, there are potential price movements identified that suggest a short-term rise towards the 1st resistance level before reversing downwards towards the 1st support.
The 1st support level at 38,378.05 is considered significant as it aligns with both a pullback support and the 50% Fibonacci Retracement. This convergence suggests a strong historical level where buying interest has emerged, potentially providing support to the price if tested.
Additionally, the 2nd support level at 38,142.53 corresponds to another pullback support, reinforcing its importance as a potential support zone. This level indicates a significant historical area where buyers have previously intervened to support the price.
On the resistance side, the 1st resistance level at 38,791.02 is identified as a pullback resistance, suggesting a historical point where selling pressure may increase. This level, combined with the 78.60% Fibonacci Retracement, could act as a barrier to further upward movement, potentially leading to a reversal in the short term.
Further up, the 2nd resistance level at 38,953.14 aligns with a swing high resistance, adding to its significance as a potential barrier to upward movement.
GER40:
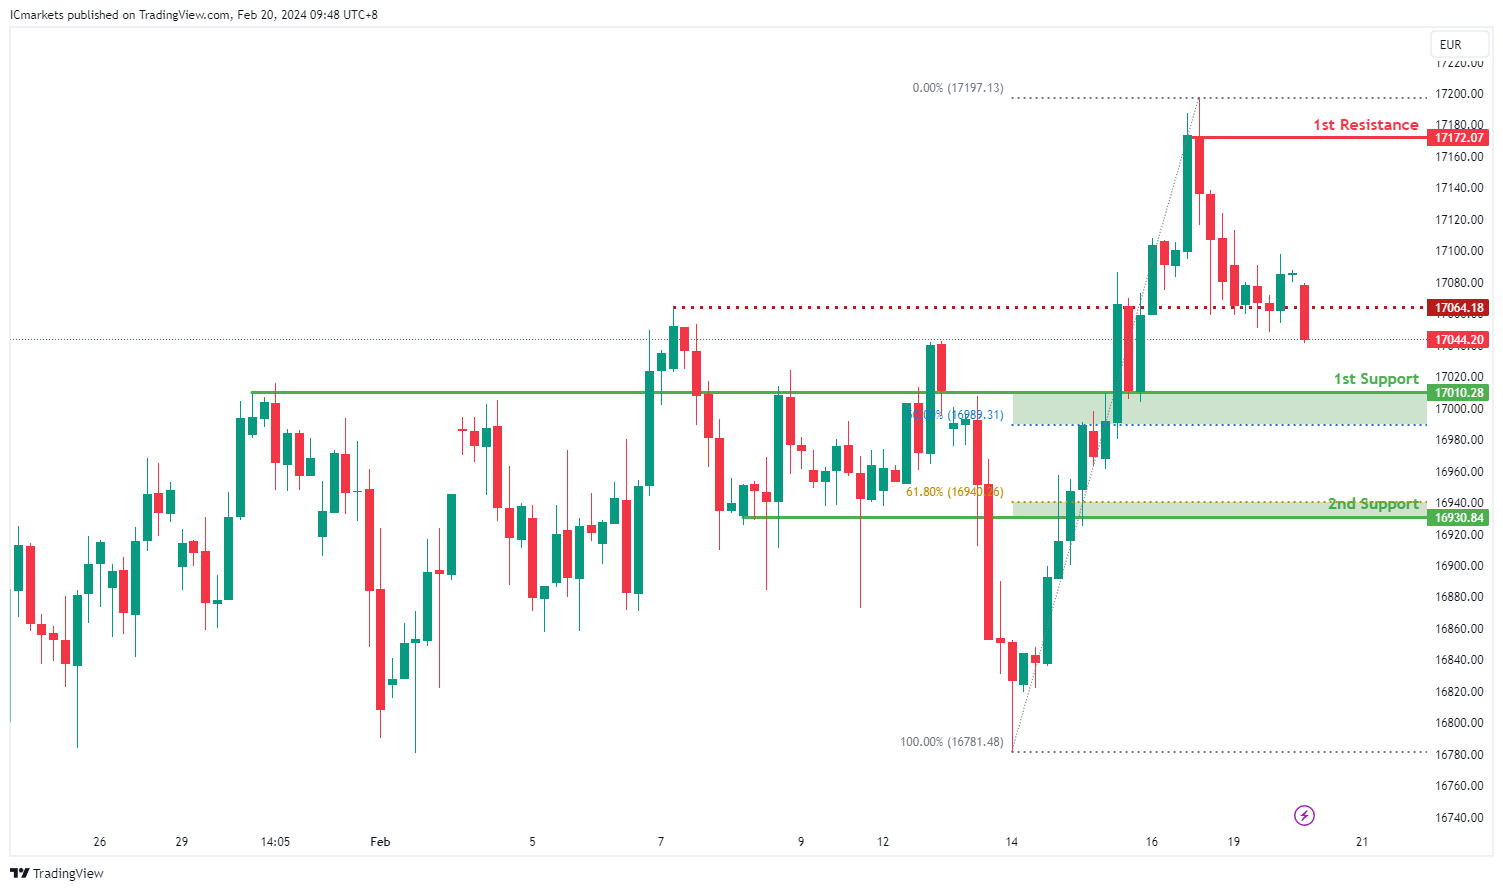
The GER40 chart currently exhibits a bearish momentum, indicating a prevailing downward trend. Several factors contribute to this bearish sentiment, supporting the potential for a continued downward movement in price.
The 1st support level at 17,010.3 is significant as it aligns with both an overlap support and the 50% Fibonacci Retracement. This convergence suggests a robust historical level where buying interest has emerged, potentially providing support to the price if tested.
Furthermore, the 2nd support level at 16,930.8 corresponds to a pullback support and the 61.80% Fibonacci Retracement, reinforcing its importance as a potential support zone. This level indicates a significant historical area where buyers have previously intervened to support the price.
On the resistance side, the 1st resistance level at 17,172.1 is identified as a swing high resistance, suggesting a historical point where selling pressure may increase. This level could act as a barrier to further upward movement, contributing to the bearish momentum.
Additionally, an intermediate resistance level at 17,064.2 aligns with a swing high resistance, further reinforcing its significance as a potential barrier to upward movement.
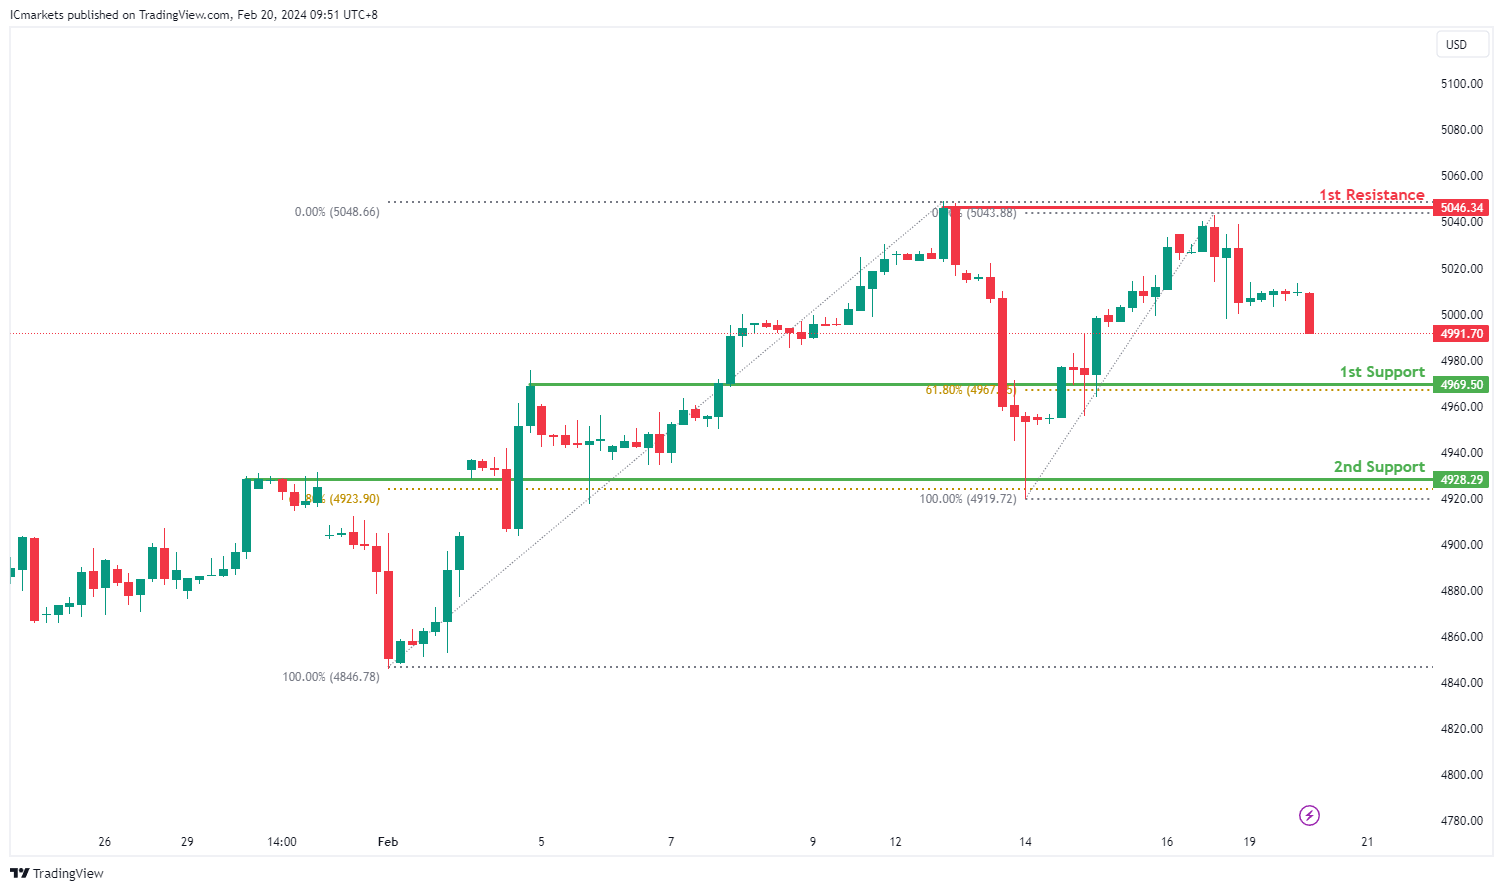
US500:
The US500 chart currently displays a bearish momentum, indicating a prevalent downward trend. Several factors contribute to this bearish sentiment, suggesting a potential continuation of the downward movement in price.
The 1st support level at 4969.50 is significant as it aligns with both a pullback support and the 61.80% Fibonacci Retracement level. This convergence indicates a strong historical level where buying interest has emerged, potentially providing a solid foundation for a bounce or a halt in further downward movement.
Furthermore, the 2nd support level at 4928.29 corresponds to an overlap support, reinforcing its significance as a potential support zone. This level suggests a notable historical area where buyers have previously intervened to support the price.
On the resistance side, the 1st resistance level at 5046.34 is identified as a swing high resistance, indicating a historical point where selling pressure may increase. This level could act as a barrier to further upward movement, aligning with the overall bearish sentiment.
BTC/USD:
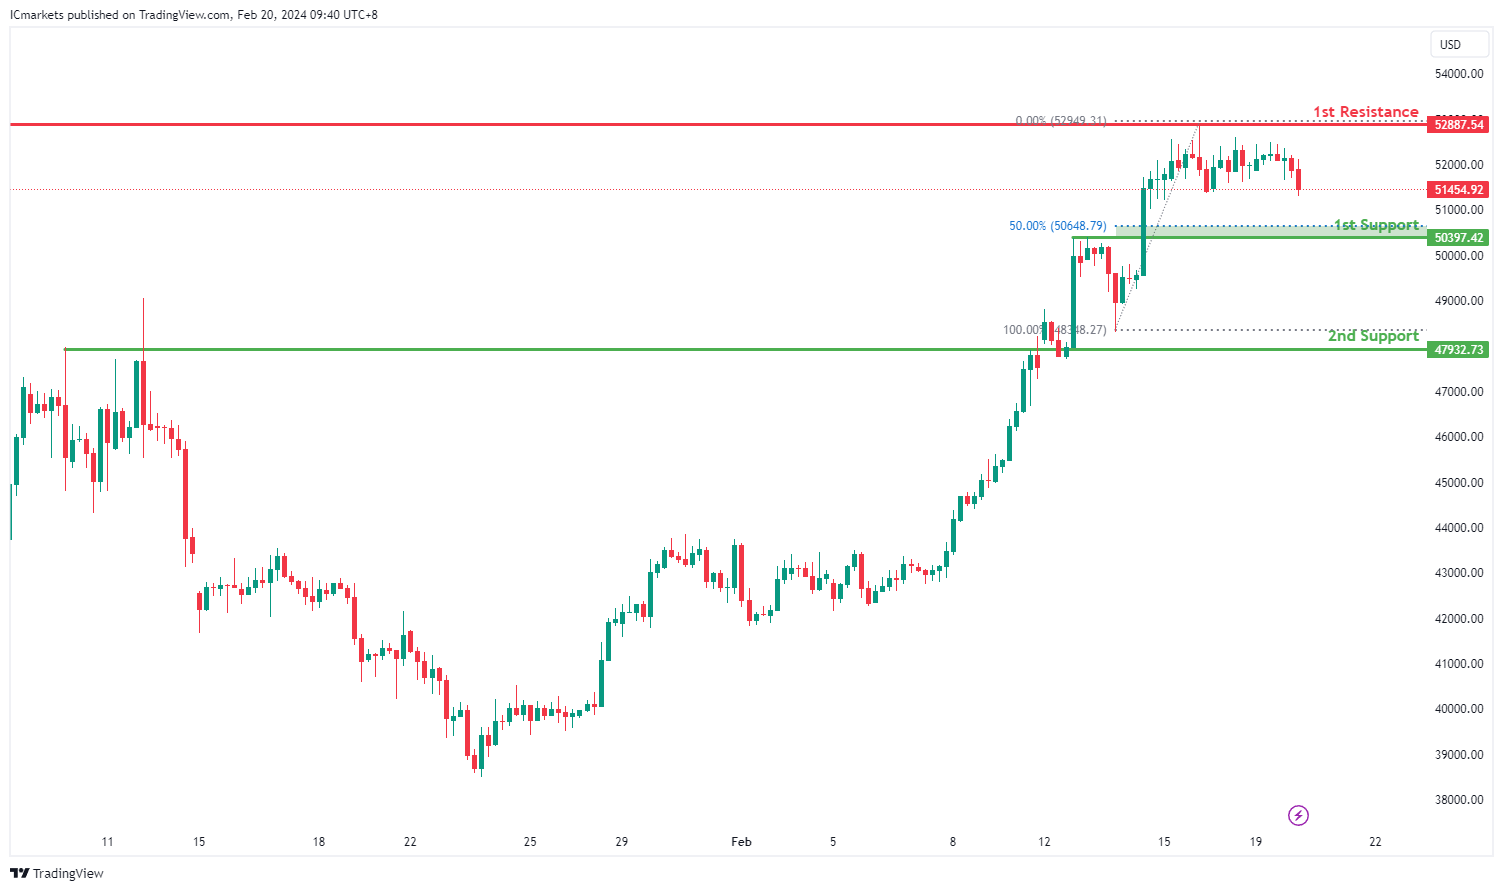
The BTC/USD chart currently demonstrates a neutral overall momentum, indicating a lack of clear directionality in the prevailing trend. Given this neutrality, the price may potentially oscillate within a range bounded by the 1st resistance and 1st support levels.
The 1st support level at 50397.42 is considered significant as it aligns with a pullback support and the 50% Fibonacci retracement level. This confluence suggests a strong historical area where buying interest has previously emerged, potentially acting as a support zone.
Additionally, the 2nd support level at 47932.73 corresponds to an overlap support, further reinforcing its importance as a potential area where buyers may intervene to support the price.
On the resistance side, the 1st resistance level at 52887.54 is identified as a swing high resistance. This level represents a historical point where selling pressure has been significant, potentially acting as a barrier to further upward movement.
ETH/USD:
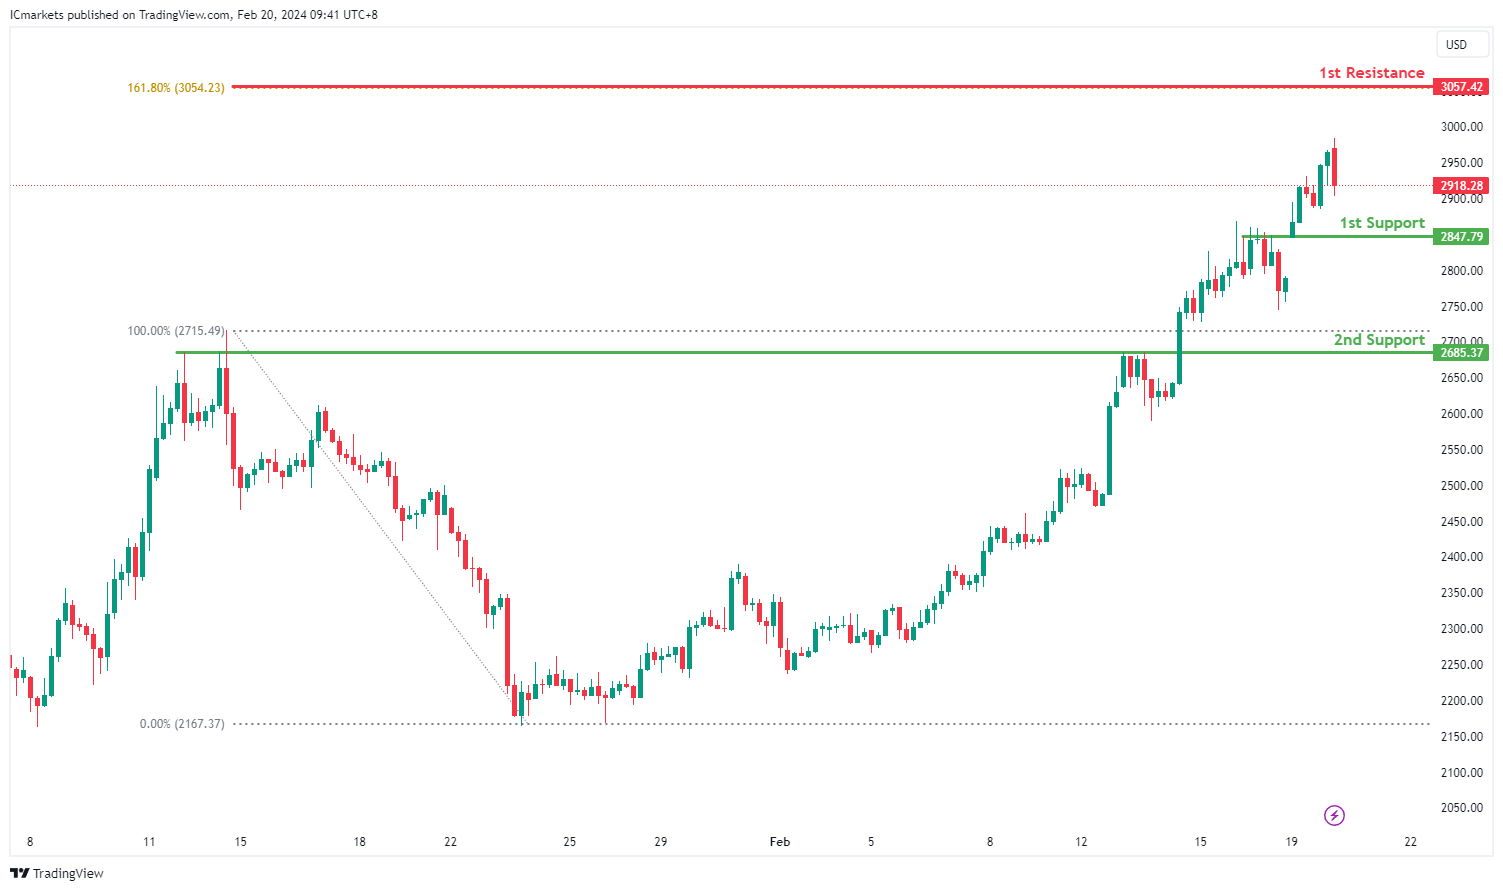
The ETH/USD chart currently exhibits a bullish overall momentum, suggesting a prevailing upward trend in the market. Given this momentum, the price may potentially continue its bullish movement towards the 1st resistance level.
The 1st support level at 2847.79 is deemed significant as it aligns with an overlap support, indicating a historical level where buying interest has been notable. This support level could act as a foundation for further upward movement.
Furthermore, the 2nd support level at 2685.37 corresponds to a pullback support, adding to its significance as a potential area where buyers might step in to support the price during any retracements.
On the resistance side, the 1st resistance level at 3057.42 is identified as a critical point where selling pressure may increase. This level aligns with the 161.80% Fibonacci extension, suggesting a potential target for bullish momentum to pause or encounter resistance.
WTI/USD:
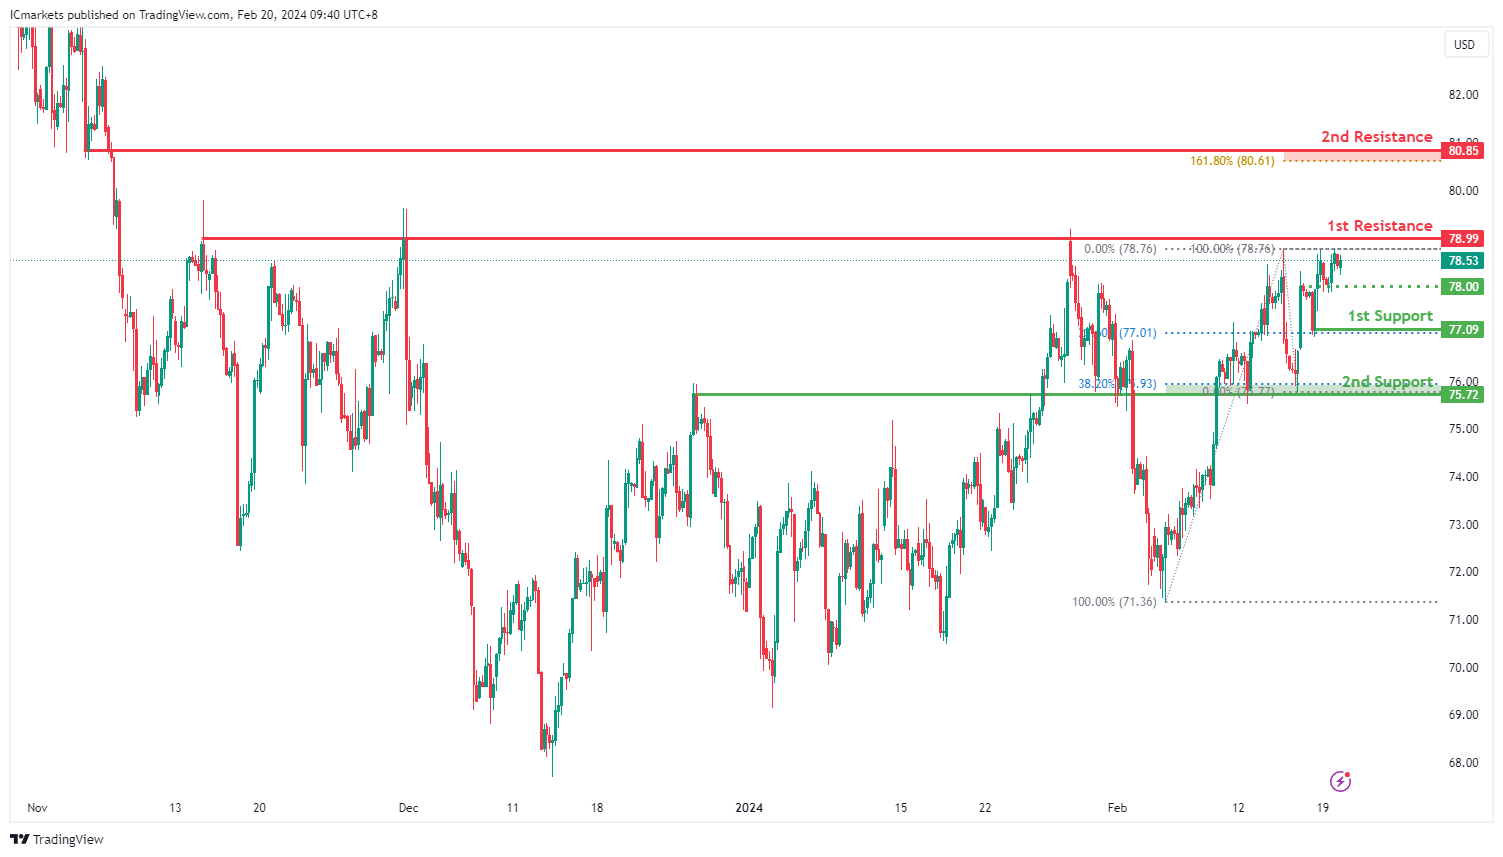
The WTI (West Texas Intermediate) chart currently exhibits an overall bullish momentum. In this context, there is a potential scenario for price to rise towards the 1st resistance.
The 1st resistance level at 78.99 is identified as a multi-swing-high resistance. Higher up, the 2nd resistance level at 80.85 is marked as a pullback resistance that aligns close to the 161.80% Fibonacci Extension level, further highlighting its importance as a potential resistance zone.
To the downside, the intermediate support level at 78.00 is identified as an overlap support while the 1st support level at 77.09 is noted as a pullback support that aligns with the 23.60% Fibonacci Retracement level. Further below, the 2nd support level at 75.72 is marked as an overlap support that aligns close to the 38.20% Fibonacci Retracement level, reinforcing its significance as a key support level.
XAU/USD (GOLD):
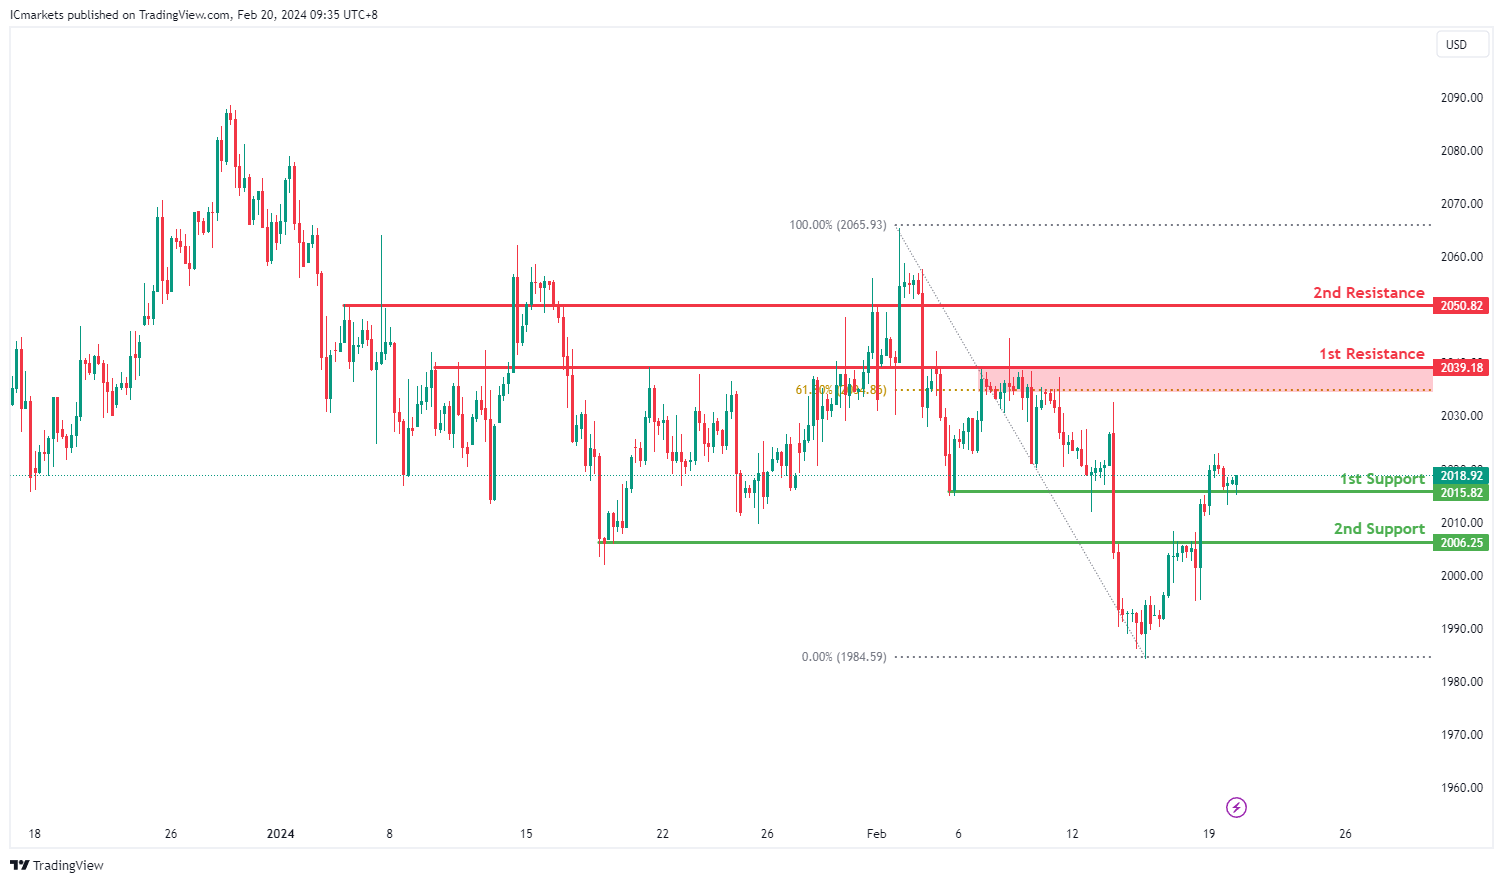
For XAUUSD, the overall momentum on the chart is bullish, indicating a potential upward movement in prices. Here’s the breakdown of identified levels and reasons supporting this analysis:
The 1st support level is at 2015.82, recognized as an overlap support. This suggests that historically, this level has attracted significant buying interest, potentially leading to a bounce in price.
The 2nd support is at 2006.25, identified as a pullback support. This level aligns with a retracement within the bullish trend, indicating a potential area of buying interest during price pullbacks.
Moving to resistance levels, the 1st resistance stands at 2039.18, noted as an overlap resistance. This level has historically acted as a barrier to upward price movements, and the presence of the 61.80% Fibonacci Retracement adds further significance to this resistance zone.
The 2nd resistance is at 2050.82, characterized as a pullback resistance. This suggests that within the bullish trend, this level may attract selling interest during price retracements.
Nasdaq (NQ) Looking to Find Buyers at Support Area
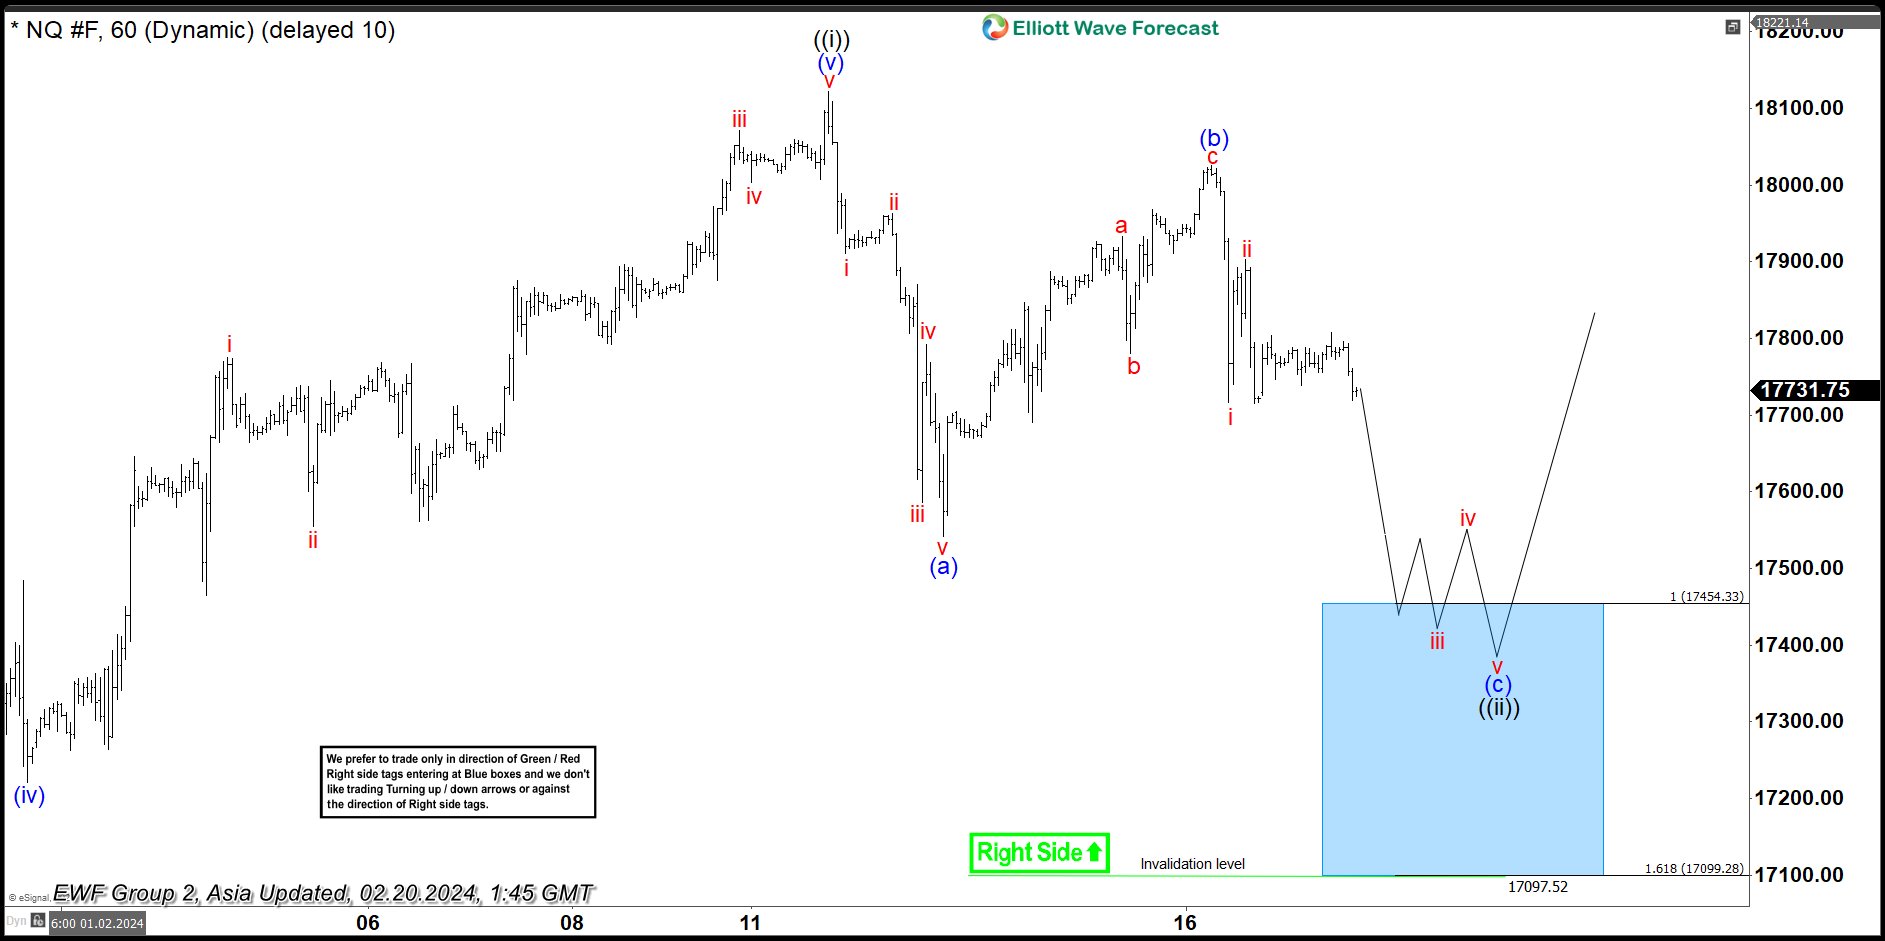
Short Term Elliott Wave View in Nasdaq (NQ) suggests that rally from 1.5.2024 low ended at 18121.5 as wave ((i)). Internal subdivision of the rally unfolded as a 5 waves impulse. Up from 1.5.2024 low, wave (i) ended at 17057 and pullback in wave (ii) ended at 16689.25. The Index then extended rally in wave (iii) towards 17793.50 and dips in wave (iv) ended at 17221.50. Final leg wave (v) ended at 18121.50 which completed wave ((i)).
Pullback in wave ((ii)) is currently in progress with internal structure as a zigzag. Down from wave ((i)), wave i ended at 17911.25 and wave ii ended at 17963.25. Wave iii lower ended at 17586.75 and wave iv ended at 17791.75. Final leg wave v ended at 17542 which completed wave (a). Index then rallied higher in wave (b) with internal subdivision as a zigzag in lesser degree. Up from wave (a), wave a ended at 17933.5 and wave b ended at 17780.5. Wave c higher ended at 18026 which completed wave (b).
The Index has turned lower in wave (c). Down from wave (b), wave i ended at 17717 and wave ii ended at 17903.50. Near term, expect the Index to continue lower and it can reach the blue box area of 17099 – 17454 before finding buyers. From this area, the Index can then resume higher or at least rally in 3 waves.
Nasdaq (NQ) 60 Minutes Elliott Wave Chart
Nasdaq Elliott Wave Video
https://www.youtube.com/watch?v=ejXRsgiLfTw
GBP/USD Faces Key Hurdle, Dollar Signals Correction
Key Highlights
- GBP/USD is attempting a recovery wave from the 1.2530 zone.
- A key bearish trend line is forming with resistance near 1.2630 on the 4-hour chart.
- Gold is facing resistance near the $2,020 zone.
- Bitcoin price is still consolidating gains above the $50,500 support.
GBP/USD Technical Analysis
The British Pound extended its decline below the 1.2620 level against the US Dollar. EUR/USD even spiked below 1.2550 before it found support.
Looking at the 4-hour chart, the pair traded as low as 1.2535 and is currently attempting a recovery wave. There was a move above the 1.2580 resistance zone. The pair broke the 50% Fib retracement level of the downward move from the 1.2690 swing high to the 1.2535 low.
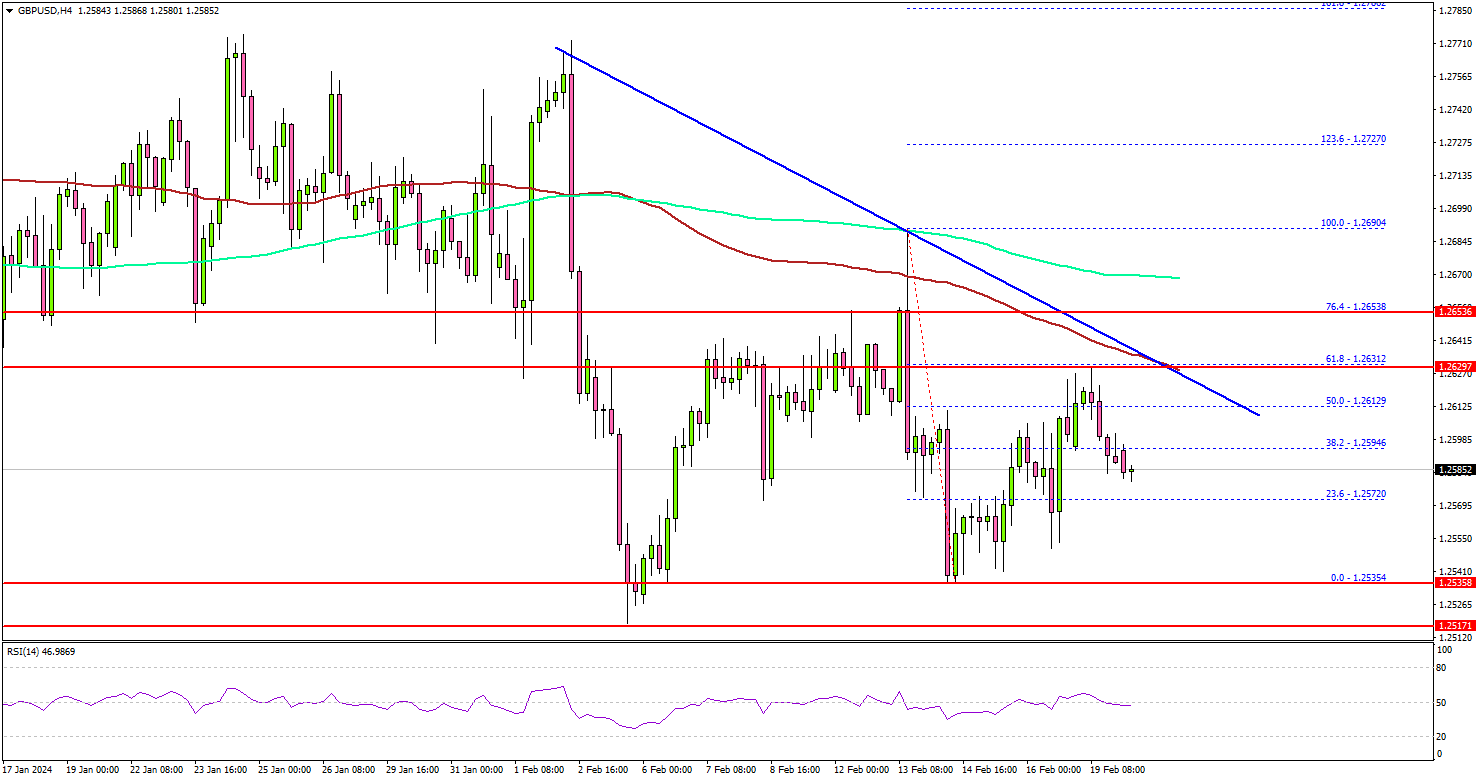
GBP/USD is now facing strong resistance near the 1.2620 zone. There is also a key bearish trend line forming with resistance near 1.2620 on the same chart.
The trend line is close to the 61.8% Fib retracement level of the downward move from the 1.2690 swing high to the 1.2535 low. A close above the 1.2620 zone could open the doors for more upsides. The next stop for the bulls might be 1.2650. Any more gains might send GBP/USD toward 1.2720.
Immediate support is near the 1.2575 level. The first major support sits near the 1.2535 level. The next major support sits at 1.2515, below which the pair might gain bearish momentum. In the stated case, the pair could even visit the 1.2440 support level.
Looking at Bitcoin, the price is still consolidating gains above the $50,000 level and might aim for more upsides.
Economic Releases
- Canadian Consumer Price Index for Jan 2024 (MoM) – Forecast +0.4%, versus -0.3% previous.
- Canadian Consumer Price Index for Jan 2024 (YoY) – Forecast +3.2%, versus +3.4% previous.
China announces historic reduction in benchmark mortgage rates, Yuan higher
In an effort to revitalize its beleaguered property sector and inject vitality into the broader national economy, China has taken larger than expected action by reducing a crucial reference rate for mortgage loans.
PBoC announced a significant cut in five-year loan prime rate to 3.95% from 4.20%. This move surpassed market expectations of a more modest reduction of 5 to 15 basis points. Notably, this adjustment also represents the largest cut in the five-year LPR since its inception in 2019 .
Conversely, one-year LPR, which serves as a barometer for market lending rates, was left unchanged at 3.45%. T
In the aftermath of this announcement, the offshore Chinese Yuan sees modest appreciation. Technically, focus will now on whether USD/CNH's current fall would push it through 7.1885 support. If realized, that would bolster the case that corrective recovery from 7.0870 has completed with three waves up to 7.2334. That would set the stage for further decline back to retest 7.0870 low in the near term.
RBA minutes: High costs of persistent inflation may necessitate additional rate hike
RBA minutes from the February 5-6 meeting revealed that the Board considered both an 25bps rate hike and maintaining the current rate. The choice to hold rates was influenced by a perceived reduction in the risk that inflation would fail to revert to the target range "within a reasonable timeframe." However, the potential repercussions of inflation not normalizing as anticipated were deemed "potentially very high," leaving the door open for future rate increases.
Central to the decision was the observation that moderation in inflation over preceding months had been "slightly larger than previously expected". Global experiences had also provided "additional confidence" on the disinflation trend. Additionally, incoming data suggested "weaker than previously expected" labor market conditions and consumer spending.
The assessment of risks surrounding the economic outlook as "broadly balanced". RBA emphasized the importance of remaining vigilant, opting to monitor evolving risks closely before making further policy adjustments. The acknowledgment of the high "costs" associated with inflation remaining above target for too long underscores the cautious stance, with members unanimously agreeing on the necessity to "not to rule out a further increase" in the cash rate target.