

Sample Category Title
EUR/USD Mid-Day Outlook
Daily Pivots: (S1) 1.0744; (P) 1.0766; (R1) 1.0800; More...
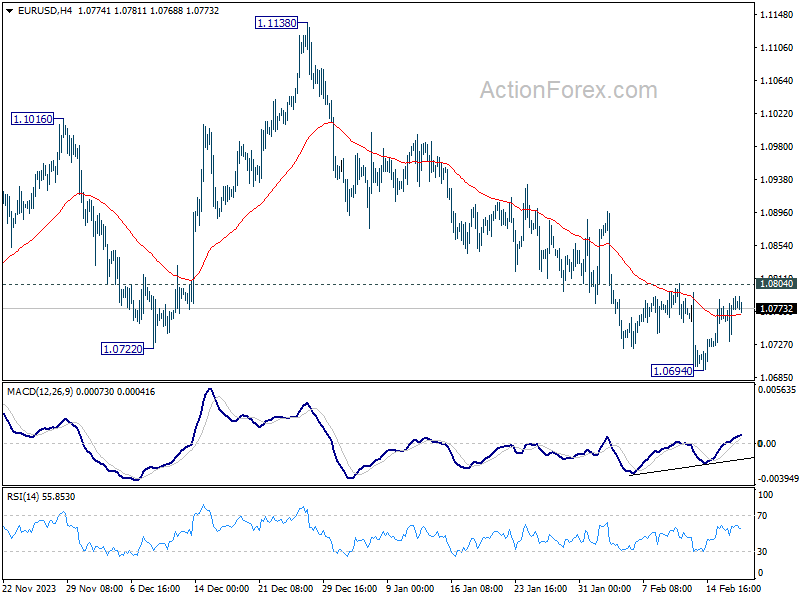
EUR/USD is extending the consolidation from 1.0694 and intraday bias stays neutral. . Further decline is in favor with 1.0804 resistance intact. On the downside, below 1.0694 will resume the fall from 1.1138 to retest 1.0447 support. Nevertheless, considering bullish convergence condition in 4H MACD, above 1.0804 will turn bias to the upside for stronger rebound.
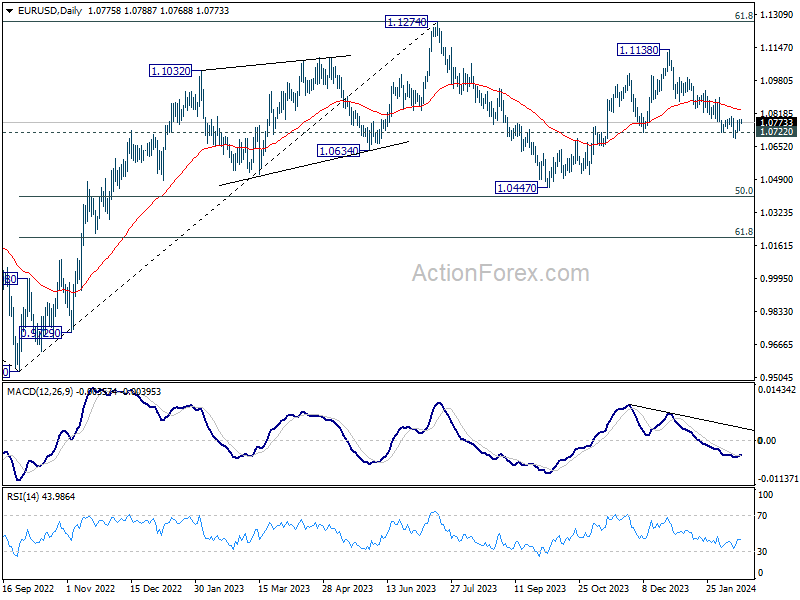
In the bigger picture, price actions from 1.1274 are viewed as a corrective pattern to rise from 0.9534 (2022 low). Rise from 1.0447 is seen as the second leg. While further rally could cannot be ruled out, upside should be limited by 1.1274 to bring the third leg of the pattern. Meanwhile, sustained break of 1.0722 support will argue that the third leg has already started for 1.0447 and possibly below.
GBP/USD Mid-Day Outlook
Daily Pivots: (S1) 1.2560; (P) 1.2592; (R1) 1.2634; More...
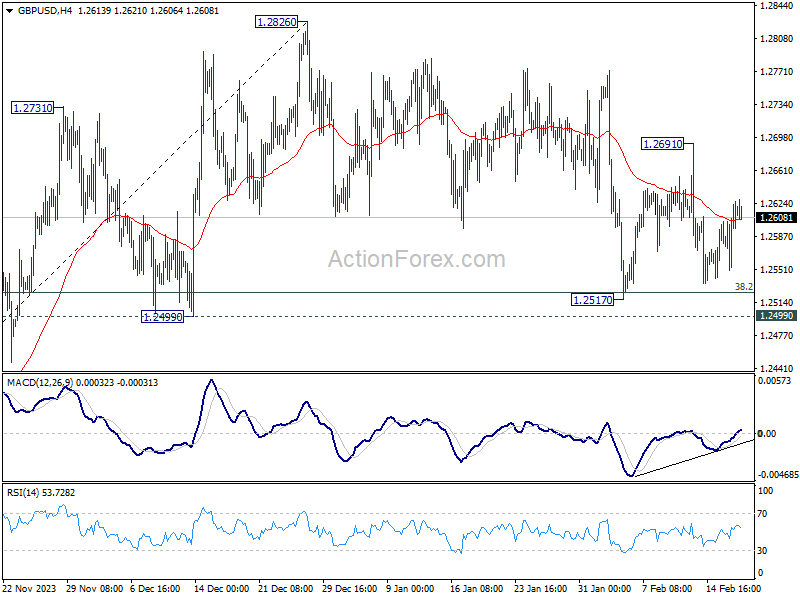
Range trading continues in GBP/USD and intraday bias stays neutral. On the upside, break of 1.2691 resistance will indicate that correction from 1.2826 has completed. Intraday bias will be back on the upside for retesting 1.2826. Nevertheless, decisive break of 1.2499 will argue that whole rise from 1.2036 has completed and turn near term outlook bearish.
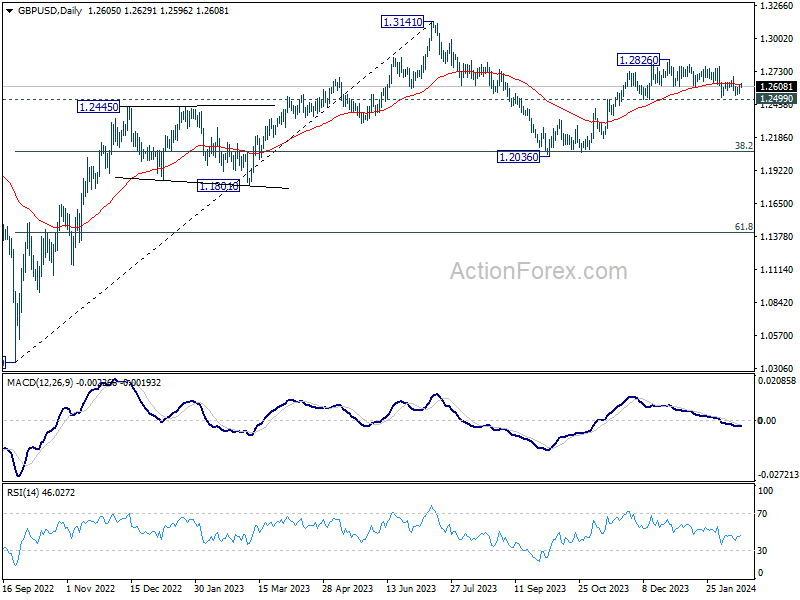
In the bigger picture, price actions from 1.3141 medium term top are seen as a corrective pattern to up trend from 1.0351 (2022 low). Rise from 1.2036 is seen as the second leg, which could be still in progress. But upside should be limited by 1.3141 to bring the third leg of the pattern. Meanwhile, break of 1.2499 support will argue that the third leg has already started for 38.2% retracement of 1.0351 (2022 low) to 1.3141 at 1.2075 again.
USD/CHF Mid-Day Outlook
Daily Pivots: (S1) 0.8788; (P) 0.8813; (R1) 0.8835; More....
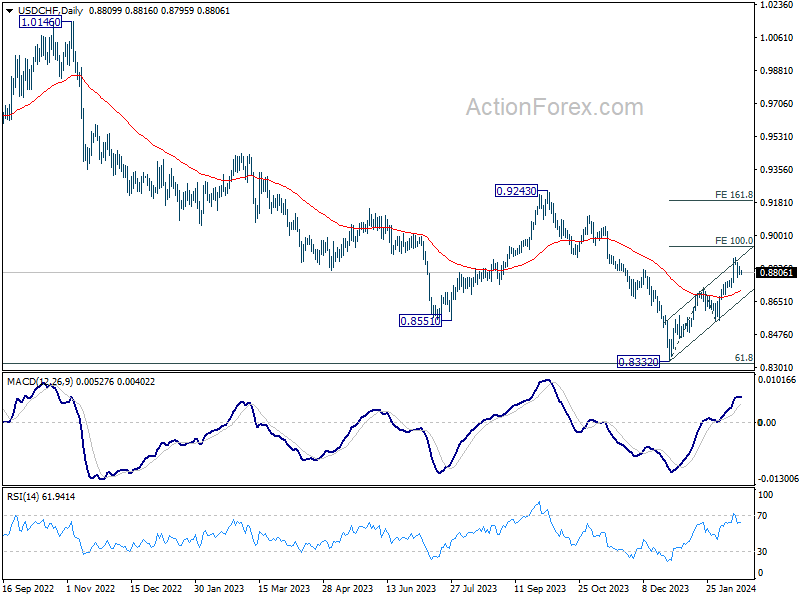
USD/CHF is extending the consolidation pattern from 0.8884 and intraday bias remains neutral. Further rally is expected as long as 0.8727 resistance turned support holds. On the upside, break of 0.8885 will resume the rise from 0.8332 and target and 100% projection of 0.8332 to 0.8727 from 0.8550 at 0.8954. However, sustained break of 0.8727 will dampen this bullish view, and turn bias back to the downside for 0.8550 support instead.
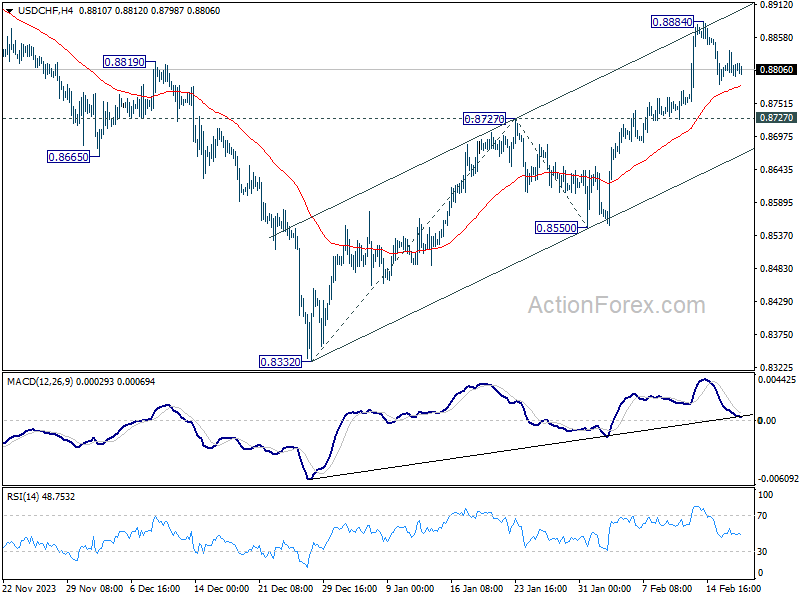
In the bigger picture, a medium term bottom should be formed at 0.8332, on bullish convergence condition in W MACD, just ahead of 0.8317 long term fibonacci support. It's still early to decide if the larger down trend from 1.0146 (2022 high) is reversing. But further rise should be seen to 0.9243 resistance even as a correction.
USD/JPY Mid-Day Outlook
Daily Pivots: (S1) 149.81; (P) 150.23; (R1) 150.63; More...
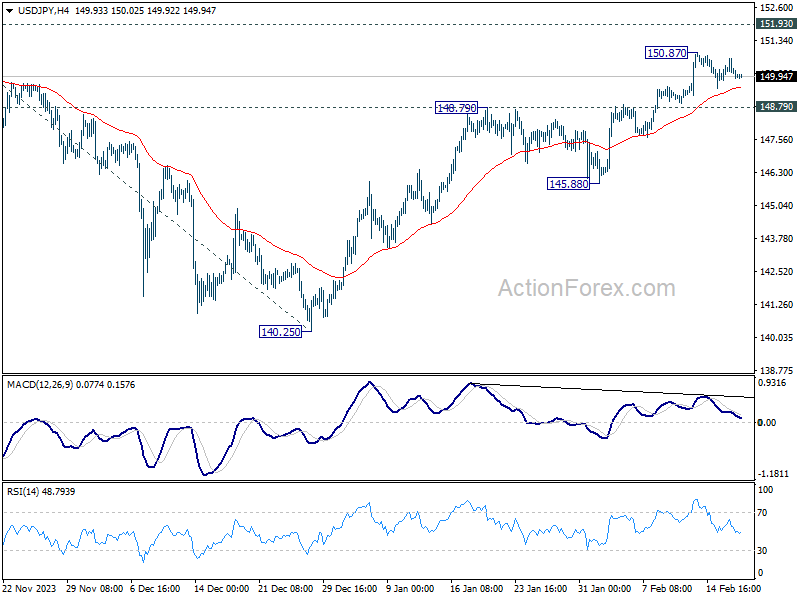
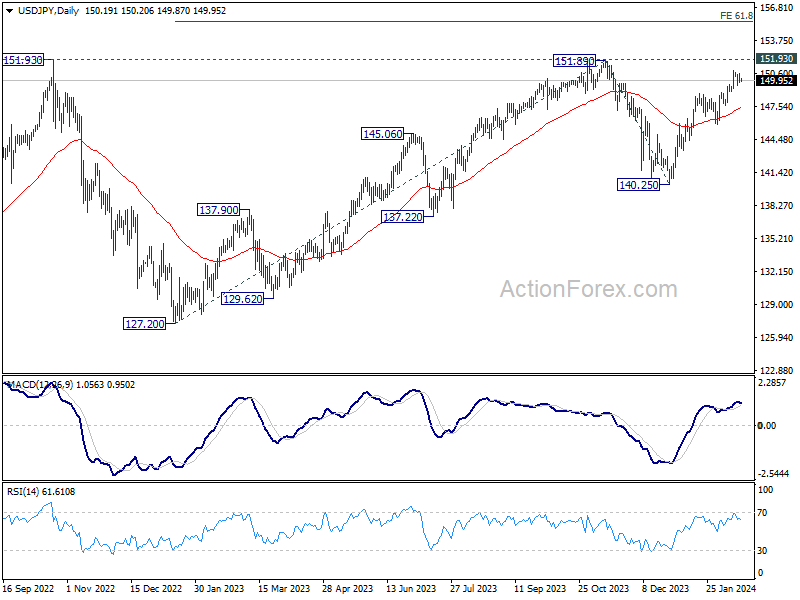
USD/JPY is extending the consolidation from 150.87 and intraday bias remains neutral. Downside of retreat should be contained by 148.79 resistance turned support to bring another rally. Above 150.87 will resume the rise from 140.25 to 151.89/93 key resistance zone. Decisive break there will confirm larger up trend resumption of 155.50 projection level next. However, firm break of 148.79 will turn bias to the downside for 145.88 support.
In the bigger picture, fall from 151.89 is seen as a correction to the rally from 127.20, which might have completed at 140.25 already. Firm break of 151.89/93 resistance zone will confirm up trend resumption, and next target will be 61.8% projection of 127.20 to 151.89 from 140.25 at 155.50. This will now remain the favored case as long as 140.25 support holds.
Bundesbank: Weak German economy but no significant, broad-based and long-lasting decline
In its latest monthly report, Bundesbank acknowledged that the "weak phase" in the German economy since Russian war of aggression against Ukraine would continue.
Despite this, it stops short of predicting a recession, defining it as a "significant, broad-based and long-lasting decline in economic output."
The report further elaborates, indicating "no signs of an impending noticeable deterioration" in the labor market stemming from the current economic slowdown.
On the inflation front, Bundesbank anticipates continued decline in inflation rates in the coming months, with price pressures on food and other goods expected to ease further. Nonetheless, the report signals slower pace of decline in service sector inflation, attributing this trend partly to "continued strong wage growth."
Australian Dollar Extends Gains, RBA Minutes Next
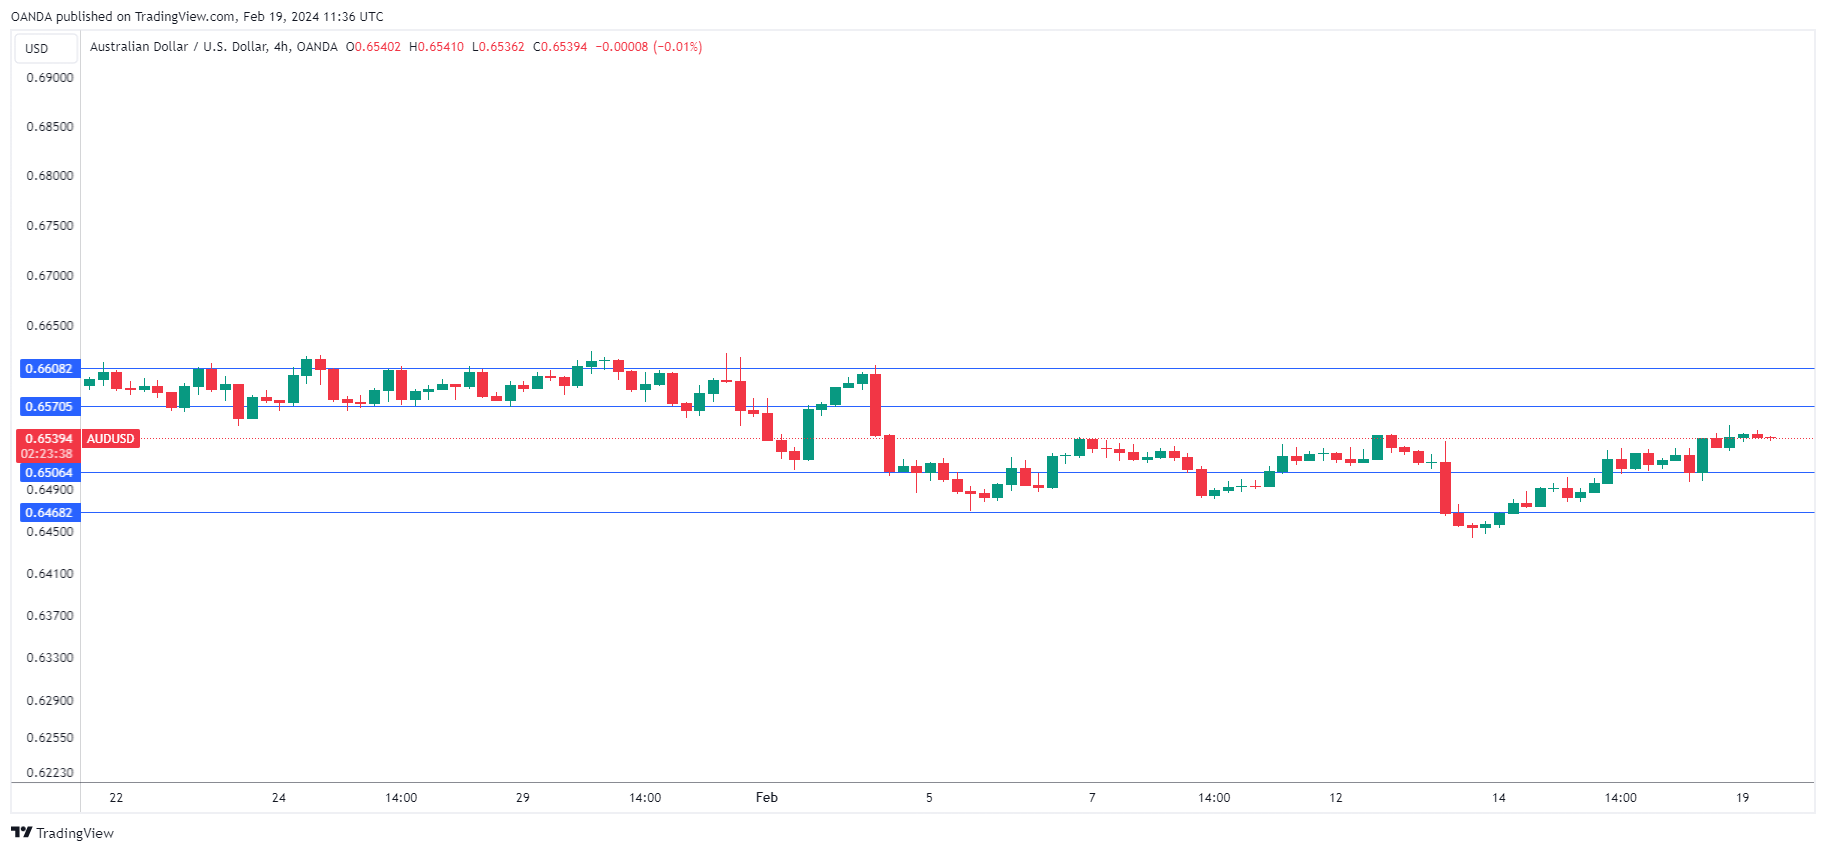
The Australian dollar extended its gains for a fourth straight day. In the European session, AUD/USD is trading at 0.6537, up 0.10%.
Last Tuesday, the Australian dollar suffered its worst one-day showing of the year, declining by 1.18%, after US inflation was higher than expected, which sent the US dollar surging higher. The Aussie has since recovered those losses and is trading at a two-week high against the US dollar.
Markets eye RBA minutes
The Reserve Bank of Australia will release the minutes of the February meeting on Tuesday. AAutrlt the meeting, there RBA maintained the cash rate at 4.35%, as expected. The RBA has raised rates only once since June, which has led to the markets pricing in rate cuts later this year. The RBA has pushed back against these expectations, as it is concerned that inflation remains sticky and won’t fall back to the 2%-3% target range until 2025.
At the February meeting, board members kept a rate hike on the table, with the policy statement noting that “a further increase in interest dates cannot be ruled out”. The minutes could provide some insights as to what factors would prompt the central bank to raise rates.
Last week’s employment report was softer than expected and the RBA will be keeping a close eye on Wednesday’s wage price index report. The RBA has reiterated that its rate path would be data dependent, and wage inflation is an important contributor to inflation. A soft release would reduce the likelihood of the RBA raising interest rates.
AUD/USD Technical
- 0.6506 and 0.6468 are providing support
- 0.6570 and 0.6608 are the next resistance lines
US 500 Index Gets Assistance After Rejection from All-time High
- US 500 holds above ascending trend line
- But technical oscillators losing some ground
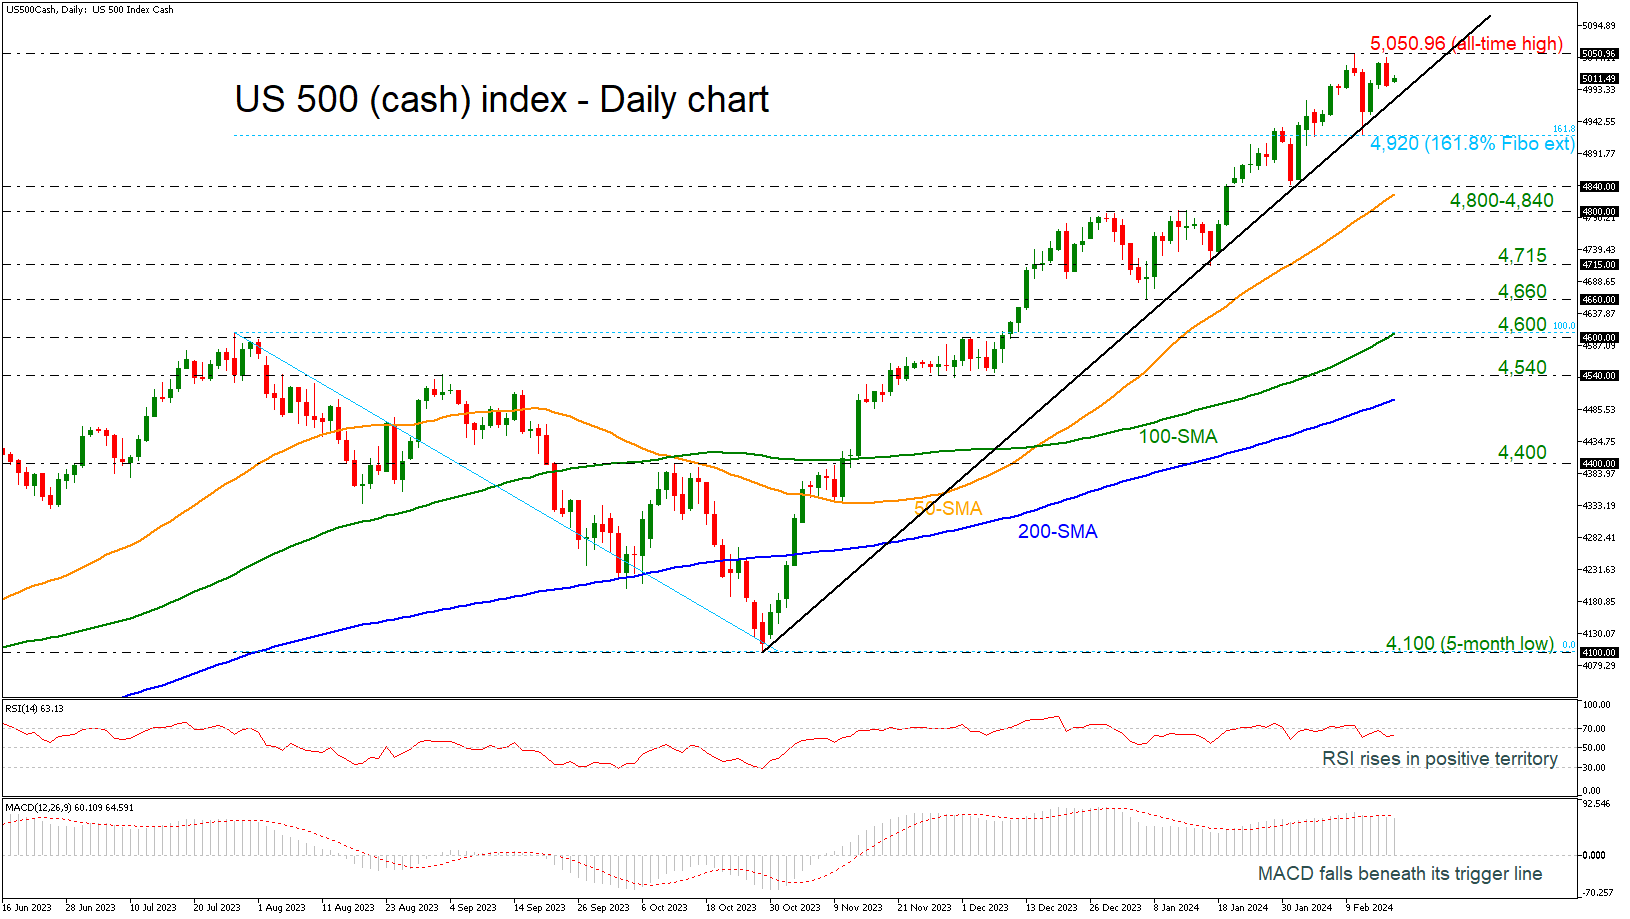
The US 500 (cash) index was challenging the all-time high of 5,050.96 in the previous sessions, before pulling lower near the 5,000 round number. The market is holding slightly above the steep ascending trend line, which has been drawn from October 27.
Technically, the bulls might still be in town as the RSI is still clearly above its 50 neutral mark despite losing some ground. But any gains could be short-lived as the MACD seems to have peaked in the positive territory and is heading south beneath its trigger line.
In the event the price stays resilient above the 5,000 critical level and the rising trend line, the bulls might push for a close above the record peak of 5,050.96, heading towards the next psychological marks, such as 5,100 and 5,200.
However, if downside pressures resume, the index will remain attractive unless it exits the bullish formation below the 161.8% Fibonacci extension level of the down leg from 4,100 to 4,600 at 4,920. If that bearish scenario is unveiled, selling forces could intensify towards the 4,800-4,840 support area, which encapsulates the 50-day simple moving average (SMA). Then, additional losses from there could retest 4,715 barricade.
In a nutshell, the US 500 index may remain supported in the coming sessions, though room for improvement could be limited before the next bearish round takes place, probably beneath the uptrend line.
EUR/USD: Larger Bears Likely to Resume After Limited Correction
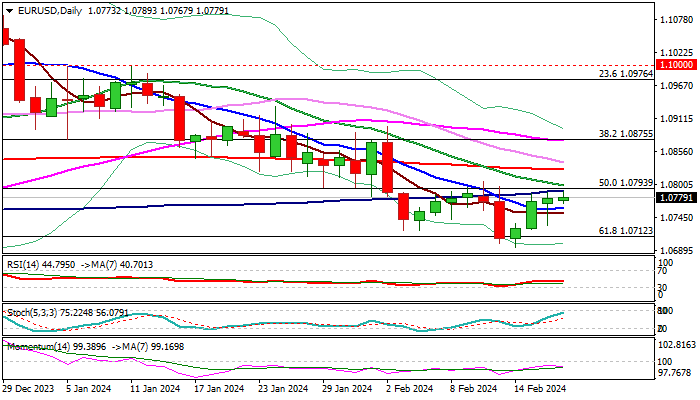
The Euro narrowed range in holiday-thinned Monday trading, as bounce from last Wednesday’s 13-week low (1.0695) started to lose traction after being repeatedly capped by 100DMA (1.0790).
Formation of bear-trap below Fibo 61.8% support on Friday was bullish signal, but positive impact was offset by weak daily studies (negative momentum/MA’s in bearish setup), with increased risk of recovery stall expected while the price action stays below important barriers at 1.0790/1.0830 zone (converging 100/20DMA’s/Fibo 23.6% of 1.1139/1.0695 / daily cloud base).
Such scenario could also be boosted by extended hawkishness from the Fed (FOMC minutes of the last policy meeting will be released late Wednesday), which would further inflate dollar on extended period of unchanged interest rates and delay of rate cuts.
Return and close below 10DMA (1.0762) will generate initial bearish signal and make the downside more vulnerable of renewed probe through cracked 1.0712 Fibo support, loss of which to signal continuation of larger downtrend from 1.1139 (Dec 28 top)
Res: 1.0800; 1.0830; 1.0864; 1.0875.
Sup: 1.0762; 1.0712; 1.0695; 1.0611.
Bitcoin and Ether in Area of Light Resistance
Market picture
The crypto market capitalisation reached $1.99 trillion, according to CoinMarketCap estimates, an increase of over 10% in one week. Forbes estimates that the $2 trillion mark was reached last week. Either way, the growth momentum is clear and very strong. Over the last 24 hours, Bitcoin gained 1.4%, overtaken by Ethereum (+4.4%) and Solana (+3.5%). BNB (-0.6%) and XRP (+0.9%) could not keep up with the current market.
Bitcoin is approaching $52.5K, having quickly found buyers after Saturday’s drawdown. Monday starts with active buying, bringing the price back to the range highs of the last five days, which are the highs since November 2021. Technically, bitcoin has no meaningful resistance levels until the area approaches $64K.
Active building of call option positions with strikes of $60K to $80K, as well as fierce demand for ETFs, could push Bitcoin to an all-time high as early as March, according to QCP Capital.
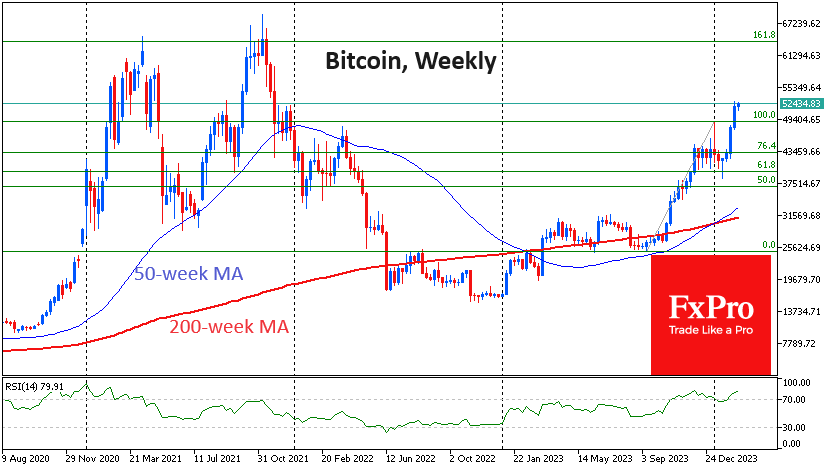
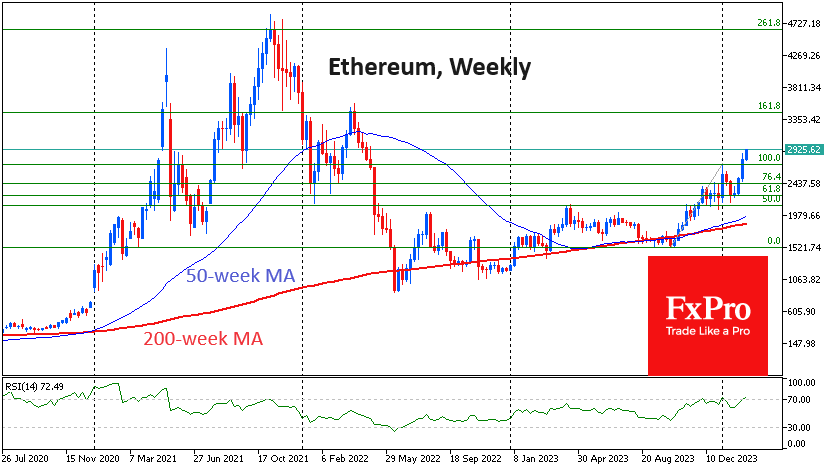
Ethereum is also trading in weak resistance territory after breaching the $2900 level. In April 2022, it plunged from levels near $3500 to $2000, with a complete capitulation at levels below $900. A recovery from $2000 to $3500 could be just as quick. This level is also close to 161.8% of the October to early December rally, which is a Fibonacci pattern.
News background
The Coinbase exchange posted a net profit of $273 million in the fourth quarter. For the year, the figure was $95 million on total revenue of $3.1 billion, the company said in a letter to investors. Coinbase acted as custodian for nearly all the spot bitcoin ETFs that received SEC approval in January.
MicroStrategy, the largest corporate holder of bitcoin, told shareholders that the company’s capitalisation would grow significantly in 2023 and that it was ready for inclusion in the S&P 500 index.
Bankrupt cryptocurrency lender Celsius said that $2 billion worth of crypto assets have already been transferred to lenders, including 20,255 BTC and 301,338 ETH.
Investment firm VanEck has filed a revised proposal with the SEC to launch a spot Ethereum-ETF. VanEck joins Franklin Templeton, Grayscale, BlackRock and Invesco in the race for Ethereum-based exchange-traded products. Some experts believe the regulator will register the products in May.
Galaxy Digital estimates that about 15-20% of the total computing power of the Bitcoin network will be unprofitable after the halving in April. The calculations are based on a BTC price of $45,000 and a 15% transaction fee.
The attractiveness of Tether’s USDT compared to other stablecoins is likely to diminish as future regulations in the US will require greater transparency and compliance with new KYC/AML standards, JPMorgan said. The bank believes that regulations for stablecoins will be coordinated globally through the Financial Stability Board within the G20.
Christopher Waller, a member of the Federal Reserve Board of Governors, believes that the popularity of stablecoins pegged to the US dollar will help maintain the dollar’s status as the world’s reserve currency.
GBP/JPY: Price Corrects from 8.5 Year High
According to CNN, the economies of the UK and Japan entered a technical recession last week as data showed a second consecutive quarterly decline in gross domestic product. And if in the UK the economic downturn can be associated with high inflation and the strict policies of the Bank of England, then in Japan the reason may be the population decline (which has been going on for 14 years in a row).
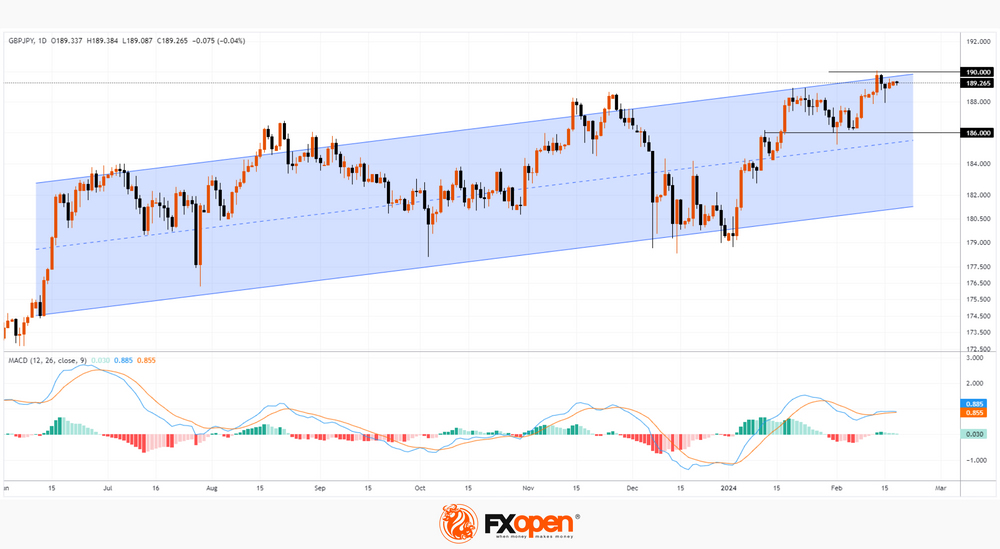
At the same time, the GBP/JPY chart shows that last week the rate exceeded 190 yen per pound for the first time since August 2015.
However:
→ the price is at the upper border of the ascending channel (shown in blue);
→ at the beginning of this week, the price of GBP/JPY is below the 190 yen level – and a false bullish breakout of the psychological level should be regarded as a bearish sign;
→ the MACD indicator indicates that demand forces are fading.
Perhaps market participants are inclined to take profits from longs. Since it is possible that the Japanese authorities are able to announce some decisions aimed at supporting the yen. In this case, one of the immediate targets for the bears may be the level of 186 yen per pound – where the support level (formerly the resistance level) is located, reinforced by the median line of the long-term channel.
Trade over 50 forex markets 24 hours a day with FXOpen. Take advantage of low commissions, deep liquidity, and spreads from 0.0 pips. Open your FXOpen account now or learn more about trading forex with FXOpen.
This article represents the opinion of the Companies operating under the FXOpen brand only. It is not to be construed as an offer, solicitation, or recommendation with respect to products and services provided by the Companies operating under the FXOpen brand, nor is it to be considered financial advice.