Sample Category Title
China Travels and Spends More than Pre-Pandemic
The week starts with the soothing news that the Chinese traveled and spent more than they did in the same period of 2019. As such, the Chinese stock markets return from the CNY break on a cheery note; the CSI 300 index in the positive while the Hang Seng index, which rebounded up to 5% since last Wednesday, is slightly grumpier following a moody close in the US last Friday, after the PPI data revealed a surprise in jump in January. Both the S&P500 and Nasdaq closed the session in the red – even though the kneejerk selloff remained relatively soft given how badly last week’s inflation figures darkened the sky regarding the Federal Reserve (Fed) cuts. The US 2-year yield spiked past 4.70% after Friday’s data, the 10-year yield spiked past the 4.30%. The expectation of a May rate cut fell to around 35% from almost certain before the inflation data.
In summary, the week starts with good news from China, bad news for the Fed doves, and mounting worries that even if the impact of rising energy and shipping costs due to the Red Sea tensions remain limited on inflation, a powerful Chinese comeback may not. The People’s Bank of China kept its MLF rate unchanged yesterday to avoid putting more pressure on the yuan – and to see the impact of an avalanche of measures announced earlier this year. The path to correction will be bumpy given that the past years’ $7 trillion erased from the Chinese equity markets costed 66 Chinee companies their place in the MSCI’s global indices. The MSCI removed 66 Chinese companies from its MSCI China and MSCI world index in its latest quarterly review. Therefore, betting on Chinese market recovery is still swimming against the tide, until the winds turn. But resurfacing risk of a China boost on inflation is brought back on the table, with one major implication: delaying the first rate cuts from the major central banks.
Interestingly, despite last week’s inflation disappointment and tumbling Fed cut expectations, the US dollar index’s failure to gather positive momentum is weighing on the bullish sentiment this morning, the index is testing the 100-DMA to the downside. The EURUSD tests its own 100-DMA resistance to the upside, as the USDJPY trades near 150 at the start of the week. Japan entering recession in the second half of the year doesn’t help keeping the Bank of Japan (BoJ) hawks motivated. On the contrary, the BoJ has no interest in exiting the negative rates if inflation doesn’t press and if the economy gives signs that it needs support. The yen’s weakness is a major appetite booster when it comes to the Japanese stocks. The chances are that the Japanese policymakers will try to hold on to their negative rates as long as they could while keeping the yen depreciation under control. The potential of a further yen selloff remains limited due to the risk of intervention, but the dream of seeing the yen shine this year is gently sailing away.
It will be a slow Monday as US and Canada are closed for holiday. But things will spice up starting from Tuesday. Walmart and Home Depot are due to announce their last quarter earnings on Tuesday and Nvidia will be revealing its much-expected Q4 earnings on Wednesday.
Because the S&P500 is shouldered by a handful of technology stocks that are surfing on the AI wave, Nvidia earnings are perceived as a potential make-or-break moment for the US stock rally. Strong earnings should back the continuation of the S&P500’s rise above 5000, while any misstep should bring investors to take profit at the actual levels and trigger a downside correction. Nvidia is expected to announce $20bn sales in Q4, up from $18bn the company announced a quarter earlier. That represents a more than 200% sales growth compared to the same period a year ago. But the stock performance is also mind-blowing. Nvidia’s stock price was almost multiplied by 7 since the beginning of last year. Nvidia surpassed Google and Amazon last week in terms of market capitalization and became the S&P500’s third biggest company. The rally could hardly extend exponentially if the sales growth takes a sit on a more reasonable ground – the basecase scerio for the coming quarters. If that’s the, if Nvidia can’t throw another layer of surprise and amazement in the party, we should also see the US stock markets go into a take profit / correction mode. But investors will continue to look for AI opportunities in every corner of the market. Last Friday, Applied Materials – a semiconductor equipment maker – saw its stock price jump more than 6% following a bullish sales forecast for the year. AI is and will remain the major theme of the year.
USD/CAD Daily Outlook
Daily Pivots: (S1) 1.3461; (P) 1.3484; (R1) 1.3509; More...
Intraday bias in USD/CAD remains neutral and more consolidation could be seen below 1.3585 resistance. Further rally is expected as long as 1.3357 support holds. On the upside, firm break of 1.3585 will resume the rebound from 1.3176 for 1.3897 resistance.
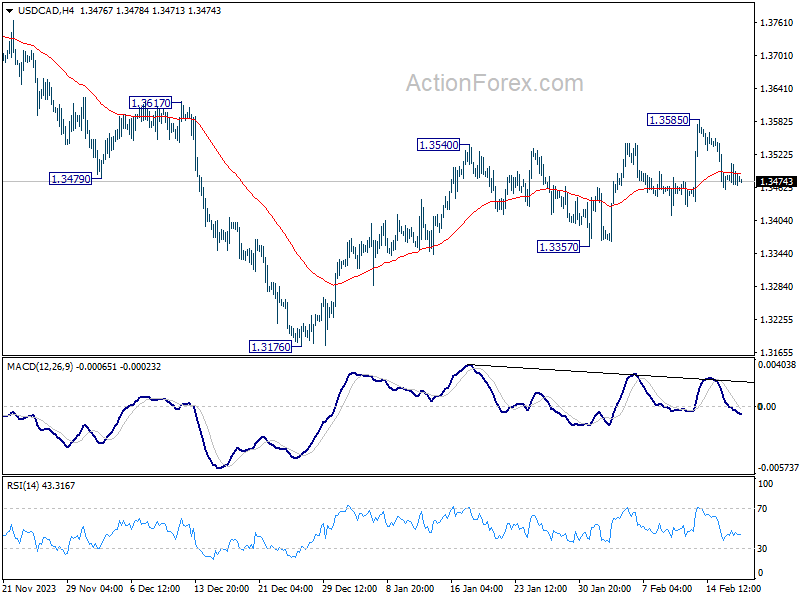
In the bigger picture, price actions from 1.3976 (2022 high) are viewed as a corrective pattern only. In case of another fall, strong support should emerge above 1.2947 resistance turned support to bring rebound. Overall, larger up trend from 1.2005 (2021 low) is still expected to resume through 1.3976 at a later stage.
AUD/USD Daily Report
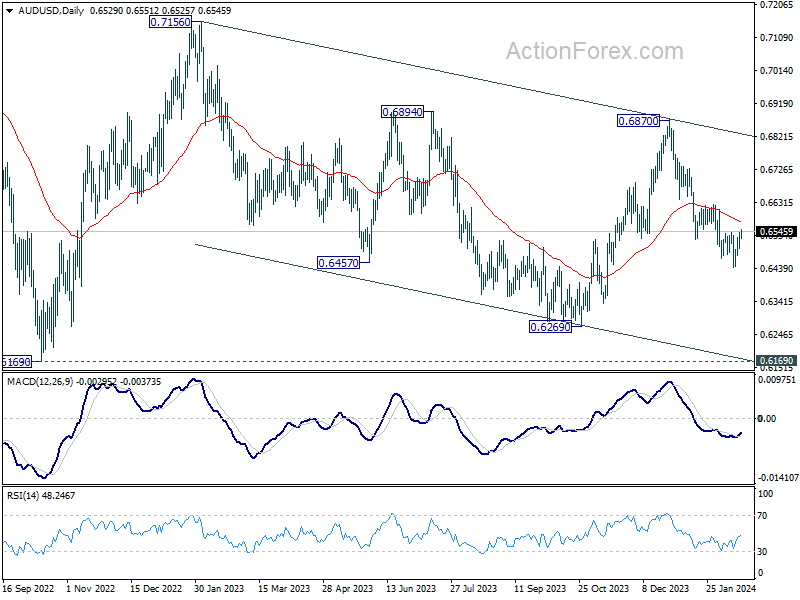
Daily Pivots: (S1) 0.6503; (P) 0.6524; (R1) 0.6552; More...
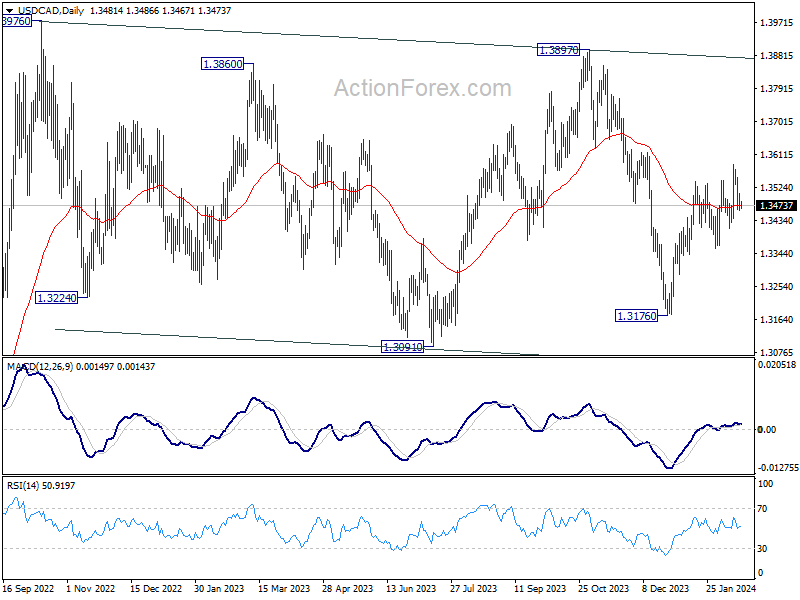
Intraday bias in AUD/USD remains neutral and more consolidations would be seen above 0.6442 first. Stronger recovery cannot be ruled out, but outlook will remain bearish as long as 0.6621 resistance holds. Break of 0.6642 will resume the decline from 0.6870 towards 0.6269 low.
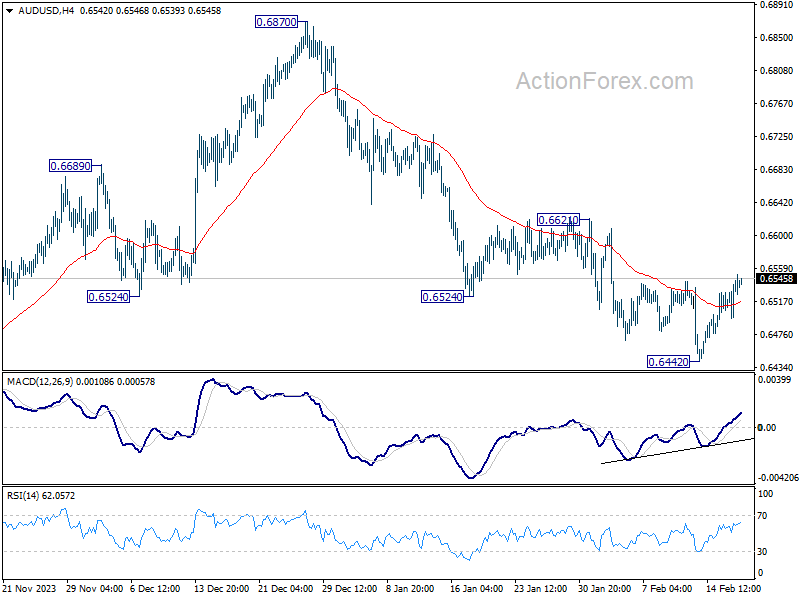
In the bigger picture, price actions from 0.6169 (2022 low) are seen as a medium term corrective pattern to the down trend from 0.8006 (2021 high). Fall from 0.7156 (2023 high) is seen as the second leg, which might still be in progress. Overall, sideway trading could continue in range of 0.6169/7156 for some more time. But as long as 0.7156 holds, an eventual downside breakout would be mildly in favor.
EUR/USD Daily Outlook
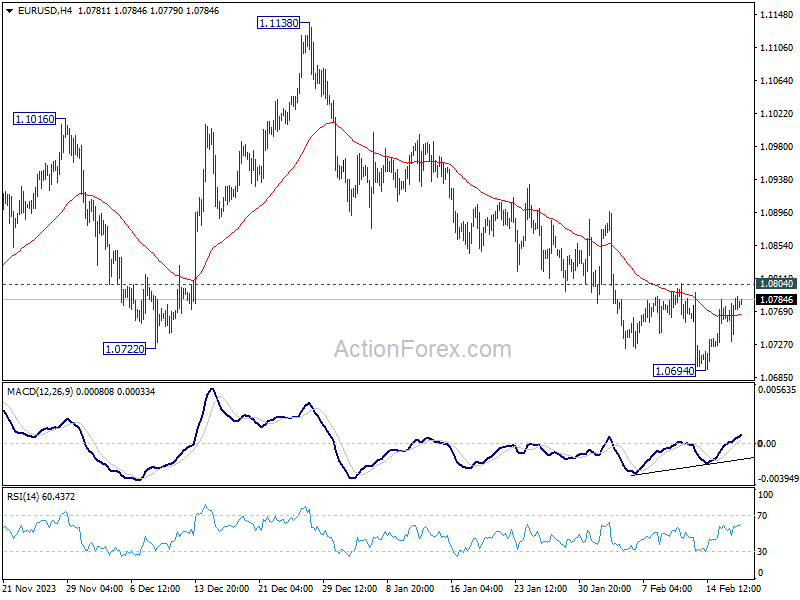
Daily Pivots: (S1) 1.0744; (P) 1.0766; (R1) 1.0800; More...
Intraday bias in EUR/USD stays neutral and more consolidations could be seen above 1.0694. . Further decline is in favor with 1.0804 resistance intact. On the downside, below 1.0694 will resume the fall from 1.1138 to retest 1.0447 support. Nevertheless, considering bullish convergence condition in 4H MACD, above 1.0804 will turn bias to the upside for stronger rebound.
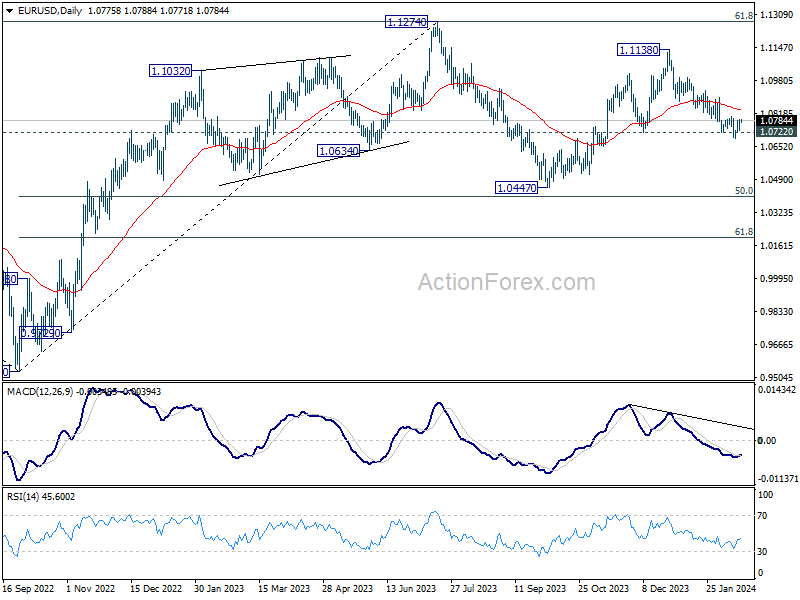
In the bigger picture, price actions from 1.1274 are viewed as a corrective pattern to rise from 0.9534 (2022 low). Rise from 1.0447 is seen as the second leg. While further rally could cannot be ruled out, upside should be limited by 1.1274 to bring the third leg of the pattern. Meanwhile, sustained break of 1.0722 support will argue that the third leg has already started for 1.0447 and possibly below.
GBP/USD Daily Outlook
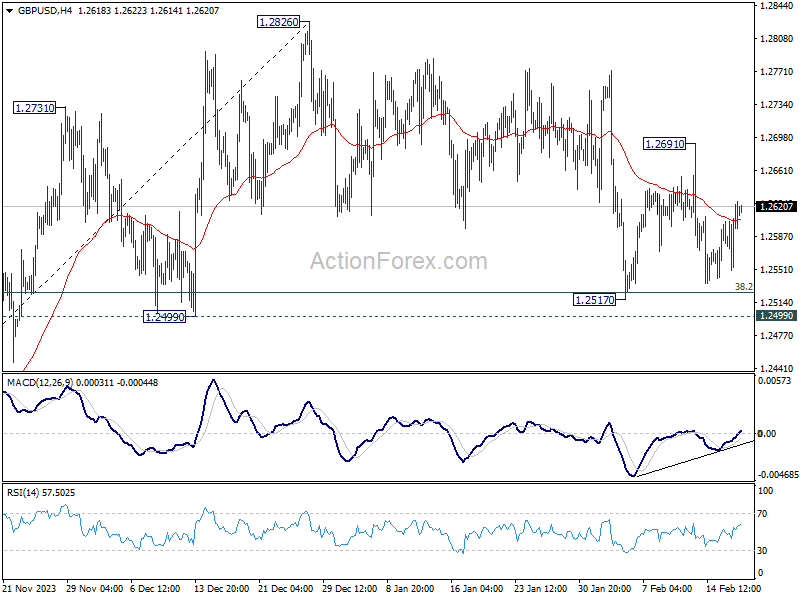
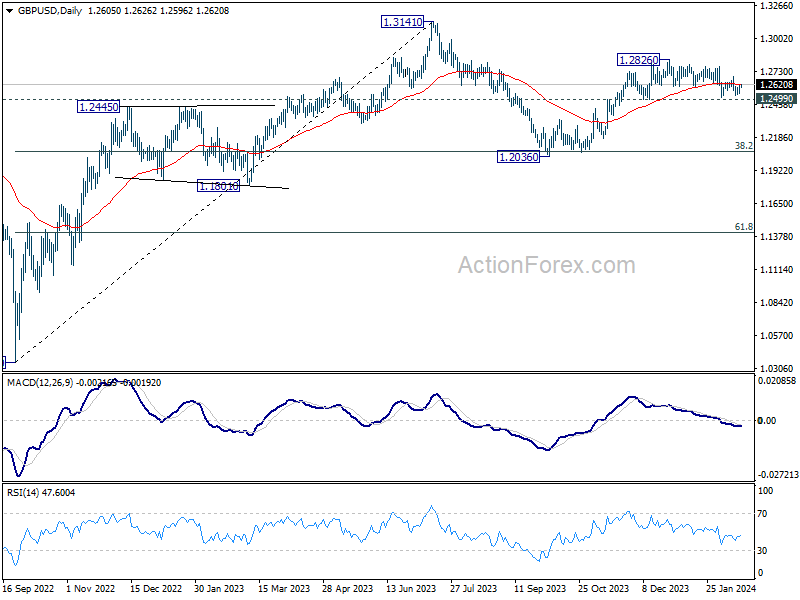
Daily Pivots: (S1) 1.2560; (P) 1.2592; (R1) 1.2634; More...
Intraday bias in GBP/USD remains neutral for the moment and outlook is unchanged. On the upside, break of 1.2691 resistance will indicate that correction from 1.2826 has completed. Intraday bias will be back on the upside for retesting 1.2826. Nevertheless, decisive break of 1.2499 will argue that whole rise from 1.2036 has completed and turn near term outlook bearish.
In the bigger picture, price actions from 1.3141 medium term top are seen as a corrective pattern to up trend from 1.0351 (2022 low). Rise from 1.2036 is seen as the second leg, which could be still in progress. But upside should be limited by 1.3141 to bring the third leg of the pattern. Meanwhile, break of 1.2499 support will argue that the third leg has already started for 38.2% retracement of 1.0351 (2022 low) to 1.3141 at 1.2075 again.
USD/JPY Daily Outlook
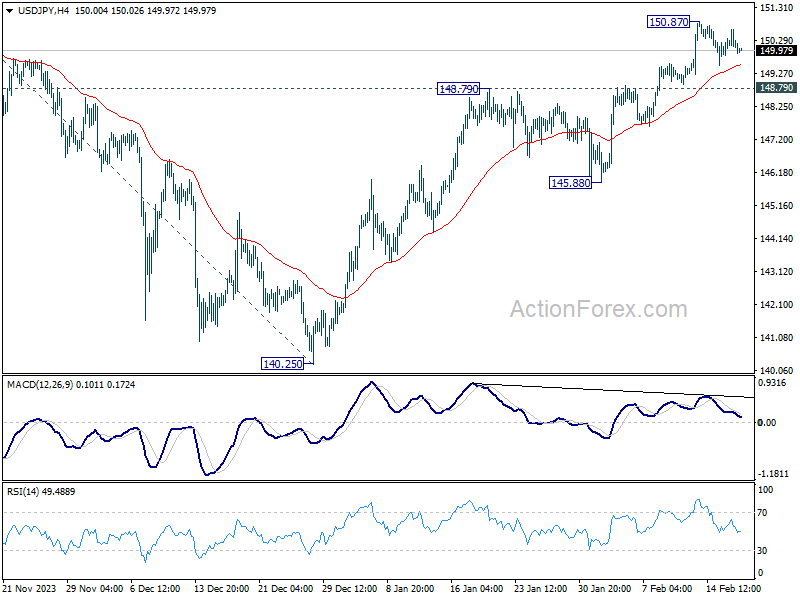
Daily Pivots: (S1) 149.81; (P) 150.23; (R1) 150.63; More...
Intraday bias in USD/JPY remains neutral at this point and more consolidations would be seen below 150.78. Downside of retreat should be contained by 148.79 resistance turned support to bring another rally. Above 150.87 will resume the rise from 140.25 to 151.89/93 key resistance zone. Decisive break there will confirm larger up trend resumption of 155.50 projection level next. However, firm break of 148.79 will turn bias to the downside for 145.88 support.
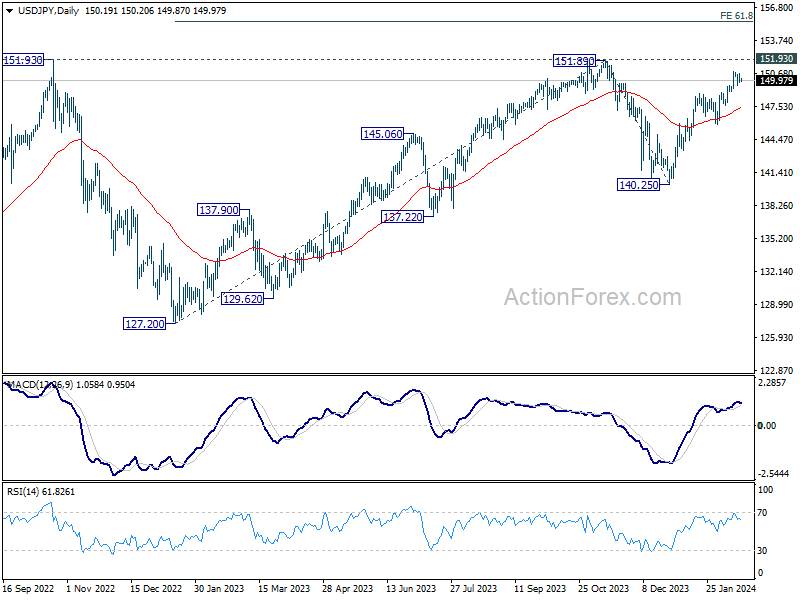
In the bigger picture, fall from 151.89 is seen as a correction to the rally from 127.20, which might have completed at 140.25 already. Firm break of 151.89/93 resistance zone will confirm up trend resumption, and next target will be 61.8% projection of 127.20 to 151.89 from 140.25 at 155.50. This will now remain the favored case as long as 140.25 support holds.
USD/CHF Daily Outlook
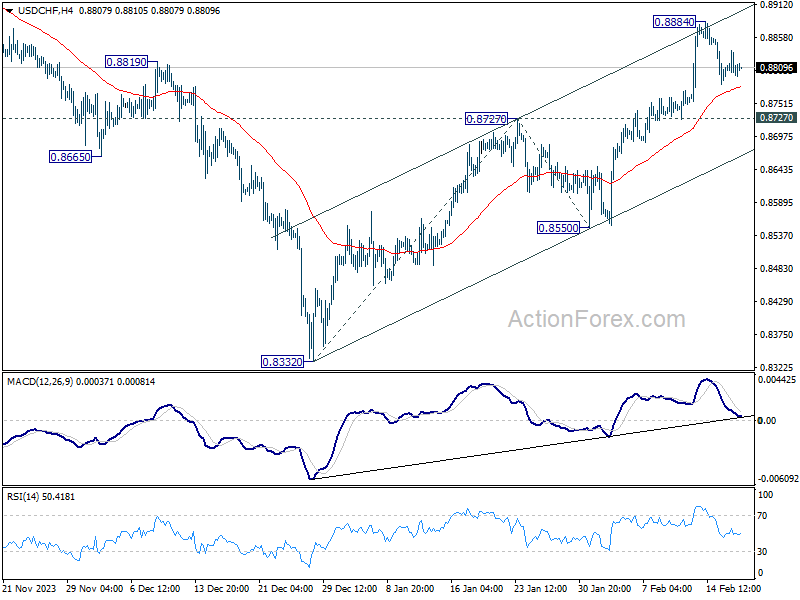
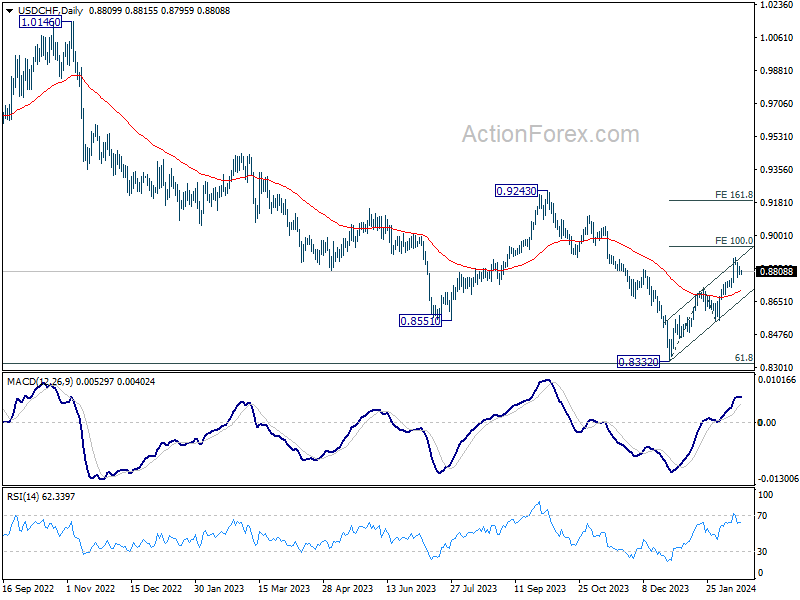
Daily Pivots: (S1) 0.8788; (P) 0.8813; (R1) 0.8835; More....
Intraday bias in USD/CHF remains neutral at this point, and more consolidations could be seen below 0.8884. Nevertheless, further rally is expected as long as 0.8727 resistance turned support holds. On the upside, break of 0.8885 will resume the rise from 0.8332 and target and 100% projection of 0.8332 to 0.8727 from 0.8550 at 0.8954. However, sustained break of 0.8727 will dampen this bullish view, and turn bias back to the downside for 0.8550 support instead.
In the bigger picture, a medium term bottom should be formed at 0.8332, on bullish convergence condition in W MACD, just ahead of 0.8317 long term fibonacci support. It's still early to decide if the larger down trend from 1.0146 (2022 high) is reversing. But further rise should be seen to 0.9243 resistance even as a correction.
Services Sector Boost and Shifting RBNZ Rate Forecasts Propel NZD Higher
New Zealand Dollar bounces broadly in quiet Asian session, partly underpinned by notable improvement economic data which showed that the services sector has swung back into expansion at the start of 2024. Additionally, economists are increasingly expecting that more work is needed by RBNZ to cool the economic to bring down inflation.
BNZ Bank said that it has postponed its expectation of an RBNZ rate cut to November from an earlier prediction of August. This adjustment comes amid lively discussions about RBNZ's policy path, especially in the wake of ANZ's projection of an additional rate hike in February.
BNZ's head of research cautioned against further hikes, highlighting easing labor market conditions, increasing spare capacity, and declining inflation as reasons why another increase would constitute a policy misstep. Despite these concerns, the expectation that interest rates will remain at their current high levels continues to lend support to the Kiwi.
In the day's trading, the Australian Dollar ranks as the second strongest currency, followed by the Japanese Yen, while the US Dollar lags significantly, grouped with the Swiss Franc and Euro as the day's underperformers. The British Pound shows a mixed performance. Trading activity may be muted due to a nearly empty European economic calendar and a holiday in the United States.
However, the horizon is lined with significant forthcoming events that promise to reinvigorate market volatility. Key among these are the eagerly anticipated minutes from Fed, ECB, and RBA. Additionally, the release of global PMI data stands poised to offer critical insights into the global economic health.
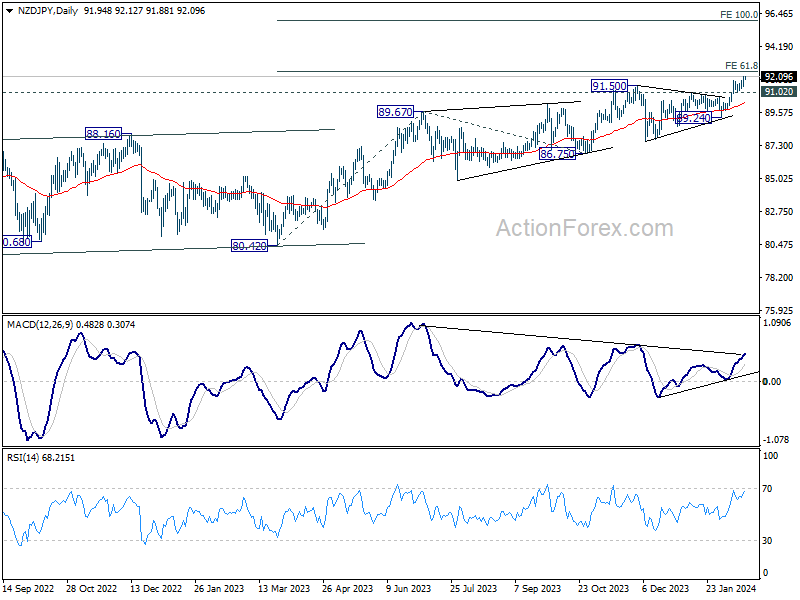
Technically, NZD/JPY's up trend is still in progress for 61.8% projection of 80.42 to 89.67 from 86.75 sat 92.46. Decisive break there could prompt upside acceleration to 100% projection at 96.00 next. For now, near term outlook will stay bullish as long as 91.02 support holds, in case of retreat.
In Asia, at the time of writing, Nikkei is down -0.15%. Hong Kong HSI is down -1.14%. China Shanghai SSE is up 0.82%. Singapore Strait Times is up 0.36%. Japan 10-year JGB yield is up 0.0056 at 0.736.
NZ BNZ services rises to 52.1, springs back to growth
New Zealand's BusinessNZ Performance of Services Index rose from 48.8 to 52.1 in January, marking its highest peak since May 2023. This rebound places the sector back into expansion, albeit slightly below long-term average of 53.4.
Components of the PSI showed notable improvements: activity/sales surged to 53.0 from 47.2, employment edged up to 48.1 from 47.2, new orders/business increased to 51.8 from 50.8, and stocks/inventories rose to 53.5 from 51.7. However, a decrease in supplier deliveries to 48.7 from 50.3 hints at logistical challenges.
Reflecting on the sector's performance, BusinessNZ's chief executive, Kirk Hope, remarked on the "seesaw" trend between expansion and contraction observed in recent months. He highlighted that the sector's sustained recovery hinges on "continued momentum" in business activity and new orders, coupled with alleviation in "cost of living" pressures.
BNZ Senior Economist Doug Steel provided an optimistic outlook, suggesting that the combined PMI and PSI activity indicator hints that "annual GDP growth will soon turn positive." Yet Steel cautioned that further progress is essential to mitigate growing spare capacity within the economy.
Bitcoin eyeing 61.8% projection level after breaking 50K barrier
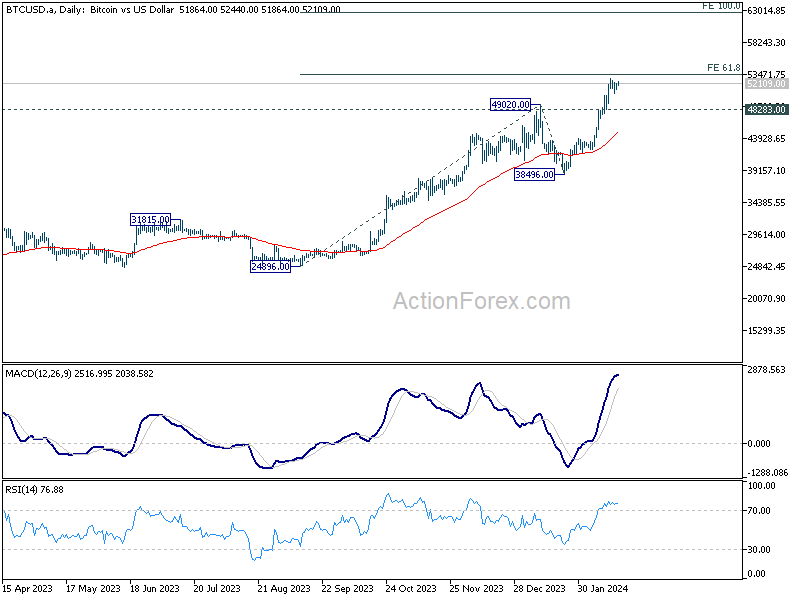
Bitcoin's remarkably surged past 50k mark last week, propelling its market capitalization back over the USD 1 trillion. The significant uptick is largely driven by an influx of investments into BTC spot ETF. This bullish sentiment is further fueled by anticipation surrounding several key events this year: the forthcoming fourth Bitcoin halving, first Fed interest rate cut, and the possibility of an Ethereum spot ETF approval.
From a technical perspective, Bitcoin is now setting its sights on 61.8% projection of 24896 to 49020 from 38496 at 53404. Decisive break above this level could trigger further upside acceleration, with the next target at 100% projection at 62620. However, a retreat below 48283 support level would suggest a period of near-term consolidation. But downside should be contained above 38496 support to bring another rally.
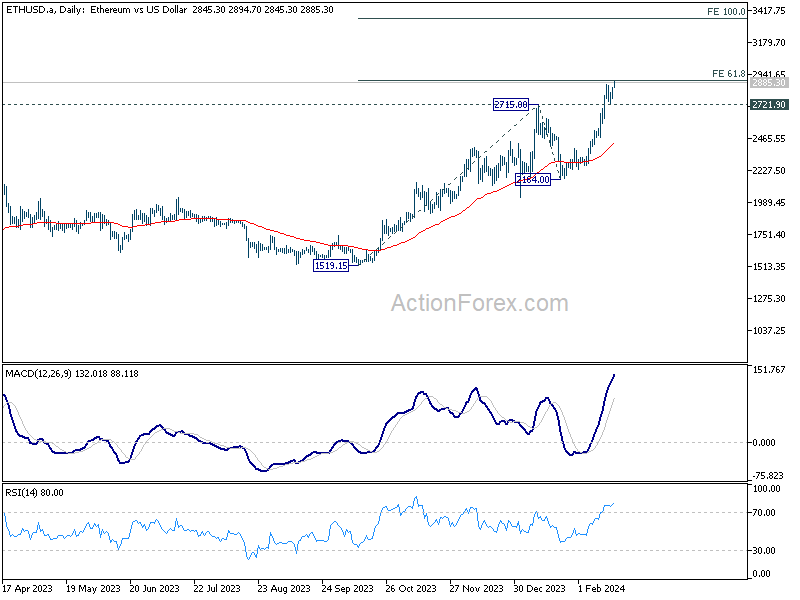
Ethereum mirrors this bullish outlook, testing 61.8% projection of 1519to 2715 from 2164 at 2903 now. Sustained break there could prompt further upside acceleration to 100% projection at 3360. Break of 2721.9 support will bring consolidations first. But downside of retreat should be contained above 2164 to bring rebound.
The week ahead: Scrutinizing minutes from Fed, ECB, and RBA; PMI data across major economies
Three central banks will release their latest monetary policy meeting minutes this week. As for Fed, the minutes will likely reiterate that rate cuts are on the card for the year. However, uncertainty remains high regarding the rate path ahead. Thus, it's important to maintain a careful and data-dependent approach. It's also unlikely to see any substantial hints on the timing of the first cut, except that March is highly unlikely.
As for ECB, the minutes should echo comments from officials that inflation is on track to 2% target. For now, the minutes should also repeat that convincing evidence of a sustained turnaround in wages had yet to emerge. And hence, it's still early to decide on cutting rates. A critical point to scrutinize is whether there are voices that with new economic available, March could be an option to start lowering interest rates. Or on the other hand, any explicit preference regarding April or June.
As for RBA minutes, the main question is on how uncomfortable or confident the board is regarding disinflation back to target range. Governor Michele Bullock was explicit that another hike is neither ruled out nor ruled in. This stance would likely be reflected in the minutes too.
The week is also busy with economic data too. PMIs from major economies, in particular services will be watched closely, on aspects including activity, prices, employment. Canada's CPI data is another highlight, together with New Zealand's retail sales, Germany Ifo business climate.
Here are some highlights for the week:
- Monday: New Zealand BusinessNZ services index; Japan machine order; Canada IPPI and RMPI.
- Tuesday: RBA minutes; Swiss trade balance; Eurozone current account; Canada CPI.
- Wednesday: New Zealand PPI; Japan trade balance; Australia wage price index; Canada new housing price index; Eurozone consumer confidence; FOMC minutes.
- Thursday: Australia PMIs; Japan PMIs; Eurozone PMIs, CPI final, ECB meeting accounts; UK PMIs; Canada retail sales; US jobless claims, PMIs, existing home sales.
- Friday: New Zealand retail sales; UK Gfk consumer sentiment; Germany GDP final Ifo business climate.
USD/CHF Daily Outlook
Daily Pivots: (S1) 0.8788; (P) 0.8813; (R1) 0.8835; More....
Intraday bias in USD/CHF remains neutral at this point, and more consolidations could be seen below 0.8884. Nevertheless, further rally is expected as long as 0.8727 resistance turned support holds. On the upside, break of 0.8885 will resume the rise from 0.8332 and target and 100% projection of 0.8332 to 0.8727 from 0.8550 at 0.8954. However, sustained break of 0.8727 will dampen this bullish view, and turn bias back to the downside for 0.8550 support instead.
In the bigger picture, a medium term bottom should be formed at 0.8332, on bullish convergence condition in W MACD, just ahead of 0.8317 long term fibonacci support. It's still early to decide if the larger down trend from 1.0146 (2022 high) is reversing. But further rise should be seen to 0.9243 resistance even as a correction.
Economic Indicators Update
| GMT | Ccy | Events | Actual | Forecast | Previous | Revised |
|---|---|---|---|---|---|---|
| 21:30 | NZD | Business NZ PSI Jan | 52.1 | 48.8 | ||
| 23:50 | JPY | Machinery Orders M/M Dec | 2.70% | 2.50% | -4.90% | |
| 00:01 | GBP | Rightmove House Price Index M/M Feb | 0.90% | 1.30% | ||
| 11:00 | EUR | German Buba Monthly Report | ||||
| 13:30 | CAD | Industrial Product Price M/M Jan | 0.10% | -1.50% | ||
| 13:30 | CAD | Raw Material Price Index Jan | 0.80% | -4.90% |
Aussie Gets Knocked Down, Gets Back Up Again
The Australian dollar printed 3-month lows at 0.6443 last week in the wake of elevated US CPI data but was able to recover its lost ground over the week. This week’s focus will be on the reopening of mainland China markets and Australian Q4 wages data.
Last week we warned that the monthly US consumer price index release has often been the spark for large moves in FX and interest rate markets over the past 2 years or so. US January CPI was another case in point. Overall inflation came in at 3.1%yr, down from 3.4%yr in December but above the 2.9% expected, while CPI ex-food and energy remained at 3.9%yr versus an expected softening to 3.7%yr.
This bolstered the US dollar’s yield appeal, the 2-year Treasury note yield jumping 18 basis points to 4.66% on Tuesday (Australian 2-year yields are around 3.84%). The US Dollar Index rose 0.8% on Tuesday, to highs since November 2023. The US dollar rose above 150 Japanese yen for the first time since November and the euro marked similar lows.
But the US dollar was unable to extend its gains, edging lower into the weekend despite US yields holding most gains. Perhaps undermining the US dollar’s safe haven appeal are some glimmers of optimism over China’s economy. As the Chinese stock market prepared to open today, official newswires highlighted data showing a 19% rise in domestic tourist travel and 8% rise in lunar new year holiday spending compared to pre-Covid 2019.
There is also an expectation that Chinese equities can resume the rally that – with official help – commenced 3 days before the LNY holidays, if only by catching up with the gains in other Asia-Pacific equity markets last week. Whether longstanding global investor pessimism on China’s economy changes much remains to be seen.
It is a relatively quiet data week in Australia and globally. We have already heard plenty from the RBA this month but the February meeting minutes should still draw some attention, especially as they usually add some specifics on the discussion over the cash rate decision.
The quarterly pace of Australian wages growth is expected to slow to 0.9%qtr in Q4 after the 1.3% jump in Q3 which was boosted by the minimum wage decision and enterprise agreements linked to high headline inflation earlier in 2023. The annual rate should edge up to 4.1% from 4.0% but Westpac forecasts wages growth to ease to 3.2%yr by end-2024 as the labour market softens.
China’s return will add plenty of volume to commodity trade. Last week, the LME metals index jumped 3.2% but remains within recent ranges and well down over the past year. Spot iron ore resumes after LNY around US$130/tonne. Energy prices are mixed - crude oil has pushed up to match highs since October but European natural gas prices have fallen to lows since June 2023. Last month was reportedly the warmest January globally on record, following the warmest December.
Event risk
China markets reopen after lunar new year holidays, US Presidents Day holiday (Mon), RBA Feb meeting minutes (Tue), Aust Q4 wage price index, US FOMC Jan meeting minutes (Wed), Advance February S&P Global PMIs in Eurozone, US, UK et al (Thu), NZ Q4 retail sales, Japan holiday, Germany Feb IFO business survey (Fri)
Technical Outlook and Review
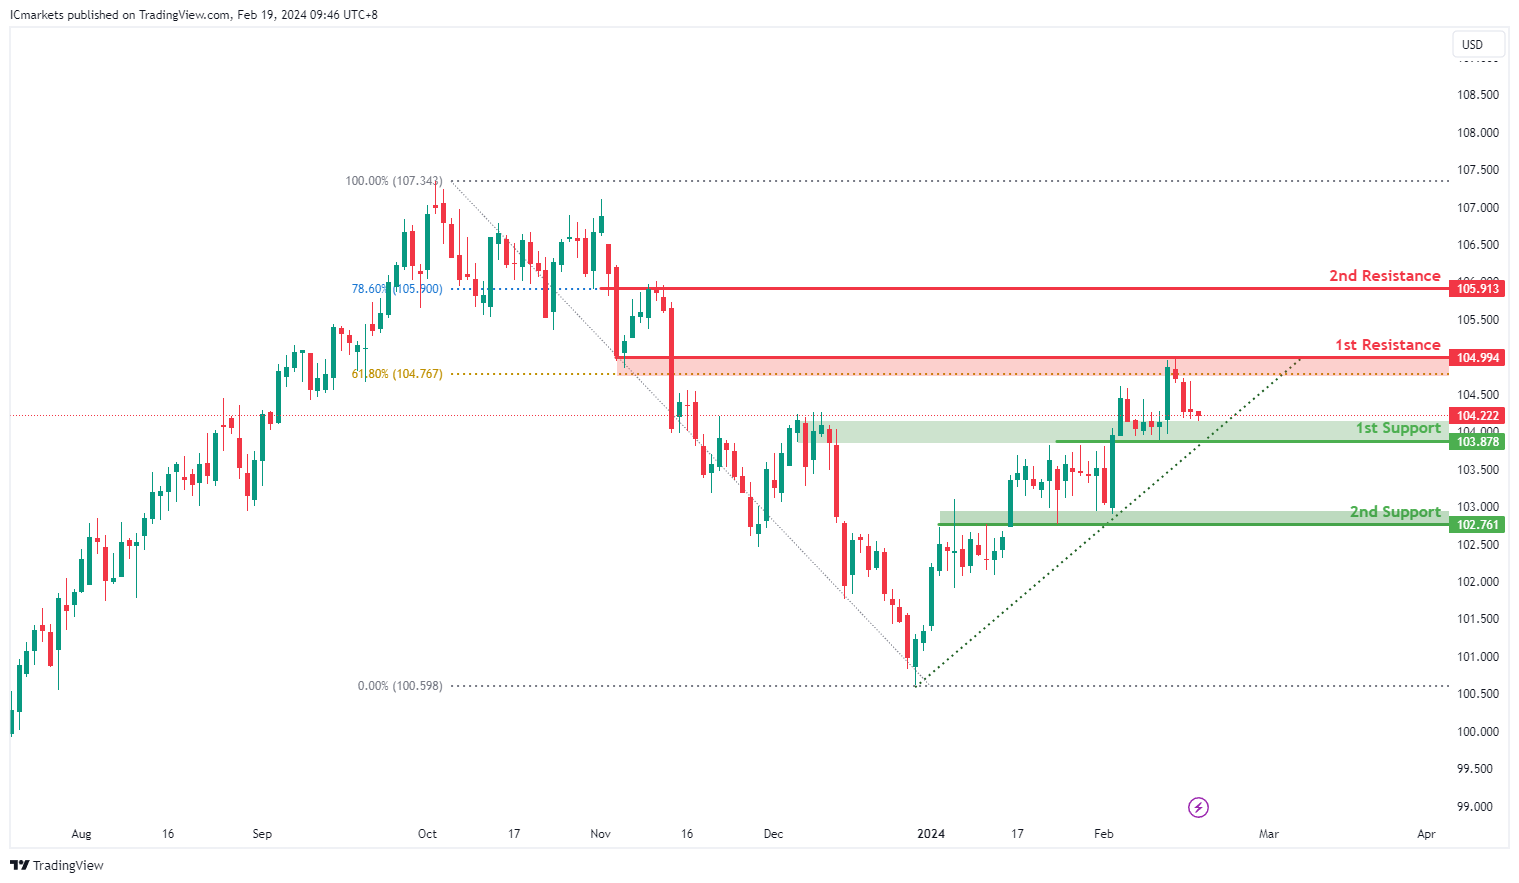
DXY:
The current momentum of DXY is bullish, supported by several factors, including its position above a major ascending trend line, indicating potential for further upward movement.
There’s a possibility of a bullish bounce off the 1st support level, leading to a move towards the 1st resistance level.
The 1st support level is identified at 103.87, characterized as an overlap support, suggesting a historical significance where buying interest may emerge, particularly considering the presence of the ascending trend line.
Additionally, the 2nd support level lies at 102.76, also considered an overlap support, further reinforcing its significance as a potential area where buyers may enter the market, should the price decline.
On the resistance side, the 1st resistance level stands at 104.99, identified as an overlap resistance, and coinciding with the 61.80% Fibonacci Retracement level. This suggests a potential barrier where selling pressure may increase temporarily.
Furthermore, there is a 2nd resistance level at 105.91, also identified as an overlap resistance, with the 78.60% Fibonacci Retracement level indicating another area where selling pressure may intensify, potentially leading to a pullback in price.
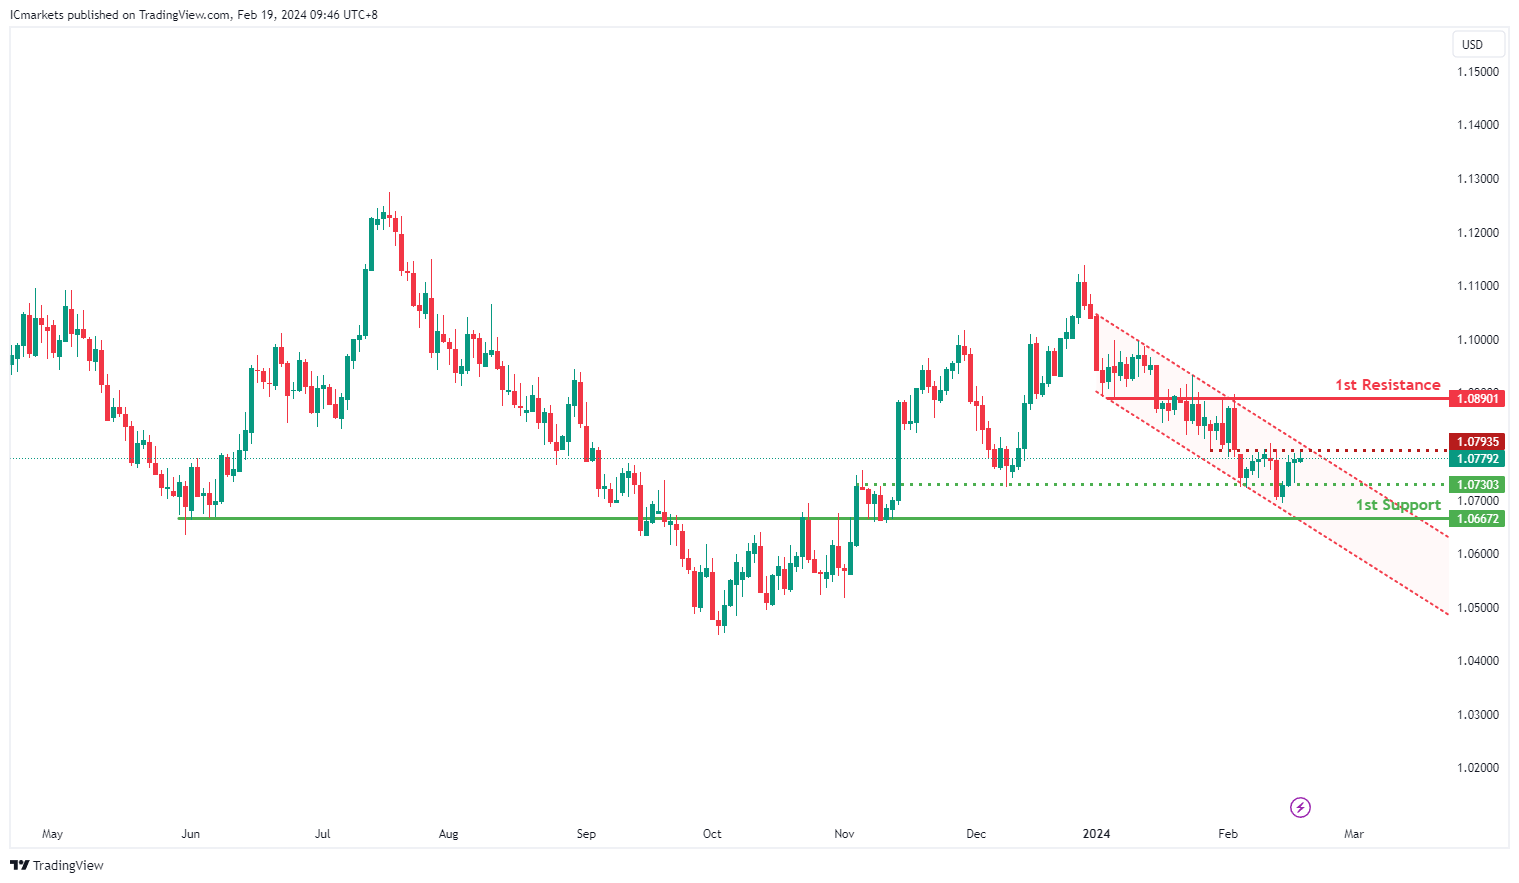
EUR/USD:
The current momentum of EUR/USD is bearish, as indicated by its position within a bearish descending channel.
There’s a potential for a continuation of this bearish momentum towards the 1st support level.
The 1st support level is identified at 1.0667, characterized as an overlap support, suggesting a historical significance where buying interest may emerge, potentially halting the downward movement temporarily.
Additionally, an intermediate support level is noted at 1.073, also considered an overlap support. This further reinforces the potential significance of this area as a level where buyers may enter the market.
On the resistance side, the 1st resistance level stands at 1.0890, identified as an overlap resistance. This level may act as a barrier where selling pressure could increase, potentially leading to a pause or reversal in the downward movement.
Furthermore, there is an Intermediate resistance at 1.0793, also identified as an overlap resistance. This level may serve as another area where selling pressure could intensify, potentially reinforcing the bearish bias in the short term.
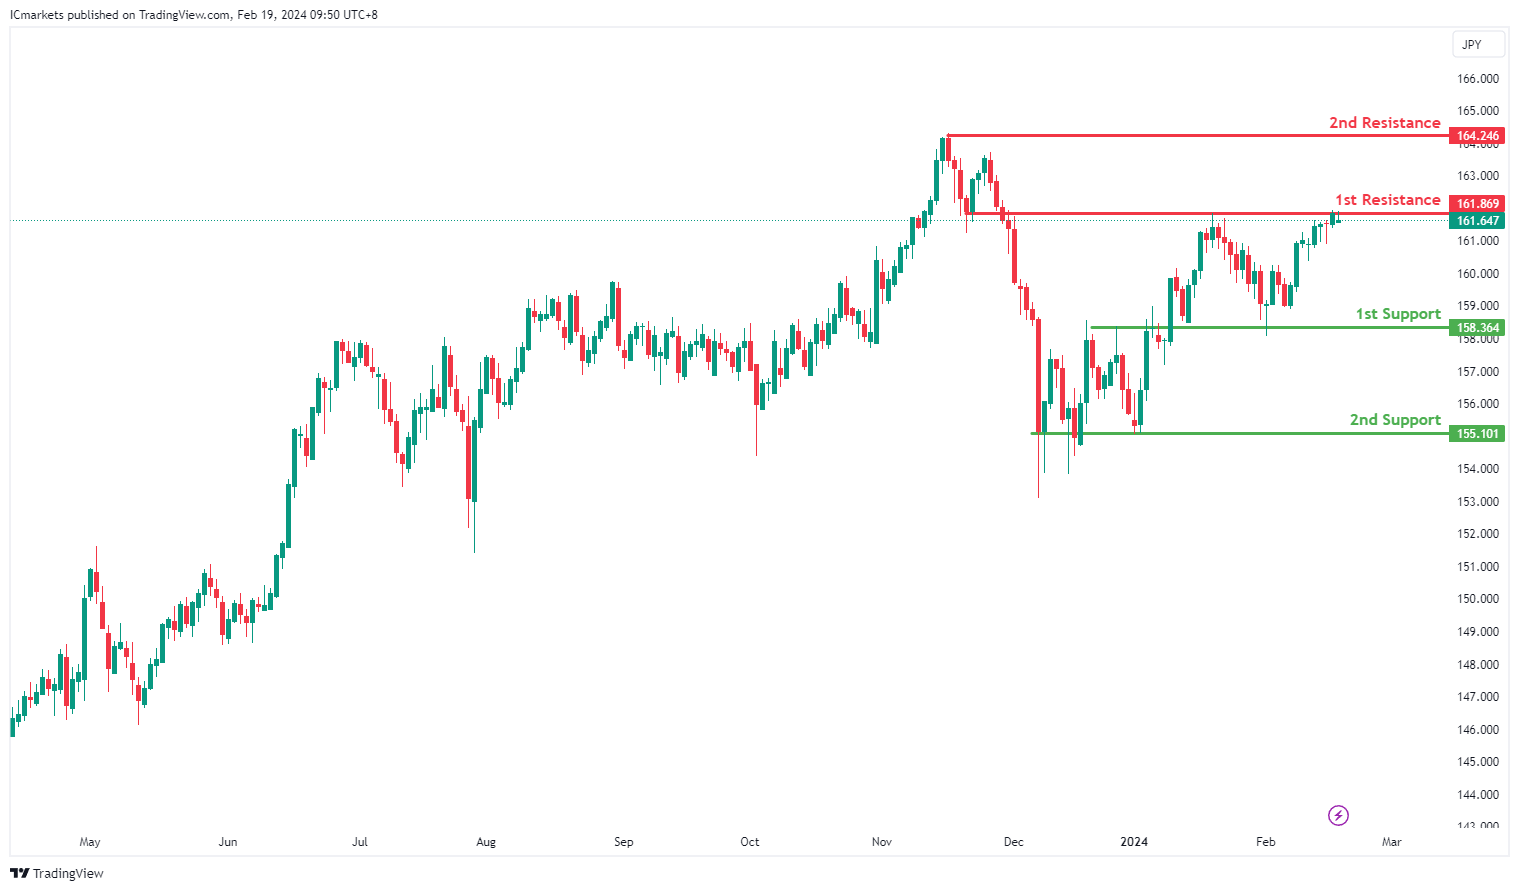
EUR/JPY:
The EUR/JPY chart currently demonstrates a bearish overall momentum, indicating a prevailing downward trend. Several factors contribute to this bearish sentiment, suggesting the potential for further downward movement in price.
The 1st support level at 158.364 is significant as it aligns with an overlap support. This level represents a historical point where buying interest has previously emerged, potentially acting as a level of support.
Additionally, the 2nd support level at 155.101 corresponds to a multi-swing low support, further reinforcing its significance as a potential support zone. This level indicates a historical area where buyers have shown considerable interest in supporting the price, adding to its credibility as a support level.
On the resistance side, the 1st resistance level at 161.869 aligns with an overlap resistance. This level represents a historical point where selling pressure has been strong, potentially acting as a barrier to further upward movement.
Further up, the 2nd resistance level at 164.246 corresponds to a swing high resistance. This level represents a significant historical point where selling pressure has overwhelmed buying interest, suggesting its importance as a resistance level.
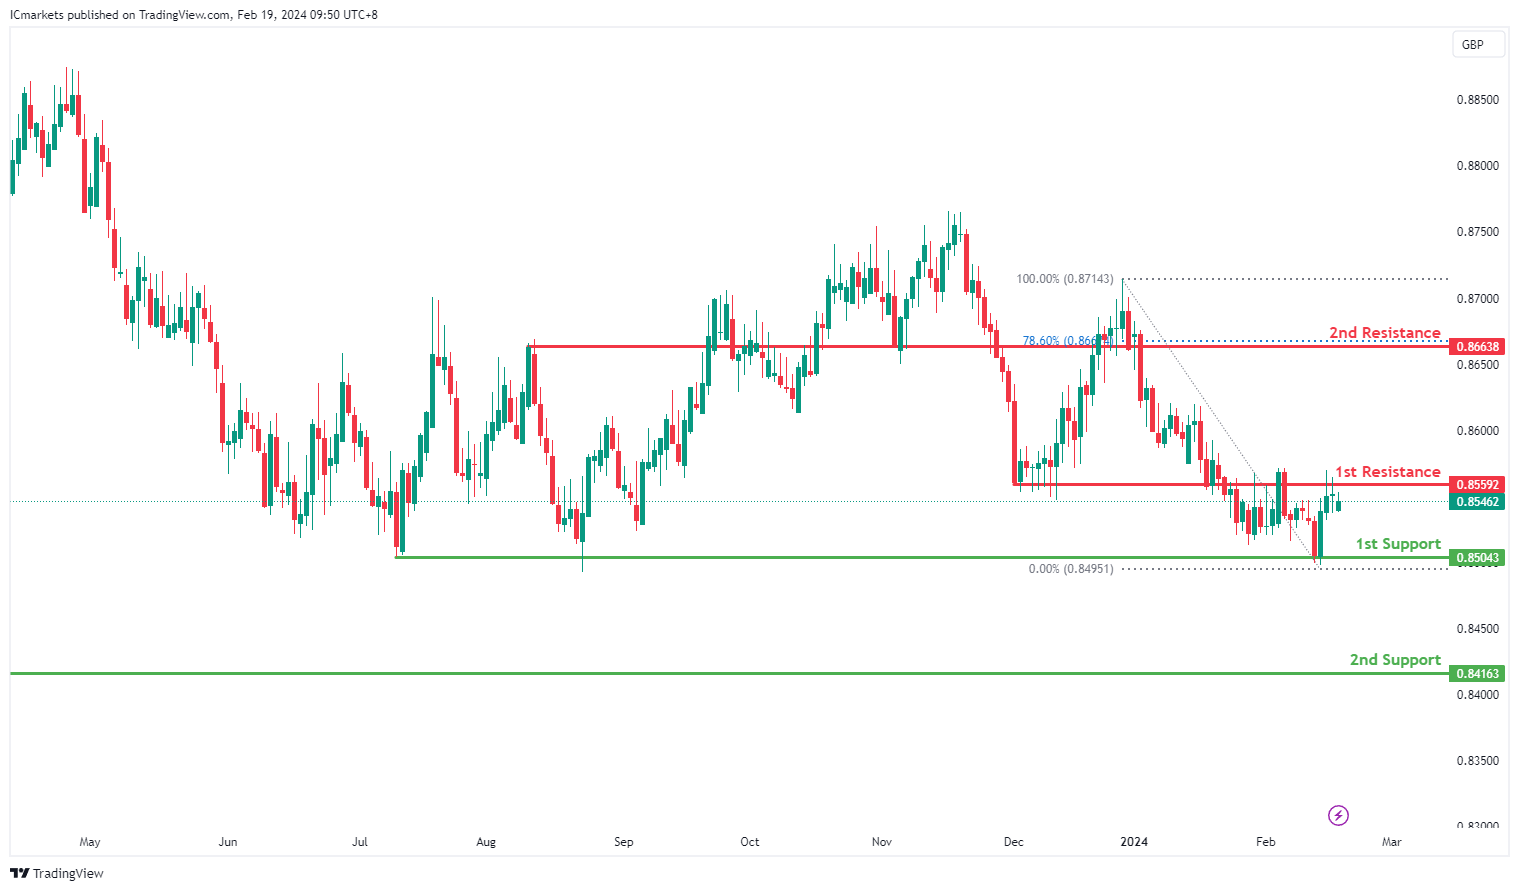
EUR/GBP:
The EUR/GBP chart currently exhibits a bullish overall momentum, indicating a prevailing upward trend. Several factors contribute to this bullish sentiment, supporting the potential for a continued upward movement in price.
The 1st support level at 0.85043 is considered significant as it represents a multi-swing low support. This level suggests a historical area where buying interest has previously emerged, potentially providing a strong foundation for further upward movement.
Furthermore, the 2nd support level at 0.84163 corresponds to a swing low support, further reinforcing its importance as a potential support zone. This level indicates another historical point where buyers have shown interest in supporting the price.
On the resistance side, the 1st resistance level at 0.85592 aligns with an overlap resistance. This level represents a historical point where selling pressure may increase, potentially acting as a barrier to further upward movement.
Additionally, the 2nd resistance level at 0.86638 corresponds to an overlap resistance and the 78.60% Fibonacci Retracement. This convergence of resistance factors adds to its significance as a potential barrier to upward movement.
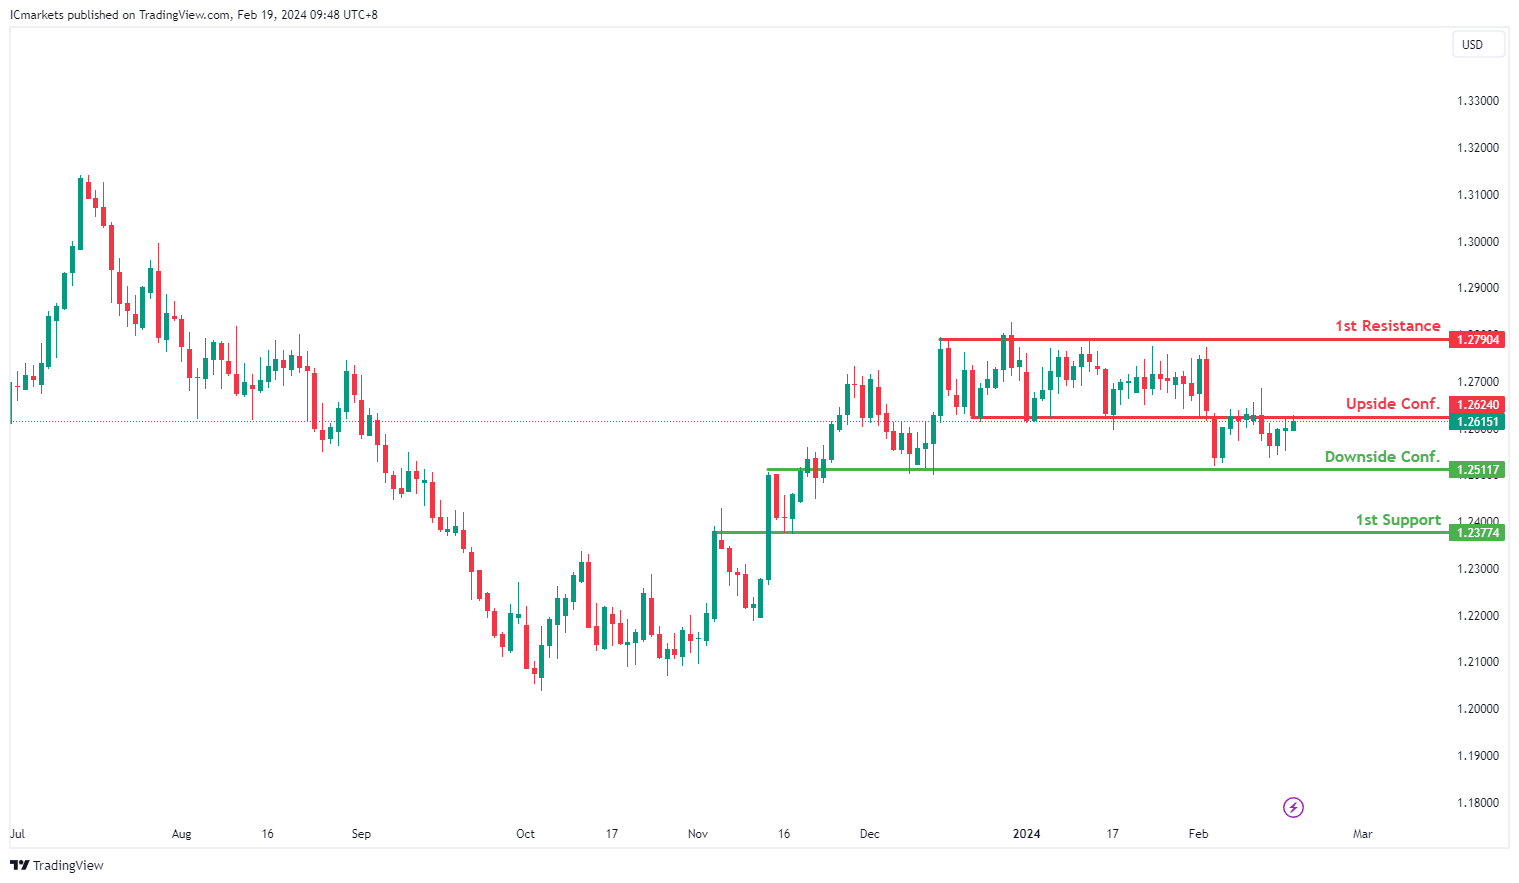
GBP/USD:
The current momentum of GBP/USD is assessed as neutral, suggesting a lack of clear directional bias.
There’s a potential scenario where the price could oscillate between the 1st resistance and 1st support levels, indicating a range-bound movement.
The 1st support level is identified at 1.2377, characterized as an overlap support. This level may attract buying interest, potentially leading to a bounce in price if reached.
Confirmation of downside movement is noted at 1.2511, also identified as an overlap support. This level serves as a point where downward momentum may strengthen, potentially pushing the price lower.
On the resistance side, the 1st resistance level stands at 1.2790, identified as an overlap resistance. This level may act as a barrier where selling pressure could increase, potentially causing a pullback in price if approached.
Confirmation of upside movement is noted at 1.2624, also identified as an overlap resistance. This level serves as a point where upward momentum may strengthen, potentially pushing the price higher.
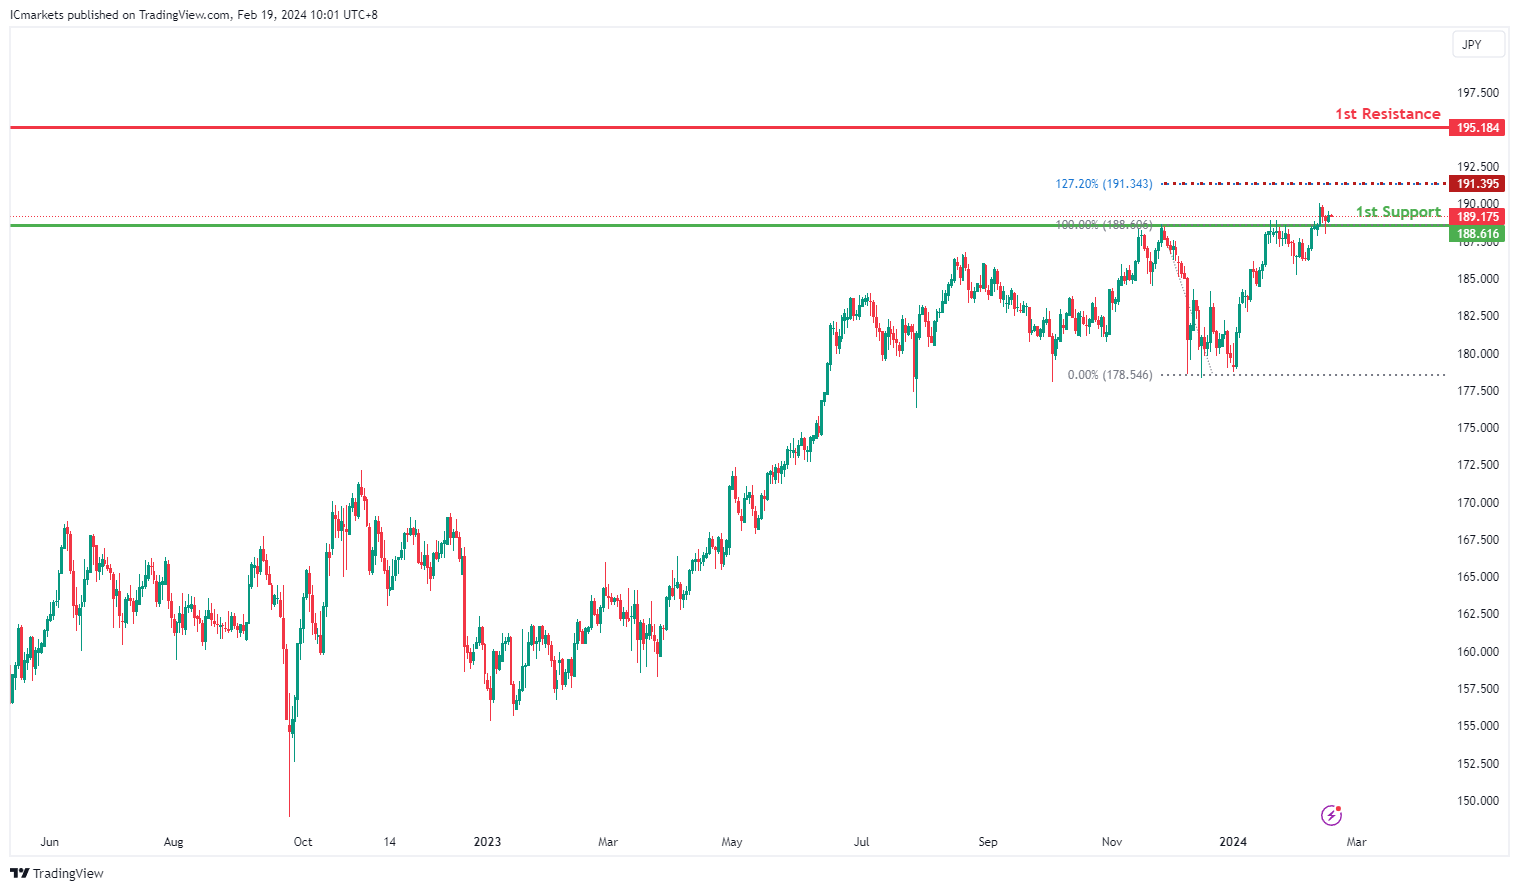
GBP/JPY:
The GBP/JPY chart currently exhibits a bullish overall momentum, indicating a prevailing upward trend. Despite this bullish sentiment, there is a potential short-term scenario suggesting a drop to the 1st support level before bouncing back towards the 1st resistance.
The 1st support level at 188.616 is identified as an overlap support, indicating a historical area where buying interest has emerged, potentially providing a level of support for the price in the short term.
As for the 2nd support level, it’s not provided. However, traders may look for additional levels of support or confirmations in the price action to identify potential areas where buying interest could emerge.
On the resistance side, the 1st resistance level at 195.184 aligns with a multi-swing high resistance. This level suggests a historical point where selling pressure has been strong and could act as a barrier to further upward movement.
An intermediate resistance level at 191.395 is also identified, which aligns with a swing high resistance and the 127.20% Fibonacci Retracement. This level adds to the significance of the resistance structure.
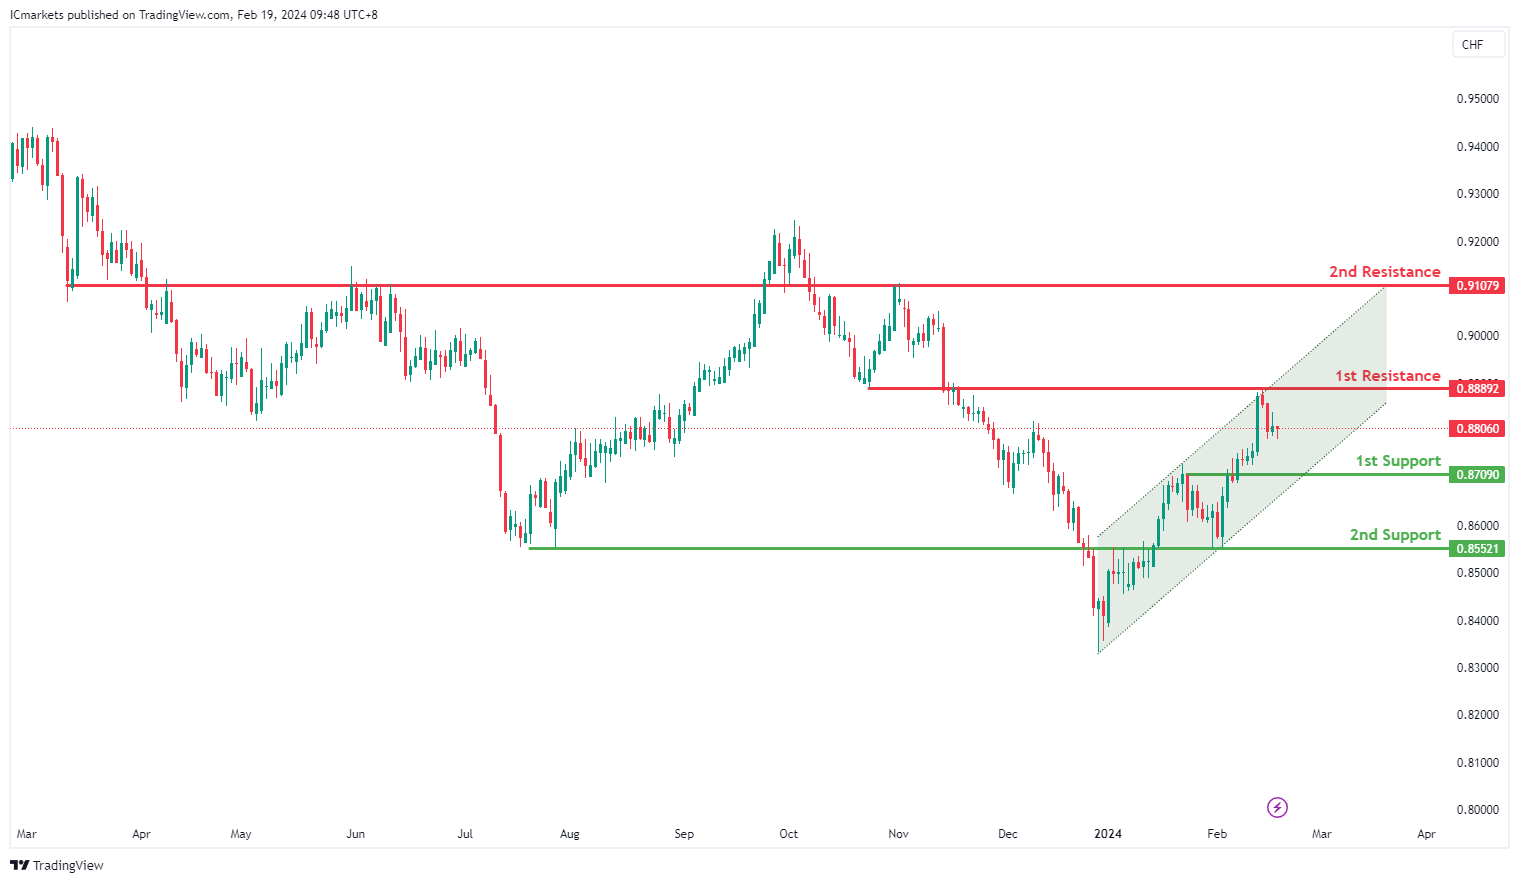
USD/CHF:
The current momentum of USD/CHF is evaluated as bullish, with factors contributing to this momentum being the presence of a bullish ascending channel.
A potential scenario for price movement is a bullish bounce off the 1st support level, followed by a move towards the 1st resistance level.
The 1st support level is identified at 0.8709, characterized as a pullback support within the bullish ascending channel. This level may attract buying interest, potentially leading to a bounce in price if reached.
Additionally, the 2nd support level is noted at 0.8552, identified as an overlap support. This level provides further reinforcement for potential buying interest and serves as an additional area where price may find support.
On the resistance side, the 1st resistance level stands at 0.8889, identified as an overlap resistance. This level may act as a barrier where selling pressure could increase, potentially causing a pullback in price if approached.
Furthermore, the 2nd resistance level is observed at 0.9107, also identified as an overlap resistance.
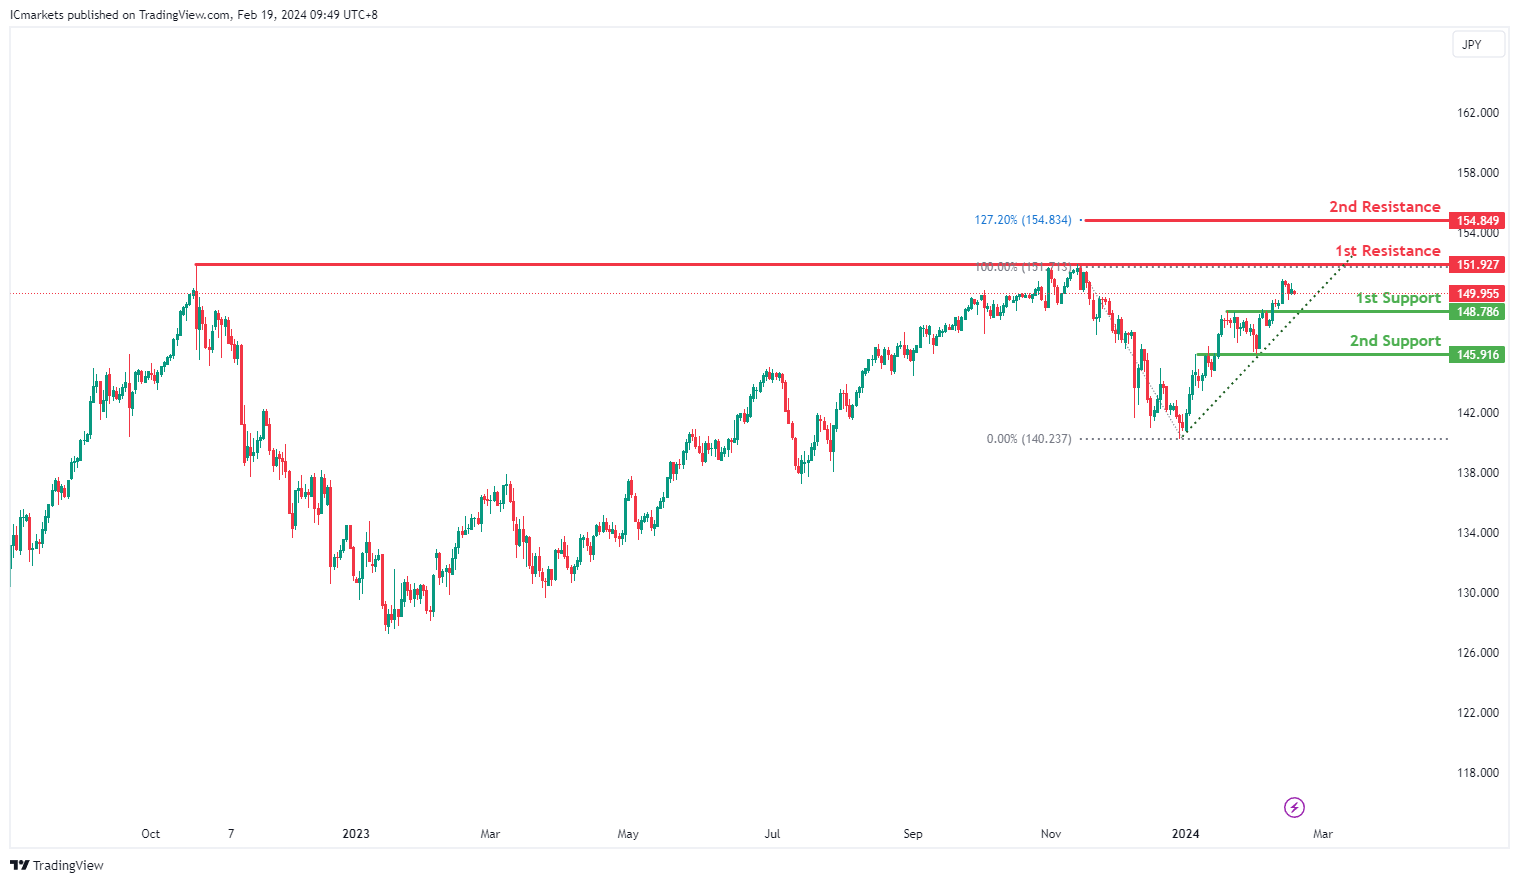
USD/JPY:
The current momentum of USD/JPY is assessed as bullish, with factors contributing to this momentum including the presence of a major ascending trend line, suggesting further bullish potential.
A potential scenario for price movement is a bullish bounce off the 1st support level, followed by a move towards the 1st resistance level.
The 1st support level is identified at 148.78, characterized as an overlap support. This level may attract buying interest, especially considering the bullish momentum indicated by the ascending trend line.
Additionally, the 2nd support level is noted at 145.91, also identified as an overlap support. This level provides further reinforcement for potential buying interest and serves as an additional area where price may find support.
On the resistance side, the 1st resistance level stands at 151.92, identified as a multi-swing high resistance. This level may act as a barrier where selling pressure could increase, potentially causing a pause or reversal in the bullish trend if approached.
Furthermore, the 2nd resistance level is observed at 154.84, noted as the 127.20% Fibonacci Extension level. This level provides additional resistance and could be a target for bullish traders aiming for further upside movement.
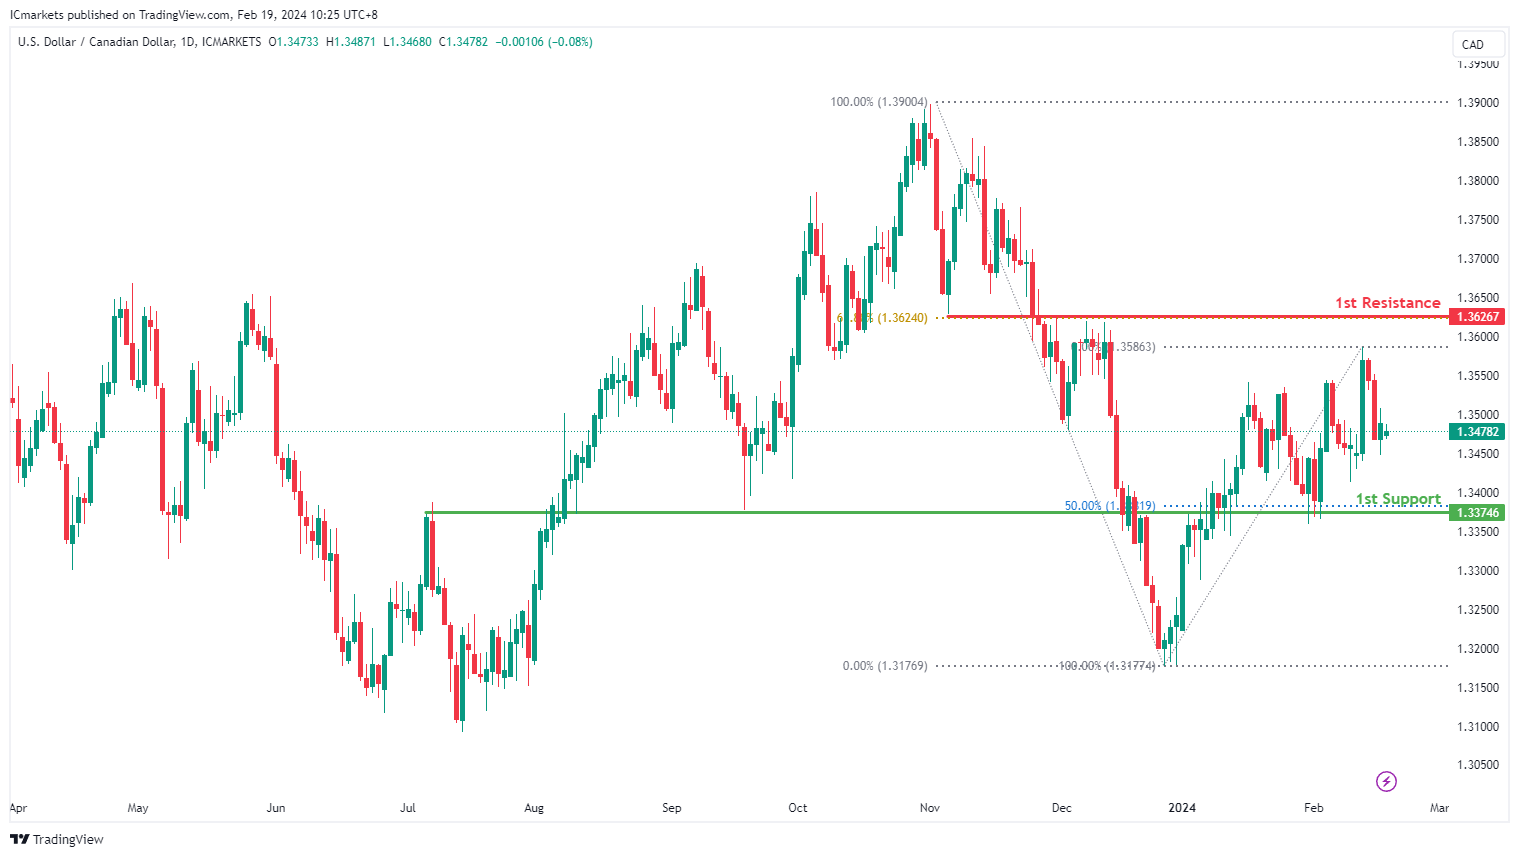
USD/CAD:
The USD/CAD chart currently exhibits an overall bearish momentum. In this context, there is a potential scenario for price to resume the bearish momentum and fall towards the 1st support.
The 1st support level at 1.3374 is identified as an overlap support that aligns close to the 50.00% Fibonacci Retracement level, further emphasizing its importance as a potential support zone.
To the upside, the 1st resistance level at 1.3626 is identified as an overlap resistance that aligns with the 61.80% Fibonacci Retracement level, further highlighting its importance as a potential resistance point.
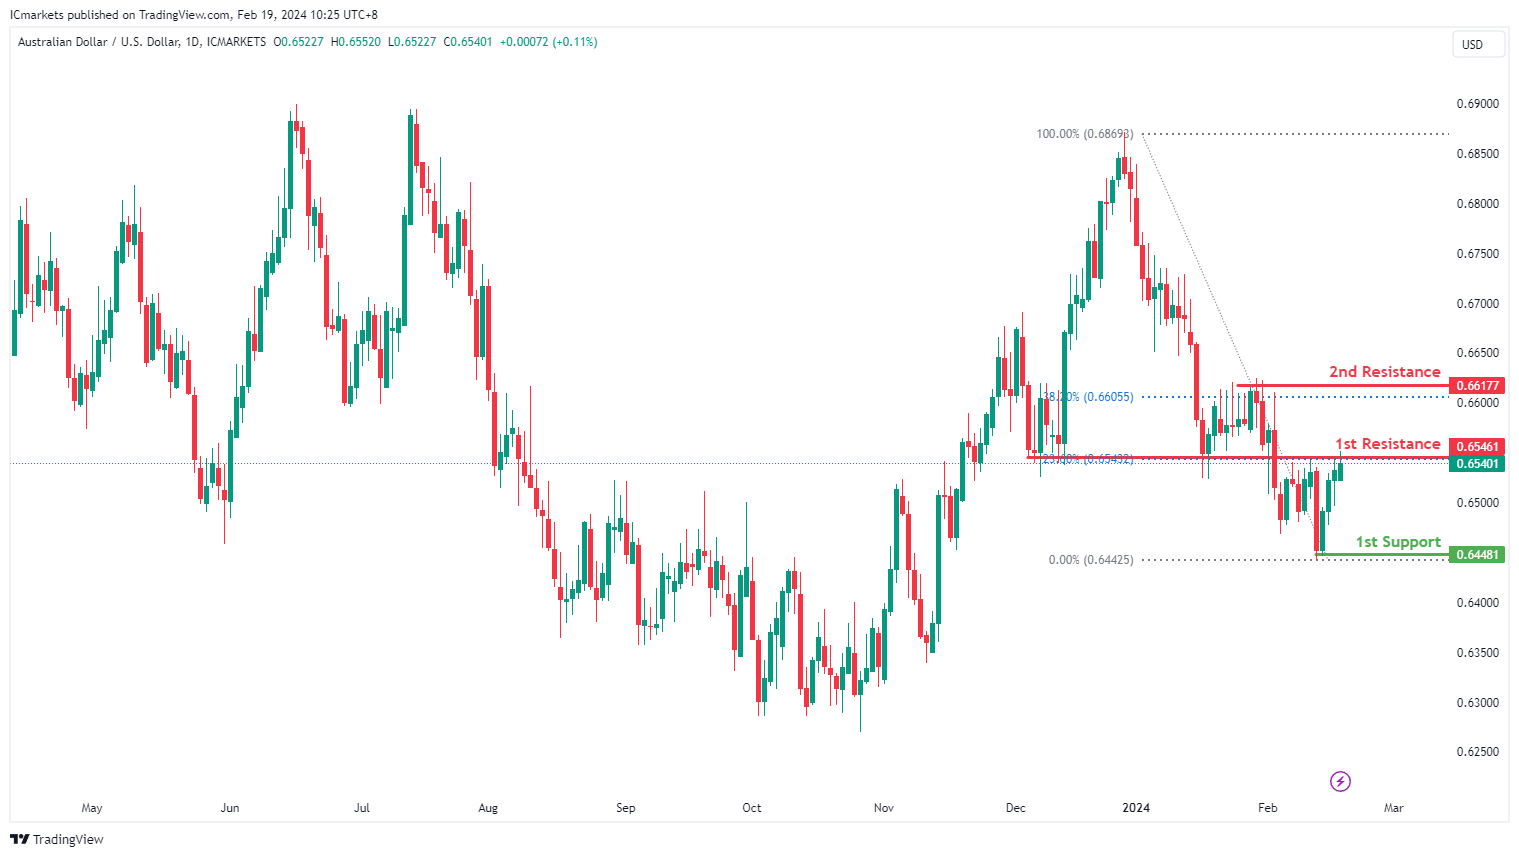
AUD/USD:
The AUD/USD chart currently exhibits a neutral bias. In this context, there is a potential scenario for price to fluctuate between the 1st resistance and the 1st support.
The 1st resistance level at 0.6546 is identified as an overlap resistance that aligns with the 23.60% Fibonacci Retracement level. Higher up, the 2nd resistance level at 0.6617 is marked as a pullback resistance that aligns with the 38.20% Fibonacci Retracement level, further highlighting its importance as a potential resistance point.
To the downside, the 1st support level at 0.6448 is identified as pullback support, further emphasizing its importance as a potential support zone.
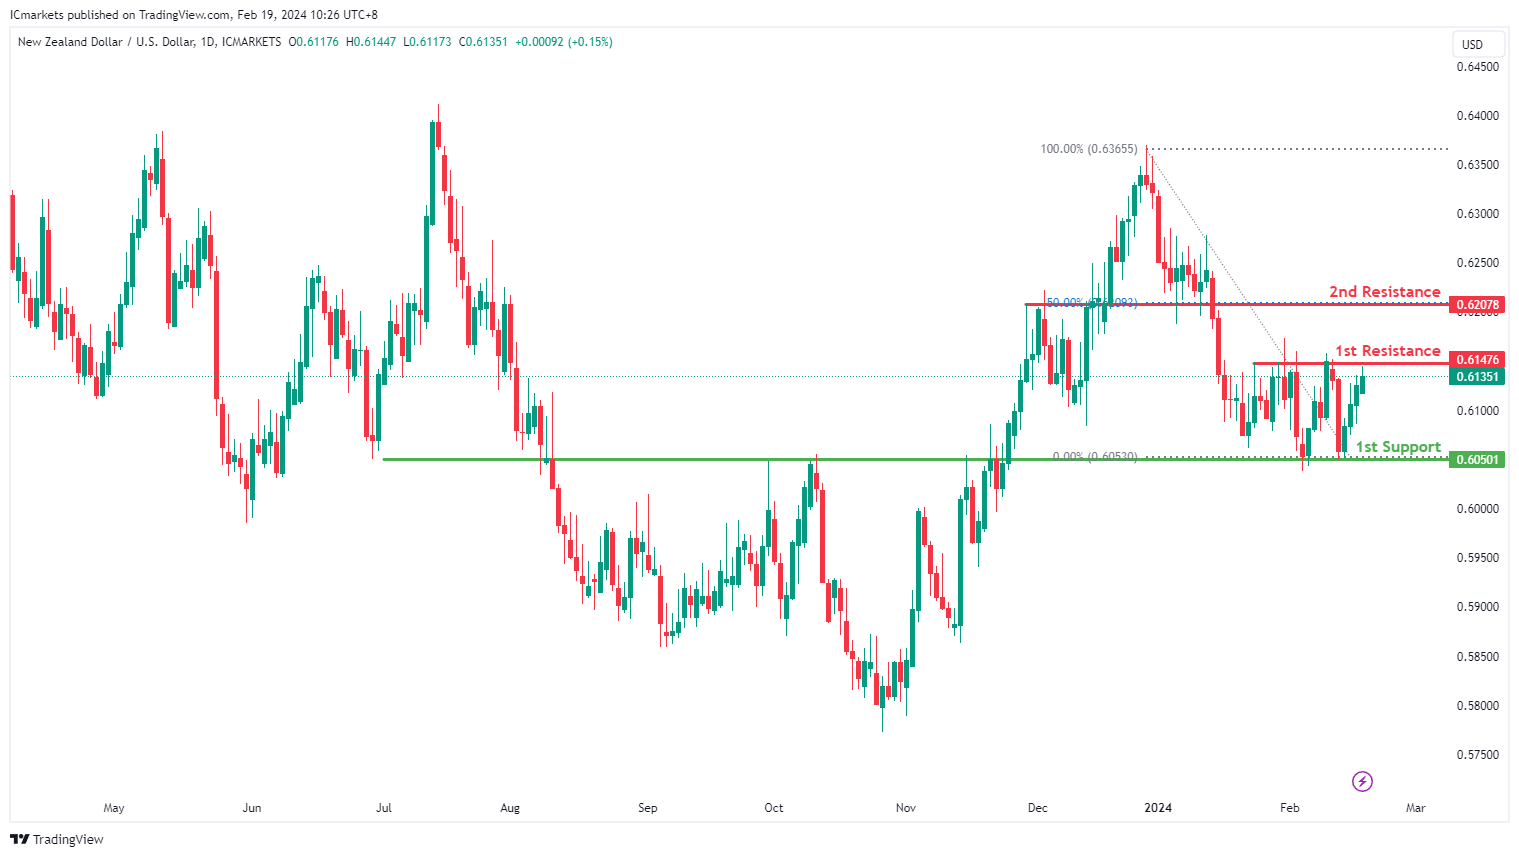
NZD/USD
The NZD/USD chart currently exhibits a neutral bias. In this context, there is a potential scenario for price to fluctuate between the 1st resistance and the 1st support.
The 1st resistance level at 0.6147 is identified as a pullback resistance. Higher up, the 2nd resistance level at 0.6207 is marked as an overlap resistance that aligns with the 50.00% Fibonacci Retracement level, further highlighting its importance as a potential resistance point.
To the downside, the 1st support level at 0.6050 is identified as an overlap support, further emphasizing its importance as a potential support zone.
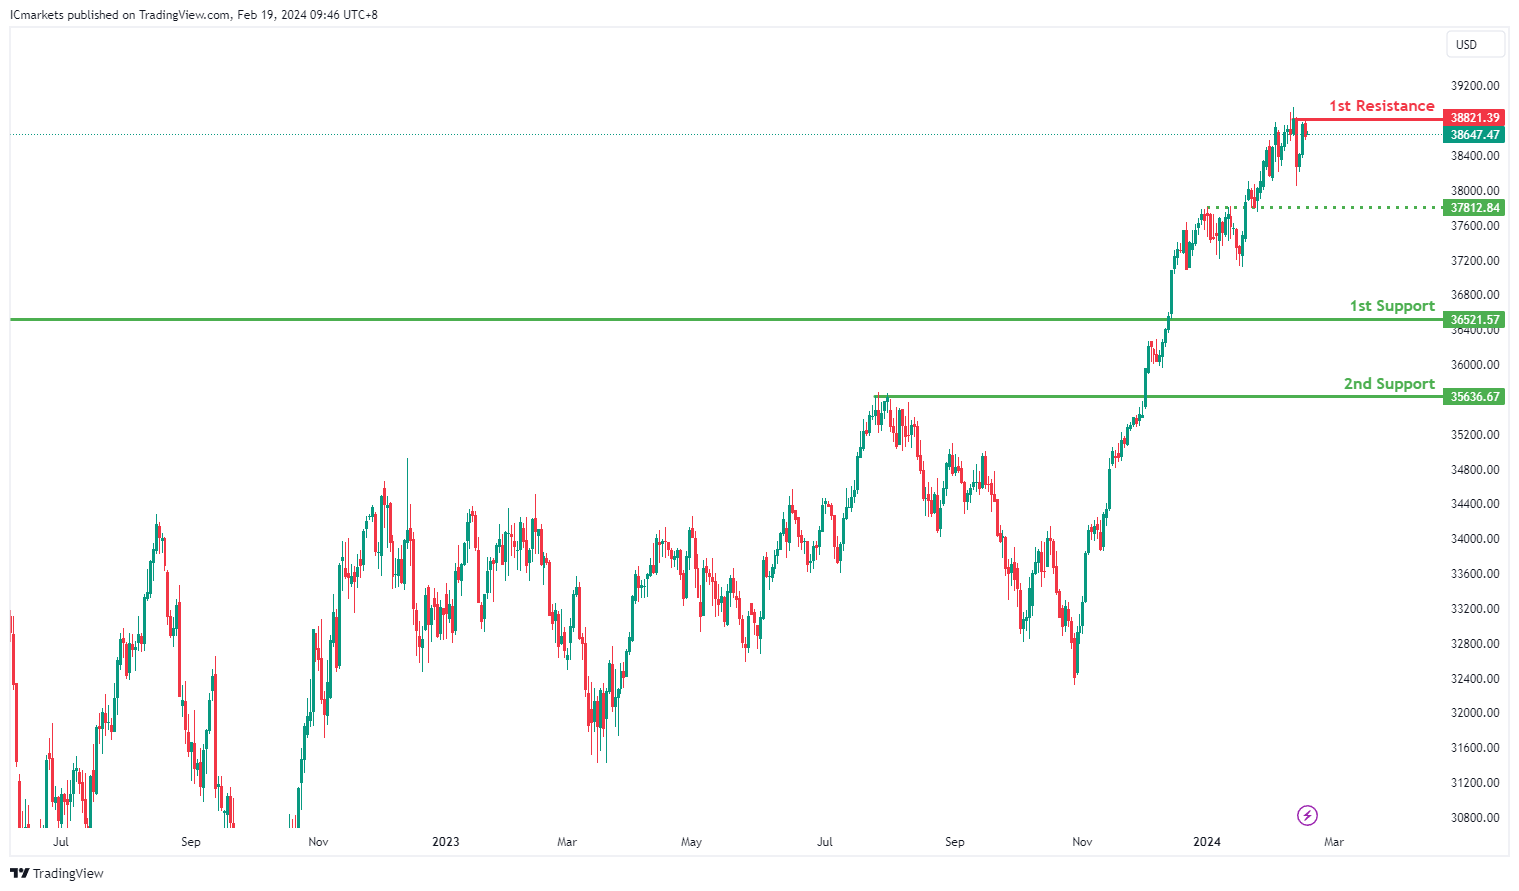
DJ30:
The DJ30 chart currently shows a bearish overall momentum, indicating a prevailing downward trend. However, there is a potential short-term scenario suggesting a rise towards the 1st resistance before reversing downwards towards the 1st support.
The 1st support level at 36521.57 is identified as a pullback support, indicating a historical level where buying interest has emerged during pullback phases. This level may act as a support zone for the price in the short term.
The 2nd support level at 35636.67 also serves as a pullback support, reinforcing its significance as a potential area where buyers could step in to support the price.
On the resistance side, the 1st resistance level at 38821.39 aligns with a swing high resistance. This level suggests a historical point where selling pressure has been strong and could act as a barrier to further upward movement.
Additionally, an intermediate support level at 37812.84 is identified, which aligns with an overlap support, providing further reinforcement to the support structure.
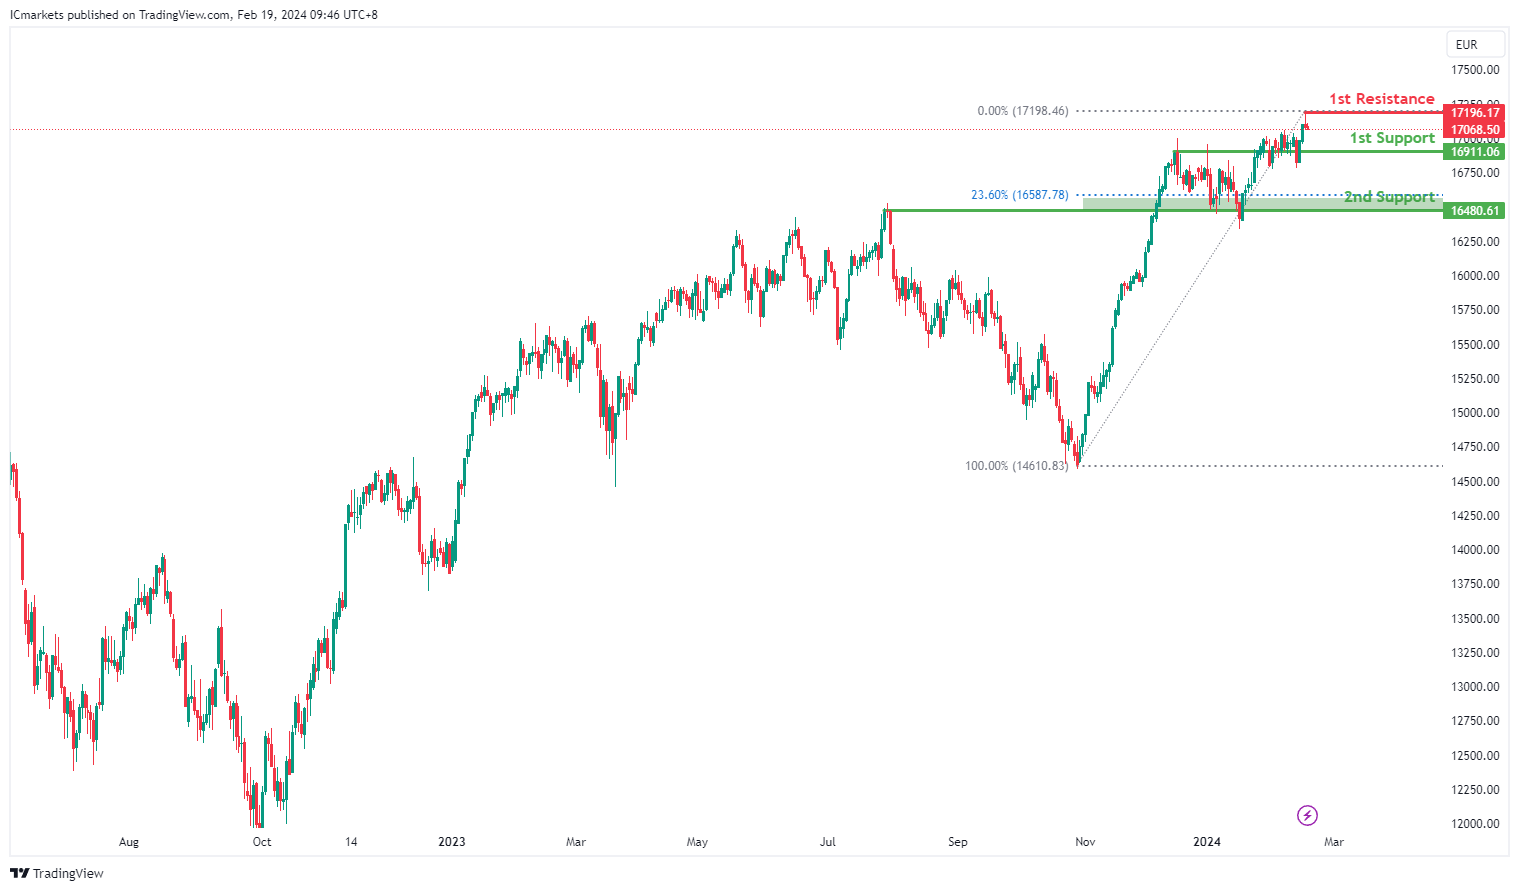
GER40:
The GER40 chart reflects a bearish overall momentum, indicating a prevalent downward trend. Several factors contribute to this bearish sentiment, suggesting a potential continuation of the downward movement towards the 1st support level.
The 1st support level at 16911.1 is significant as it aligns with an overlap support, indicating a historical level where buying interest has previously emerged. This level may serve as a strong support zone where buyers could potentially step in to support the price.
Furthermore, the 2nd support level at 16480.6 corresponds to both an overlap support and the 23.60% Fibonacci Retracement level, adding further significance to this support area. The convergence of these support factors strengthens the potential for this level to act as a support barrier.
On the resistance side, the 1st resistance level at 17196.2 aligns with a swing high resistance. This level represents a historical point where selling pressure has been notable and could act as a barrier to further upward movement.
US500:
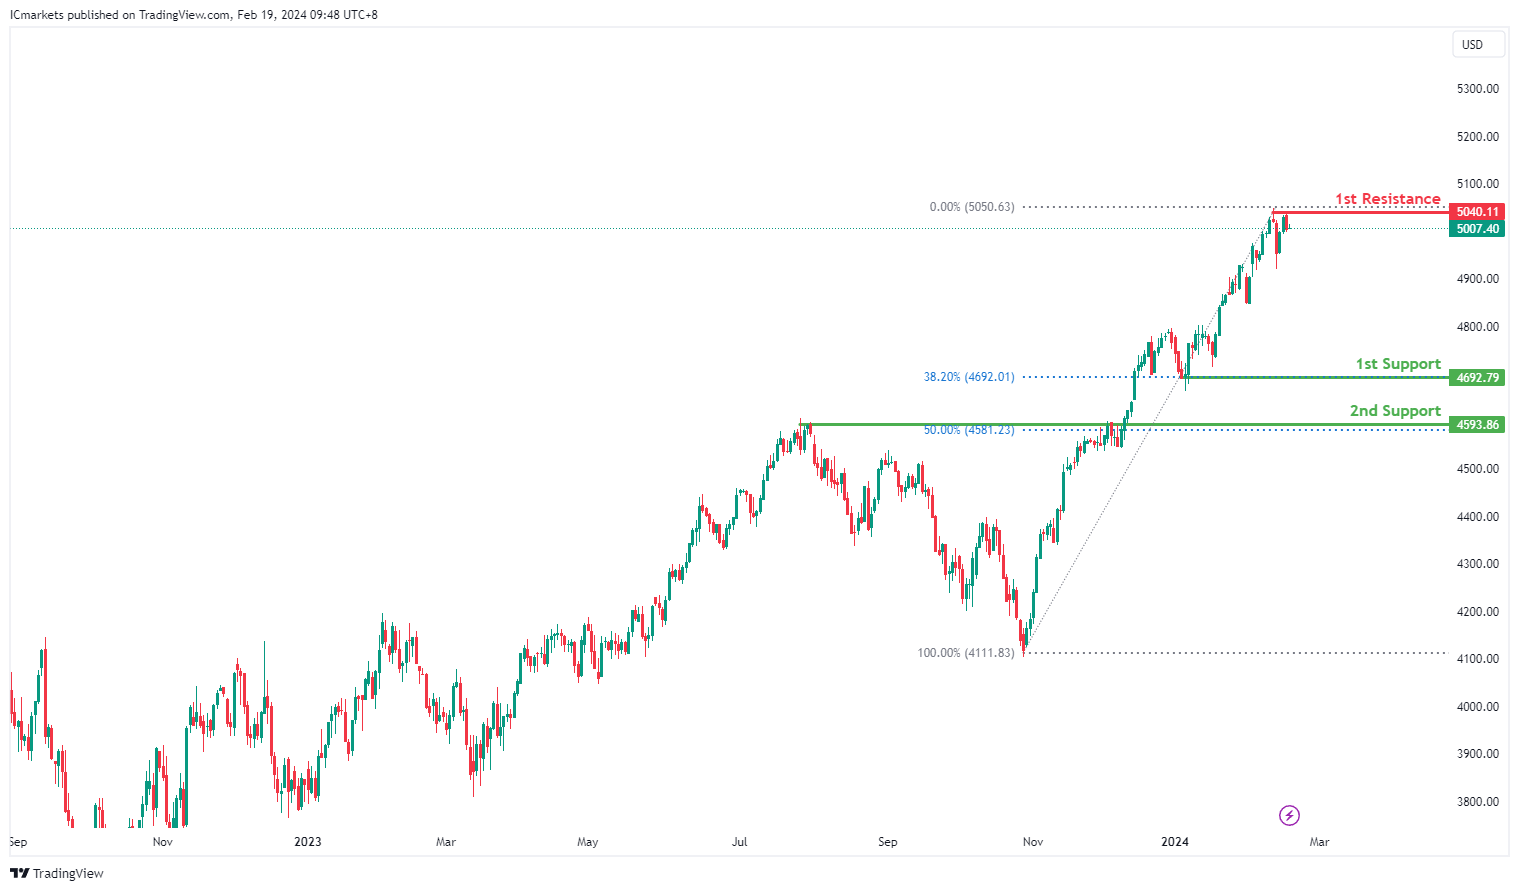
The US500 chart currently indicates a bullish overall momentum, suggesting a prevailing upward trend. Several factors contribute to this bullish sentiment, supporting the potential for a continued upward movement towards the 1st resistance level.
The 1st support level at 4692.79 aligns with both a swing low support and the 38.20% Fibonacci Retracement level. This confluence of support factors indicates a significant historical level where buying interest has emerged, potentially providing a strong foundation for further upward movement.
Additionally, the 2nd support level at 4593.86 corresponds to an overlap support and the 50% Fibonacci Retracement level, adding further significance to this support zone. This reinforces the potential for a bounce from this level, as it represents a historical area of support.
On the resistance side, the 1st resistance level at 5040.11 aligns with a swing high resistance. This level suggests a historical point where selling pressure has been notable and could act as a barrier to further upward movement.
BTC/USD:
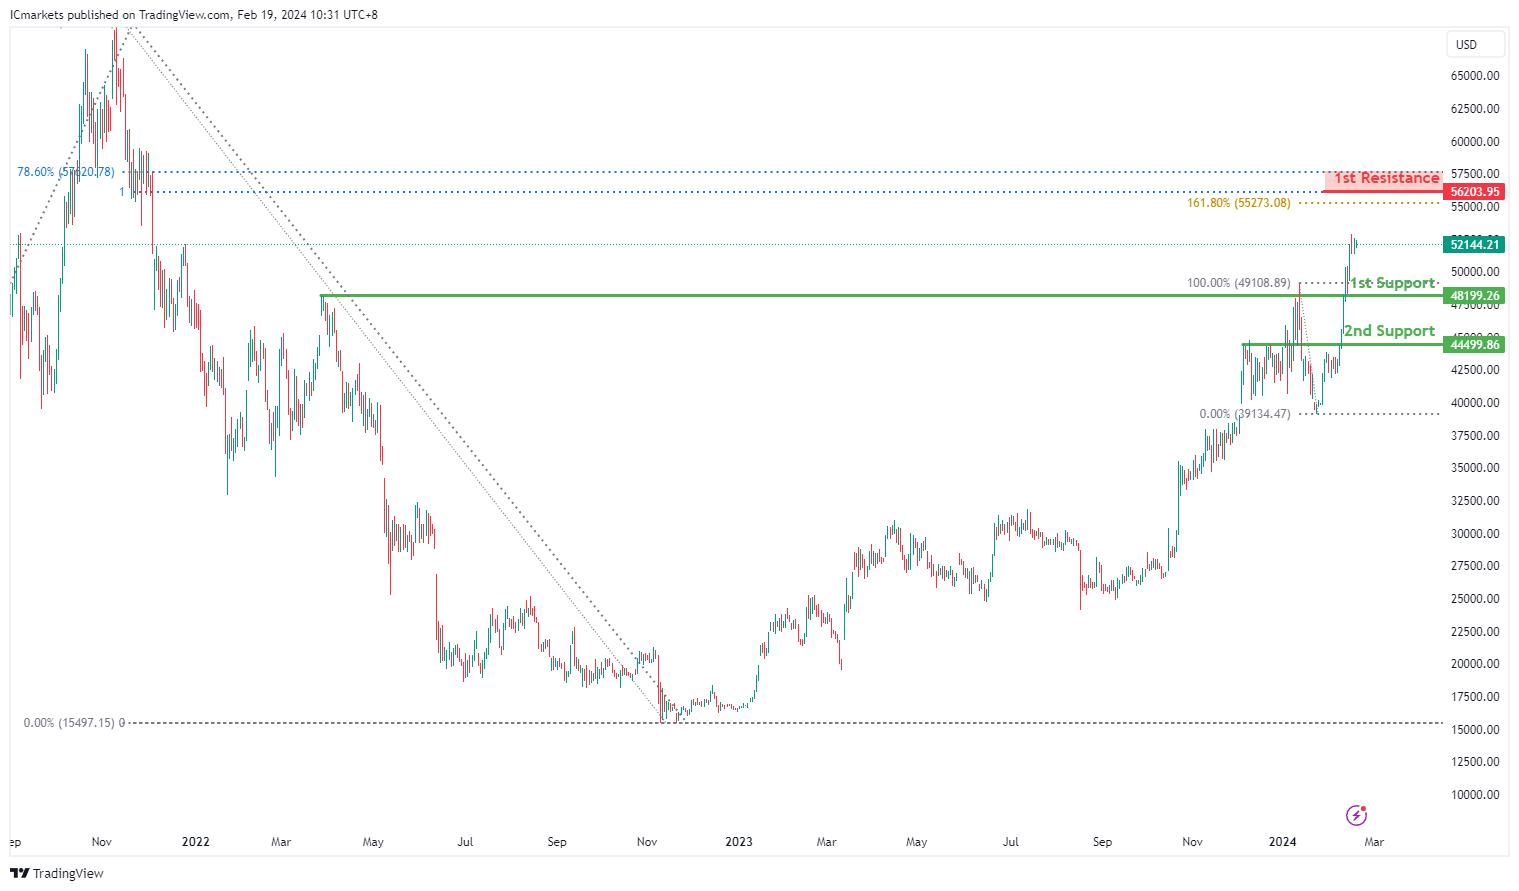
The BTC/USD chart currently maintains a bullish overall momentum, indicating a prevailing upward trend. Several factors contribute to this bullish sentiment, supporting the potential for a bounce from the 1st support level and a subsequent rise towards the 1st resistance level.
The 1st support level at 48199.26 is significant as it represents a pullback support. This level indicates a historical point where buying interest has emerged, suggesting a strong level of support that could potentially halt further downward movement in the short term.
Additionally, the 2nd support level at 44499.86 corresponds to an overlap support, further reinforcing its importance as a potential support zone. This level adds another layer of historical significance, indicating a key area where buyers have previously intervened.
On the resistance side, the 1st resistance level at 56203.95 is identified as it aligns with a swing high resistance, the 78.60% Fibonacci Retracement, and the 100% Fibonacci Projection. These multiple technical factors converge to make this resistance level significant, suggesting a point where selling pressure may increase, potentially leading to a reversal or temporary halt in upward movement.
ETH/USD:
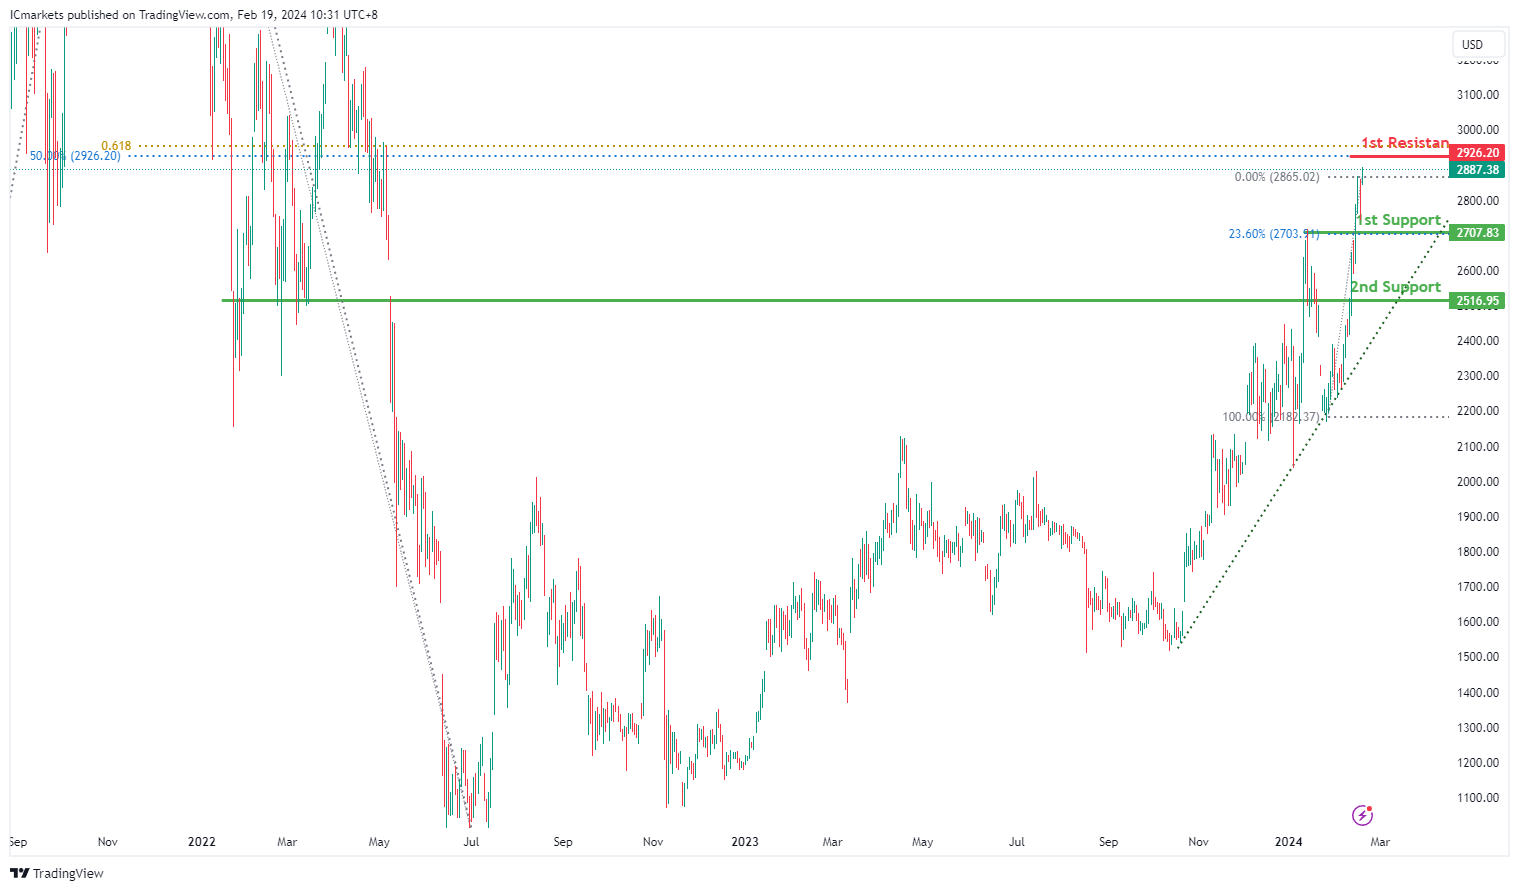
The ETH/USD chart currently demonstrates a bullish overall momentum; it is above the ascending trend line, indicating a prevailing upward trend. Several factors contribute to this bullish sentiment, supporting the potential for a continued upward movement towards the 1st resistance level.
The 1st support level at 2707.83 is significant as it aligns with both a pullback support and the 23.60% Fibonacci Retracement level. This convergence of support factors suggests a strong level where buying interest has historically emerged, potentially providing a solid foundation for further upward movement.
Furthermore, the 2nd support level at 2516.95 corresponds to an overlap support, further reinforcing its importance as a potential support zone. This level indicates a significant historical level where buyers have previously intervened to support the price.
On the resistance side, the 1st resistance level at 2926.20 is identified as it aligns with the 50% Fibonacci Retracement level and the 61.80% Fibonacci Projection. These Fibonacci levels often act as significant points of reversal or continuation, indicating potential areas where selling pressure may increase.
WTI/USD:
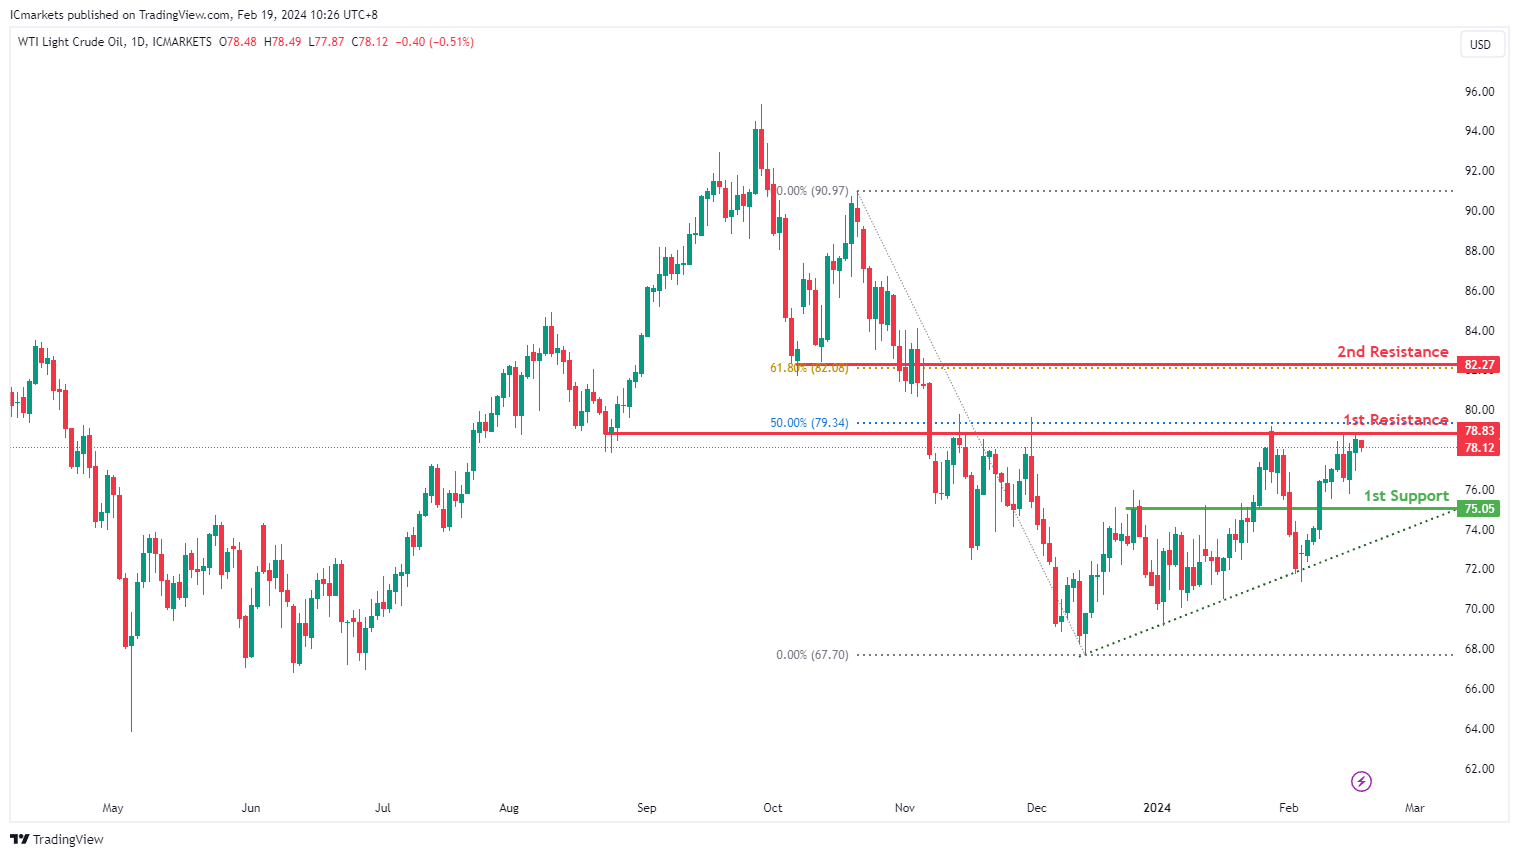
The WTI (West Texas Intermediate) chart currently exhibits an overall bullish momentum. However, there is a potential scenario for price to make a bearish reaction off the 1st resistance and drop towards the 1st support.
The 1st resistance level at 78.83 is identified as an overlap resistance that aligns close to the 50.00% Fibonacci Retracement level. Higher up, the 2nd resistance level at 82.27 is marked as a pullback resistance that aligns with the 61.80% Fibonacci Retracement level, further highlighting its importance as a potential resistance zone.
To the downside, the 1st support level at 75.05 is identified as a pullback, reinforcing its significance as a key support level.
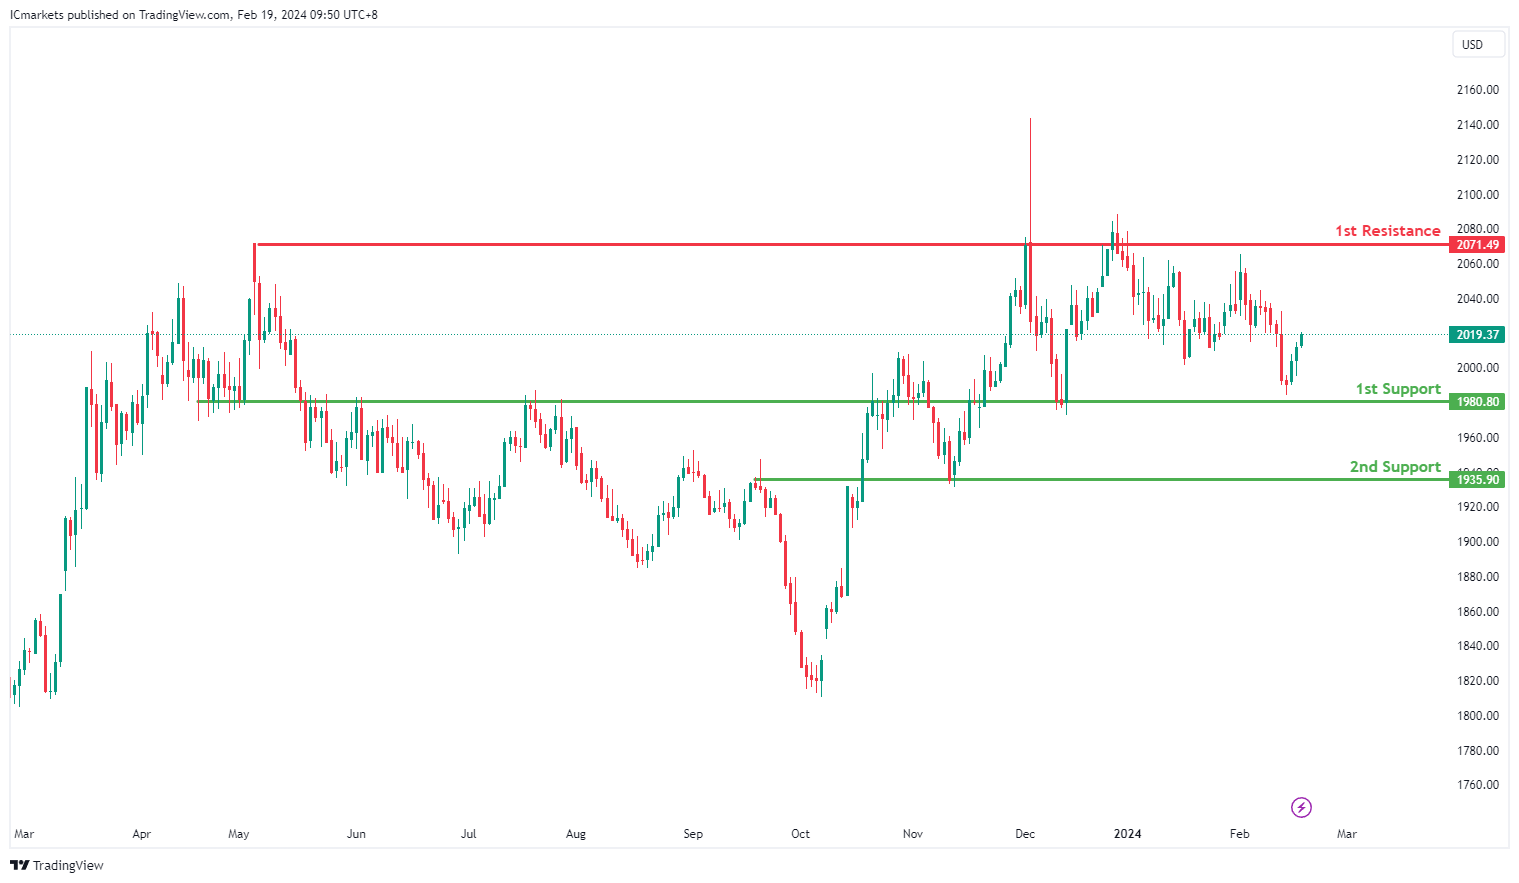
XAU/USD (GOLD):
The current momentum of XAUUSD is bearish, suggesting a potential downward movement in price.
There’s a possibility of a bearish reaction off the 1st resistance level, leading to a drop towards the 1st support level.
The 1st support level is identified at 1988.74, supported by its historical significance as a swing low, indicating potential buying interest in this area.
Additionally, the 2nd support level lies at 1976.56, which is considered a multi-swing low support, further strengthening its significance as a potential level where buyers may enter the market.
On the resistance side, the 1st resistance level stands at 2006.25, characterized as a pullback resistance, coinciding with the 38.20% Fibonacci Retracement level. This suggests a potential barrier where selling pressure may increase.
Furthermore, there is a 2nd resistance level at 2016.12, also identified as a pullback resistance, with the 61.80% Fibonacci Retracement level indicating another area where selling pressure may intensify, potentially leading to a bearish reaction.