Sample Category Title
EUR/USD Recovery Could Fade, Gold Eyes Fresh Increase
Key Highlights
- EUR/USD is attempting a recovery wave from the 1.0700 zone.
- A major bearish trend line is forming with resistance near 1.0810 on the 4-hour chart.
- Gold price is recovering higher from the $1,988 support zone.
- Bitcoin price is consolidating gains above the $50,500 support.
EUR/USD Technical Analysis
The Euro extended its decline below the 1.0750 level against the US Dollar. EUR/USD even spiked below 1.0700 before it found support.
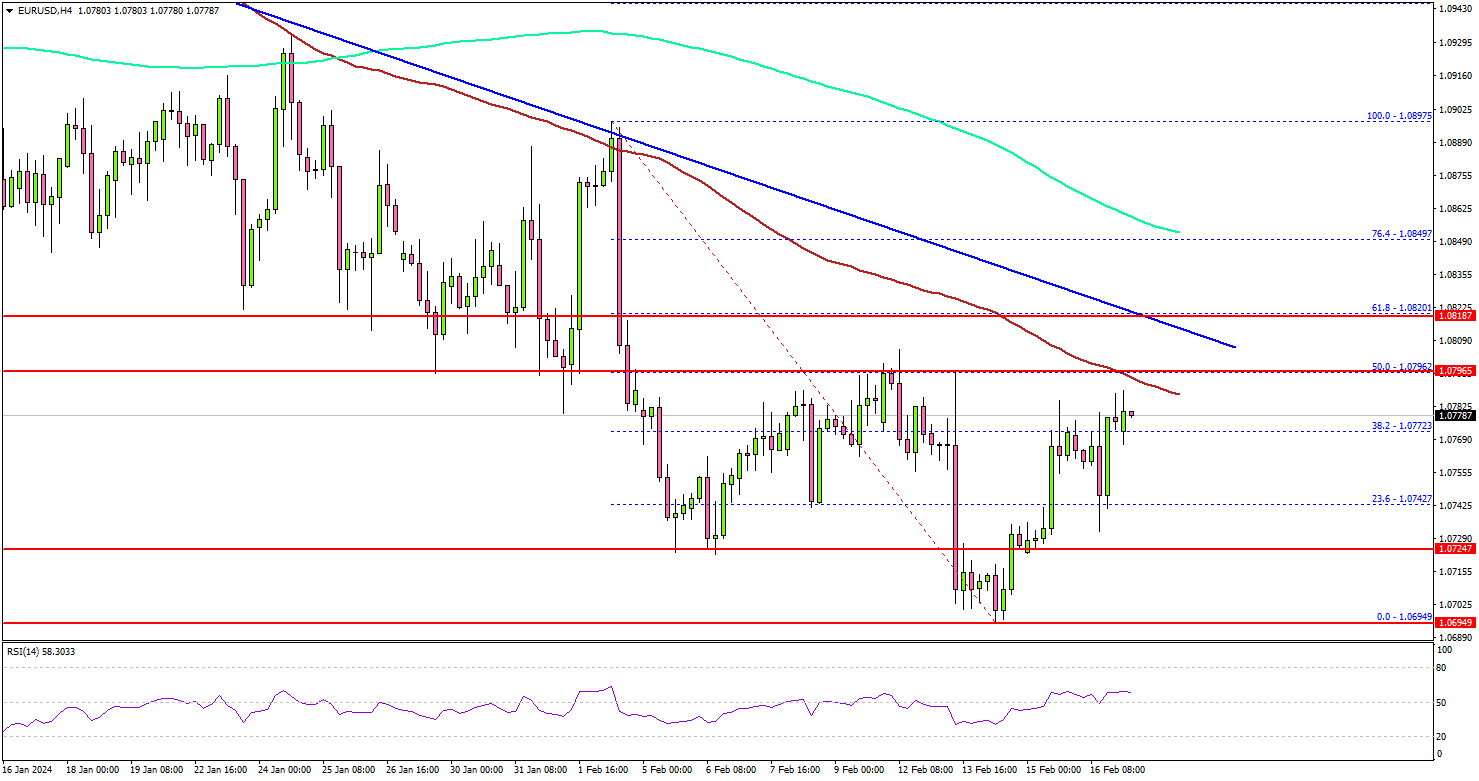
Looking at the 4-hour chart, the pair traded as low as 1.0694 and is currently attempting a recovery wave. There was a move above the 1.0750 resistance zone. The pair moved above the 38.2% Fib retracement level of the downward move from the 1.0897 swing high to the 1.0694 low.
EUR/USD is now facing strong resistance near the 1.0800 zone. There is also a major bearish trend line forming with resistance near 1.0810 on the same chart.
The trend line is close to the 50% Fib retracement level of the downward move from the 1.0897 swing high to the 1.0694 low. A close above the 1.0820 zone could open the doors for more upsides. The next stop for the bulls might be 1.0880. Any more gains might send EUR/USD toward 1.0920.
Immediate support is near the 1.0750 level. The first major support sits near the 1.0720 level. The next major support sits at 1.0700, below which the pair might gain bearish momentum. In the stated case, the pair could even visit the 1.0640 support level.
Looking at Bitcoin, the price seems to be consolidating gains above the $50,000 level and might aim for more upsides.
Economic Releases
- German Buba Monthly Report.
Bitcoin eyeing 61.8% projection level after breaking 50K barrier
Bitcoin's remarkably surged past 50k mark last week, propelling its market capitalization back over the USD 1 trillion. The significant uptick is largely driven by an influx of investments into BTC spot ETF. This bullish sentiment is further fueled by anticipation surrounding several key events this year: the forthcoming fourth Bitcoin halving, first Fed interest rate cut, and the possibility of an Ethereum spot ETF approval.
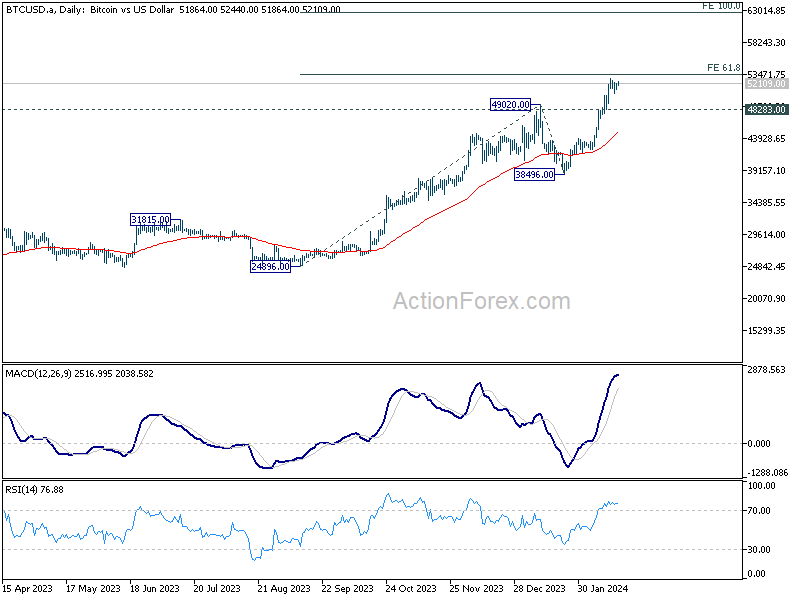
From a technical perspective, Bitcoin is now setting its sights on 61.8% projection of 24896 to 49020 from 38496 at 53404. Decisive break above this level could trigger further upside acceleration, with the next target at 100% projection at 62620. However, a retreat below 48283 support level would suggest a period of near-term consolidation. But downside should be contained above 38496 support to bring another rally.
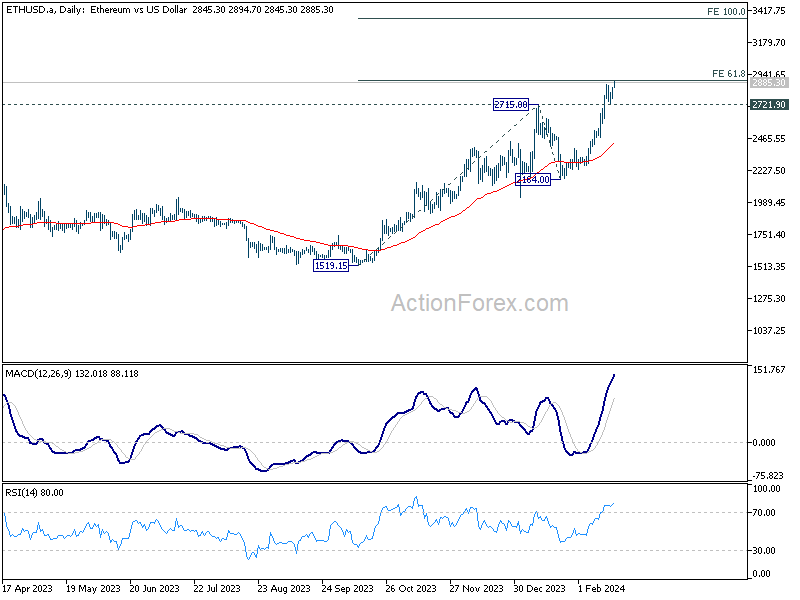
Ethereum mirrors this bullish outlook, testing 61.8% projection of 1519to 2715 from 2164 at 2903 now. Sustained break there could prompt further upside acceleration to 100% projection at 3360. Break of 2721.9 support will bring consolidations first. But downside of retreat should be contained above 2164 to bring rebound.
NZ BNZ services rises to 52.1, springs back to growth
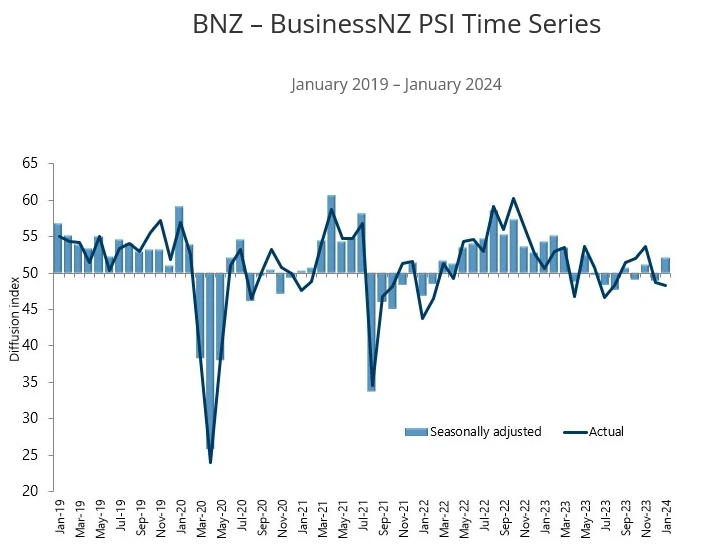
New Zealand's BusinessNZ Performance of Services Index rose from 48.8 to 52.1 in January, marking its highest peak since May 2023. This rebound places the sector back into expansion, albeit slightly below long-term average of 53.4.
Components of the PSI showed notable improvements: activity/sales surged to 53.0 from 47.2, employment edged up to 48.1 from 47.2, new orders/business increased to 51.8 from 50.8, and stocks/inventories rose to 53.5 from 51.7. However, a decrease in supplier deliveries to 48.7 from 50.3 hints at logistical challenges.
Reflecting on the sector's performance, BusinessNZ's chief executive, Kirk Hope, remarked on the "seesaw" trend between expansion and contraction observed in recent months. He highlighted that the sector's sustained recovery hinges on "continued momentum" in business activity and new orders, coupled with alleviation in "cost of living" pressures.
BNZ Senior Economist Doug Steel provided an optimistic outlook, suggesting that the combined PMI and PSI activity indicator hints that "annual GDP growth will soon turn positive." Yet Steel cautioned that further progress is essential to mitigate growing spare capacity within the economy.
EURJPY Price Action and Technical Analysis Overview
Talking Points:
- FOMC January 31st, 2024, Meeting Minutes.
- Technical Analysis EUR/JPY 8-Hour chart
- Commitment of Traders Report – EUR/JPY
- OANDA’s Position Ratio Indicator
FOMC January 31st, 2024, Meeting Minutes
This Wednesday, markets await the FOMC minutes for their latest meeting on January 31st, 2024; it is not expected that there will be any significant surprises in the minutes; however, traders will be searching within the text for indications regarding the Fed’s economic projections and what was the Fed’s view on inflation on the meeting day. An overall view of the surprising January Consumer Price Index – US CPI, Producer Price Index – US PPI and US Retail Sales combined, as well as other economic indicators, suggests that inflation rose slightly and economic activity contracted in January; this led traders to continue pushing their expectations for the FED’s first interest rate cut to take place in June/July 2024, rather than in May. On Friday of last week, FED’s Bostic said, “There is no rush to cut Interest rates with the US Labor market and economy still strong and cautioned it’s not clear, yet, that inflation is heading sustainably to the central bank’s 2% target, the evidence from data, our surveys, and our outreach says that victory is not clearly in hand and leaves me not yet comfortable that inflation is inexorably declining to our 2% objective”.
Markets anxiously await the Fed’s preferred inflation indicator, “Personal Consumption Expenditure PCE,” due on February 29th, 2024, for more clarity on how the interest rate path will be. The numbers can impact most currency pairs, so we will review the technical analysis for EURJPY.
Technical Analysis Overview – 8–Hour Chart
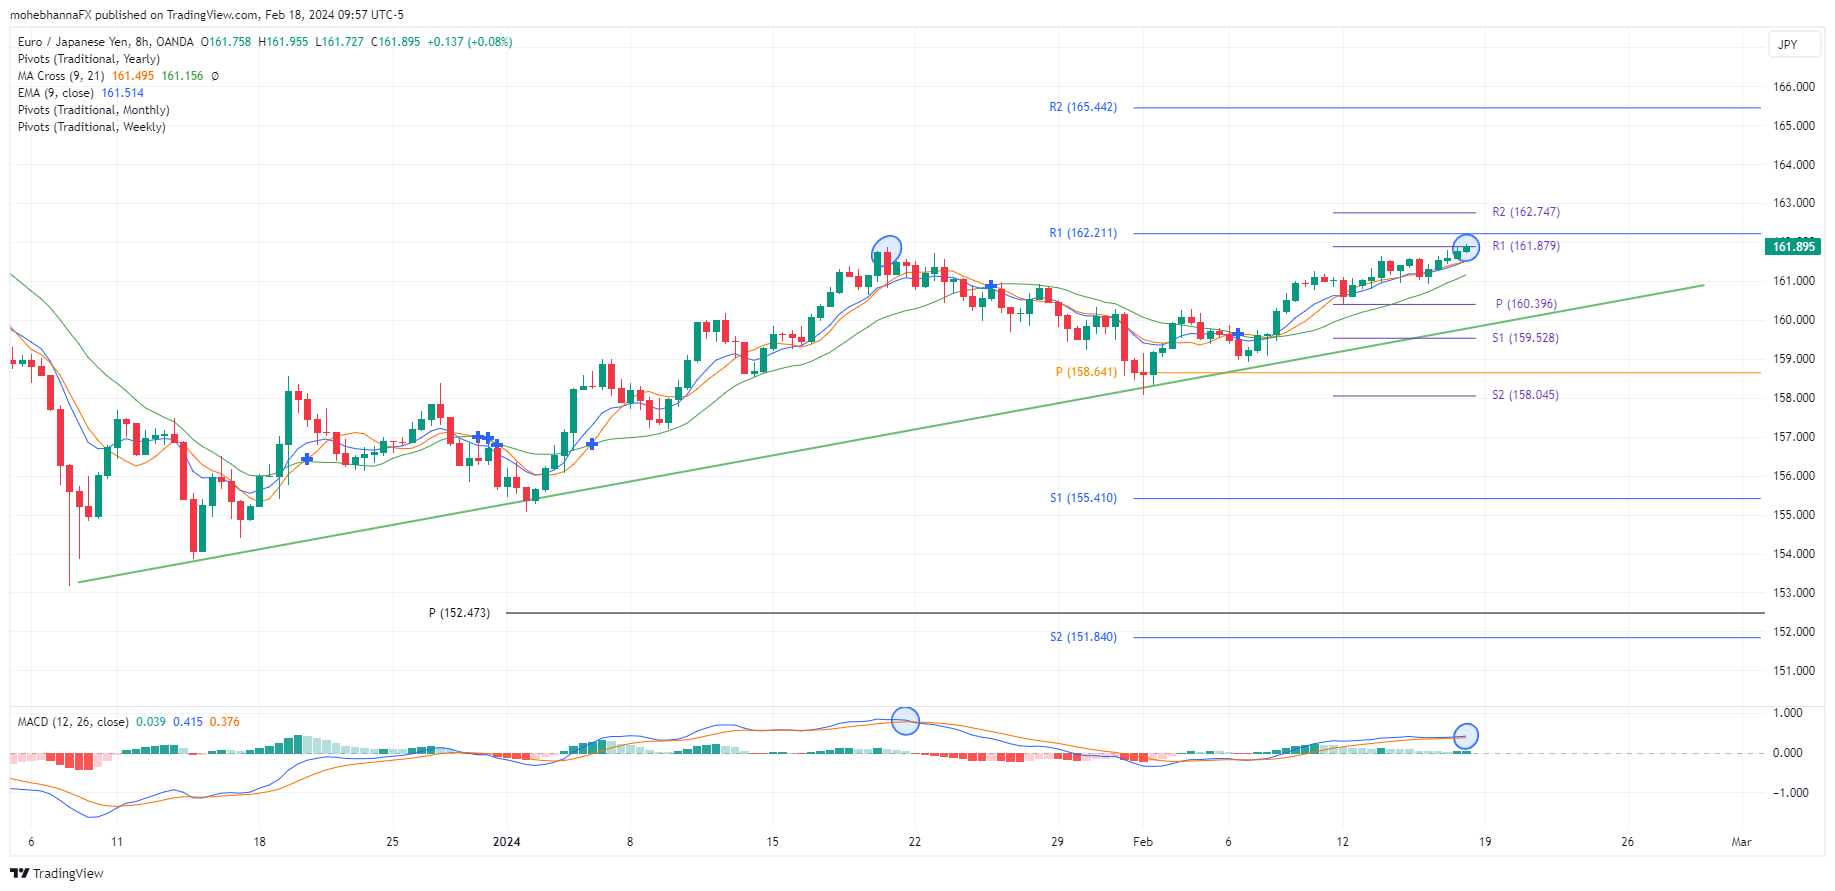
- Price has been trading in an intermediate uptrend since early December 2023 (Green line), forming higher highs along the way; the intermediate uptrend is part of two longer-term uptrends, which began in 2011 and 2020; both can be seen on more extended time frames.
- The uptrend is currently finding resistance at its weekly R1 and monthly R1 standard calculations within the range of 161.87 – 162.21; a break above the resistance level may lead price action to the next resistance at 162.74; however, if the resistance level was to hold, price action might retest the intermediate trendline.
- Price action broke and closed above EMA9, SMA9, SMA21, and its weekly pivot point.
- A negative divergence can be identified between Price action and the MACD indicator on the weekly close, as price action makes higher highs while MACD makes lower highs. (Blue circles), MACD line remains tangled with its signal line.
COT Report Analysis
https://cotbase.com/
https://cotbase.com/
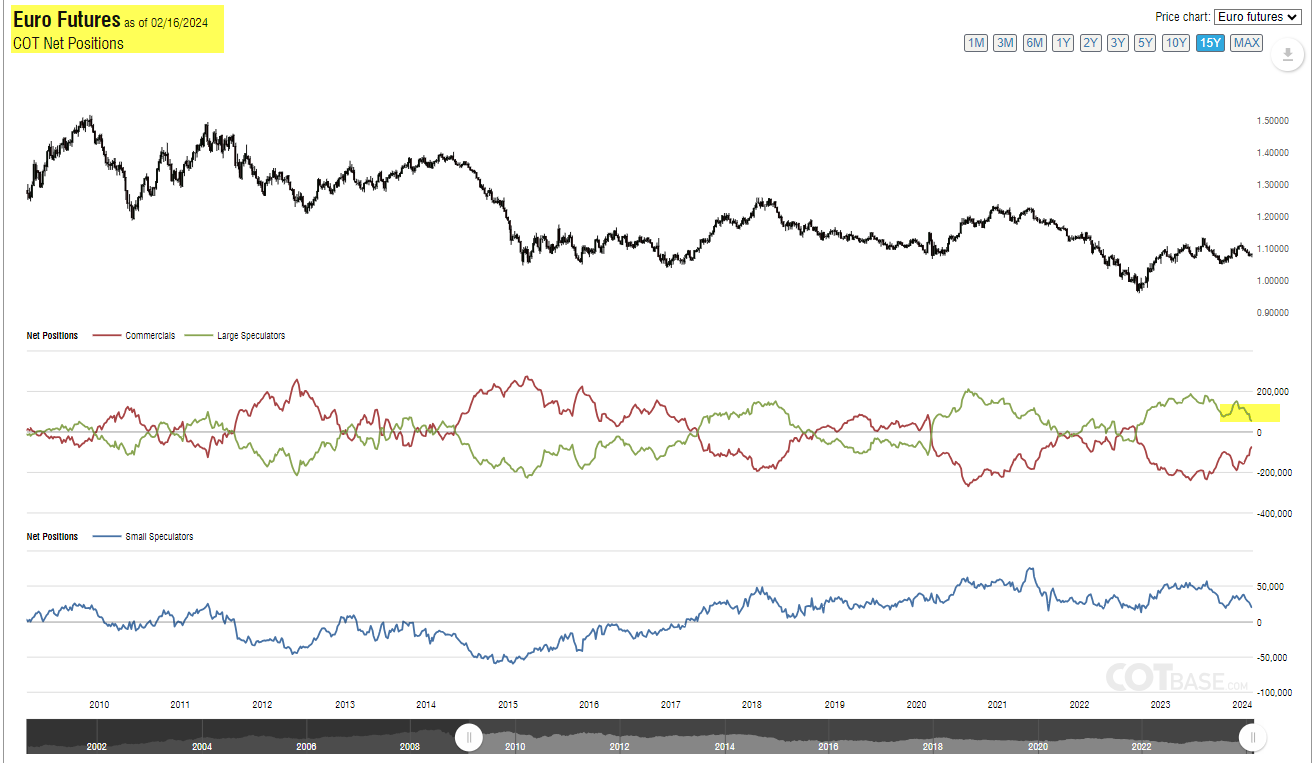
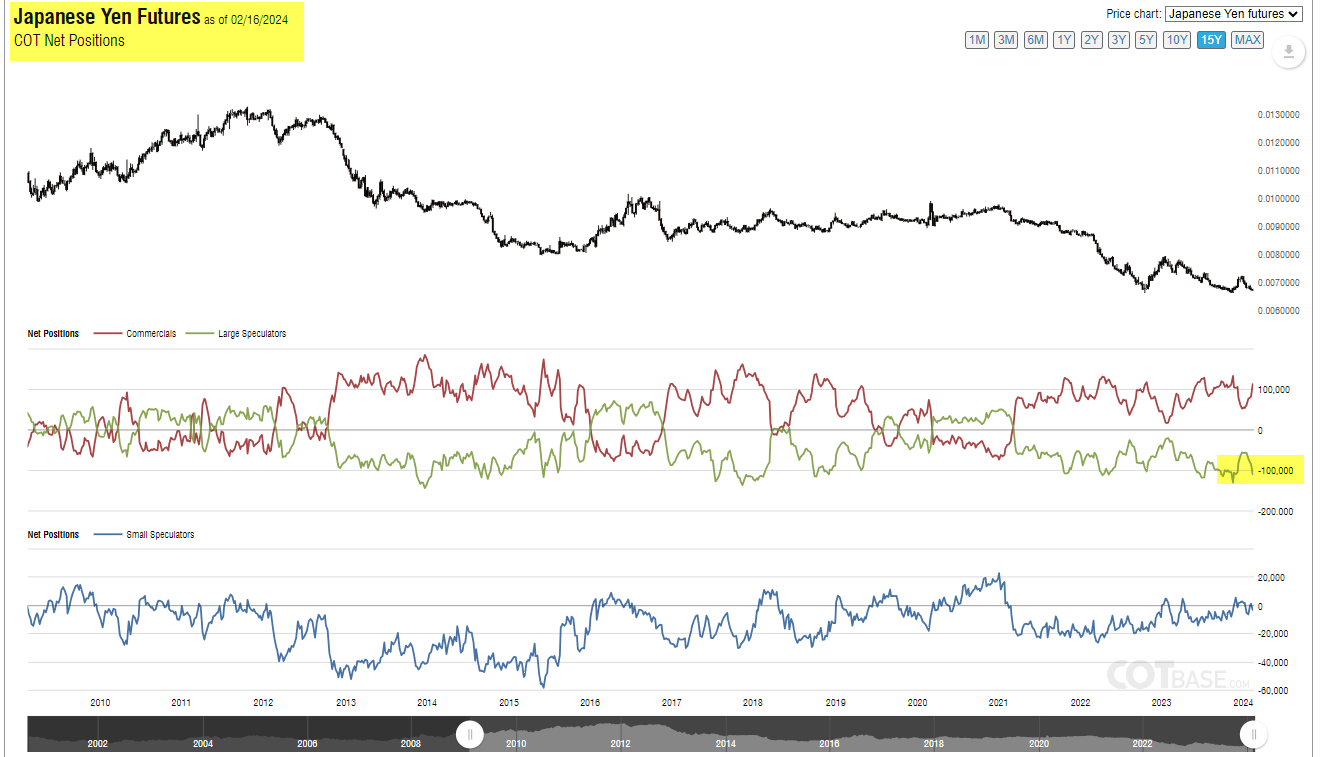
- Upon comparing the Positioning for the Euro to JPY on the most recent commitment of the trader’s report, we can see that large speculators’ Euro net positioning continues to move down towards the short from its extreme long positions. On the other hand, the same group’s positioning on JPY is very close to the extreme short level, suggesting a potential change in sentiment.
OANDA’s Position Ratio
https://trade.oanda.com/
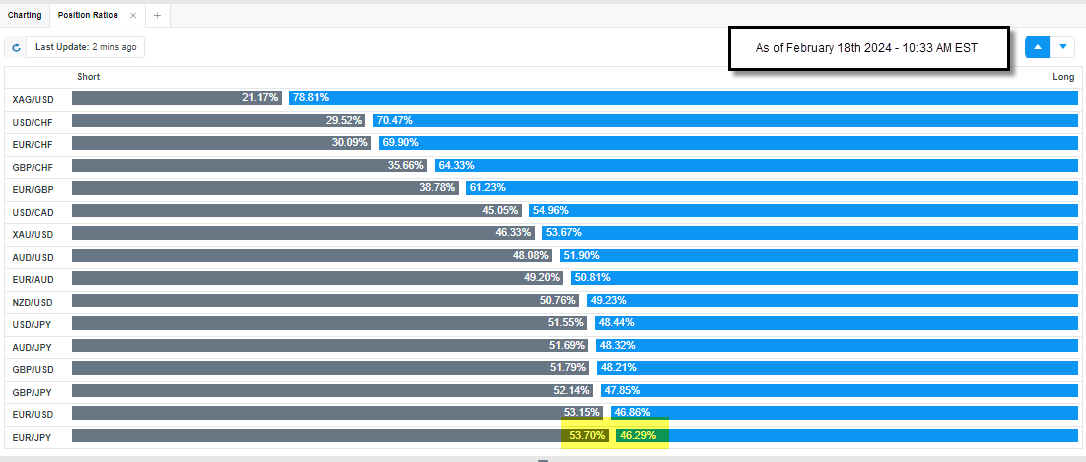
- The Orderbook indicator reflects that retail traders continued to add to their long positions as of early February 2024; the long ratio changed from 40.43% to the current 46.29%, which may suggest that a change in sentiment can be approaching.
Gold Wave Analysis
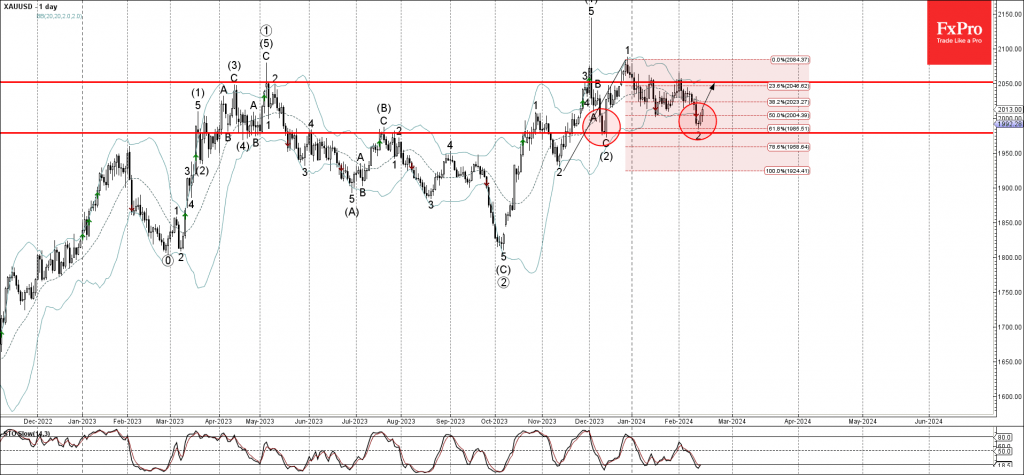
- Gold reversed from support level 1980.00
- Likely to rise to resistance level 2050.00
Gold recently reversed up from the support level 1980.00 (which formed the daily Morning Star in December), intersecting with the lower daily Bollinger Band and the 61.8% Fibonacci correction of the upward impulse from November.
The upward reversal from the support level 1980.00 created the daily Japanese candlestick reversal pattern Doji, which marked the end of the previous minor correction 2.
Given the clear daily uptrend, Gold can be expected to rise further to the next resistance level 2050.00 (which reversed the price twice from January).
EURUSD Wave Analysis
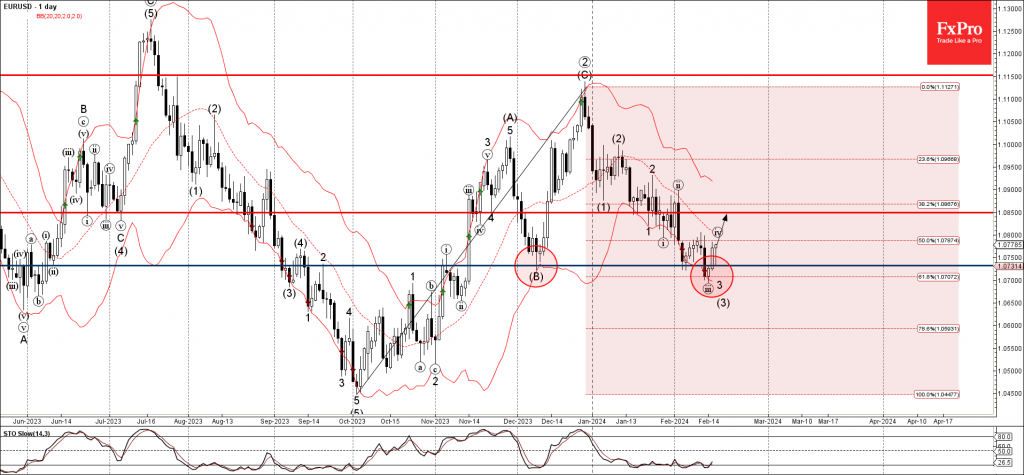
- EURUSD reversed from support level 1.0730
- Likely to rise to resistance level 1.0850
EURUSD currency pair recently reversed up from the support level 1.0730 (previous monthly low from December), intersecting with the lower daily Bollinger Band and the 61.8% Fibonacci correction of the upward impulse from October.
The upward reversal from the support level 1.0730 created the strong daily Japanese candlestick reversal pattern Morning Star.
Given the continuation of the USD outflows, EURUSD currency pair can be expected to rise further to the next resistance level 1.0850.
Forex and Cryptocurrencies Forecast
EUR/USD: A Week of Mixed Data
The macroeconomic statistics released last week were mixed in both the United States and the Eurozone. As a result, EUR/USD failed to break through either the 1.0700 support or the 1.0800 resistance, continuing to move within a narrow sideways channel.
The US dollar received a strong bullish impulse on Tuesday, February 14, following the release of US inflation data. The Dollar Index (DXY) surged by more than 0.5% and nearly reached the 105.00 resistance level. Consequently, EUR/USD moved downward, towards the lower boundary of the specified sideways range. Meanwhile, the S&P 500 stock index fell from 5051 to 4922 points.
It can be said that the US inflation data caught the markets off guard. Some analysts even described them as shocking. It turned out that the final victory over prices is not as close as it seemed before, and that the Federal Reserve is unlikely to start lowering interest rates anytime soon.
In January, the Consumer Price Index (CPI) sharply increased against the backdrop of a significant rise in the cost of rent, food, and healthcare services. On a monthly basis, the overall index accelerated from 0.2% to 0.3%. On an annual basis, the CPI was 3.1%, which is below the previous value of 3.4%, but significantly above the forecast of 2.9%. Excluding the volatile prices of food and energy, inflation in January rose from 0.3% to 0.4% month-on-month, while the annual core CPI remained at the previous level of 3.9%, although analysts had forecast a decrease to 3.8%. Particularly sharp was the increase in so-called "super-core inflation," which also excludes housing costs. In January, on a monthly basis, it reached 0.8%: the highest level since April 2022.
Certainly, the Federal Reserve's achievements in combating inflation are significant. It is worth recalling that in the summer of 2022, the CPI reached a 40-year peak at 9.1%. However, the current inflation rate is still almost twice the target level of 2.0%. Based on this, the market concluded that the Federal Reserve is now unlikely to rush into easing monetary policy and will probably maintain high interest rates for longer than previously anticipated. At the beginning of January, according to the FedWatch Tool, the probability of a 25 basis point (bp) rate cut in May was 54.1%. After the inflation report was released, this figure dropped to 35%. An even lower probability is given by the monitoring tool developed by Investing.com. The possibility of a dovish pivot in March, according to its readings, stands at 5%, and in May – around 30% (just a few weeks ago, it was over 90%). As for the beginning of summer, the probability of a reduction in the cost of borrowing through federal funds in June is estimated at 75%.
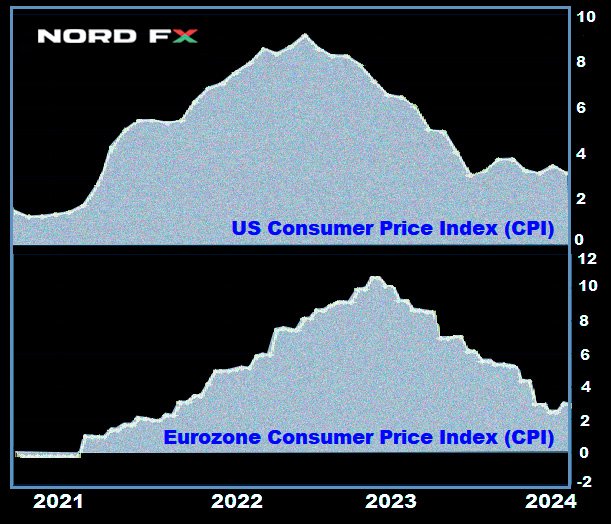
The inflation report was a boon for dollar bulls, but their joy was short-lived. The data on industrial production and retail sales in the US released on Thursday, February 16, were weaker than expected. In January, retail sales showed a decline of -0.8% compared to the December increase of 0.4% and the forecast of -0.1%. As a result, the dollar was under pressure, and the EUR/USD pendulum swung in the opposite direction: the pair headed towards the upper boundary of the 1.0700-1.0800 channel.
The dollar received a slight boost at the very end of the workweek. On Friday, February 16, the Producer Price Index (PPI) indicated that industrial inflation in January rose just as consumer inflation did. Against a forecast of 0.1%, the actual increase was 0.3% month-on-month, which is 0.4% higher than December's figure. On an annual basis, the PPI rose by 2.0% (forecast 1.6%, previous value 1.7%). However, this support was soon offset by a drop in the University of Michigan's US Consumer Confidence Index, which, although it increased from 79.0 to 79.6, was below the forecast of 80.0 points.
On the other side of the Atlantic, the news was also rather contradictory, resulting in the European statistics not being able to significantly support its currency. The February Economic Sentiment Index from ZEW in Germany improved more than expected, rising to 19.9 from 15.2 in the previous month. The economic sentiment indicator for the Eurozone as a whole also showed growth, moving from 22.7 points to 25.0. However, the assessment of the current situation fell to -81.7, the lowest level since June 2020.
Preliminary GDP data for Q4 2023, released on Wednesday, February 14, showed that the Eurozone is in a state of stagnation. On a quarterly basis, the figures remained at 0%, and on an annual basis, they were at 0.1%, exactly matching forecasts. This statistic did not add optimism, and markets continued to exercise caution, fearing that the Eurozone economy might slip into recession.
Europe faces a significantly sharper choice between supporting the economy and fighting inflation compared to the United States. Isabel Schnabel, a member of the Executive Board of the ECB and a well-known hawk, stated on Friday, February 16, that the regulator's monetary policy must remain restrictive until the ECB is confident that inflation has sustainably returned to the medium-term target level of 2.0%. Furthermore, Ms. Schnabel believes that persistently low labour productivity growth increases the risk that companies may pass their higher labour costs on to consumers, which could delay the achievement of the inflation target.
However, despite such hawkish statements, according to a ZEW survey, more than two-thirds of business representatives still hope for an easing of the ECB's monetary policy within the next six months. The probability of a rate cut for the euro in April is currently estimated by the markets at about 53%.
After all the fluctuations of EUR/USD, the final note of the past week was struck at the level of 1.0776. At the time of writing this review, on the evening of Friday, February 16, 55% of experts voted for the strengthening of the dollar in the near future and the further fall of the pair. 30% sided with the euro, while 15% took a neutral stance. Among the oscillators on D1, 60% are coloured red, 40% in neutral-grey, and none in green. The ratio among trend indicators is different: 60% red and 40% green. The nearest support for the pair is located in the zone of 1.0725-1.0740, followed by 1.0695, 1.0620, 1.0495-1.0515, 1.0450. Bulls will encounter resistance in the areas of 1.0800-1.0820, 1.0865, 1.0925, 1.0985-1.1015, 1.1110-1.1140, 1.1230-1.1275.
Among the events of the upcoming week, the minutes from the last meeting of the Federal Open Market Committee (FOMC) of the US Federal Reserve, which will be published on Wednesday, February 21, are of great interest. The following day, a powerful flow of data on business activity (PMI) in Germany, the Eurozone, and the US will be released. Moreover, on Thursday, February 22, the January figure for the Consumer Price Index (CPI) in the Eurozone and the number of initial jobless claims in the US will be known. Towards the very end of the workweek, on Friday, February 23, data on Germany's GDP, the main engine of the European economy, will arrive. Additionally, traders should keep in mind that Monday, February 19, is a holiday in the United States: the country observes Presidents' Day.
GBP/USD: What's Happening with the UK Economy?
As is known, following the meeting that concluded on February 1, the Bank of England (BoE) announced the maintenance of the bank rate at the previous level of 5.25%. The accompanying statement mentioned that "more evidence is needed that the Consumer Price Index will fall to 2.0% and remain at that level before considering rate cuts."
On February 15, Catharine Mann, a member of the Monetary Policy Committee (MPC) of the regulator, provided the most comprehensive overview of the state of the British economy, including aspects concerning inflation. The key points of her analysis were as follows: "The latest GDP data confirm that the second half of 2023 was weak. However, GDP data is a rearview mirror. On the other hand, the Purchasing Managers' Index (PMI) and other leading indicators look promising. The unemployment rate in the UK remains relatively low, and the labour market continues to be tight. Wage growth is slowing, but the pace remains problematic for the target Consumer Price Index (CPI) indicator. In the UK, goods prices may become deflationary at some point, but not on a long-term basis. Inflation in the UK's services sector is much more persistent than in the EU or the US." Consequently, Catharine Mann's conclusion was: "Mitigating the sources of inflation will be crucial in decision-making" and "Before making a decision on further actions, the Bank of England needs to receive at least one more inflation report."
Referring to specific figures, the latest data from the Office for National Statistics (ONS), published on February 16, showed that retail sales in the UK in January increased by 3.4% against the expected 1.5% and a decline of -3.3% in December (month-on-month). The core figure (excluding automotive fuel retail sales) rose by 3.2% over the month against a forecast of 1.7% and -3.5% in December. On an annual basis, retail sales also showed growth of 0.7% against the expected decline of -1.4% and a December figure of -2.4%.
Labour market data also supports the pound. The unemployment rate fell to 3.8% from 4.2%, against expectations of 4.0%. The reduction in the number of active job seekers in the labour market intensifies competition among employers, which helps maintain a higher wage growth rate. For the three months to December, wage growth was 5.8%. Such strong labour market statistics, complemented by high inflation (CPI 4.0% year-on-year, core CPI 5.1% year-on-year), are likely to push back the anticipated date for easing the Bank of England's monetary policy. Many analysts do not rule out that ultimately, the BoE may be among the last mega-regulators to cut rates this year.
GBP/USD ended the week at the level of 1.2599. According to economists at Scotiabank, the 1.2500 zone represents strong long-term support for it, and a confident move above 1.2610 will strengthen the pound and set GBP/USD on a growth path towards 1.2700. Regarding the median forecast of analysts for the coming days, 65% voted for the pair's decline, 20% for its rise, and the remaining 15% maintained neutrality. Among the oscillators on D1, 75% point south, the remaining 25% look east, with none willing to move north. The situation is different with trend indicators, where there is a slight bias in favour of the British currency – 60% indicate north, while the remaining 40% point south. If the pair moves south, it will encounter support levels and zones at 1.2570, 1.2500-1.2535, 1.2450, 1.2370, 1.2330, 1.2185, 1.2070-1.2090, 1.2035. In case of an increase, the pair will meet resistance at levels 1.2635, 1.2695-1.2725, 1.2775-1.2820, 1.2880, 1.2940, 1.3000, and 1.3140-1.3150.
Thursday, February 22 stands out in the calendar for the upcoming week. On this day, a batch of data on business activity (PMI) in various sectors of the economy of the United Kingdom will be released. The release of other significant macroeconomic statistics in the coming days is not anticipated.
USD/JPY: The Flight Continues
On Tuesday, February 13, USD/JPY reached another local maximum at 150.88. The Japanese currency retreated again, this time against the backdrop of inflation data in the US. The yen also continues to be under pressure due to the Bank of Japan's (BoJ) consistent dovish stance. On February 8, Deputy Governor Shinichi Uchida expressed doubts that the regulator would start to quickly raise its benchmark rate anytime soon. Last Friday, February 16, BoJ Governor Kazuo Ueda spoke in a similar vein. He stated that the issue of maintaining or changing monetary policy, including the negative interest rate, would only be considered "when there is a chance of sustainable and stable achievement of the price level target." Ueda declined to comment on short-term fluctuations in the exchange rate and the factors behind these movements.
In general, there's nothing new. However, many analysts continue to hope that in 2024 the Bank of Japan will finally decide to tighten its monetary policy. "We believe," write economists at the Swiss financial holding UBS, "that the normalization of the Bank of Japan's policy this year will occur against the backdrop of strong negotiations on wage increases and corporate profitability. We still believe that the Japanese yen is likely at a turning point after significant depreciation from 2021 to 2023. Considering that the yield differential between 10-year U.S. and Japanese bonds will narrow over the year, we believe the current entry point for buying yen is attractive."
A similar position is held at Danske Bank, where they forecast a sustainable decrease in USD/JPY below 140.00 on a 12-month horizon. "This is primarily because we expect limited growth in yields in the US," say strategists at this bank. "Therefore, we expect the yield differential to become a tailwind for the yen throughout the year, as the G10 central banks, with the exception of the Bank of Japan, are likely to start rate-cutting cycles."
Regarding the short-term outlook, specialists at Singapore's United Overseas Bank Limited believe that the dollar still has the potential to test 151.00 before weakening. "The risk of the US dollar rising to 152.00 will remain unchanged as long as it stays above 149.55," UOB states. This position is supported by only 25% of experts, with the majority (60%) already siding with the yen, and the remaining 15% preferring to maintain neutrality. Among the trend indicators and oscillators on D1, all 100% point north, however, 25% of the latter are in the overbought zone. The nearest support level is located in the zone of 149.65, followed by 148.25-148.40, 147.65, 146.65-146.85, 144.90-145.30, 143.40-143.75, 142.20, 140.25-140.60. Resistance levels are located at the following levels and zones - 150.65-150.90, 151.70-152.00.
No significant events related to the Japanese economy are scheduled for the upcoming week. Moreover, it is important to note that Friday, February 23, is a public holiday in Japan: the country observes the Emperor's Birthday.
CRYPTOCURRENCIES: Bitcoin Breaks Records
Last week, the price of bitcoin rose above $52,790, setting a new peak since 2021. According to CoinGecko, the market capitalization of the leading cryptocurrency exceeded $1.0 trillion for the first time in two years, and the total market capitalization of the entire crypto market rose above $2.0 trillion for the first time since April 2022.
Much of this bull rally is attributed to the launch of nine leading spot bitcoin ETFs. According to The Block, a month after their launch, their assets exceeded 200,000 BTC (about $10 billion). The new bitcoin ETFs rose to second place in the ranking of US commodity exchange-traded funds by asset volume, becoming a more popular investment instrument than silver ETFs. Observers note BlackRock's statement that "interest in bitcoin among investors remains high," hence the fund is ready to buy even more BTC.
According to Documenting Bitcoin, the net interest from ETF issuers exceeds 12,000 BTC per day. Thus, Wall Street representatives are currently buying 12.5 times more BTC coins daily than the network can produce. Researchers believe this has been a key driver of the price increase for the flagship crypto asset.
Morgan Creek Digital co-founder and partner Anthony Pompliano also highlighted the success of the newly launched spot BTC-ETFs. According to him, the fact that BlackRock and Fidelity managed to attract $3 billion each in record short times was a historic event for exchange-traded funds. "Wall Street is not just in love with bitcoin," the financier wrote. "They are in an active love affair. The daily supply of bitcoins to funds is limited to just 900 BTC, which corresponds to approximately $40-45 million. Meanwhile, the daily net inflow of funds into BTC-ETFs already equals $500 million (max. $651 million). This is a clear indicator of BTC scarcity and its bullish impact on the cryptocurrency's price and the market as a whole," Pompliano stated, noting the imbalance between the market supply of bitcoin and demand from Wall Street companies. The billionaire is optimistic about BTC's future trajectory and asserts that with continued demand from Wall Street, especially considering the upcoming halving, the top-capitalization cryptocurrency could significantly exceed its historical highs.
CryptoQuant noted that, in addition to the demand from BTC-ETFs, the number of active wallets is also significantly increasing. This too indicates a long-term upward trend. "Given the reduction in supply, increased demand, and various economic and social issues, especially ongoing inflation, bitcoin is likely to strengthen its position as a long-term alternative investment asset with an upward trend," analysts conclude.
SkyBridge Capital founder and former White House senior official Anthony Scaramucci also emphasized inflation. Beyond the launch of spot BTC-ETFs and the halving, Scaramucci pointed to the monetary policy of the US Federal Reserve as a driver for Bitcoin's growth. "The US Consumer Price Index (CPI) data released on Tuesday, February 13, signalled that inflation may not be as under control as the Fed would like," the investor writes. "Based on data published by the US Bureau of Labor Statistics, the consumer price index for January showed inflation at 3.1%. The data also sparked speculation that a Federal Reserve interest rate cut in March and May is likely off the table." Delays in rate cuts can cause turbulent trading in the main market but will serve as a boom for the crypto world, as Bitcoin is used as a hedge against inflation. Therefore, according to Scaramucci, the time to invest profitably in digital gold has not yet passed.
Popular blogger and analyst Lark Davis shared a similar position: he believes investors have about 700 days to get rich. Discussing the importance of market cycles and the timely sale of assets, the specialist noted that if traders are attentive, they can make a lot of money in the next two years. According to the expert, 2024 will be the last chance to buy digital assets, and 2025 will be the best time to sell them. The specialist emphasized the importance of not disposing of everything at once but gradually securing profits. Lark Davis also warned that in 2026, a "Great Depression" will begin in the global economy and the cryptocurrency market. And if not sold in time, investments could be lost.
The onset of the "Great Depression" is also predicted by the famous author of "Rich Dad Poor Dad," financier, and writer Robert Kiyosaki. He believes that the S&P 500 index is on the verge of a monumental crash with a potential collapse of a full 70%. He accompanied this statement with his consistent recommendation to invest in assets such as gold, silver, and bitcoins.
Ex-CEO of the cryptocurrency exchange BitMEX, Arthur Hayes, identified another driver for Bitcoin's growth related to the Federal Reserve's monetary policy. Last week, the US banking sector was gripped by fear as New York Community Bancorp (NYCB) reported a colossal quarterly loss of $252 million. The bank's total loan losses increased fivefold to $552 million, fuelled by concerns over commercial real estate. Following the release of this report, NYCB shares fell 40% in one day, leading to a decline in the US Regional Banks Index.
Arthur Hayes recalled the Bitcoin rally triggered by the banking crisis in March 2023, when three major American banks, Silicon Valley Bank, Signature Bank, and Silvergate Bank, went bankrupt within five days. The crisis was caused by an increase in the Federal Reserve's refinancing rate and, as a consequence, the outflow of deposit accounts. Its biggest victims also included Credit Suisse and First Republic Bank. To prevent the crisis from affecting even more banks, global industry regulators, primarily the Fed, intervened to provide liquidity. "Yeah... From rock to bankruptcy, that's the future. And then there will be even more money, printers... and BTC at $1 million," the ex-CEO of BitMEX commented on the current NYCB failure.
Popular analyst on the X platform known as Egrag Crypto believes that by September this year, Bitcoin's market capitalization will reach $2.0 trillion. Based on this, the price of the leading cryptocurrency at that moment will exceed $100,000. "Get ready for the journey of your life," Egrag Crypto urges his followers. "Hold on tight, as you are witnessing a cryptocurrency revolution. Don't blink, or you might miss this historic moment in financial history!"
As of the evening of February 16, when this review was written, the BTC/USD pair is trading in the $52,000 zone. The total market capitalization of the crypto market stands at $1.95 trillion ($1.78 trillion a week ago). The Crypto Fear & Greed Index remains in the Greed zone at a level of 72 points.
– It's worth noting that the Greed zone corresponds to a situation where traders are actively buying an asset that is increasing in price. However, Glassnode warns that many on-chain indicators have already entered the so-called "risk zone". The analysis is based on a group of indicators that consider a wide range of data regarding investor behaviour. Their combination covers both short-term and long-term cycles. In particular, the MVRV indicator, which tracks long-term investors, has approached the critical zone. Such a high value (2.06) has not been observed since the FTX collapse. A similar "high" and "very high" risk status is currently characteristic of six out of the remaining nine metrics. They record a relatively low level of realized profit considering the active price increase in recent weeks. According to observations by Glassnode specialists, a high risk indicator is usually observed in the early stages of a bull market. This is because, having reached a "significant level" of profitability, hodlers may start to secure profits, which, consequently, could lead to a strong correction downwards.
Market Optimism Endures Through a Week of Economic Paradoxes
This past week showcased a rollercoaster of economic revelations and market responses. Despite a mix of apprehensions, especially surrounding inflation and monetary policies, the prevailing mood remained decidedly risk-on. That culminated in DOW and S&P 500 reaching unprecedented highs, even though both concluded the week on a relatively subdued note.
Inflation data stood at the heart of market speculation, particularly in the US, where stronger-than-anticipated consumer and producer price indices prompted traders to reassess the likelihood of an early Fed rate cut. Expectations for a rate reduction in the first half were dampened. Yet, confidence in the underlying strength of the US economy served as a counterbalance, maintaining an optimistic outlook among investors.
European markets echoed this positive investor sentiment, with DAX and CAC setting new records. ECB is seen as having more flexibility in initiating earlier policy easing, due to comparatively lower inflationary pressures in Eurozone. Meanwhile, Nikkei's ascent was underpinned by reassurances of prolonged accommodative monetary policy in Japan, and the softened verbal intervention by officials on Yen's depreciation.
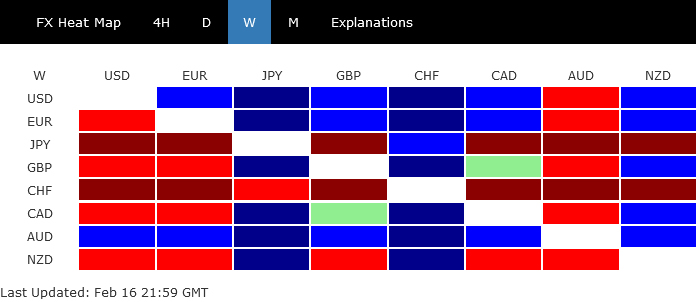
In the currency arena, Dollar maintained its dominance throughout most of the week, until Australian Dollar edged ahead, lifted by the global risk-on wave. Euro emerged as the third strongest performer. Conversely, Swiss Franc and the Yen found themselves at the bottom, affected additionally US yields' extended rebound. British Pound presented a mixed picture, buffeted by a slew of confusing economic indicators from wage growth to recession signals and retail sales spikes. Meanwhile, Canadian Dollar's failed to carve a clear path and ended mixed too.
Fed's First Cut Possibly Pushed to Latter Half, But Markets Display Resilience
US stock markets snapped a five-week winning streak, despite reaching new record highs within the week for both DOW and S&P 500. The modest intra-week pullback suggests a strategic realignment by investors, likely characterized by profit-taking rather than a comprehensive market reversal. Investors taking time to digest the mixed mixed economic data released over the week and the complicated picture they present.
On one front, consumer inflation stubbornly persisted at elevated levels. The latest CPI data revealed a slower than anticipated deceleration, with headline CPI easing to 3.1% in January and core CPI remaining static at 3.9%, signaling a pause in disinflation progress. Similarly, PPI readings exceeded expectations, indicating enduring upstream inflationary pressures. These inflationary trends, coupled with January's sharp decline in retail sales, suggest that the high interest rates and inflation are starting to weigh on consumer expenditure. In contrast, regional Federal Reserve surveys indicated notable improvement in manufacturing sentiment, injecting a measure of optimism into the economic outlook.
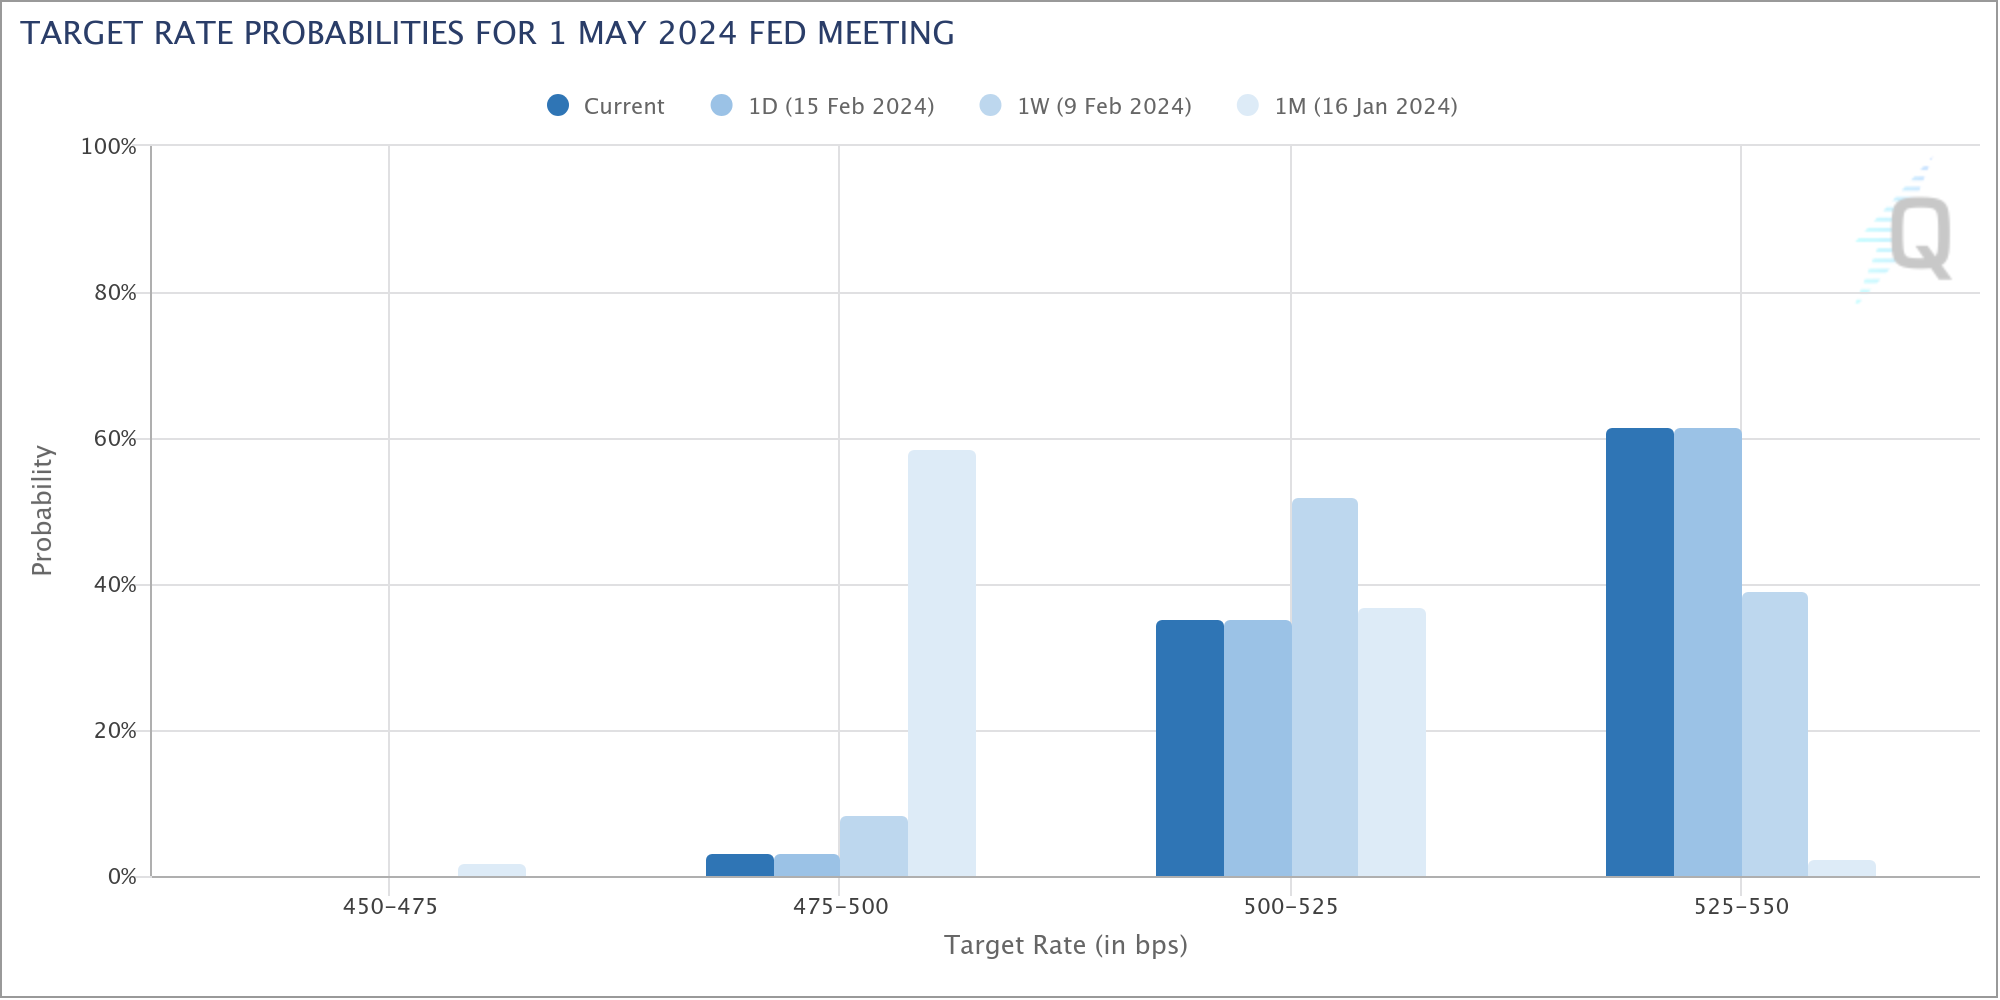
Market expectations for a Federal Reserve rate cut in May have been significantly adjusted. Fed fund futures now show more than 60% likelihood of a hold, a stark contrast to the mere 2.5% chance seen just a month ago. Some analysts now speculate that the initiation of rate cuts could be postponed to the latter half of the year, given the current inflation stickiness and economic resilience.
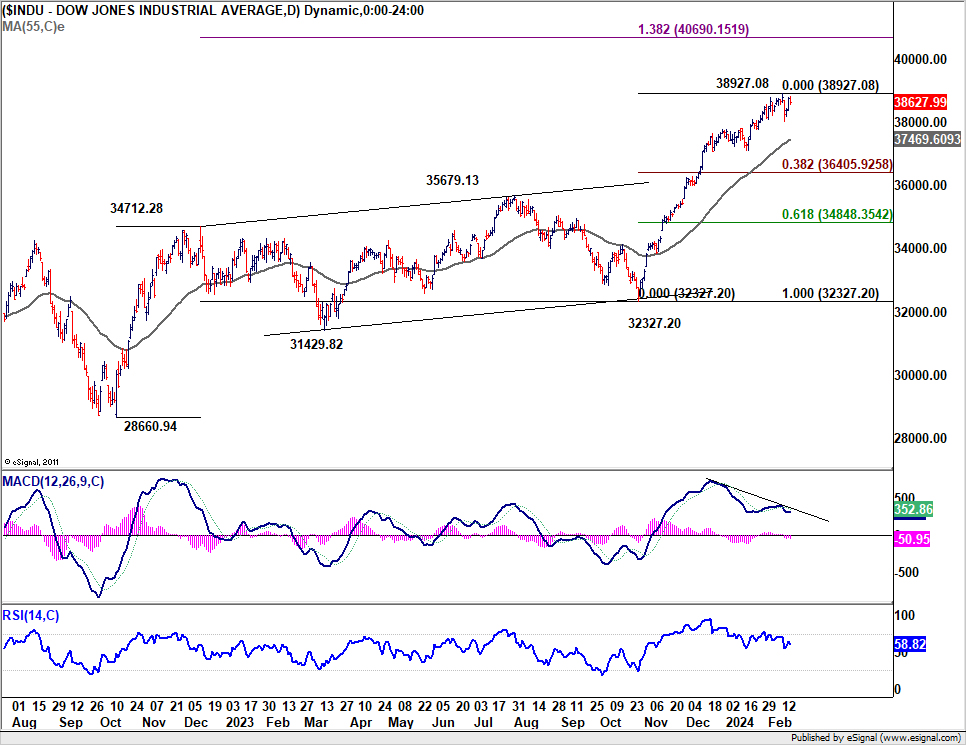
Despite these challenges, overall market sentiment remains buoyed the prevailing optimism that the US economy's resilience could endure prolonged periods of high interest rates. From a technical perspective, DOW's consolidation from 38927.08 short term top should be relatively brief as long as 55 D EMA (now at 37469.60) holds. Another rally should be seen to 40000 handle, or further to 138.2% projection of 28660.94 to 34712.28 from 32327.20 at 40690.15 before starting forming a major top.
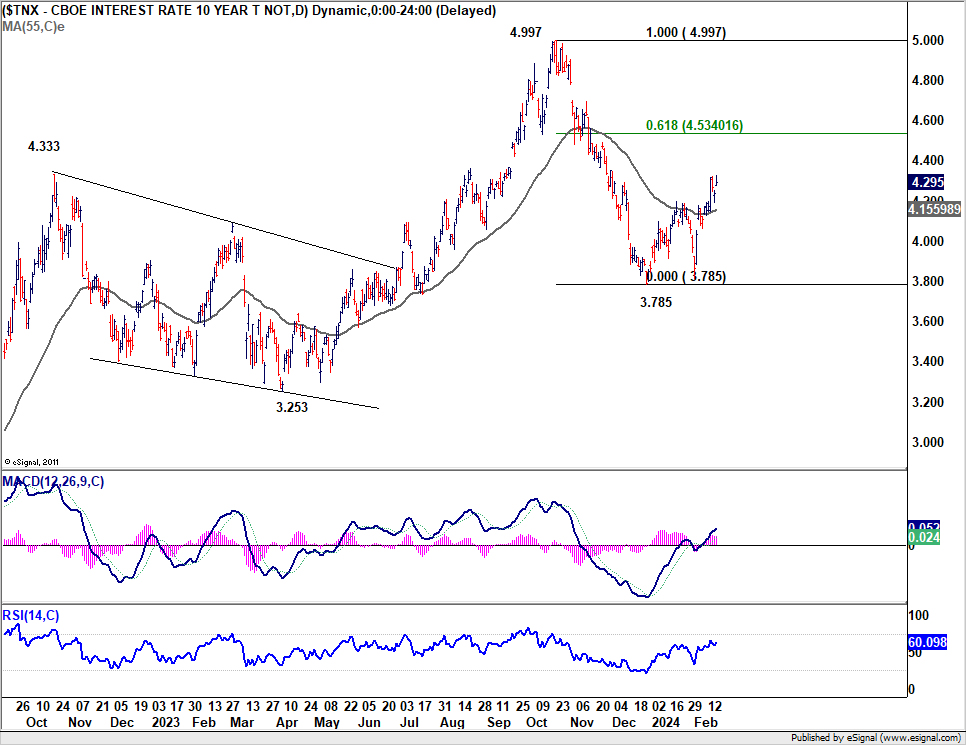
10-year yield extended the rebound from 3.785 to close at 4.295, responding to higher than expected inflation data and adjust Fed expectations. Current development argues that fall from 4.997 has completed at 3.785 already. Rebound from there is seen as the second leg of a three wave corrective pattern from 4.997. Further rise is expected as long as 55 D EMA (now at 4.155) holds. Next target is 61.8% retracement of 4.997 to 3.785 at 4.534 and above.
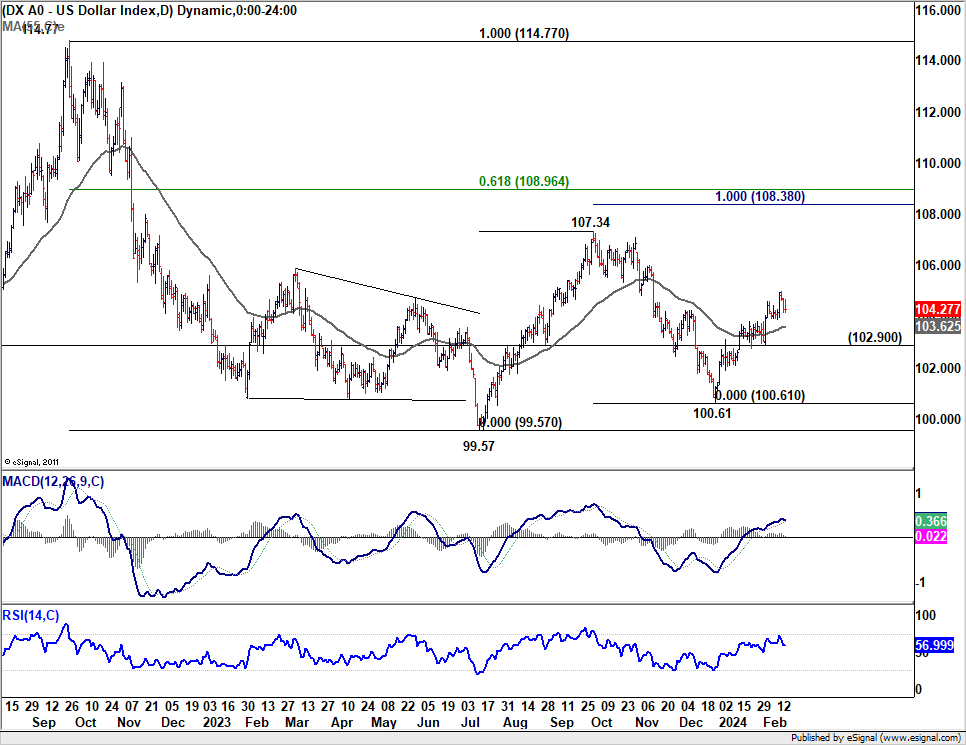
Dollar index also extended the rebound from 100.61. Current rally is seen as the third leg of the pattern from 99.57. Further rise is expected as long as 102.90 support holds, towards 107.34 resistance.
Record Highs for DAX and CAC, Nikkei to Follow Soon
Risk sentiment was also robust in market in other regions, with DAX and CAC reaching new record highs This upbeat mood is buoyed by strong corporate earnings and a growing consensus among investors that ECB possesses greater latitude for earlier interest rate reductions compared to its counterparts, Fed and BoE. This perception is underpinned by relatively subdued inflationary pressures within the Eurozone.
ECB officials, including President Christine Lagarde, have confirmed that inflation is on track to return to the target. While the first rate cut is still anticipated in April or June, one of the Governing Council members suggest March as a possibility, contingent on the upcoming economic projections to be published at that meeting.
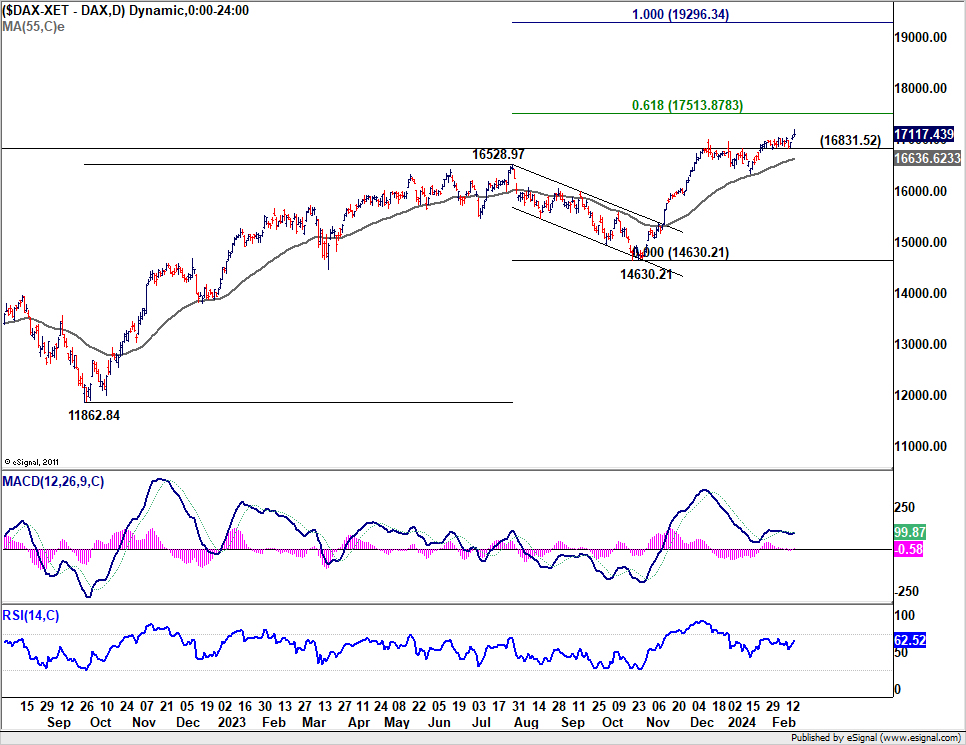
Technically, further rise is now expected in DAX as long as 168.31 support holds. Next target is 61.8% projection of 11862.84 to 16528.97 from 14630.21 at 17513.87. The question now is whether DAX would pick up momentum through this projection level to the next at 100% projection at 19296.34 later in the year.
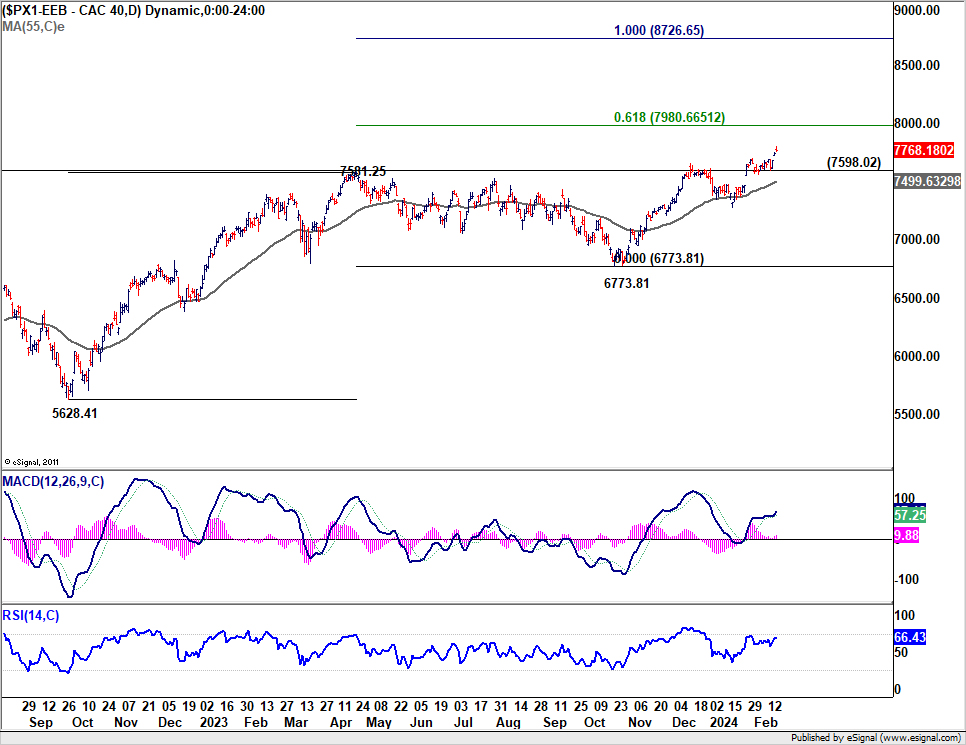
As for CAC, near term outlook will stay bullish as long as 7598.02 support holds. Next target is 61.8% projection of 5628.41 to 7581.25 from 6773.81 at 7980.66. Upside momentum is more promising as seen in D MACD. Sustained break of 7890.66 will pave the way to 100% projection at 8726.65 later in the year.
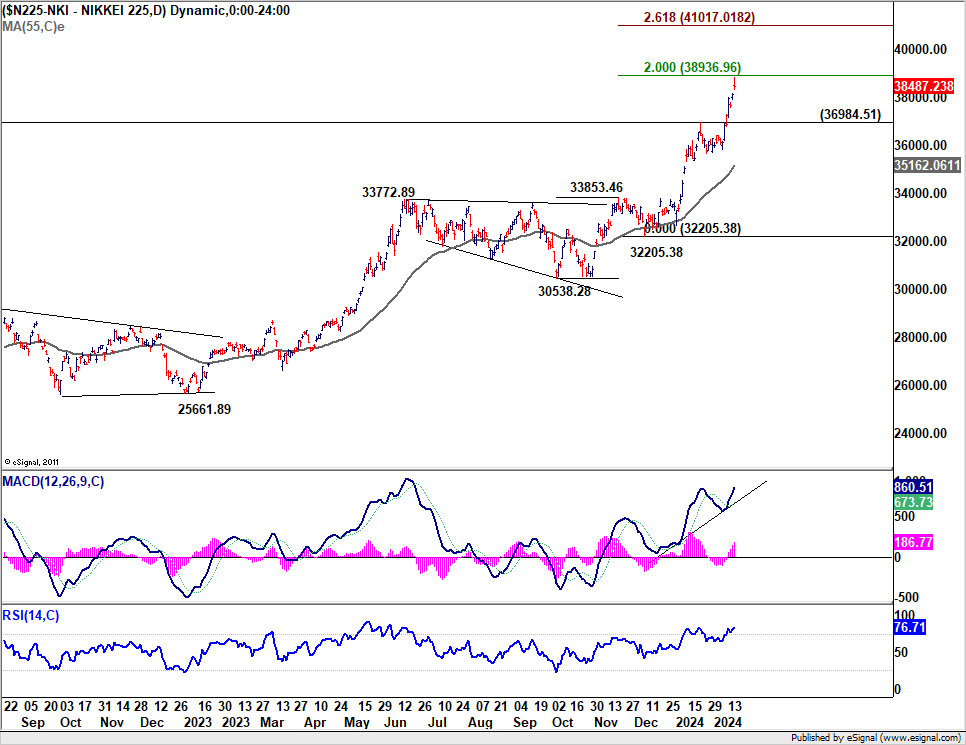
Japan's stock market is not left behind in this trend, as Nikkei's bullish run continues unabated. A new record high now looks imminent. This optimism is partly due to reassurances from BoJ Governor Kazuo Ueda about maintaining accommodative monetary policy even post the cessation of negative interest rates. Finance Minister Shunichi Suzuki's also softened the tone of his verbal intervention, by acknowledging the merits and demerits of Yen's depreciations. These forward looking development overshadowed the weak Q4 GDP data which indicated that Japan was in recession last year.
Technically, some initial setback could be seen as Nikkei challenges record high of 39260.00, and possibly 40000 psychological level. But near term outlook will stay bullish as long as 36985.41 resistance turned support holds. Next target is 261.8% projection of 30538.28 to 33853.46 from 32205.38 at 41017.01.
Sterling Faces Confusion Amid Contradictory Economic Data
Sterling had a tumultuous week, leaving traders in a quandary over its direction amidst a backdrop of conflicting economic indicators. Unexpectedly high wage growth data for December hinted at persistent inflationary pressures, raising eyebrows among market participants. January's CPI and core CPI figures, although not surging as anticipated, stayed stubbornly high at 4% and 5.1%, respectively. Adding to the complex picture, GDP data revealed that UK had slipped into recession last quarter, contracting more significantly than forecasted with a -0.3% qoq dip. Yet, January witnessed a robust 3.4% mom surge in retail sales, injecting a dose of optimism.
Nevertheless, BoE Chief Economist Huw Pill's remarks on Friday could have offered a semblance of clarity amidst the confusion. He suggested that a cut in the Bank Rate was "still some way off", emphasizing the necessity to wait "several more months" to be assured that inflation's persistent components were being effectively addressed. These comments should lend the Pound some support for the near term.
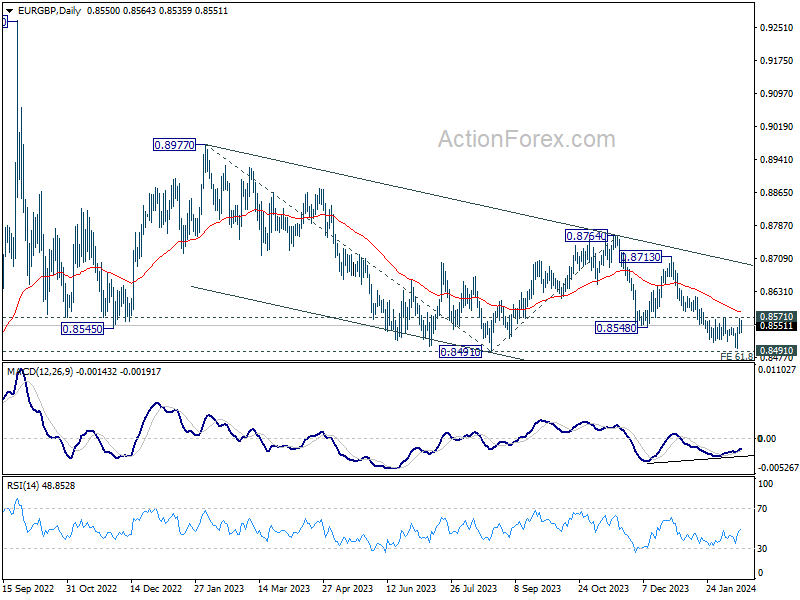
Technically, an immediate focus in EUR/GBP is whether it could draw important support from 0.8491 to break through 0.8571 resistance to confirm short term bottoming. Or, it would break through 0.8491 to resume the medium term down trend from 0.9267.
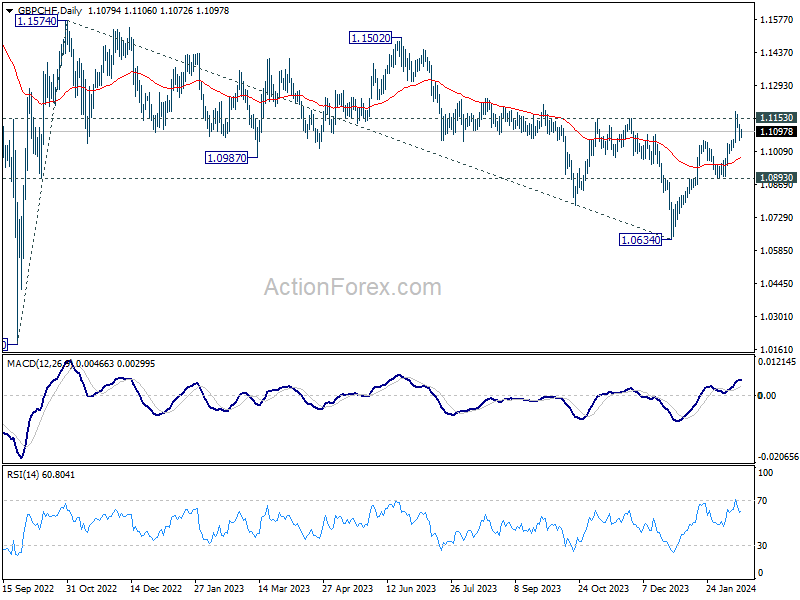
As for GBP/CHF, focus remains on 1.1153 resistance. Decisive break there will affirm the case that correction from 1.1574 has completed with three waves down to 1.0634. Further rise should then be seen to 1.1502/1153 resistance zone.
AUD/USD Weekly Report
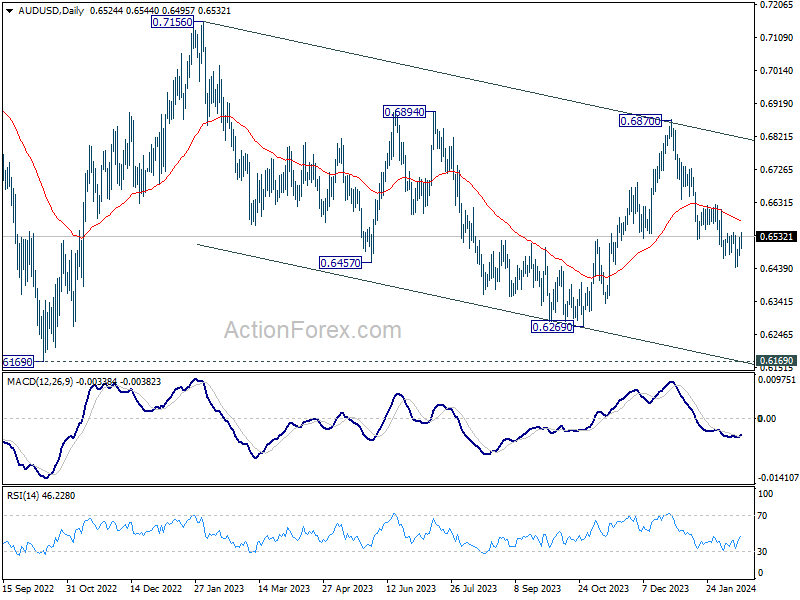
AUD/USD edged lower to 0.6642 last week but recovered since then. Initial bias stays neutral this week first. More consolidation would be seen and stronger recovery cannot be ruled out. But outlook will remain bearish as long as 0.6621 resistance holds. Break of 0.6642 will resume the decline from 0.6870 towards 0.6269 low.
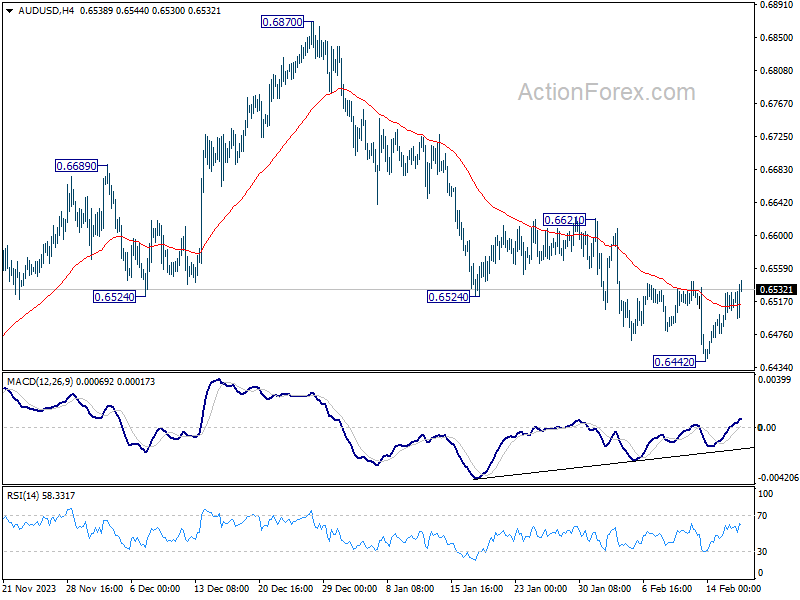
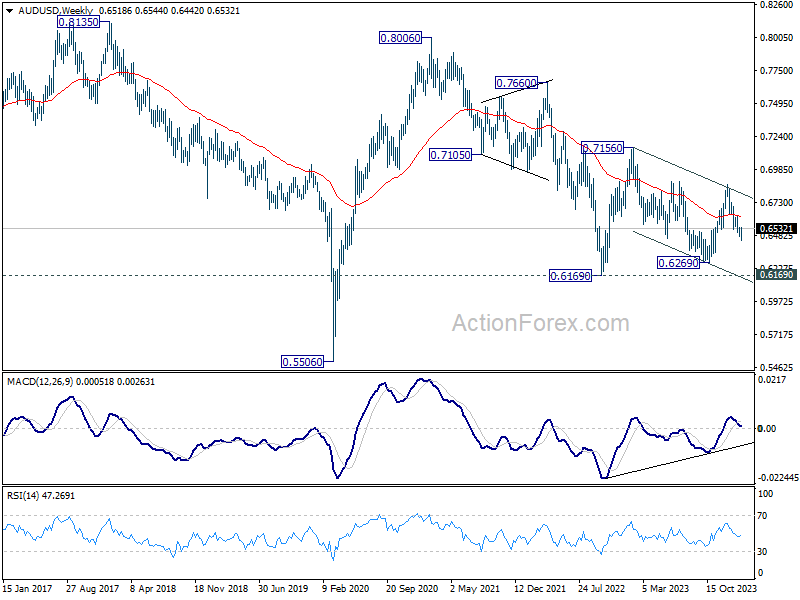
In the bigger picture, price actions from 0.6169 (2022 low) are seen as a medium term corrective pattern to the down trend from 0.8006 (2021 high). Fall from 0.7156 (2023 high) is seen as the second leg, which might still be in progress. Overall, sideway trading could continue in range of 0.6169/7156 for some more time. But as long as 0.7156 holds, an eventual downside breakout would be mildly in favor.
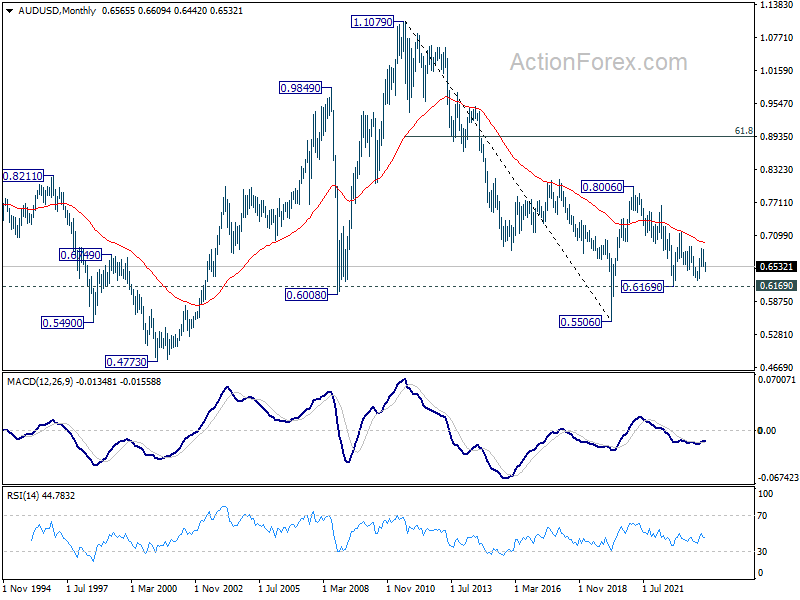
In the long term picture, the down trend from 1.1079 (2011 high) should have completed at 0.5506 (2020 low) already. It's unsure yet whether price actions from 0.5506 are developing into a corrective pattern, or trend reversal. But in either case, fall from 0.8006 is seen the second leg of the pattern. Hence, in case of deeper decline, strong support should emerge above 0.5506 to bring reversal.
EUR/USD Weekly Outlook
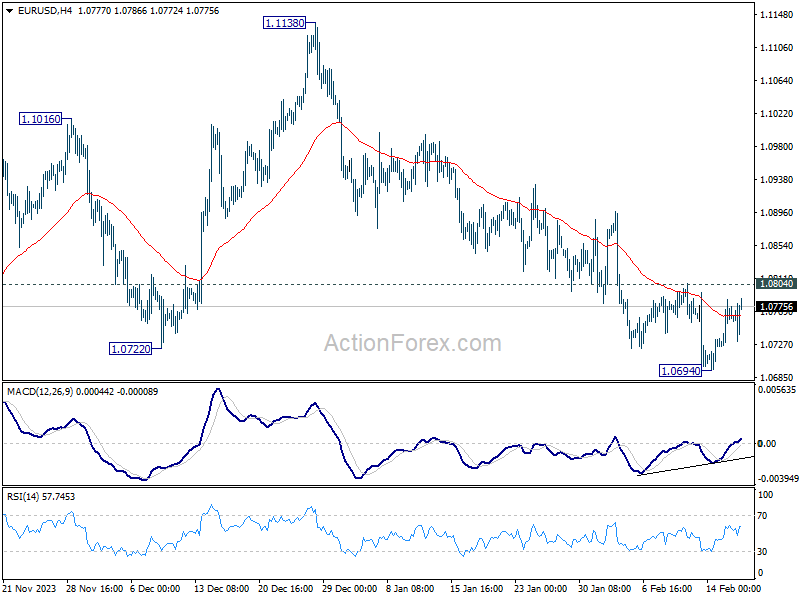
EUR/USD edged lower to 1.0694 last week but recovered since then. Initial bias remains neutral this week first. Further decline is in favor with 1.0804 resistance intact. On the downside, below 1.0694 will resume the fall from 1.1138 to retest 1.0447 support. Nevertheless, considering bullish convergence condition in 4H MACD, above 1.0804 will turn bias to the upside for stronger rebound.
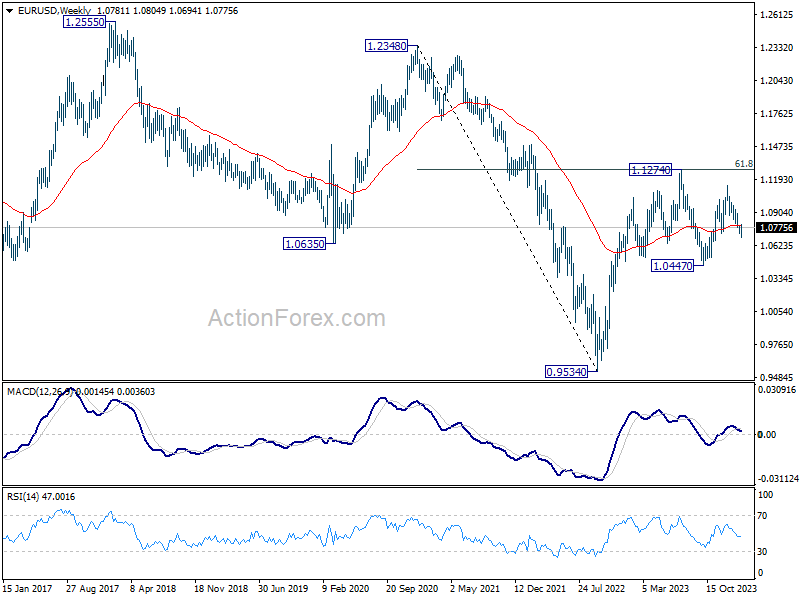
In the bigger picture, price actions from 1.1274 are viewed as a corrective pattern to rise from 0.9534 (2022 low). Rise from 1.0447 is seen as the second leg. While further rally could cannot be ruled out, upside should be limited by 1.1274 to bring the third leg of the pattern. Meanwhile, sustained break of 1.0722 support will argue that the third leg has already started for 1.0447 and possibly below.
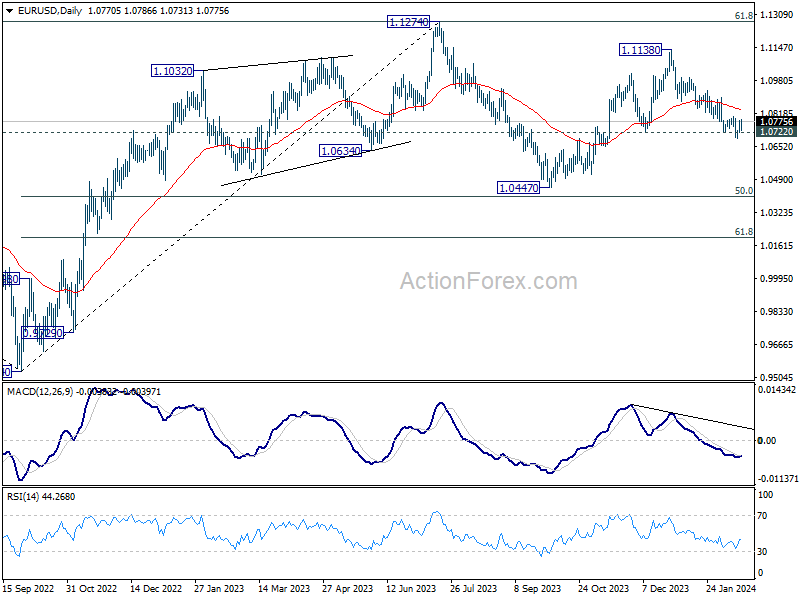
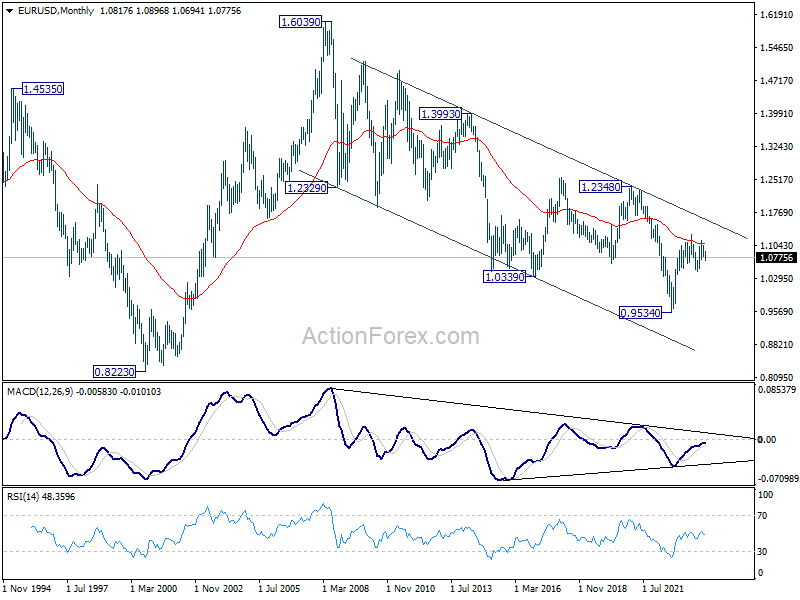
In the long term picture, a long term bottom is in place at 0.9534 on bullish convergence condition in M MACD. It's still early to call for bullish trend reversal with the pair staying inside falling channel in the monthly chart. Nevertheless, sustained trading above 55 M EMA (now at 1.1059) and break of 1.1274 resistance will raise the chance of reversal and target 1.2348 resistance for confirmation.