Sample Category Title
USD/JPY Weekly Outlook
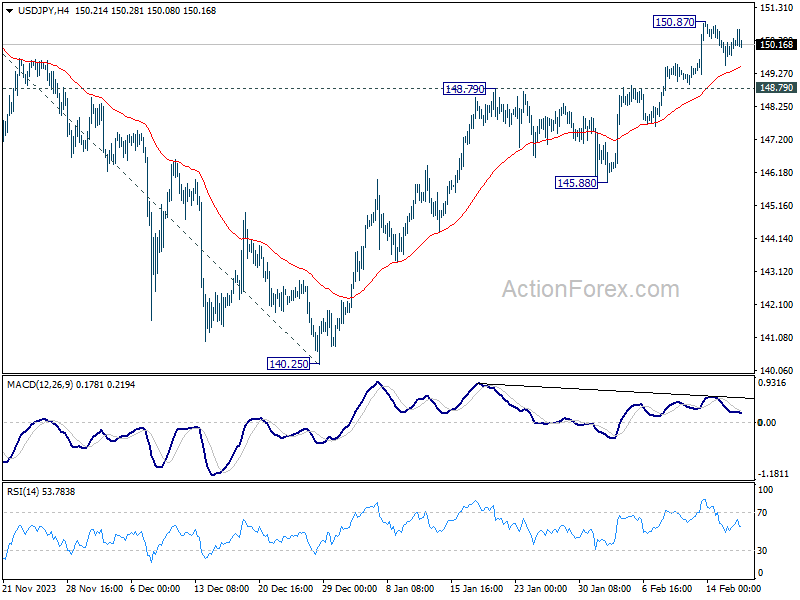
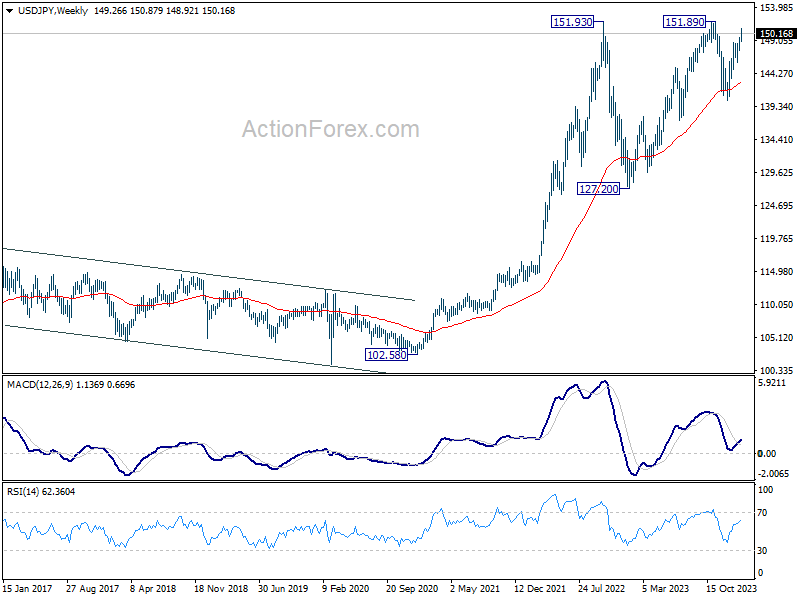
USD/JPY rose further to 150.87 last week but retreated since then. Intraday bias remains neutral this week for some consolidations. But in case of another retreat, downside should be contained by 148.79 resistance turned support to bring another rally. Above 150.87 will resume the rise from 140.25 to 151.89/93 key resistance zone. Decisive break there will confirm larger up trend resumption of 155.50 projection level next. However, firm break of 148.79 will turn bias to the downside for 145.88 support.
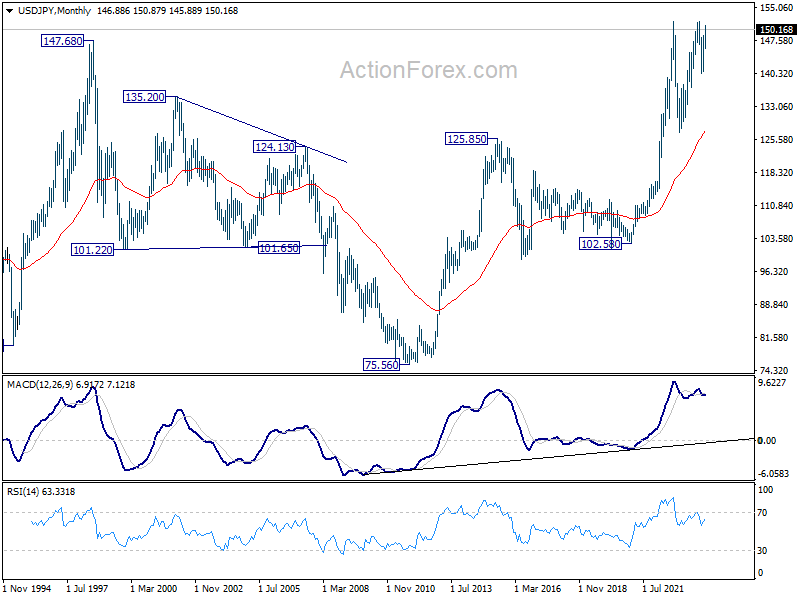
In the bigger picture, fall from 151.89 is seen as a correction to the rally from 127.20, which might have completed at 140.25 already. Firm break of 151.89/93 resistance zone will confirm up trend resumption, and next target will be 61.8% projection of 127.20 to 151.89 from 140.25 at 155.50. This will now remain the favored case as long as 140.25 support holds.
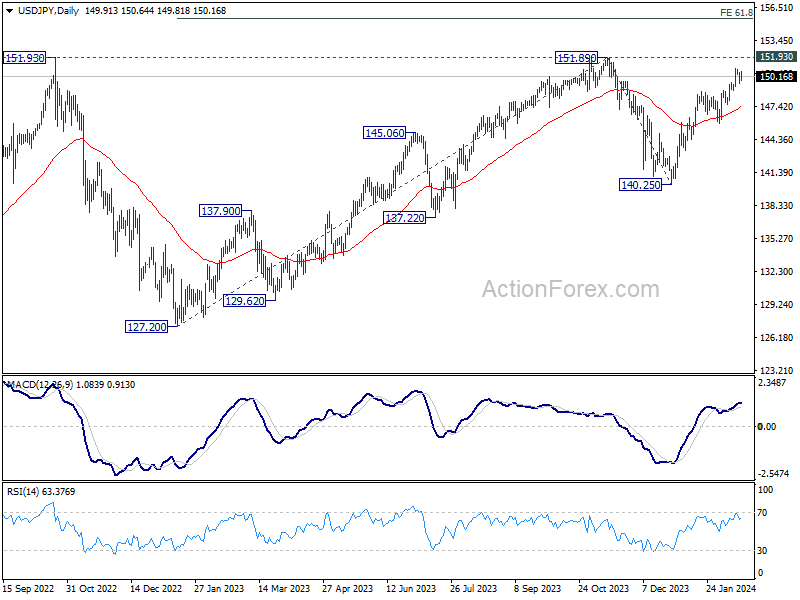
In the long term picture, as long as 125.85 resistance turned support holds (2015 high), up trend from 75.56 (2011 low) is still in favor to continue through 151.93 (2022 high) at a later stage.
GBP/USD Weekly Outlook
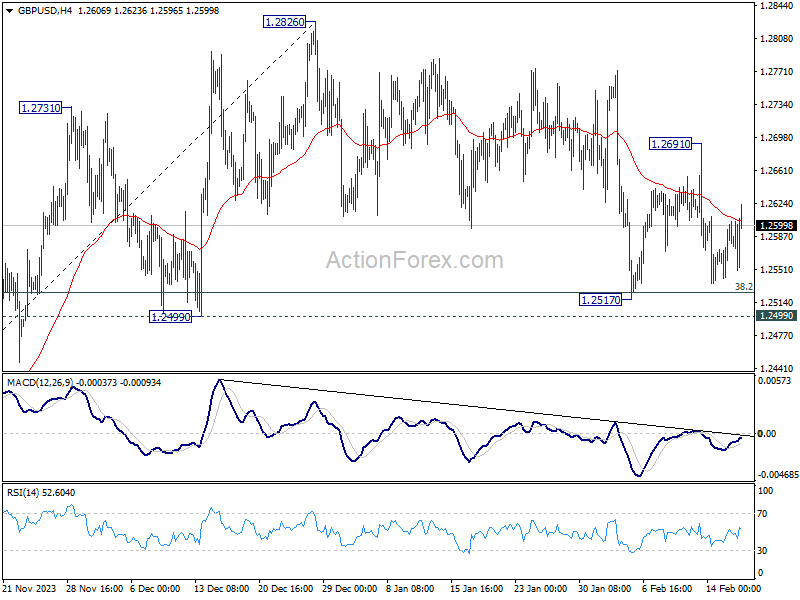
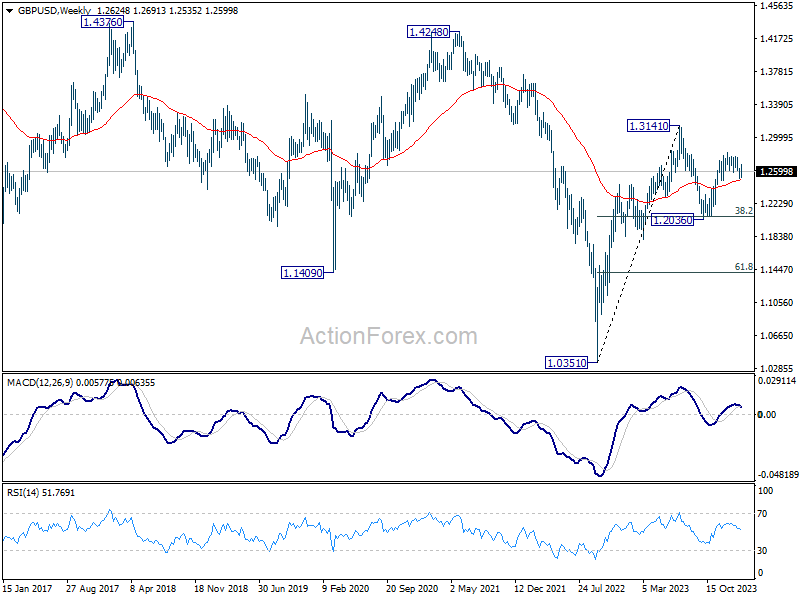
GBP/USD was bounded in range below 1.2826 last week despite some volatility. Initial bias remains neutral this week first. On the upside, break of 1.2691 resistance will indicate that correction from 1.2826 has completed. Intraday bias will be back on the upside for retesting 1.2826. Nevertheless, decisive break of 1.2499 will argue that whole rise from 1.2036 has completed and turn near term outlook bearish.
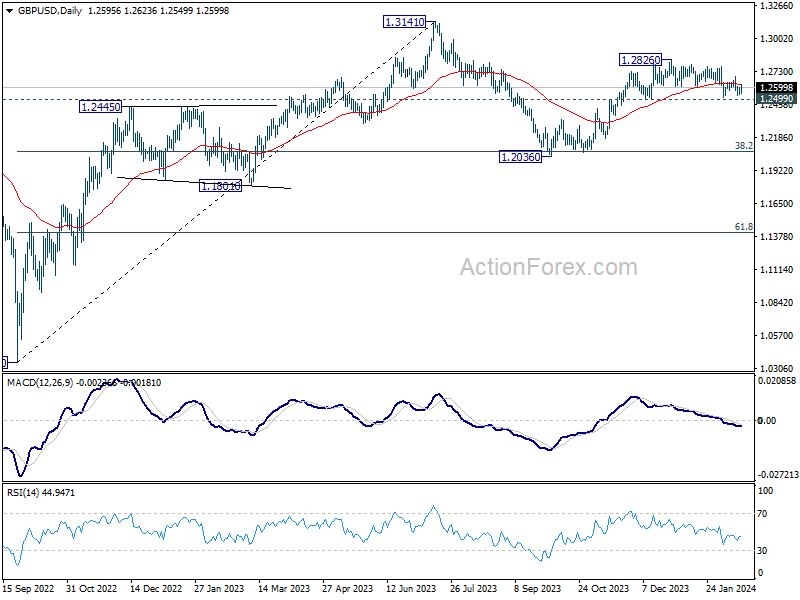
In the bigger picture, price actions from 1.3141 medium term top are seen as a corrective pattern to up trend from 1.0351 (2022 low). Rise from 1.2036 is seen as the second leg, which could be still in progress. But upside should be limited by 1.3141 to bring the third leg of the pattern. Meanwhile, break of 1.2499 support will argue that the third leg has already started for 38.2% retracement of 1.0351 (2022 low) to 1.3141 at 1.2075 again.
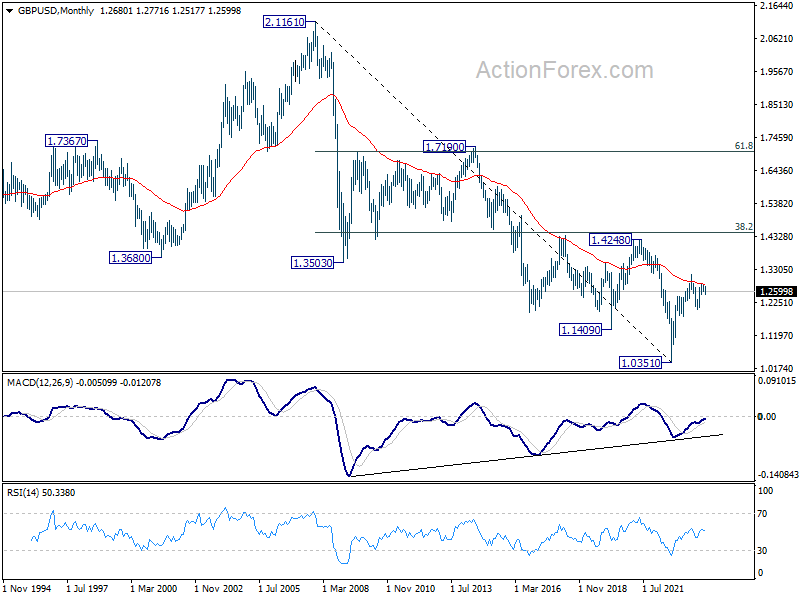
In the long term picture, a long term bottom should be in place at 1.0351 on bullish convergence condition in M MACD. But momentum of the rebound from 1.3051 argues GBP/USD is merely in consolidation, rather than trend reversal. Range trading is likely between 1.0351/4248 for some more time.
USD/CHF Weekly Outlook
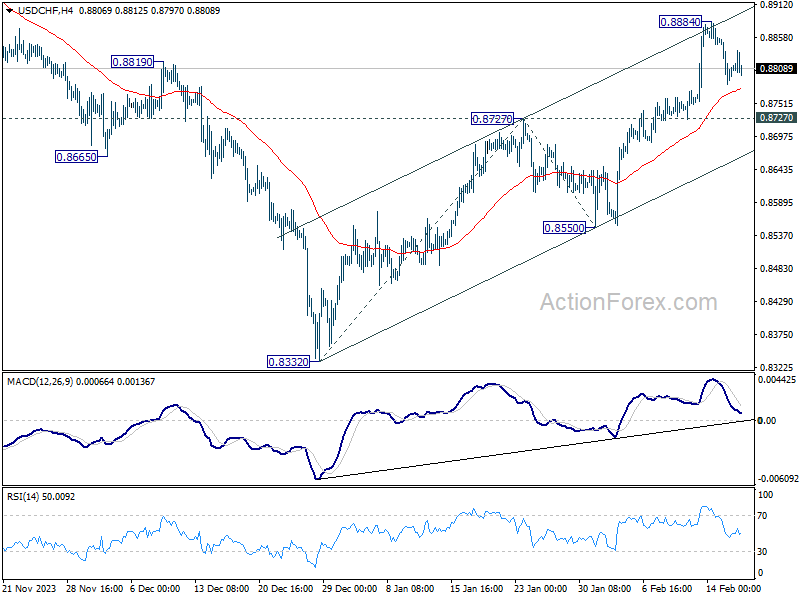
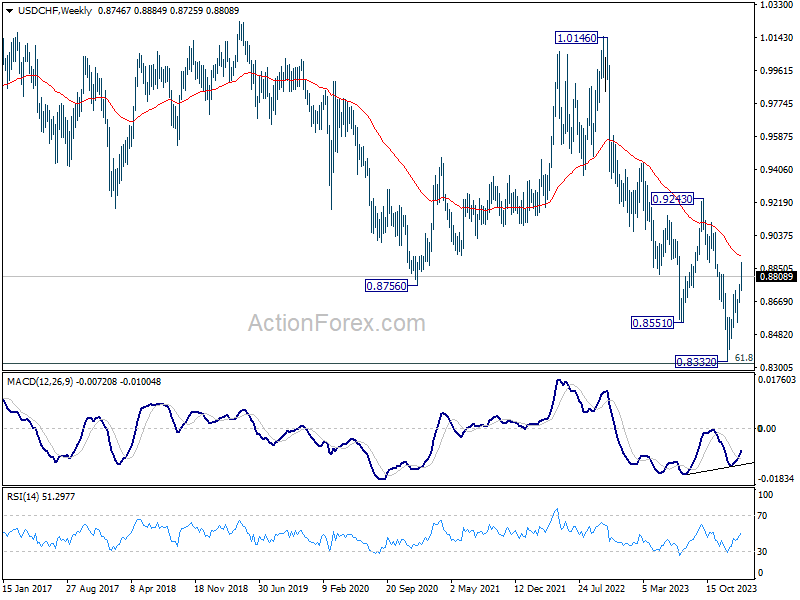
USD/CHF's rally from 0.8332 continued last week and hit as high as 0.8884. Nevertheless, with subsequent retreat, initial bias remains neutral this week first. On the upside, above 0.8884 will resume the rise and 100% projection of 0.8332 to 0.8727 from 0.8550 at 0.8954. However, sustained break of 0.8727 will dampen this bullish view, and turn bias back to the downside for 0.8550 support instead.
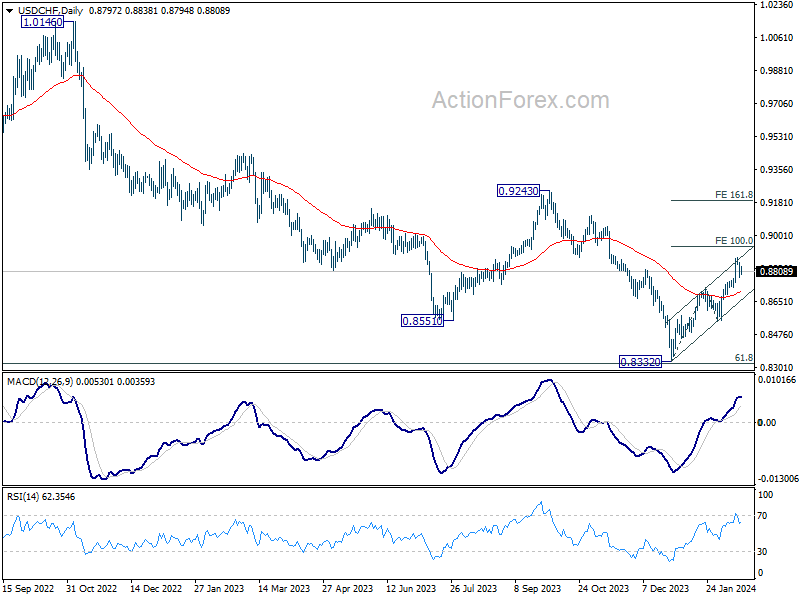
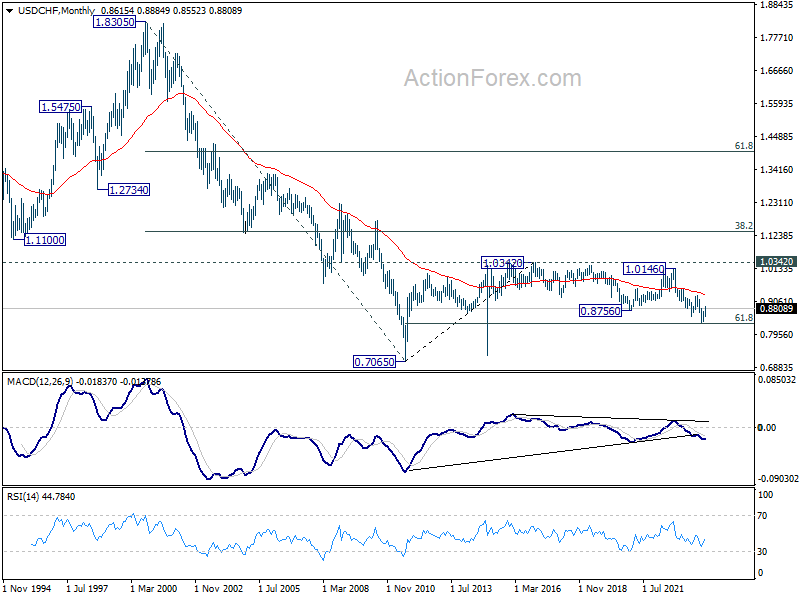
In the bigger picture, a medium term bottom should be formed at 0.8332, on bullish convergence condition in W MACD, just ahead of 0.8317 long term fibonacci support. It's still early to decide if the larger down trend from 1.0146 (2022 high) is reversing. But further rise should be seen to 0.9243 resistance even as a correction.
In the long term picture, price action from 0.7065 (2011 high) are seen as a corrective pattern to the multi-decade down trend from 1.8305 (2000 high). Strong rebound from 61.8% retracement of 0.7065 to 1.0342 (2016 high) will start the third leg as a medium term rally. But there will be no sign of long term reversal until firm break of 38.2% retracement of 1.8305 to 0.7065 at 1.1359.
AUD/USD Weekly Report
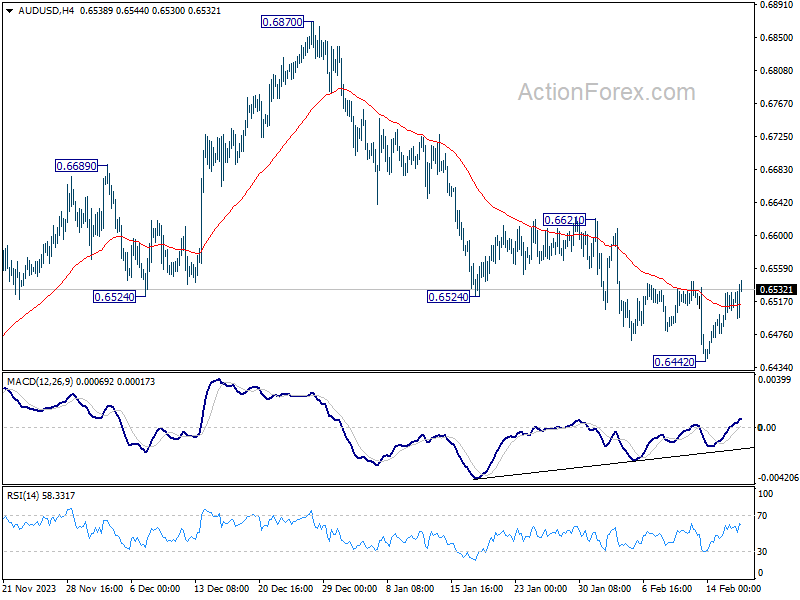
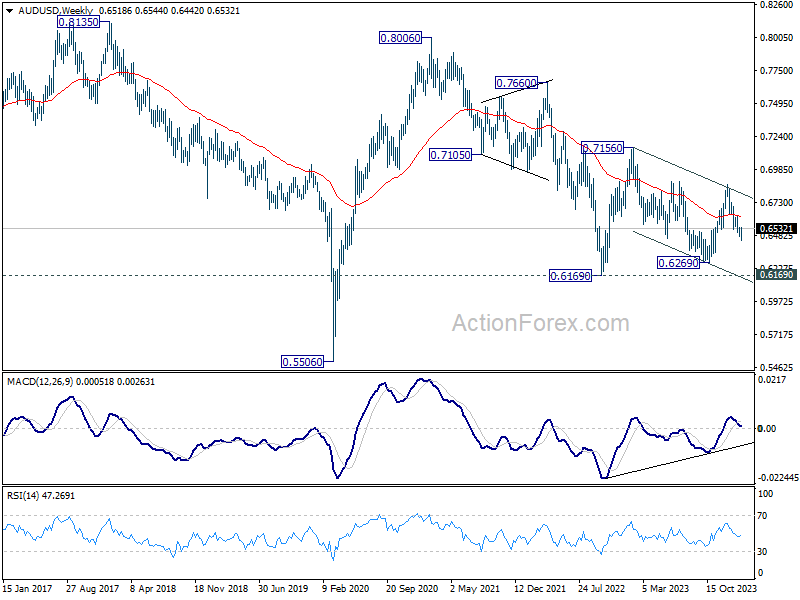
AUD/USD edged lower to 0.6642 last week but recovered since then. Initial bias stays neutral this week first. More consolidation would be seen and stronger recovery cannot be ruled out. But outlook will remain bearish as long as 0.6621 resistance holds. Break of 0.6642 will resume the decline from 0.6870 towards 0.6269 low.
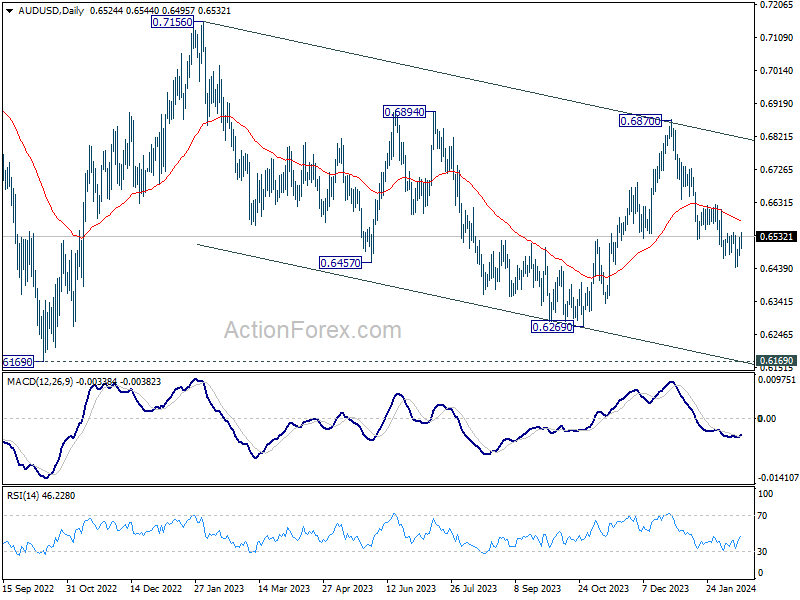
In the bigger picture, price actions from 0.6169 (2022 low) are seen as a medium term corrective pattern to the down trend from 0.8006 (2021 high). Fall from 0.7156 (2023 high) is seen as the second leg, which might still be in progress. Overall, sideway trading could continue in range of 0.6169/7156 for some more time. But as long as 0.7156 holds, an eventual downside breakout would be mildly in favor.
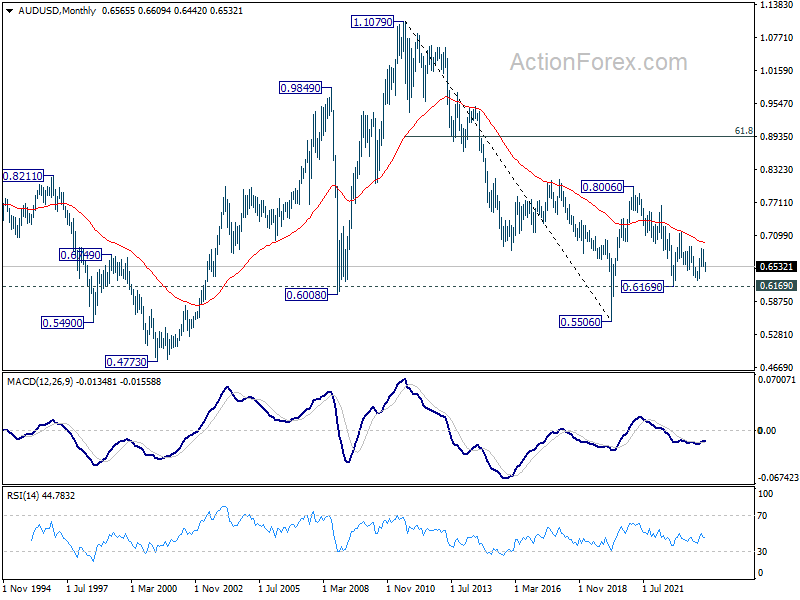
In the long term picture, the down trend from 1.1079 (2011 high) should have completed at 0.5506 (2020 low) already. It's unsure yet whether price actions from 0.5506 are developing into a corrective pattern, or trend reversal. But in either case, fall from 0.8006 is seen the second leg of the pattern. Hence, in case of deeper decline, strong support should emerge above 0.5506 to bring reversal.
USD/CAD Weekly Outlook
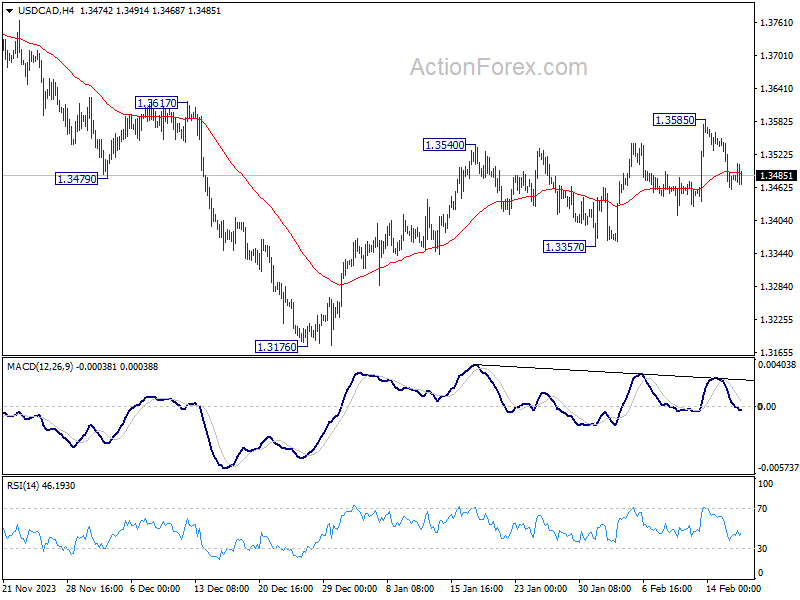
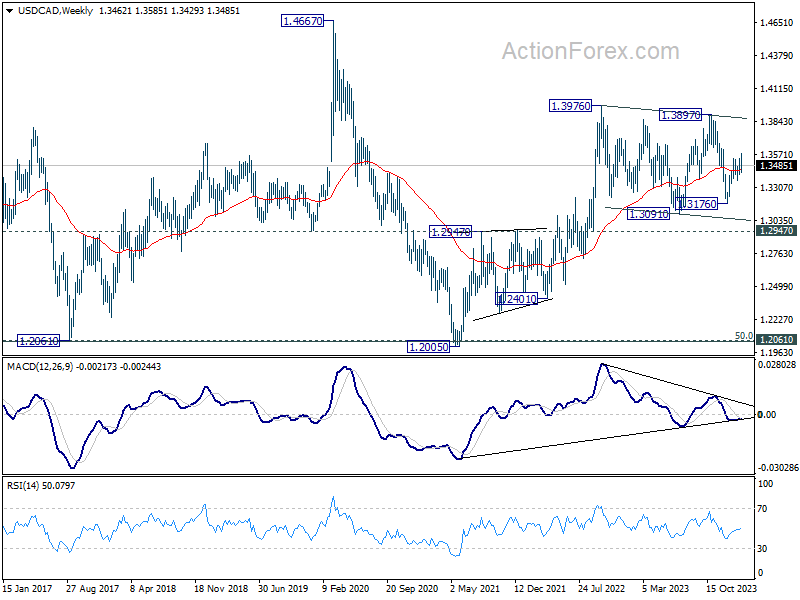
USD/CAD edged higher to 1.3585 last week but retreated since then. Initial bias remains neutral this week first. Further rally is expected as long as 1.3357 support holds. Break of 1.3585 will resume the rebound from 1.3176 for 1.3897 resistance.
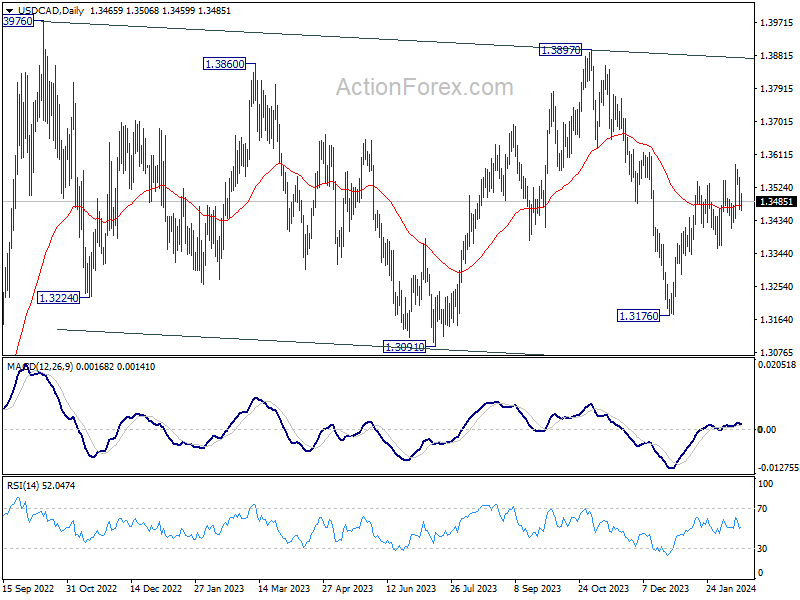
In the bigger picture, price actions from 1.3976 (2022 high) are viewed as a corrective pattern only. In case of another fall, strong support should emerge above 1.2947 resistance turned support to bring rebound. Overall, larger up trend from 1.2005 (2021 low) is still expected to resume through 1.3976 at a later stage.
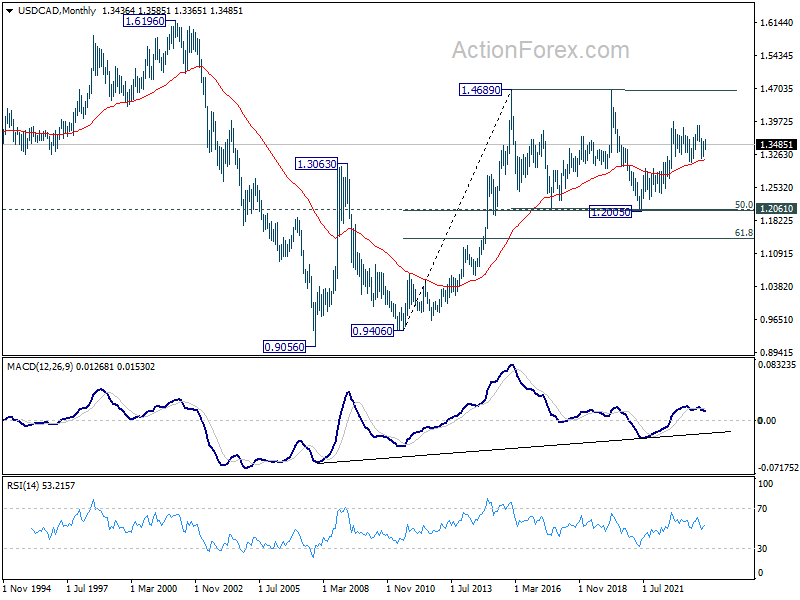
In the longer term picture, price actions from 1.4689 (2016 high) are seen as a consolidation pattern, which might have completed at 1.2005. That is, up trend from 0.9506 (2007 low) is expected to resume at a later stage. This will remain the favored case as long as 1.2947 resistance turned support holds.
GBP/JPY Weekly Outlook
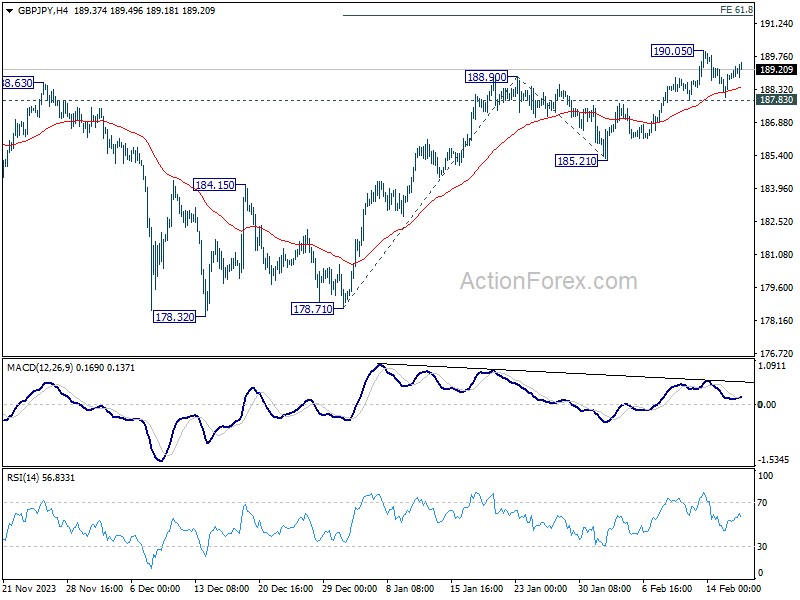
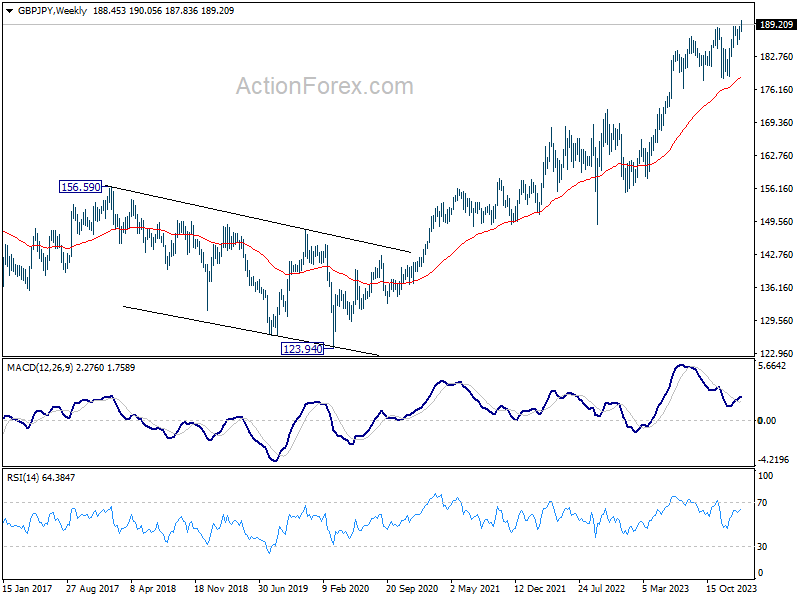
GBP/JPY's up trend resumed and edged higher to 190.05 last week, but then retreated. Initial bias remains neutral this week for more consolidations. Further rally is expected with 187.83 minor support intact. Break of 190.05 will target 61.8% projection of 178.71 to 188.90 from 185.21 at 191.50. However, break of 187.83 will turn bias to the downside for deeper correction back to 185.21 support instead.
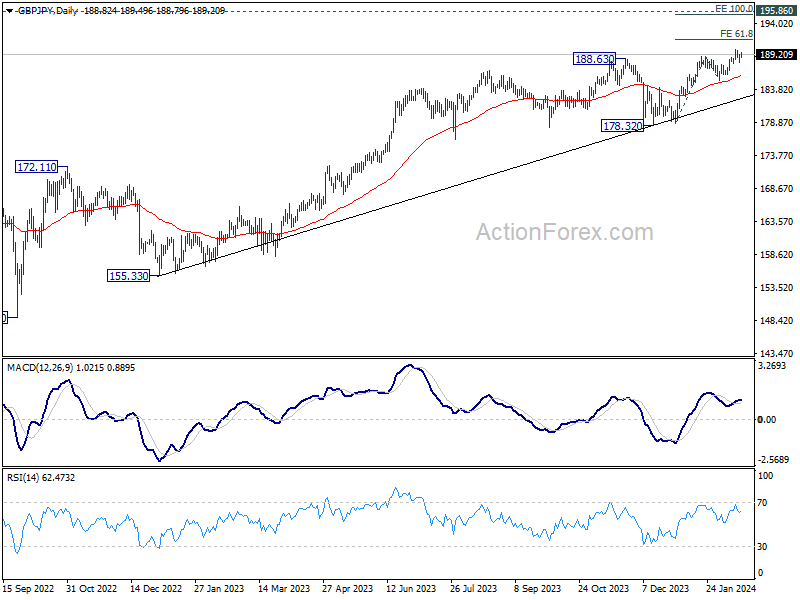
In the bigger picture, up trend from 123.94 (2020 low) in in progress. Medium term outlook will stay bullish as long as 178.32 support holds. Next target is 195.86 long term resistance (2015 high).
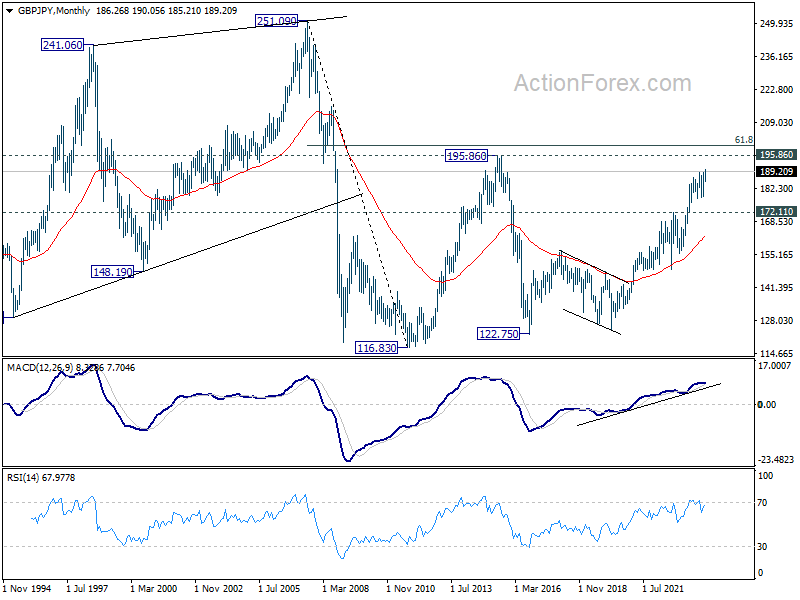
In the longer term picture, rise from 122.75 (2016 low) is seen as the third leg of the pattern from 116.83 (2011 low). Further rally will remain in favor as long as 172.11 resistance turned support holds. Break of 195.86 (2015 high) is possible. But strong resistance could be seen from 61.8% retracement of 251.09 (2007 high) to 116.83 at 199.80 to limit upside.
EUR/JPY Weekly Outlook
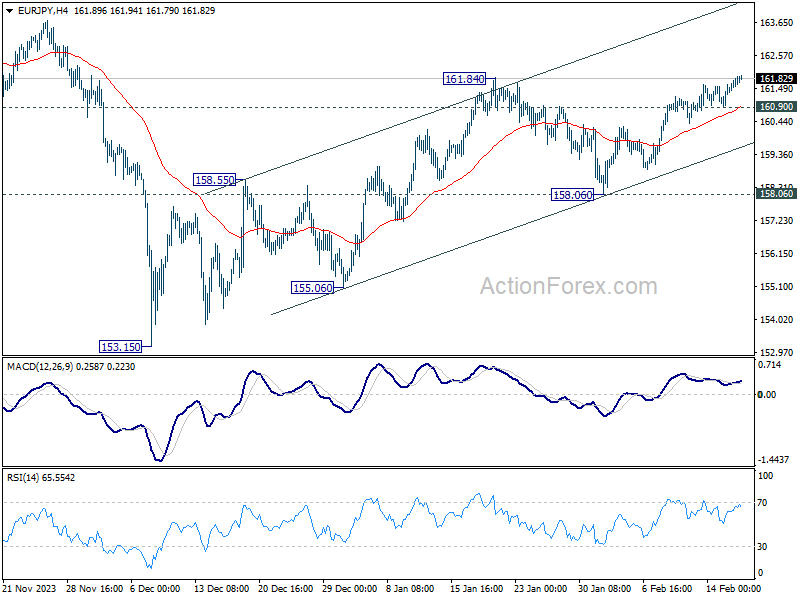
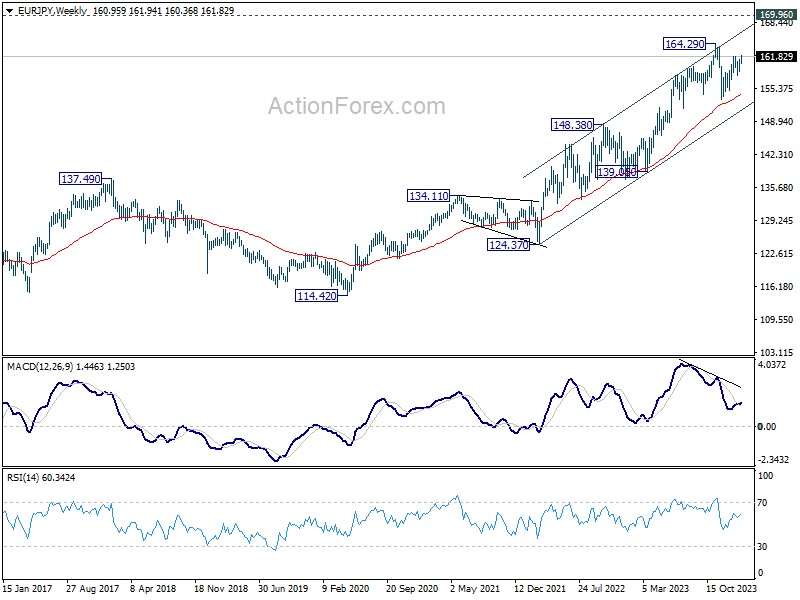
EUR/JPY's rise from 153.15 resumed by breaking 161.84 resistance last week. Initial bias remains on the upside for retesting 164.29 high next. On the downside, however, below 160.90 minor support will turn intraday bias neutral first.
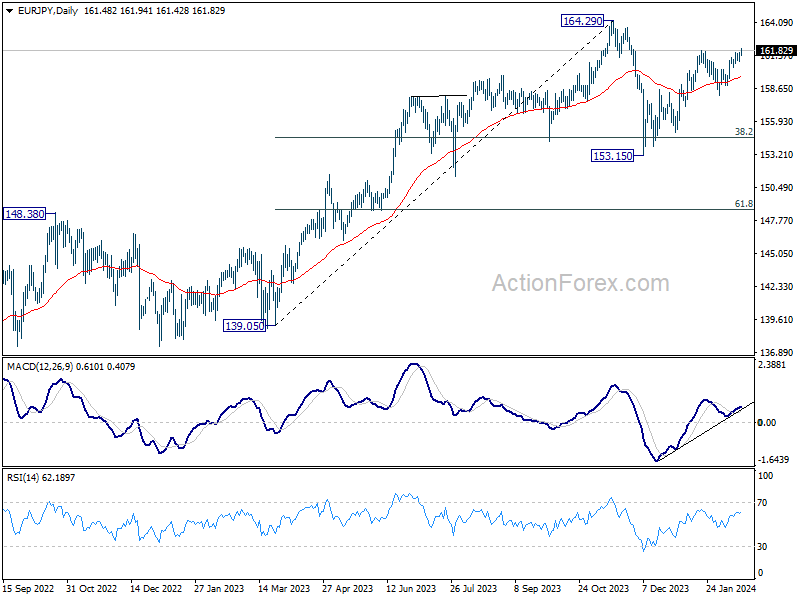
In the bigger picture, price actions from 164.29 medium term top are seen as a correction to rise from 139.05 only. As long as 148.38 resistance turned support holds (2022 high), larger up trend from 114.42 (2020 low) is expected to resume through 164.29 at a later stage. Next target would be 169.96 (2008 high).
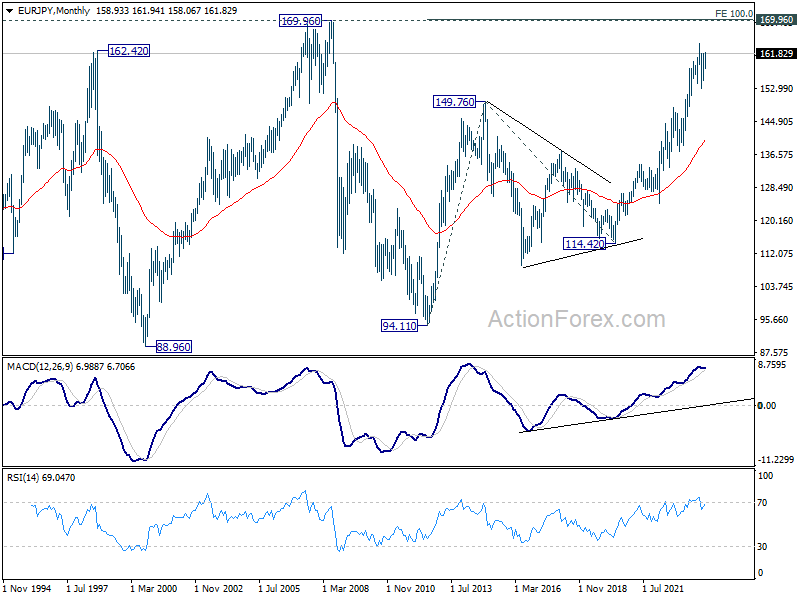
In the long term picture, rise from 114.42 (2020 low) is seen as the third leg of the whole up trend from 94.11 (2012 low). Next target is 100% projection of 94.11 to 149.76 from 114.42 at 170.07 which is close to 169.96 (2008 high). This will remain the favored case as long as 148.38 resistance turned support holds.
EUR/GBP Weekly Outlook
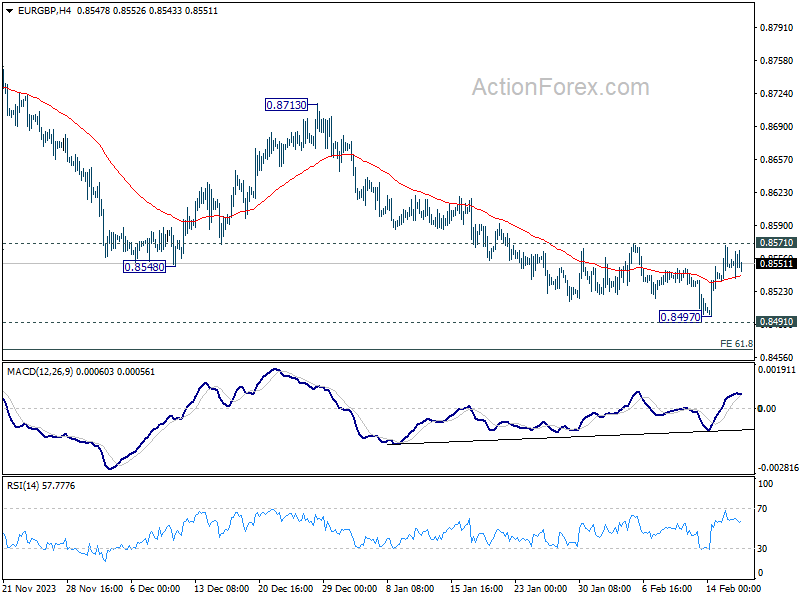
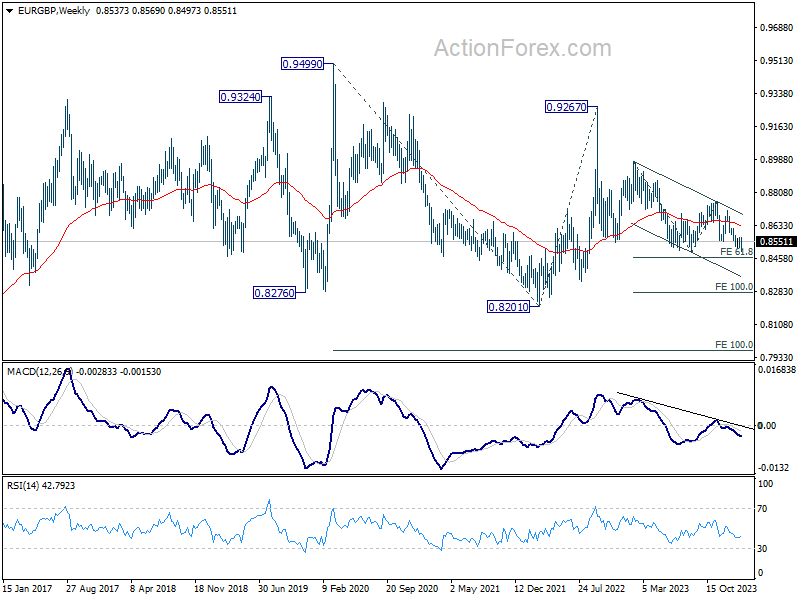
EUR/GBP edged lower to 0.8497 last week but recovered just ahead of 0.8491 support. Yet, upside is capped below 0.8571 resistance. Initial bias remains neutral this week first. On the downside, break of 0.8497 will resume recent fall to 0.8464 projection level. However, considering bullish convergence condition in 4H MACD, sustained break of 0.8571 will confirm short term bottoming, and turn bias back to the upside for stronger rebound.
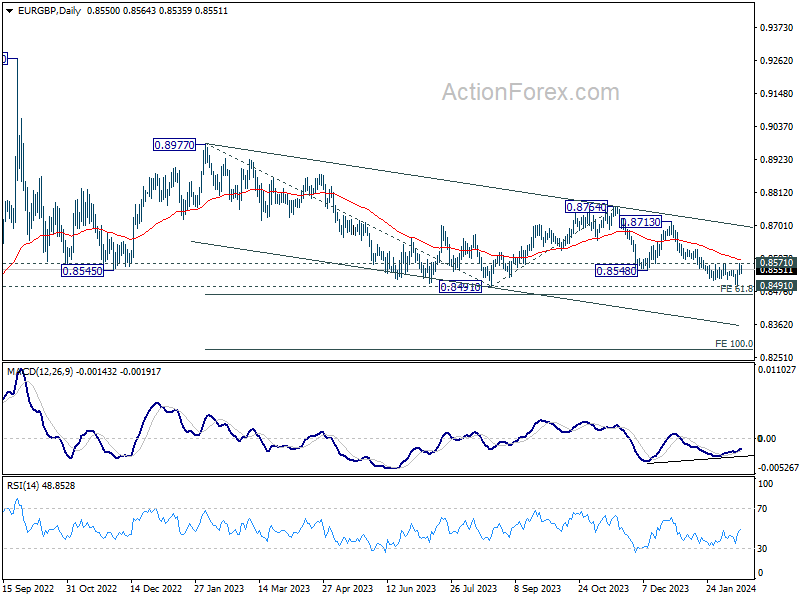
In the bigger picture, fall from 0.8764 is seen as another leg in the whole down trend from 0.9267 (2022 high). Outlook will stay bearish as long as 0.8713 resistance holds. Break of 0.8491 will target 61.8% projection of 0.8977 to 0.8491 from 0.8764 at 0.8464.
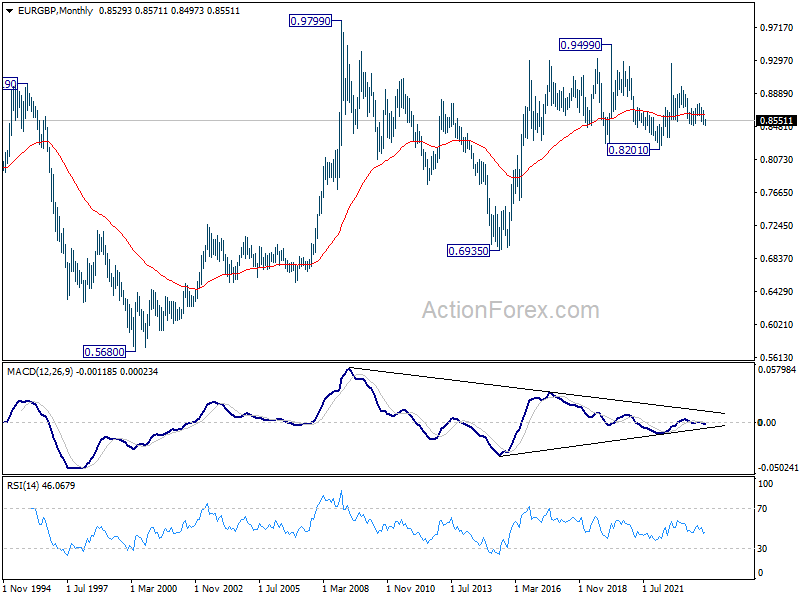
In the long term picture, price action from 0.9499 (2020 high) is seen as part of the long term range pattern from 0.9799 (2008 high). Fall from 0.9267 is the third leg of the pattern from 0.9499. Break of 0.8201 (2022 low) will target 100% projection of 0.9499 to 0.8201 from 0.9267 at 0.7969.
EUR/AUD Weekly Outlook
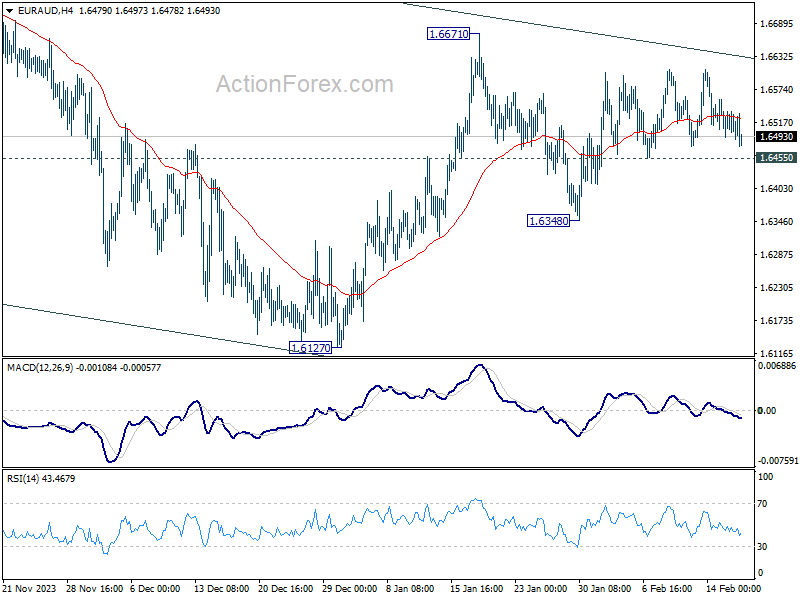
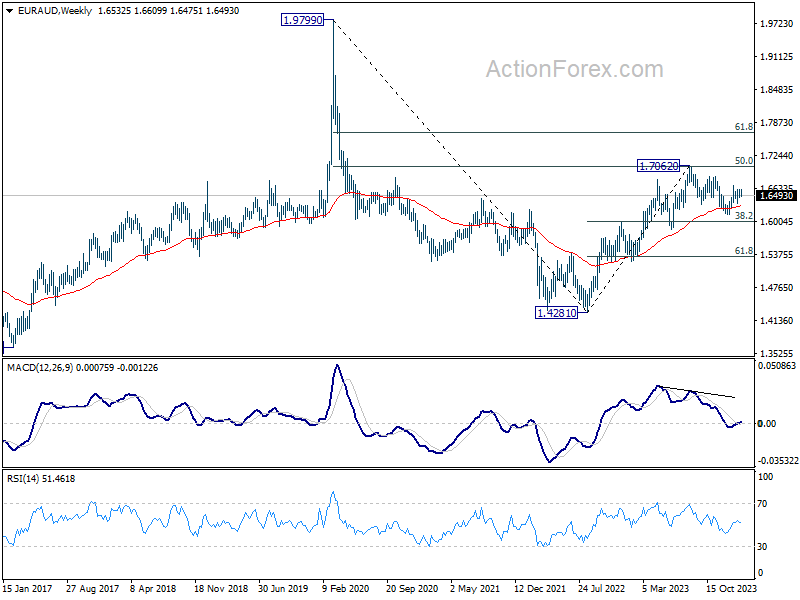
Sideway trading continued in EUR/AUD last week and outlook is unchanged. Initial bias remains neutral this week first. On the upside, decisive break of 1.6671 will revive the case that whole correction from 1.7062 has completed with three waves down to 1.6127. Further rally should then be seen to 1.6844 resistance for confirmation. Nevertheless, below 1.6455 minor support will turn bias to the downside for 1.6348 and possibly below.
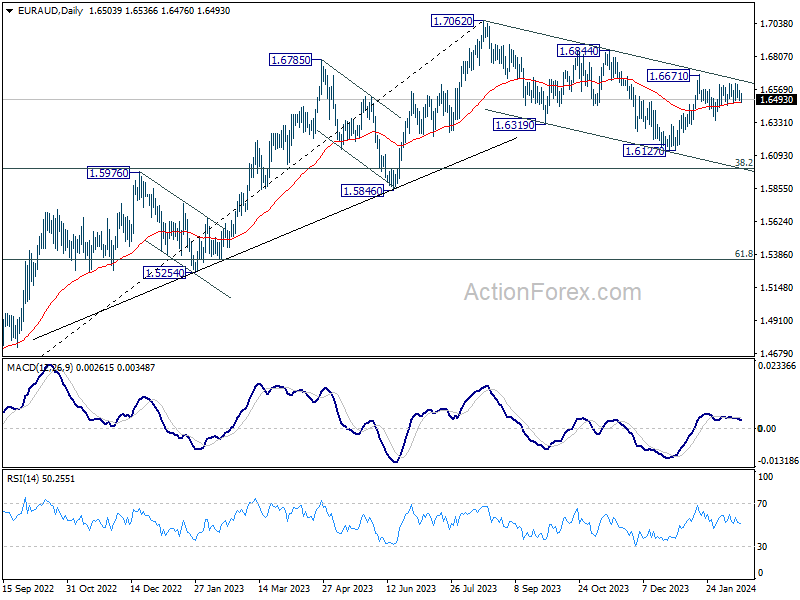
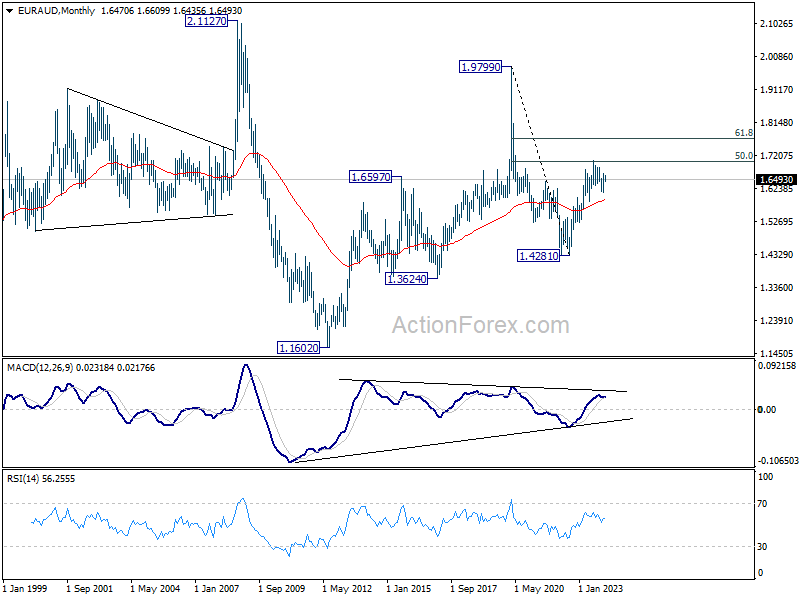
In the bigger picture, fall from 1.7062 medium term top is seen as a correction to the up trend from 1.4281 (2022 low). Break of 1.6844 resistance will argue that this up trend is ready to resume through 1.7062 high. In case of another fall, strong support should be seen around 1.5846 and 38.2% retracement of 1.4281 to 1.7062 at 1.6000 to bring rebound.
In the longer term picture, price actions from 1.9799 (2020 high) are seen as a long term decline at the same scale as the rise from 1.1602 (2012 low). Rebound from 1.4281 is seen as the second leg. As long as 55 M EMA (now at 1.5902) holds, this second leg could still extend higher. However, sustained trading below 55 M EMA will open up the bearish case for extending the decline through 1.4281 low.
EUR/CHF Weekly Outlook
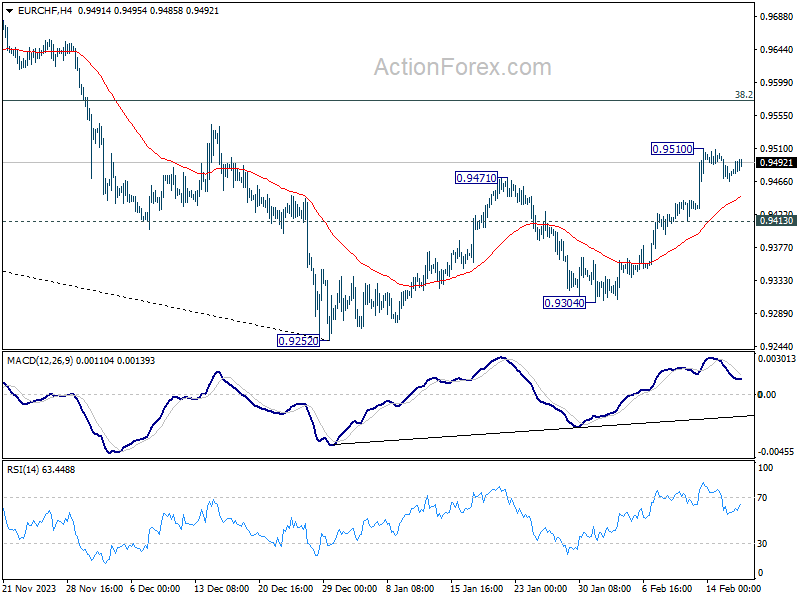
EUR/CHF's rebound from 0.9252 resumed by breaking through 0.9471 resistance last week. But as a temporary top was formed at 0.9510, initial bias remains neutral this week for more consolidations. Downside of retreat should be contained by 0.9413 minor support to bring another rally. On the upside, break of 0.9510 target 0.9574 fibonacci level next.
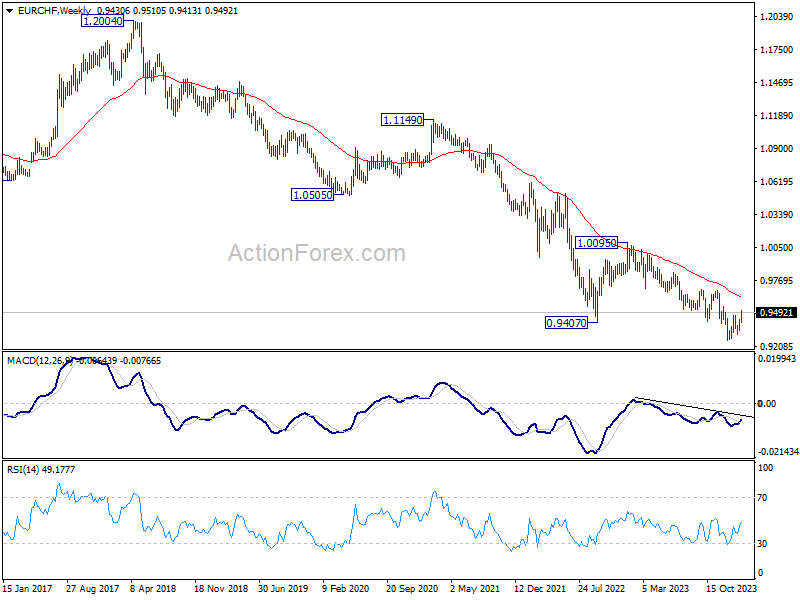
In the bigger picture, price actions from 0.9252 are tentatively seen as a correction to the five-wave down trend from 1.0095 (2023 high). Further rise would be seen to 38.2% retracement of 1.0095 to 0.9252 at 0.9574 and possibly above. But overall medium term outlook will remain bearish as long as 0.9683 resistance holds.
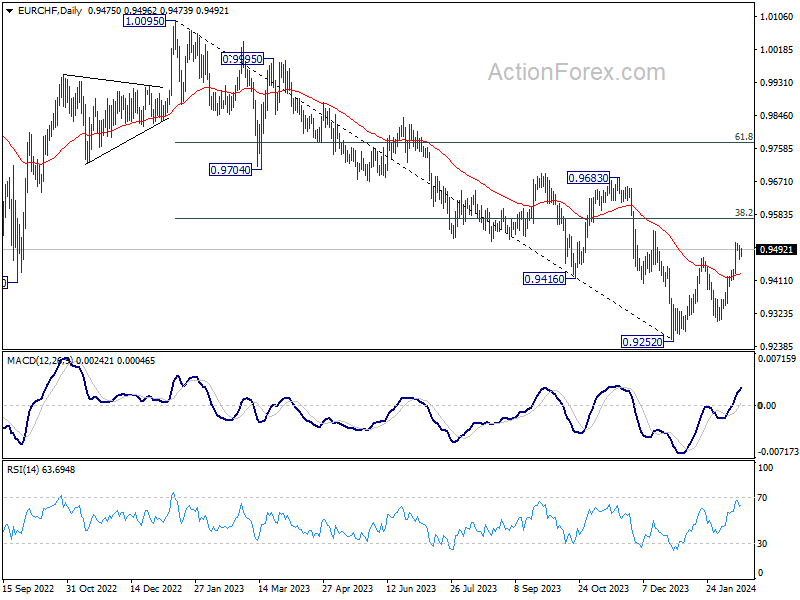
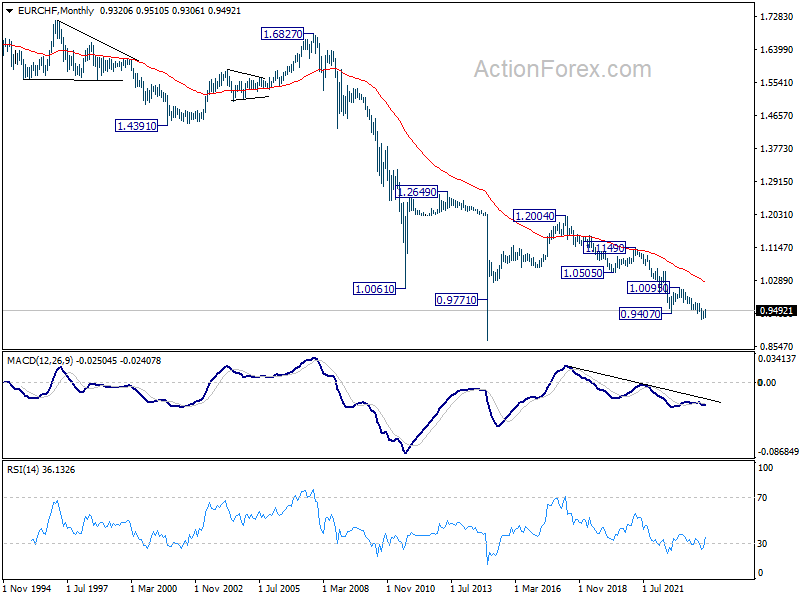
In the long term picture, fall from 1.2004 (2018 high) is part of the multi-decade down trend. Firm break of 1.0095 resistance is needed to be the first sign of long term bottoming. Otherwise, outlook will remain bearish.