

Sample Category Title
EUR/AUD Daily Outlook
Daily Pivots: (S1) 1.6132; (P) 1.6181; (R1) 1.6234; More..
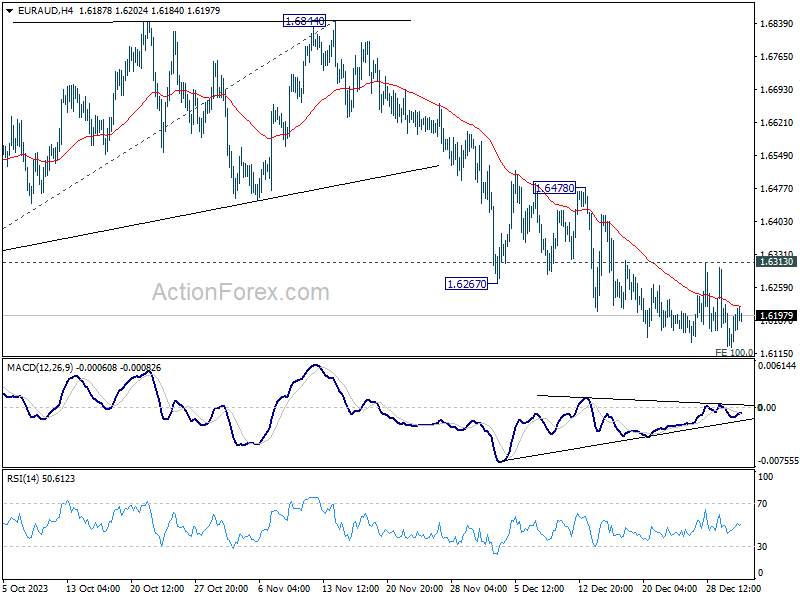
Further decline could be seen in EUR/AUD with 1.6313 minor resistance holds. But considering bullish convergence condition in 4H MACD, stronger support could be seen from 100% projection of 1.7062 to 1.6319 from 1.6844 at 1.6106 to bring rebound. On the upside, firm break of 1.6313 resistance should indicate short term bottoming, and turn bias back to the upside for 1.6478 resistance.
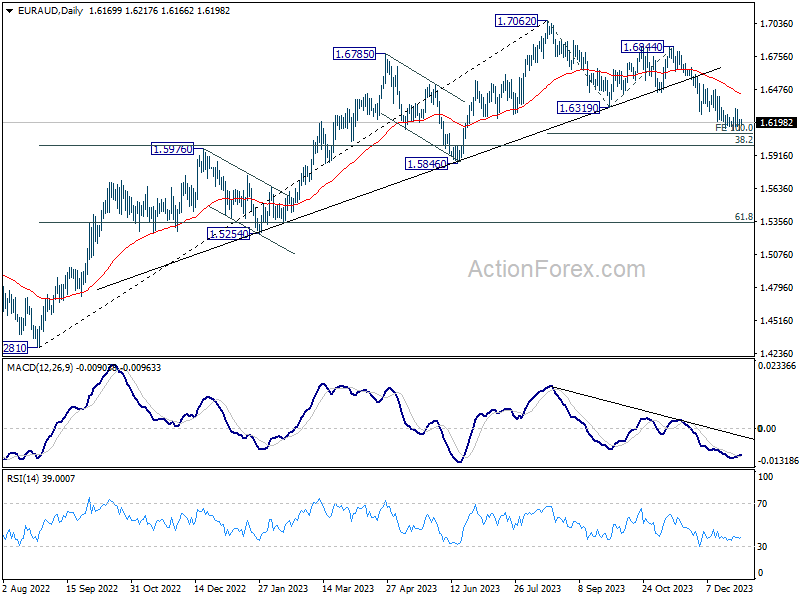
In the bigger picture, fall from 1.7062 medium term top is seen as correcting the whole up trend from 1.4281 (2022 low). Deeper decline would be seen to 38.2% retracement of 1.4281 to 1.7062 at 1.6000. Strong support could be seen there to bring rebound on first attempt. But risk will stay on the downside as long as 1.6844 resistance holds. Sustained break of 1.6000 would bring further fall to 61.8% retracement at 1.5343.
EUR/CHF Daily Outlook
Daily Pivots: (S1) 0.9121; (P) 0.9455; (R1) 0.9639; More...
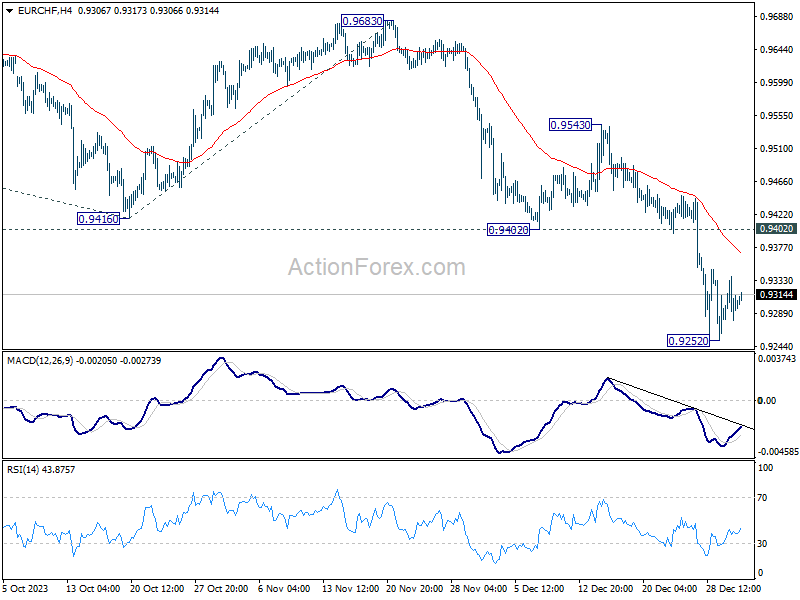
Intraday bias in EUR/CHF stays neutral for consolidation above 0.9252. While stronger recovery might be seen, further decline is expected as long as 0.9402 support turned resistance holds. On the downside, break of 0.9252 will resume larger down trend. Next target is 100% projection of 0.9995 to 0.9416 from 0.9683 at 0.9104 next.
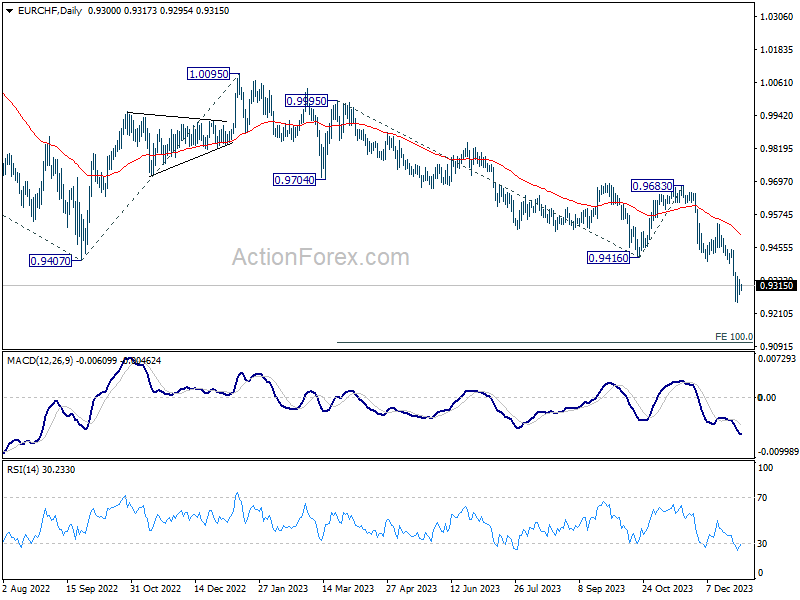
In the bigger picture, medium term outlook remains bearish as long as 0.9683 resistance holds. Current fall from 1.2004 (2018 high) is part of the multi-decade down trend. Next target is 61.8% projection of 1.1149 (2020 high) to 0.9407 from 1.0095 at 0.9018.
USD/CAD Daily Outlook
Daily Pivots: (S1) 1.3256; (P) 1.3295; (R1) 1.3361; More...
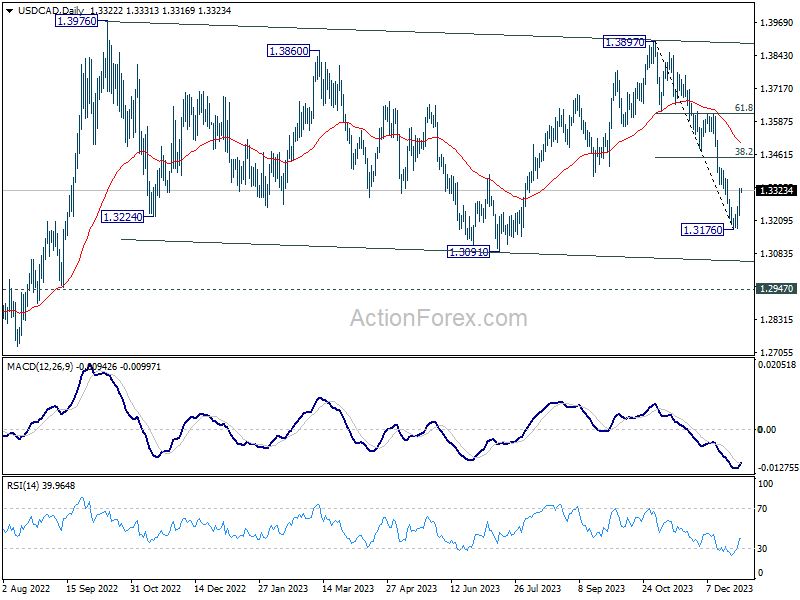
Intraday bias in USD/CAD remains mildly on the upside for the moment. Rebound from 1.3176 short term bottom should extend to 38.2% retracement of 1.3897 to 1.3176 at 1.3451. On the downside, break of 1.3176 is needed to confirm resumption of the fall from 1.3897. Otherwise, risk is mildly on the upside in case of retreat.
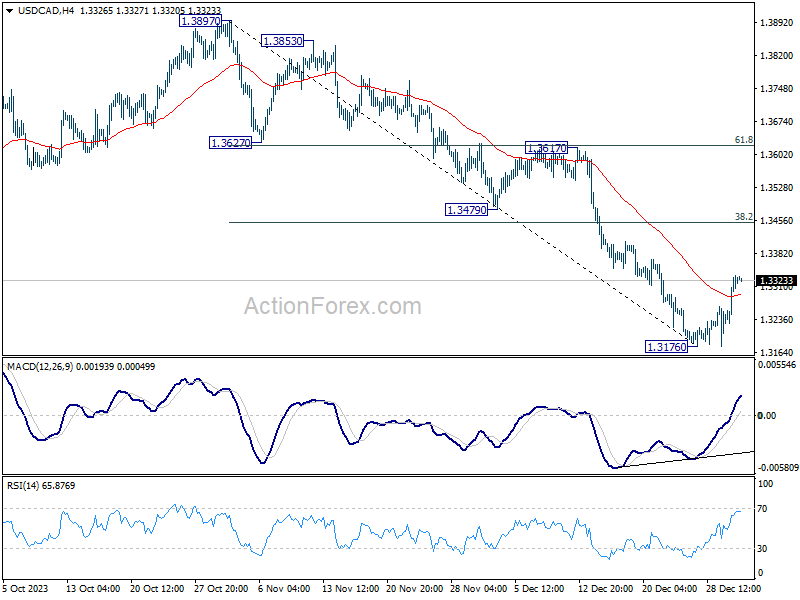
In the bigger picture, outlook is mixed up by deeper then expected fall from 1.3897. But after all, price actions from 1.3976 (2022 high) are viewed as a corrective pattern that's in progress. Larger up trend from 1.2005 (2021 low) is still expected to resume at a later stage as long as 1.2947 resistance turned support holds.
AUD/USD Daily Report
Daily Pivots: (S1) 0.6731; (P) 0.6786; (R1) 0.6815; More...
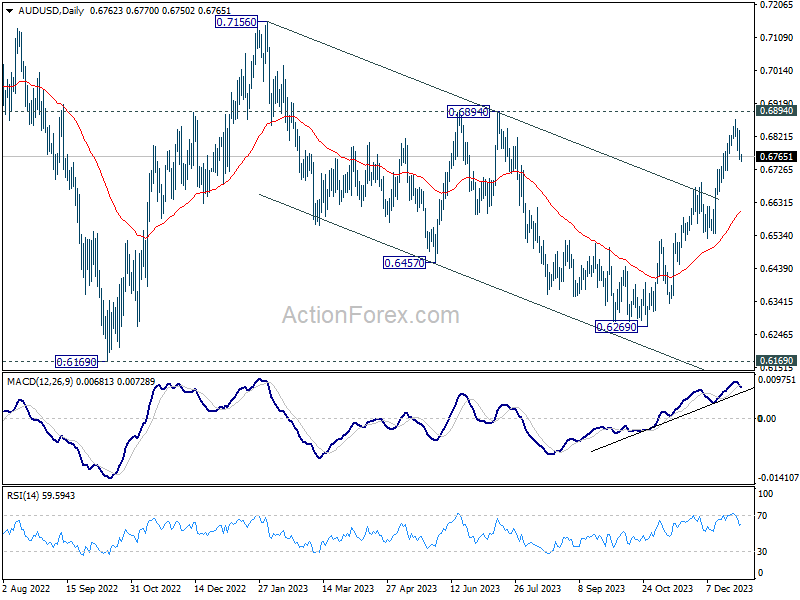
A short term top should be in place at 0.6870 in AUD/USD, on bearish divergence condition in 4H MACD, ahead of 0.6894 resistance. Intraday bias is mildly on the downside for deeper pull back to 0.6689 resistance turned support next. On the upside, break of 0.6870 is needed to to confirm rally resumption. Otherwise, risk will stay mildly on the downside in case of recovery.
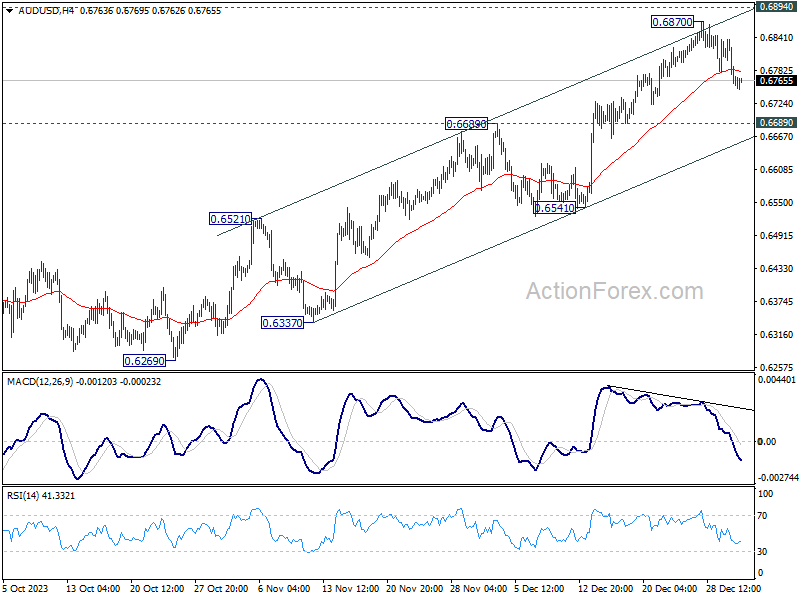
In the bigger picture, there is no confirmation that down trend from 0.8006 (2021 high) has completed. Price actions from 0.6169 (2022 low) could be just a medium term corrective pattern. Rise from 0.6269 is seen as the third leg of the pattern. For now, range trading should be seen between 0.6169 and 0.7156 (2023 high), until further developments.
USD/JPY Daily Outlook
Daily Pivots: (S1) 141.13; (P) 141.67; (R1) 142.54; More...
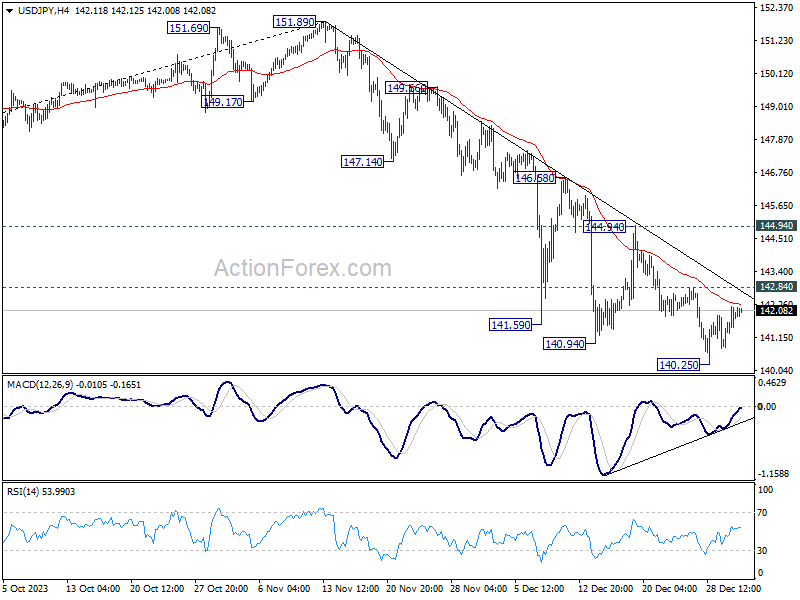
Intraday bias in USD/JPY remains neutral, and further decline is in favor as long as 142.84 minor resistance holds. Break of 140.25 will resume fall from 151.89 and target 136.63 fibonacci level. Nevertheless, break of 142.84 will turn bias back to the upside for stronger rebound.
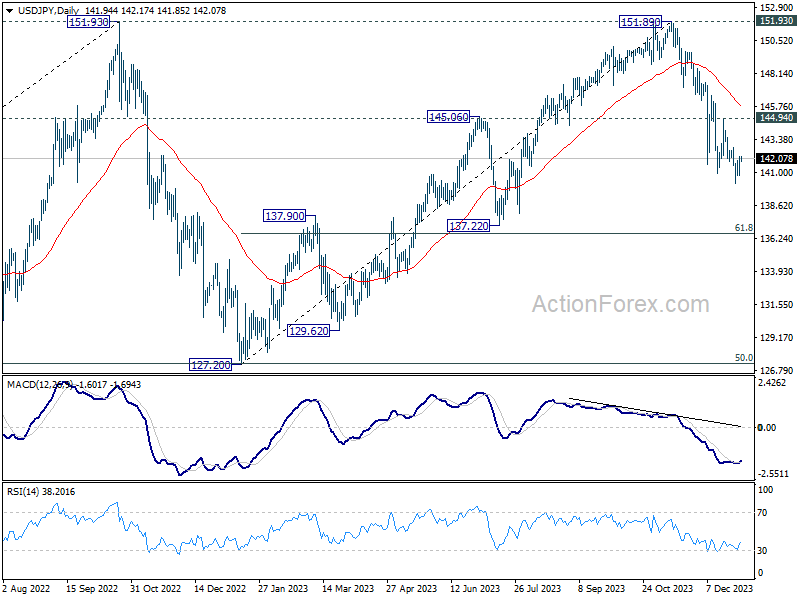
In the bigger picture, fall from 151.89 is seen as the third leg of the corrective pattern from 151.93 (2022 high). Deeper decline would be seen to 61.8% retracement of 127.20 to 151.89 at 136.63, sustained break there will pave the way to 127.20 support (2022 low). This will now remain the favored as long as 144.94 resistance holds.
USD/CHF Daily Outlook
Daily Pivots: (S1) 0.8308; (P) 0.8585; (R1) 0.8779; More....
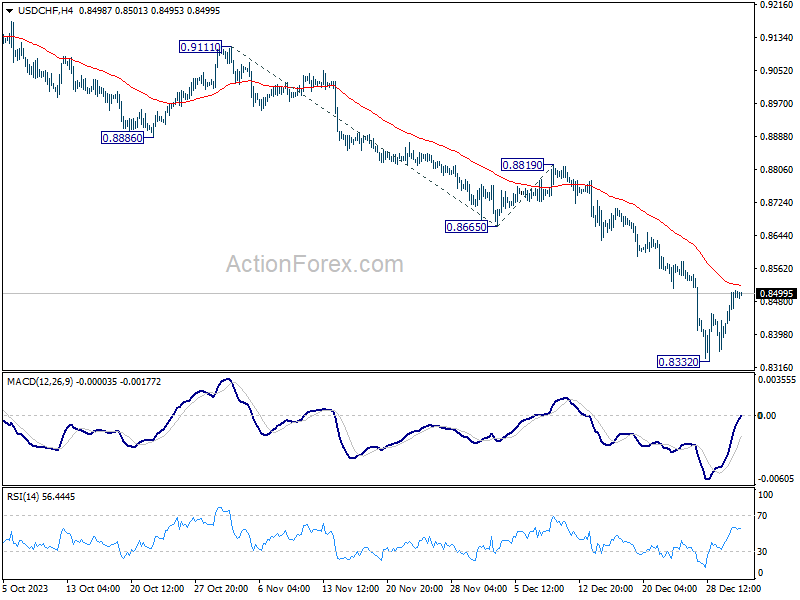
Intraday bias in USD/CHF stays neutral at this point. Consolidation from 0.8332 is extending and stronger recovery cannot be ruled out. But outlook will stay bearish as long as 0.8665 support turned resistance holds. Break of 0.8332 will resume larger fall from 0.9243 to 138.2% projection of 0.9111 to 0.8665 from 0.8819 at 0.8203 next.
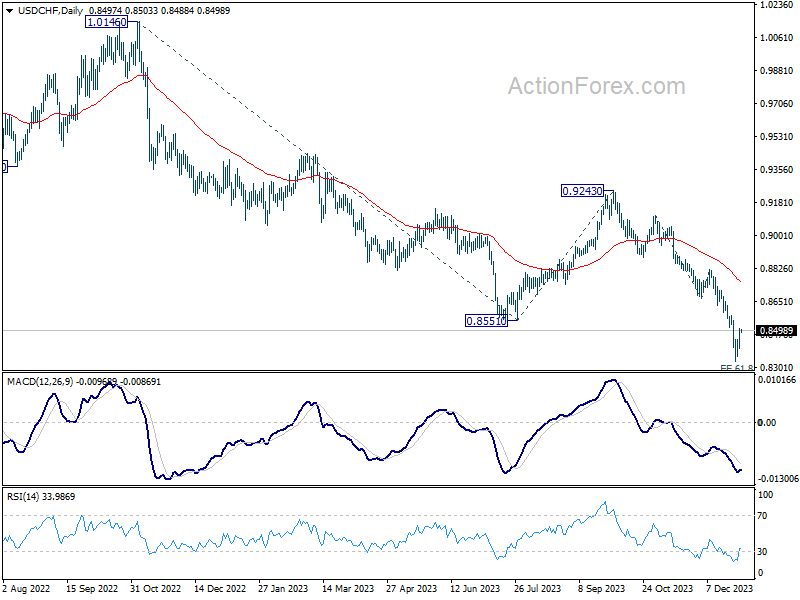
In the bigger picture, break of 0.8551 support indicates resumption of whole decline from 1.0146 (2022 high). Next target is 61.8% retracement of 1.0146 to 0.8551 from 0.9243 at 0.8257. Sustained break there could prompt downside acceleration to 100% projection at 0.7648. This will now remain the favored case as long as 0.8819 resistance holds.
EUR/USD Daily Outlook
Daily Pivots: (S1) 1.0901; (P) 1.0978; (R1) 1.1019; More...
Intraday bias in EUR/USD remains neutral as 1.0929 support stays intact. On the upside, break of 1.1138 will resume the rise from 1.0447 to retest 1.1274 high. Meanwhile, break of 1.0929 will indicate short term topping and turn bias back to the downside for 1.0772 support.
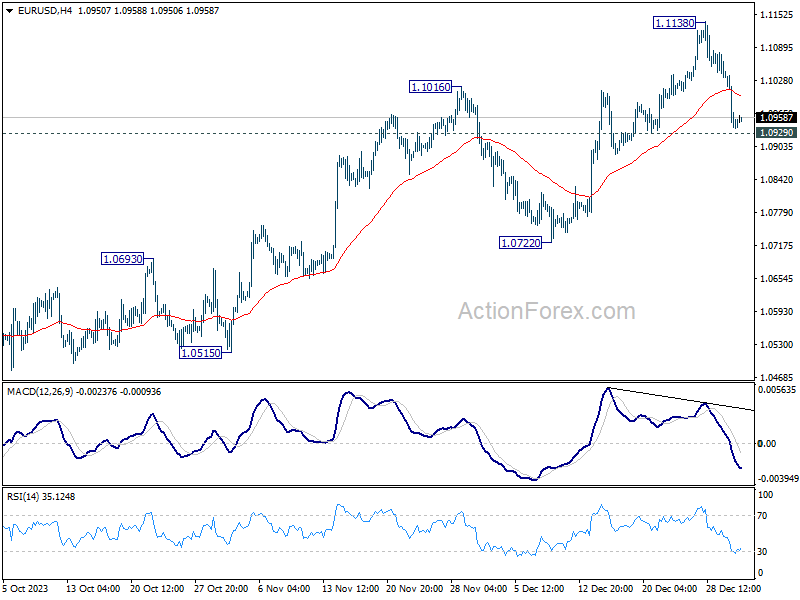
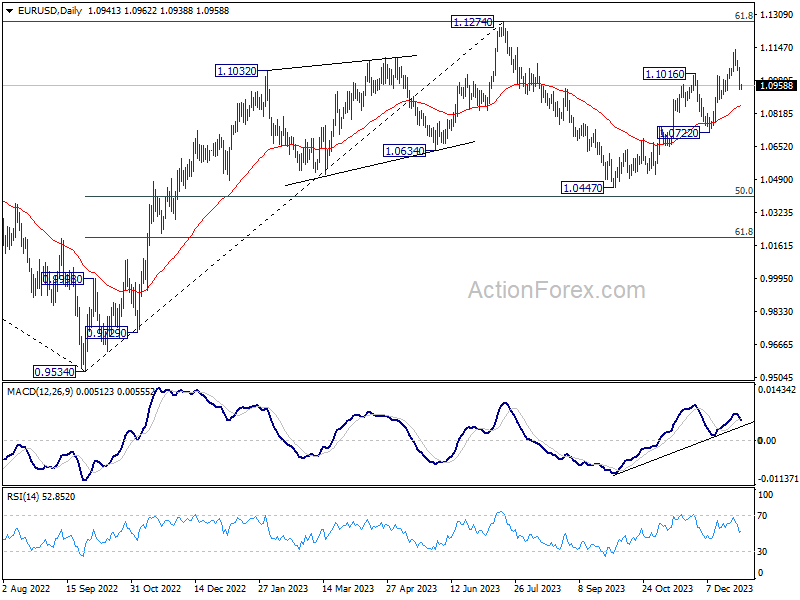
In the bigger picture, price actions from 1.1274 are viewed as a corrective pattern to rise from 0.9534 (2022 low). Rise from 1.0447 is seen as the second leg. While further rally could cannot be ruled out, upside should be limited by 1.1274 to bring the third leg of the pattern. Meanwhile, sustained break of 1.0722 support will argue that the third leg has already started for 1.0447 and below.
US Data in Focus
In focus today
Today's centre of attention will be the US. At 16:00 CET, ISM manufacturing and JOLTs are released. Consensus points to a modest uptick in ISM, though some early indicators suggest a print below 50 and thus still contracting. In respect of the jobs report on Friday, JOLTs will be key to follow. The most recent figures from October showed some cooling in labour markets, and another benign print would bring comfort for the Fed. Lastly, FOMC minutes are released in at 20:00 CET. We believe that it is imperative to follow whether some of the participants have been more worried about the recent easing in financial conditions than what Powell hinted.
In Europe, Germany will release unemployment figures for December, while Denmark's FX reserve for December will be released in the afternoon.
In Asia, final Nikkei manufacturing PMI for December and Caixin service PMI are scheduled to be released overnight.
Economic and market news
What happened yesterday: The first trading session of the year was characterized by markets lowering expectations for rate cuts in 2024. Rising yields provided headwinds to equities - particularly tech stocks which fell more than 2% for the day. Oil prices rose in the early hours of the session following Iran's decision to deploy a warship in the Red Sea. However, the gains were erased amid interest rate jitters and risk-off sentiment outweighing geopolitical uncertainty. Thus, Brent ended the session down by 3% (USD75.7/barrel).
Yesterday was very light on macro data. The M3 measure of money supply for November proved to be quite uneventful, printing -0.9% y/y (prior: -1.0%). Moreover, the majority of final manufacturing PMIs for December was marginally revised.
China: Similarly to Western equities, Chinese stocks were weaker overnight, though tech stocks gained little amid signs indicating easing restrictions imposed on the industry. In light of geopolitics, Taiwan spotted Chinese balloons near a Taiwanese air base. This puts China in the geopolitical spotlight - in particular due to the episode with the US last year and the upcoming election in Taiwan. Additionally, the geopolitical uncertainty related to the conflict in the Red Sea is beginning to have a measurable impact on global supply chains. For instance, the Shanghai Containerized Freight index has risen 60% over the past two weeks due to the conflict in the Red Sea.
Equities: Equities started the new year on a quite weak note. Equities were mostly lower which accelerated into the US session with S&P 500 -0.6% and Nasdaq -1.6% as big tech came up for sale. However, this was not investors taking home profits from equities, but much more rebalancing back into defensives. Telecom, pharma and staples were even up 2%, outperforming semis by 5p.p. No certain trigger behind it, but manufacturing weakness in December is probably one explanation. Cyclicals outperformed defensives by 30% in 2023, hence risk reward is stretched. We recommend finding beta in small caps instead of large cap cyclicals. US futures are continuing lower this morning.
FI: The global bond market continued the sell-off that began late last week with 10Y US Treasuries rising some 5bp and 10Y Bunds rising 5bp.
FX: The USD had its best trading day since October as EUR/USD fell back below 1.10 as risk sentiment soured on the back of rising US yields. Scandies had a tough session, in particular the NOK which lost close to 2% vs the USD, feeling the hurt not only from risk sentiment but also lower oil prices. At the other end of the risk spectra, the CHF continued on the strong end to 2023 with a solid first session of 2024.
NZD/USD Technical: Pulled Back Towards Potential Bullish Inflection Zone
- Medium-term uptrend phase from 26 October 2023 remains intact.
- 6240 is the potential bullish inflection level.
- Hourly RSI has flashed a bullish momentum breakout condition.
The Kiwi (NZD/USD) has been oscillating within a medium-term uptrend phase in place since 26 October 2023 low of 0.5774. So far, it has rallied by +596 pips/+10.3% to print a recent intraday high of 0.6370 on 28 December 2023.
There were two prior minor pullbacks seen within this ongoing medium-term uptrend; 3 November 2023 to 14 November 2023 (-143 pips/-2.4%), and 4 December 2023 to 13 December 2023 (-138 pips/-2.2%). The latest pullback in price actions from the 28 December high to today, 3 January current intraday low of 0.6245 at this time of the writing is slightly lesser in magnitude (-124 pips/-1.95%) versus the prior pullbacks.
Potential start of new bullish impulsive upmove
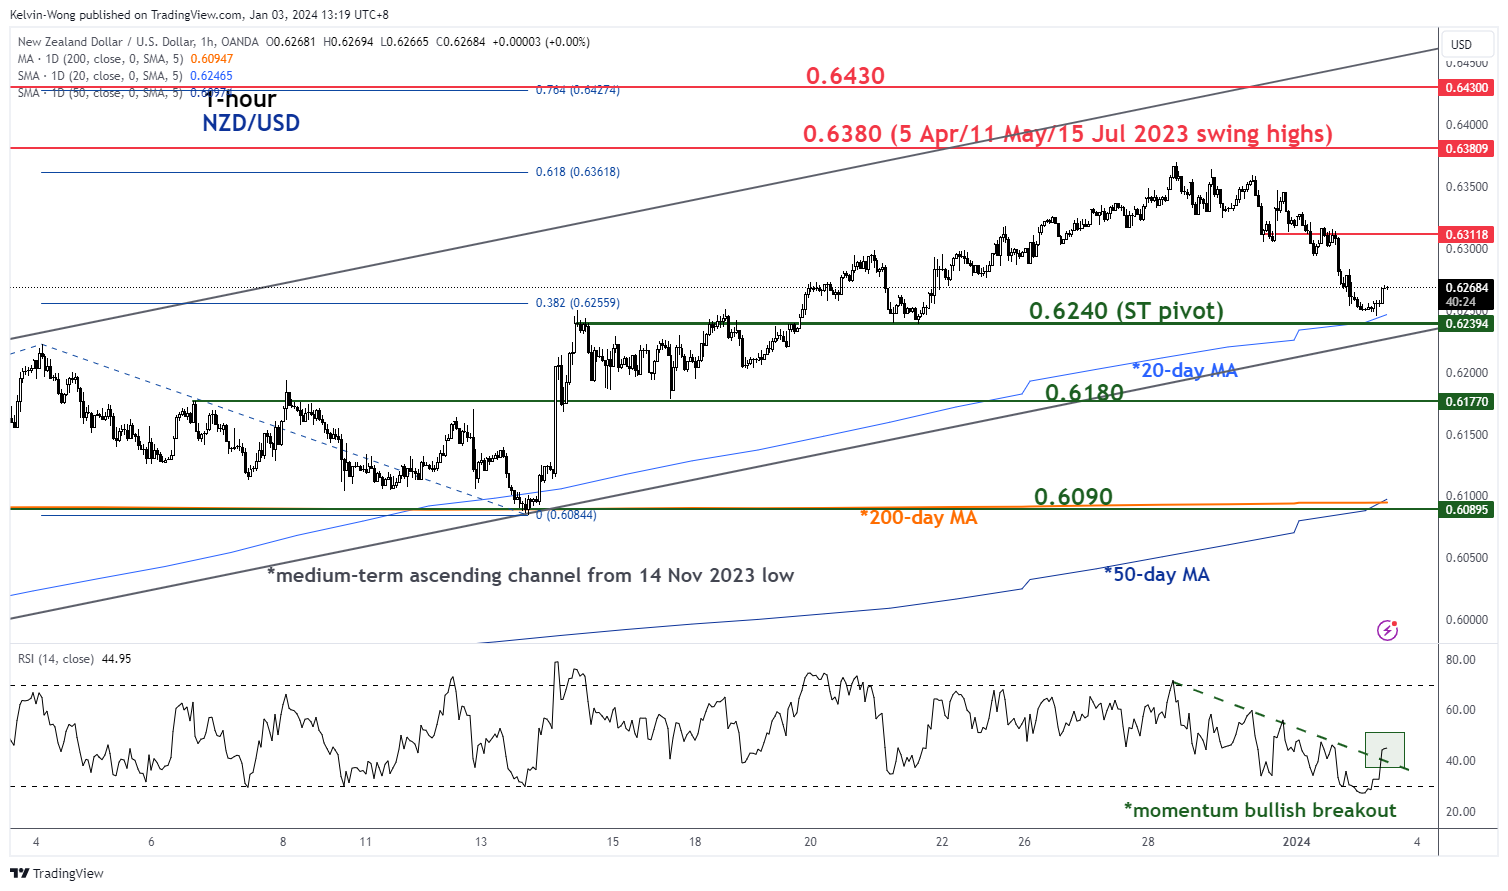
Fig 1: NZD/USD minor short-term trend as of 2 Jan 2024 (Source: TradingView, click to enlarge chart)
Interestingly, the current pullback has stalled right at the potential bullish inflection zone; the 20-day upward-sloping moving average, the lower boundary of a medium-term ascending channel in place since 14 November 2023 low, and the 23.6% Fibonacci retracement of the medium-term uptrend phase from 26 October 2023 low to 28 December 2023 high).
In addition, the hourly RSI momentum indicator has just staged a momentum bullish breakout after it dipped into its oversold region during yesterday, 2 January US session.
All in all, this set of positive technical elements suggests that the current slide seen in NZD/USD from its 28 December 2023 high of 0.6370 may have hit a potential tipping point where its price actions may kickstart another bullish impulsive upmove sequence to resume its medium-term uptrend trajectory.
Watch the 0.6240 key short-term pivotal support and clearance above 0.6310 sees the next intermediate resistances coming in at 0.6380 and 0.6430.
On the other hand, failure to hold at 0.6240 invalidates the bullish scenario for an extension of the corrective pullback to expose the next intermediate supports at 0.6180 and 0.6090 (also the 50 & 200-day moving averages).
Dow Futures (YM) Looking to Extend Higher to Complete Impulsive Structure
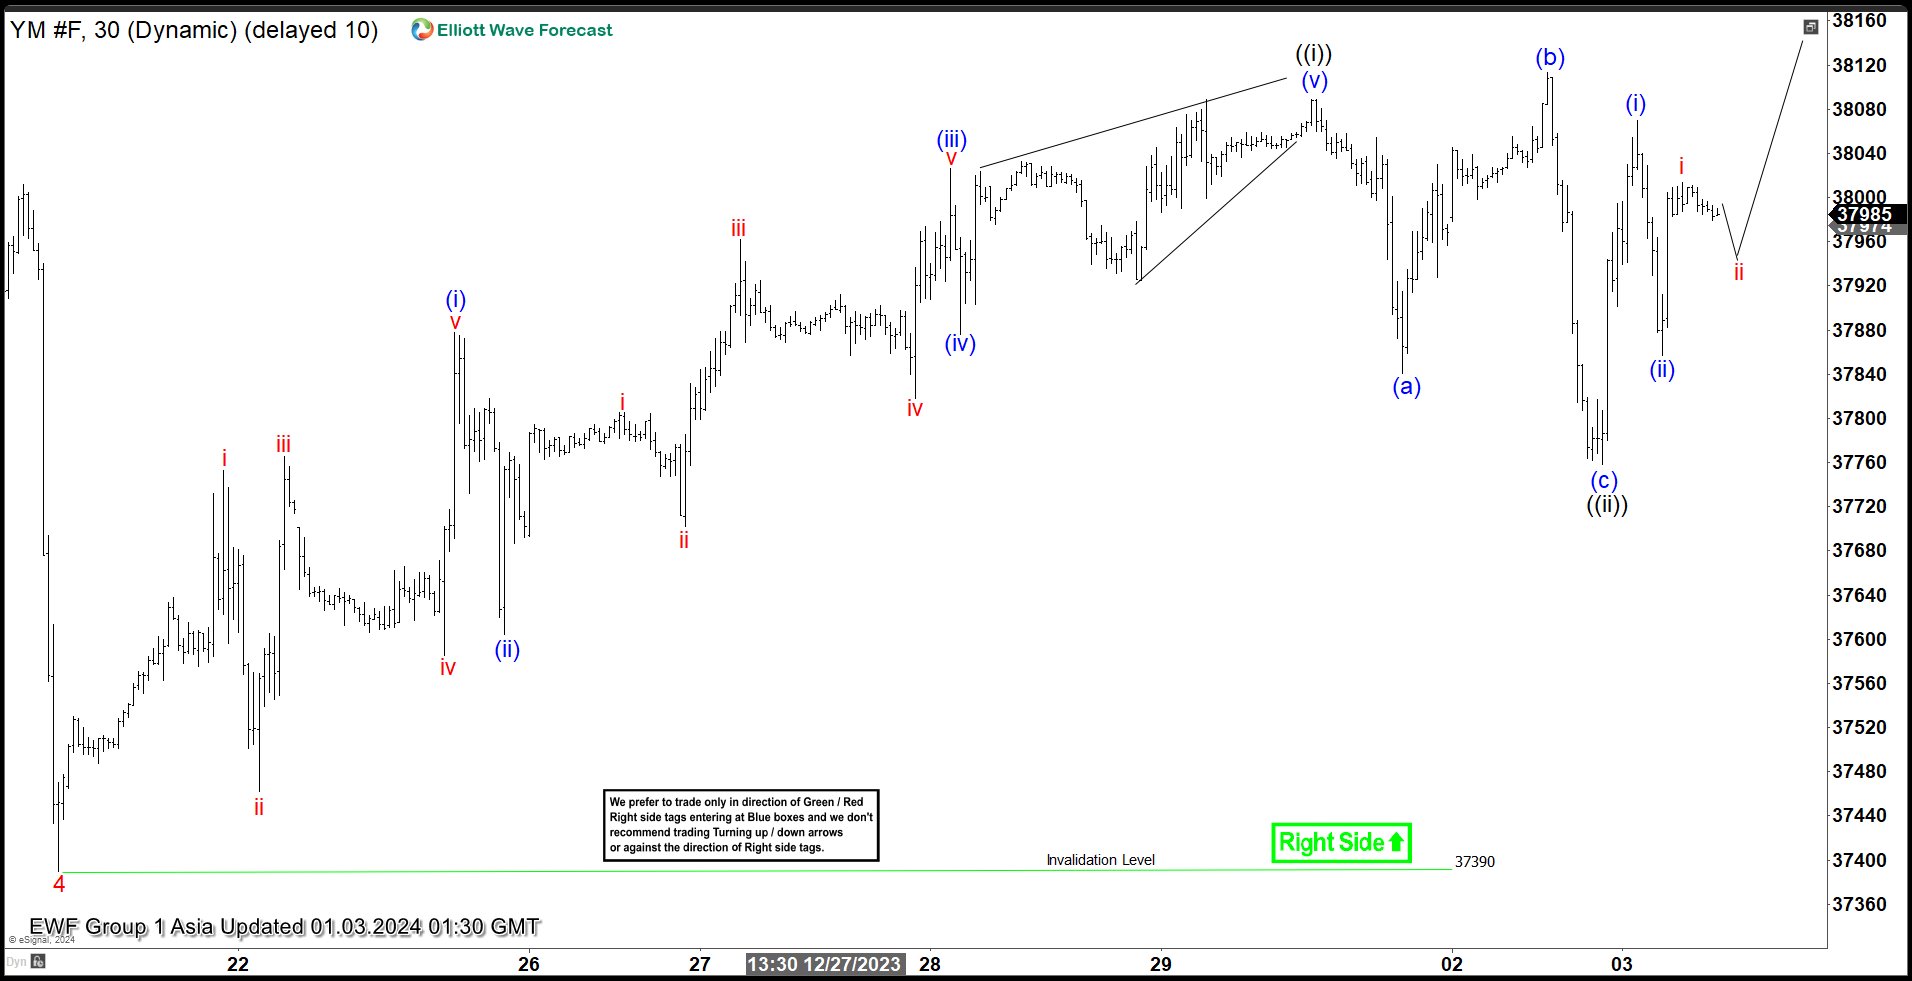
Short Term Elliott Wave View in Dow Futures (YM) suggests that rally from 10.27.2023 low is in progress as a 5 waves impulse structure. Up from 10.27.2023, wave 1 ended at 34315 and pullback in wave 2 ended at 33913. The Index then rallied higher in wave 3 towards 38012 and pullback in wave 4 ended at 37390 as the 30 minutes chart below shows. Wave 5 higher is currently in progress as another 5 waves structure.
Up from wave 4, wave (i) ended at 37878 and dips in wave (ii) ended at 37604. Wave (iii) higher ended at 38026, and pullback in wave (iv) ended at 37876. Final leg wave (v) ended at 38089 which complete wave ((i)). Pullback in wave ((ii)) ended at 37758 with internal subdivision as an expanded flat. Down from wave ((i)), wave (a) ended at 37841, wave (b) ended at 38113, and wave (c) lower ended at 37758 which completed wave ((ii)). The Index has resumed higher in wave ((iii)). Up from wave ((ii)), wave (i) ended at 38070, and pullback in wave (ii) ended at 37857. Near term, as far as pivot at 37390 low stays intact, expect the Index to extend higher.
Dow Futures (YM) 30 Minutes Elliott Wave Chart
YM_F Elliott Wave Video
https://www.youtube.com/watch?v=kYIXgokPSEo