Sample Category Title
Technical Outlook and Review
DXY:
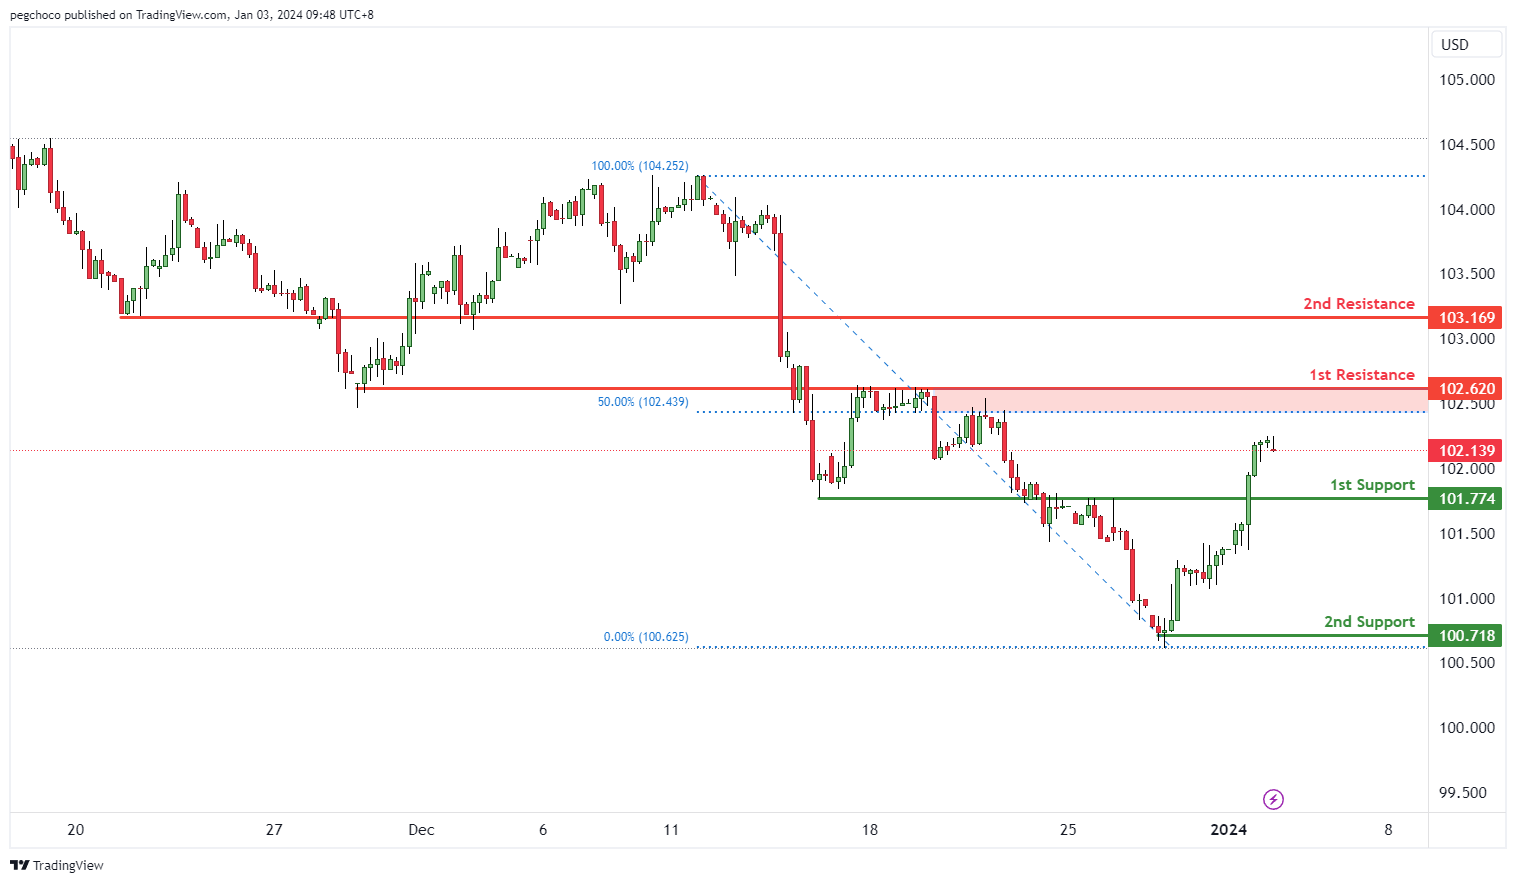
The DXY (US Dollar Index) chart currently exhibits a bullish overall momentum, suggesting a strengthening of the US Dollar. Price could potentially experience a bullish bounce off the 1st support level and move towards the 1st resistance level.
The 1st support at 101.77 is identified as a pullback support. This level is significant because it suggests a potential area where buying interest may emerge, providing temporary support for the US Dollar.
The 2nd support at 100.71 is another key level categorized as a swing low support. Swing lows are often seen as important areas of price reversal, further enhancing the significance of this support level.
On the resistance side, the 1st resistance at 102.62 is identified as an overlap resistance and coincides with the 50% Fibonacci Retracement level. This confluence of factors makes it a substantial barrier where selling interest could intensify, potentially leading to a bearish reversal.
The 2nd resistance at 103.16 is categorized as a pullback resistance, indicating another level where selling pressure may increase.
EUR/USD:
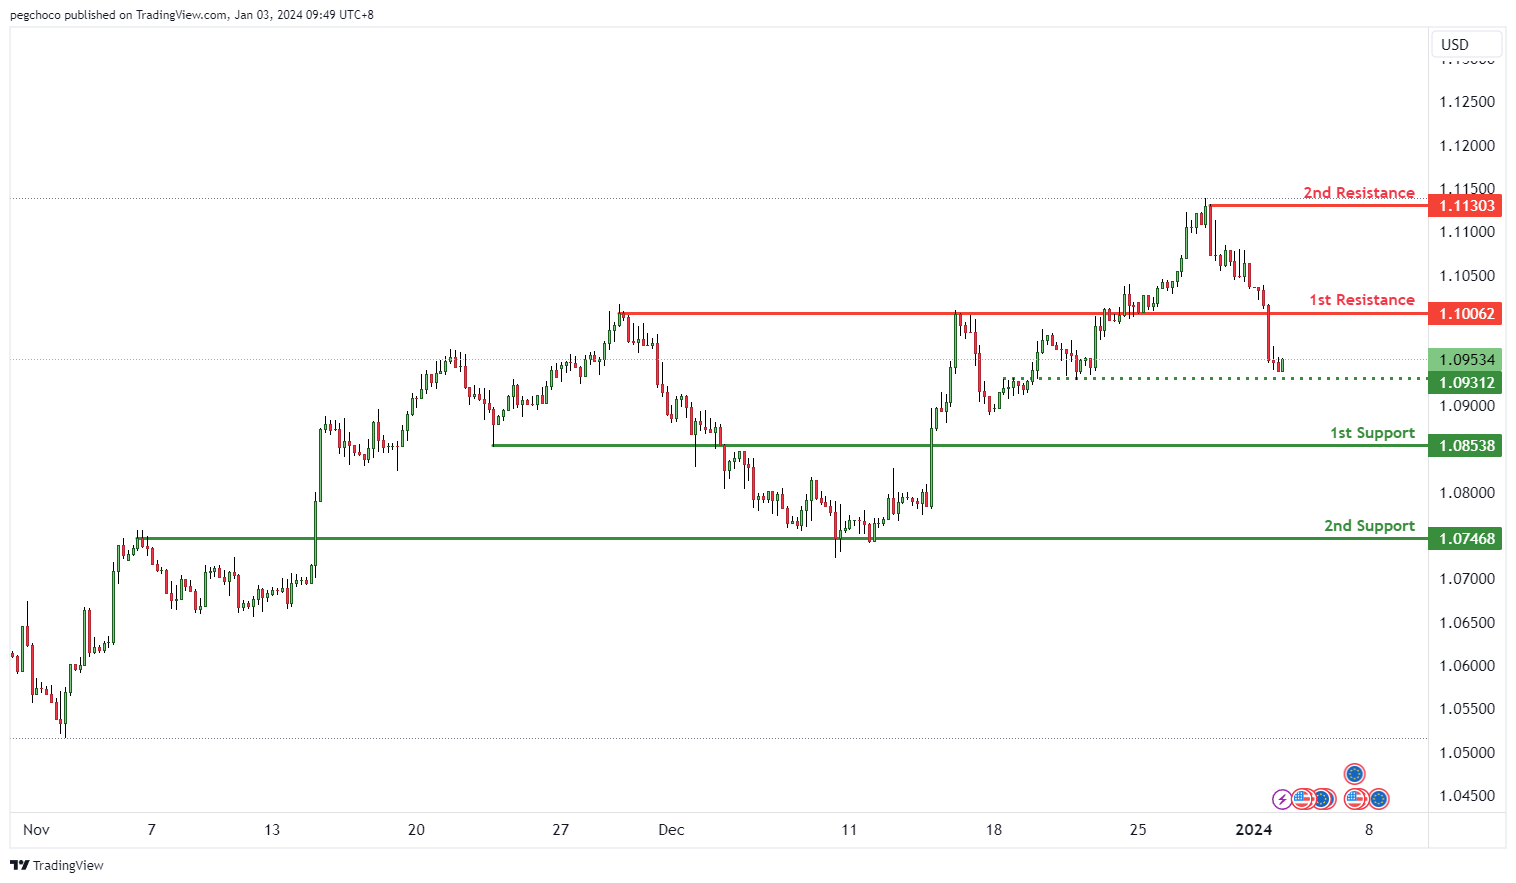
The EUR/USD chart currently has a bearish overall momentum, indicating a weaker Euro compared to the US Dollar. Price could potentially continue its bearish movement towards the 1st support level.
The 1st support at 1.0853 is categorized as a pullback support. This level is significant as it suggests a potential area where buying interest may emerge, providing temporary support for the Euro against the US Dollar.
The 2nd support at 1.0746 is identified as an overlap support. Overlap supports are areas where price has previously found stability and may act as a significant support zone.
On the resistance side, the 1st resistance at 1.1006 is categorized as a pullback resistance. This level may serve as a substantial barrier where selling interest could intensify, potentially leading to a bearish continuation.
The 2nd resistance at 1.1130 is noted as a swing high resistance. Swing highs often mark points of reversal or resistance in the price movement.
Additionally, there’s an intermediate support level at 1.0931, which is identified as an overlap support, further emphasizing the potential support zone for the EUR/USD.
EUR/JPY:
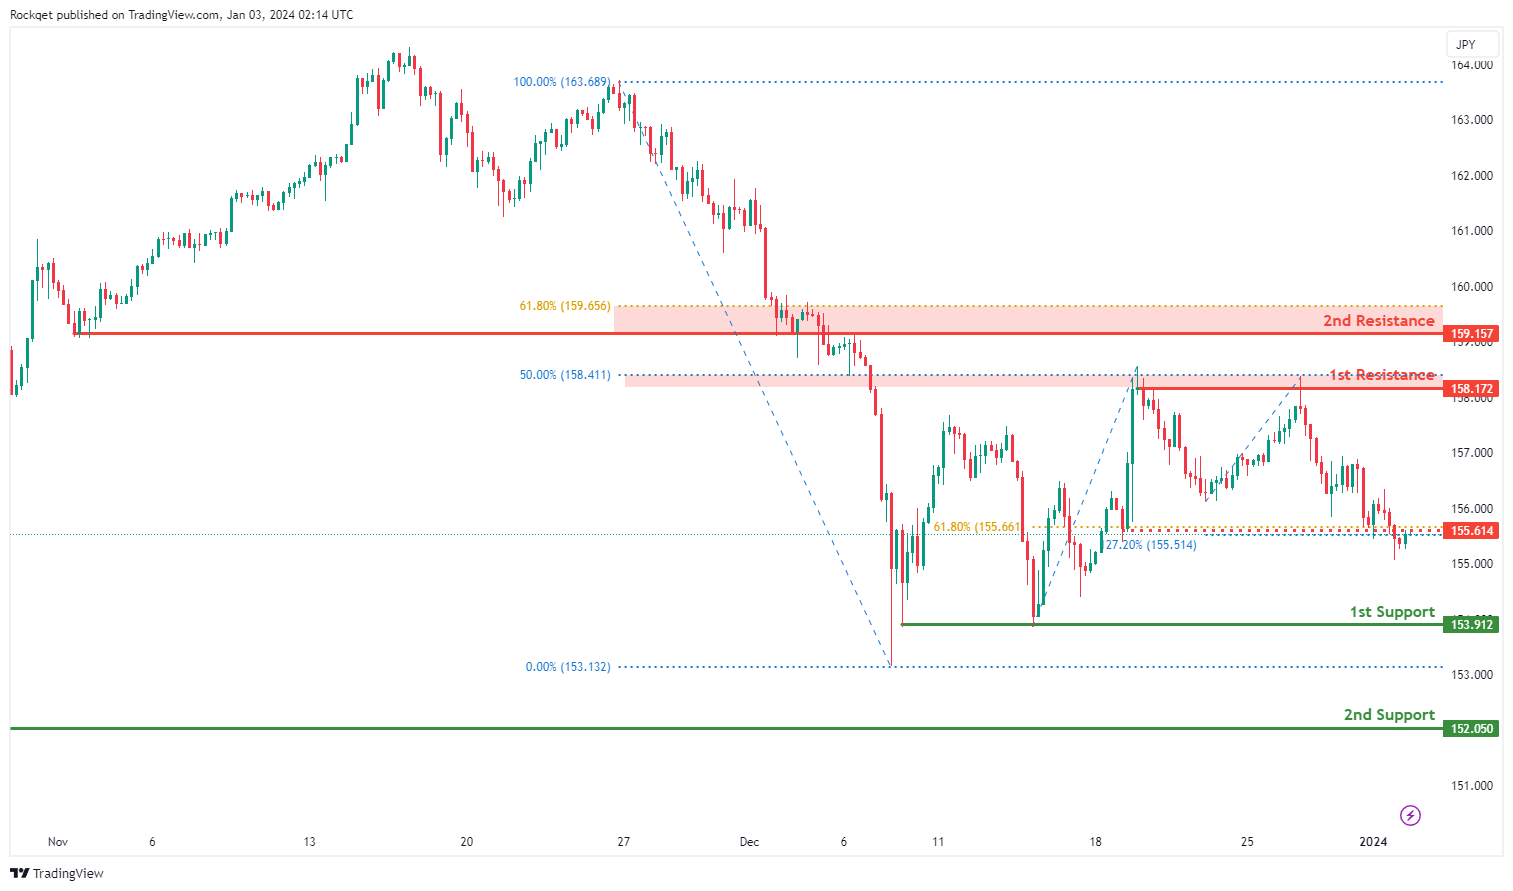
The EUR/JPY chart currently exhibits a bullish overall momentum, suggesting a potential scenario for a bullish continuation towards the 1st resistance.
The intermediate support at 155.62 is considered significant as it aligns with a pullback support, the 61.80% Fibonacci Retracement, and the -27% Fibonacci Expansion, indicating a historical area where buying interest has been present.
Additionally, the 1st support at 153.91 is identified as a multi-swing low support, providing an additional layer of potential support for the currency pair.
The 2nd support at 152.05 is identified as a swing low support, contributing to the overall bullish narrative.
On the resistance side, the 1st resistance at 158.17 is associated with a swing high resistance and the 61.80% Fibonacci Projection, indicating a level where selling interest could intensify. Furthermore, the 2nd resistance at 159.16 represents an overlap resistance and the 61.80% Fibonacci Retracement.
EUR/GBP:
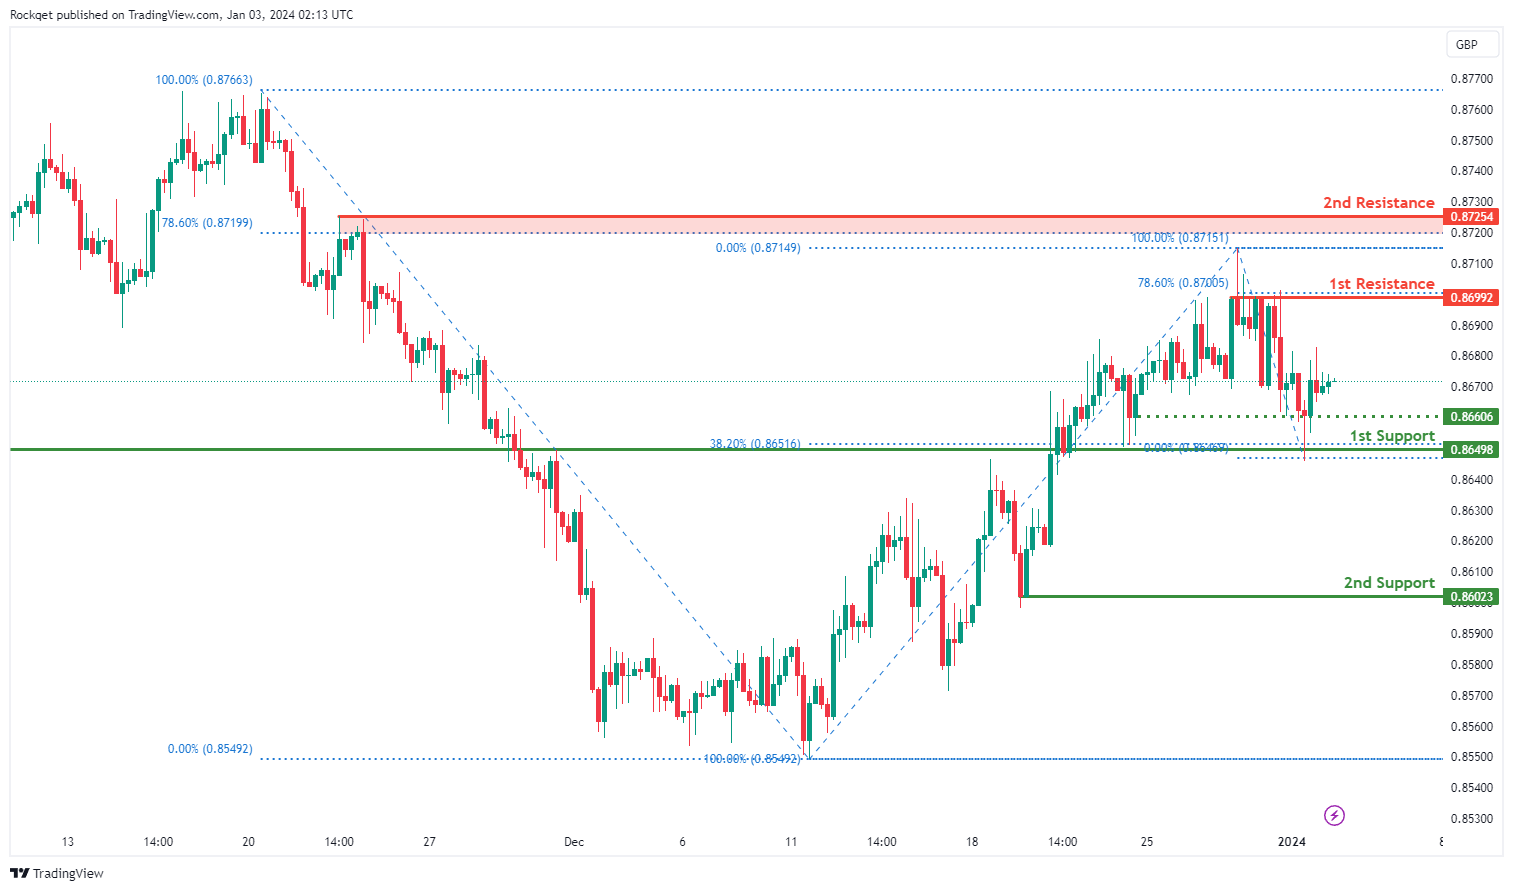
The EUR/GBP chart currently exhibits a weak bullish overall momentum with low confidence, suggesting a cautious outlook. There is a potential scenario for a bullish continuation towards the 1st resistance.
The 1st support at 0.8650 is deemed favorable due to its classification as an overlap support and coinciding with the 38.20% Fibonacci Retracement. This level has historical significance as it indicates a region where buying interest has previously emerged.
Additionally, the 2nd support at 0.8602 is identified as a pullback support, further reinforcing the potential for a bullish continuation.
An intermediate support level at 0.8661, characterized as a pullback support, provides an additional layer of potential support for the currency pair.
On the resistance side, the 1st resistance at 0.8699 is considered significant, representing a multi-swing high resistance and coinciding with the 78.60% Fibonacci Retracement. This level may act as a barrier where selling interest could materialize.
Furthermore, the 2nd resistance at 0.8725 is identified as a pullback resistance and aligns with the 78.60% Fibonacci Retracement.
GBP/USD:
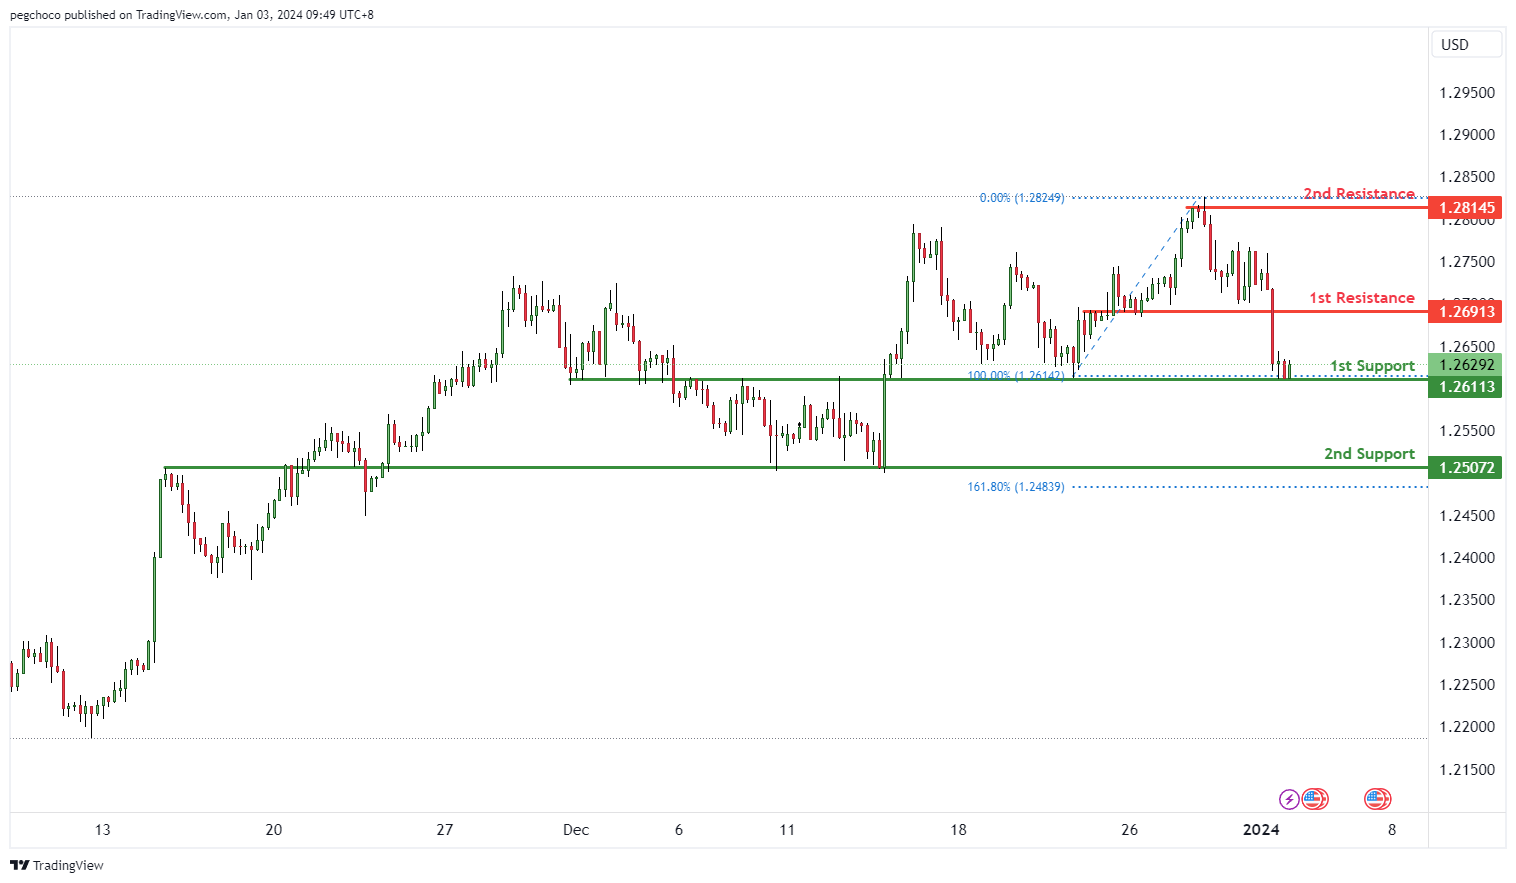
The GBP/USD chart currently has a bearish overall momentum, suggesting that the British Pound is weaker compared to the US Dollar. In the short term, there’s potential for a temporary rise towards the 1st resistance level before a reversal and a drop towards the 1st support.
The 1st support at 1.2611 is categorized as an overlap support. This level is significant as it suggests a potential area where buying interest may emerge, providing temporary support for the GBP/USD.
The 2nd support at 1.2507 is also identified as an overlap support, further reinforcing its significance as a potential support zone.
On the resistance side, the 1st resistance at 1.2691 is categorized as a pullback resistance. This level may act as a substantial barrier where selling interest could intensify, potentially triggering a bearish reversal in the short term.
The 2nd resistance at 1.2814 is noted as a swing high resistance. Swing highs often mark points of reversal or resistance in the price movement.
GBP/JPY:
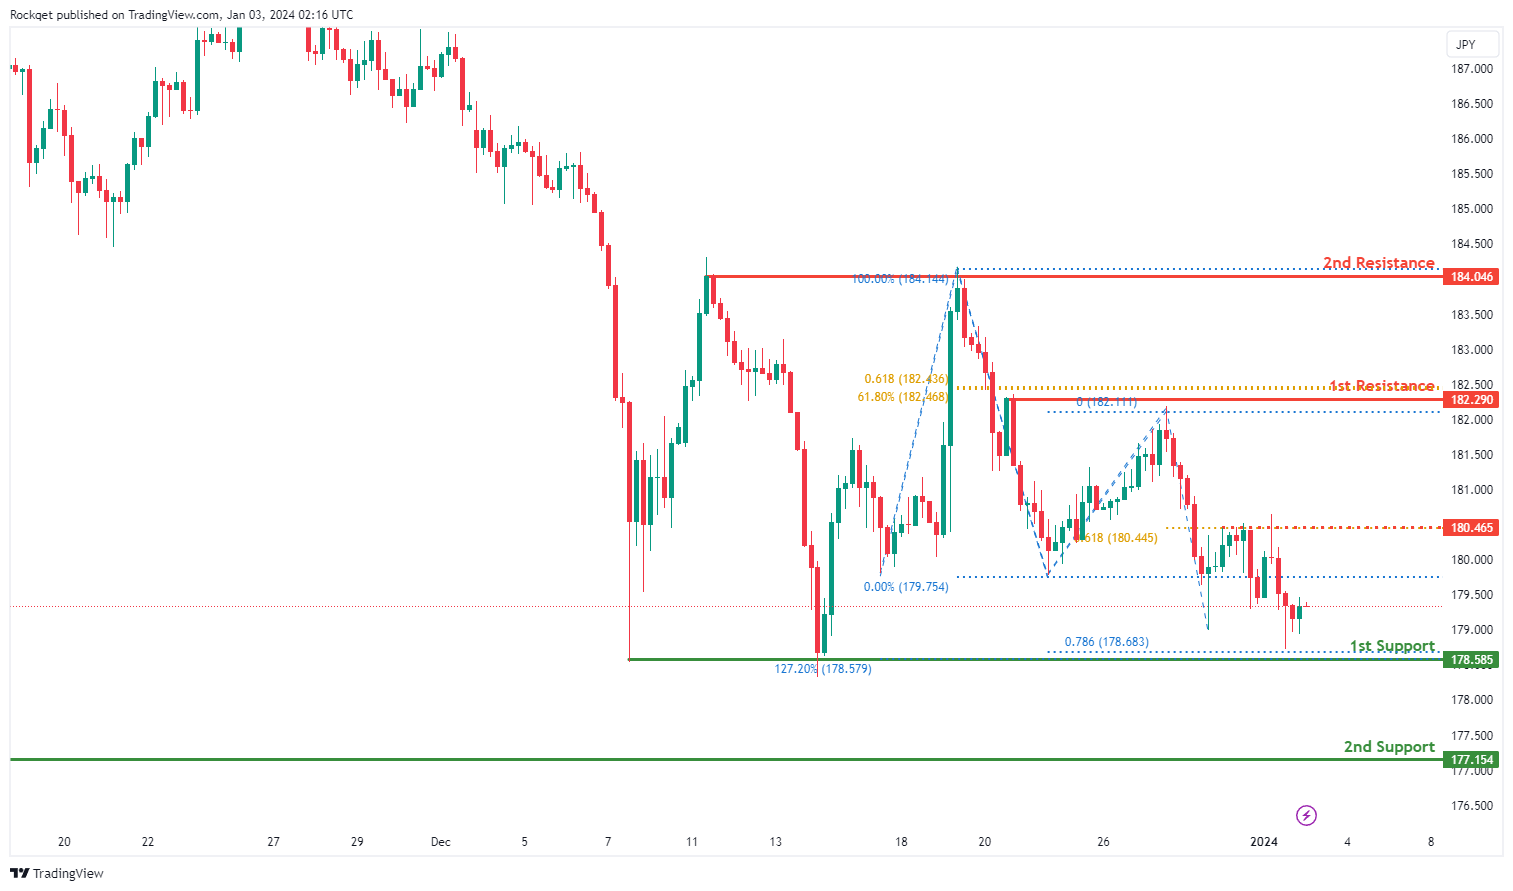
The GBP/JPY chart is currently exhibiting a bearish overall momentum, indicating a downward trend. There is a potential scenario for a bearish reaction off the 1st resistance, leading to a potential drop to the 1st support.
The 1st support at 178.59 is considered favorable for several reasons. Firstly, it is identified as a multi-swing low support, implying historical significance as a level where buying interest has previously emerged. Additionally, it coincides with the 127.20% Fibonacci Expansion and the 78.60% Fibonacci Projection, adding confluence to its significance.
The 2nd support at 177.15 is also recognized as a multi-swing low support, reinforcing its potential role as a level where buyers may step in.
On the resistance side, the 1st resistance at 182.29 is identified as a pullback resistance and coincides with both the 61.80% Fibonacci Projection and the 61.80% Fibonacci Retracement. This level may act as a barrier where selling interest could materialize.
The 2nd resistance at 184.05 is considered significant as it represents a multi-swing high resistance.
An intermediate resistance level at 180.47, characterized as a pullback resistance and aligned with the 61.80% Fibonacci Projection, provides an additional layer of potential resistance for the currency pair.
USD/CHF:
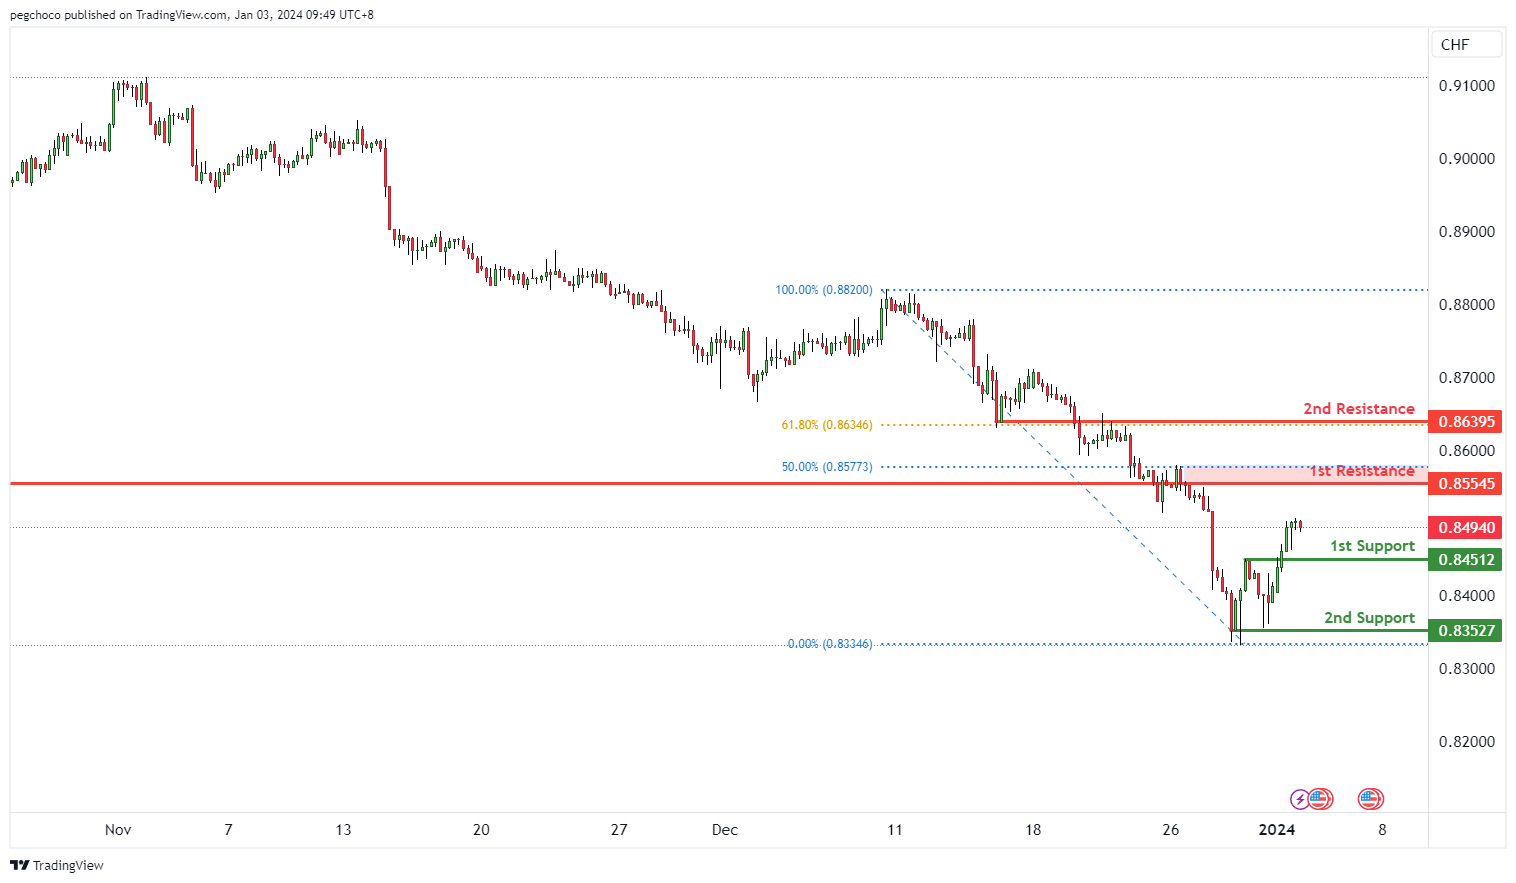
The USD/CHF chart currently has a bearish overall momentum, indicating that the US Dollar is weaker compared to the Swiss Franc. In the short term, there’s potential for a temporary rise towards the 1st resistance level before a reversal and a drop towards the 1st support.
The 1st support at 0.8451 is categorized as pullback support. This level is significant as it suggests a potential area where buying interest may emerge, providing temporary support for USD/CHF.
The 2nd support at 0.8352 is identified as multi-swing low support, further reinforcing its significance as a potential support zone.
On the resistance side, the 1st resistance at 0.8554 is categorized as an overlap resistance with a 50% Fibonacci retracement. This level may act as a substantial barrier where selling interest could intensify, potentially triggering a bearish reversal in the short term.
The 2nd resistance at 0.8639 is noted as an overlap resistance with a 61.80% Fibonacci retracement. These Fibonacci levels often add to the significance of resistance areas in price movements.
USD/JPY:
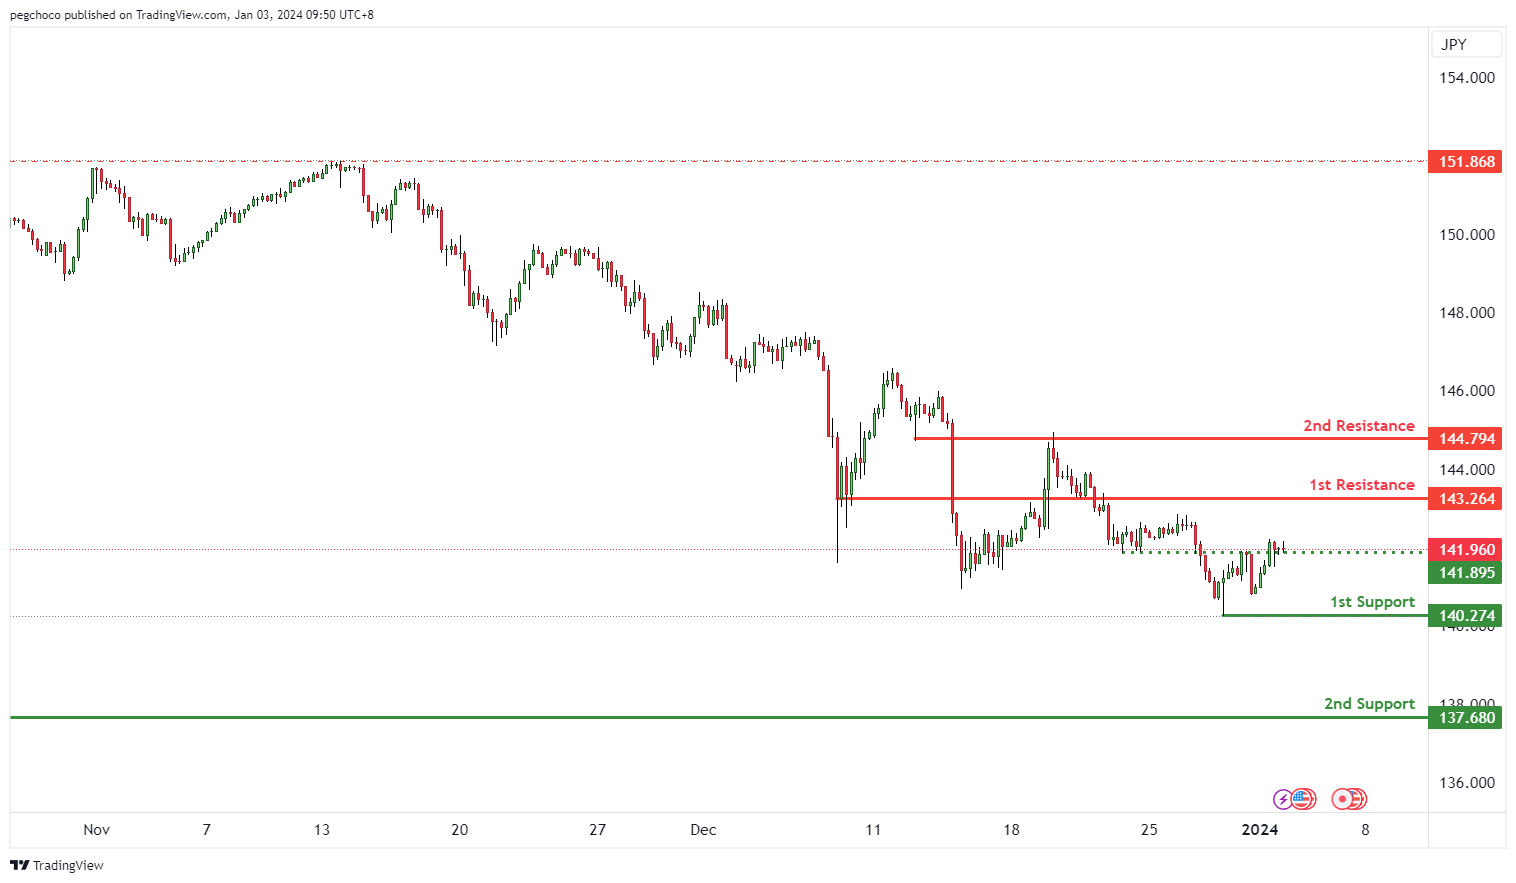
The USD/JPY chart currently exhibits a bearish overall momentum, suggesting that the US Dollar is weaker compared to the Japanese Yen. In the short term, there’s potential for a bearish continuation towards the 1st support level.
The 1st support at 140.27 is categorized as a swing low support. This level is significant as it indicates a historical price point where buying interest has previously emerged, potentially providing support to USD/JPY.
The 2nd support at 137.68 is also identified as a swing low support, further reinforcing its significance as a potential support zone.
On the resistance side, the 1st resistance at 143.26 is categorized as an overlap resistance. This level may act as a significant barrier where selling interest could intensify, potentially impeding any bullish attempts in the short term.
The 2nd resistance at 144.79 is also noted as an overlap resistance, further emphasizing its significance as a potential point of price reversal or resistance.
USD/CAD:
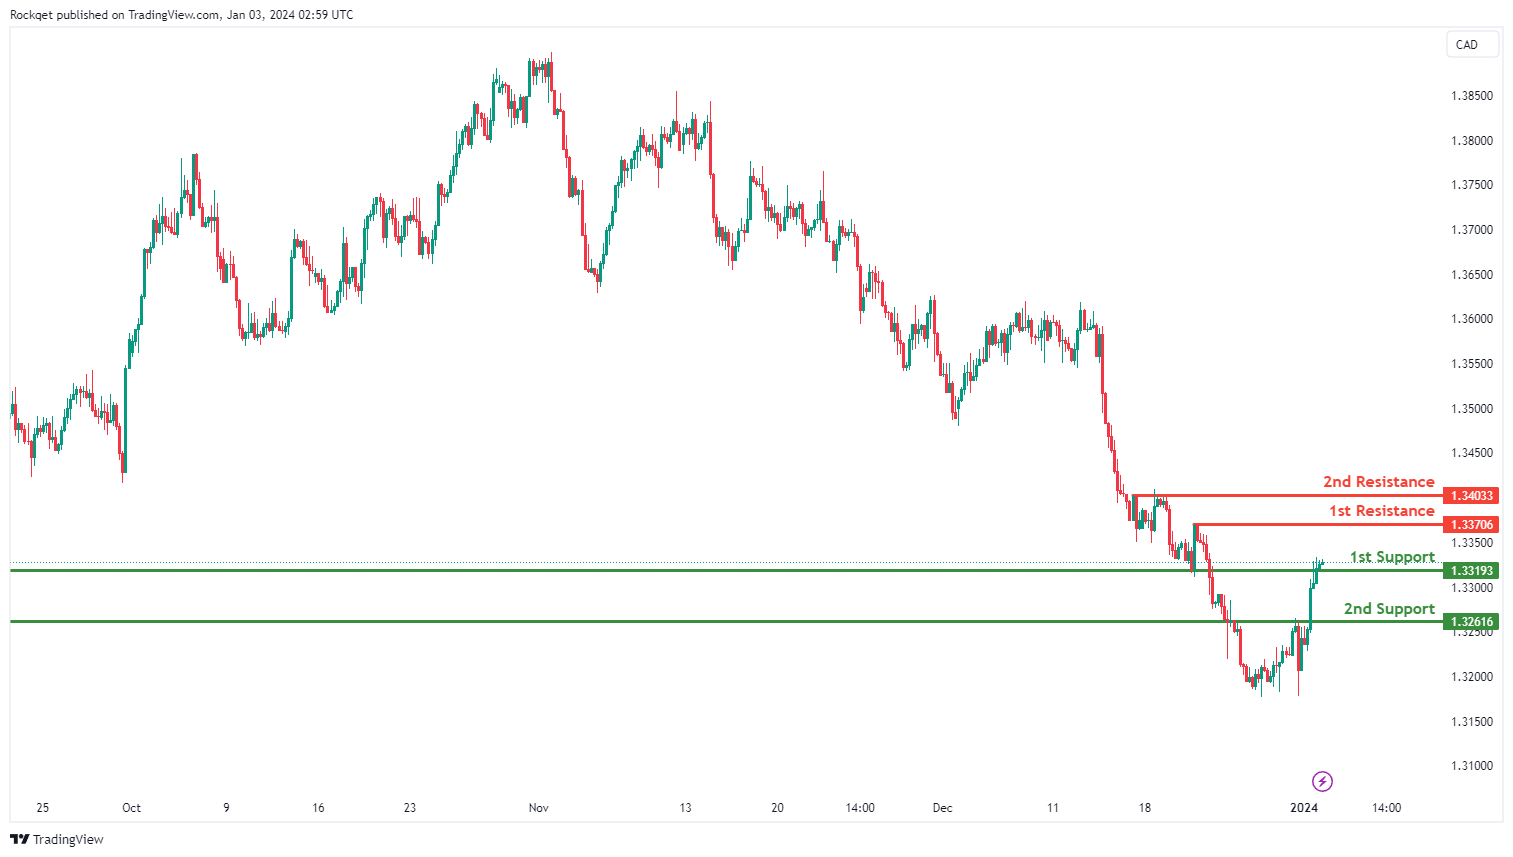
The USD/CAD chart currently exhibits an overall bullish momentum, indicating a new uptrend. In this context, there is a potential scenario for price to make a bullish continuation towards the 1st resistance.
The 1st resistance level at 1.3370 is identified as a pullback resistance. Higher up, the 2nd resistance level at 1.3403 is also marked as a pullback resistance, suggesting a potential barrier for further upside movement.
To the downside, the 1st support level at 1.3319 is identified as a pullback support. Further below, the 2nd support level at 1.3261 is noted as an overlap support, further reinforcing its importance as a key support level.
AUD/USD:
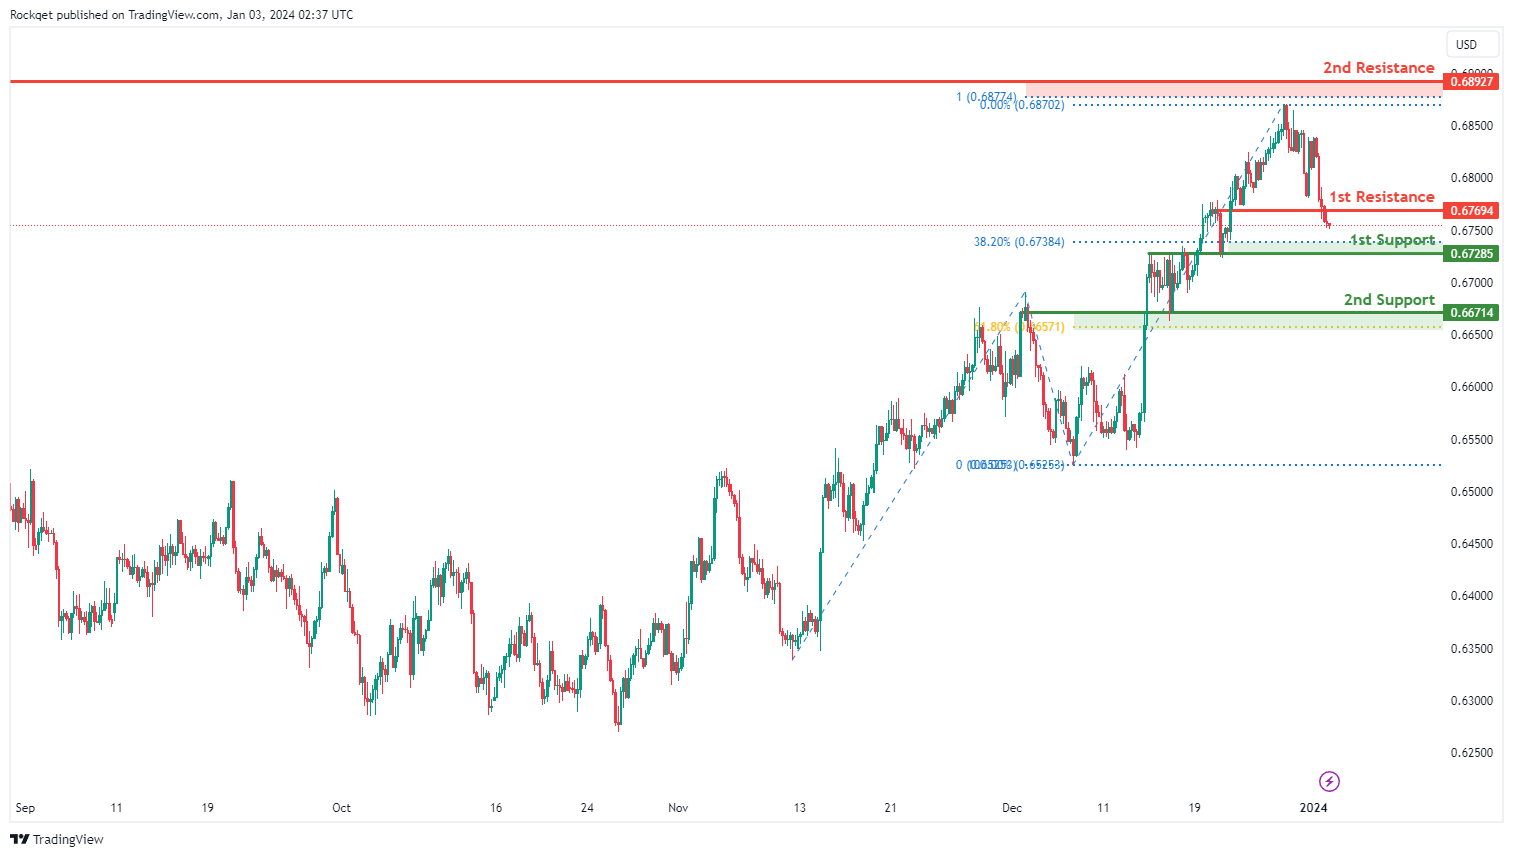
The AUD/USD chart currently exhibits an overall bearish momentum, indicating a new downtrend. In this context, there is a potential scenario for price to drop towards the 1st support.
The 1st support level at 0.6728 is identified as an overlap support that aligns close to the 38.20% Fibonacci retracement level. Further below, the 2nd support level at 0.6671 is also marked as an overlap support that aligns close to the 61.80% Fibonacci retracement level, further reinforcing its importance as a key support level.
To the upside, the 1st resistance level at 0.6769 is identified as an overlap resistance. Higher up, the 2nd resistance level at 0.6892 is noted as a multi-swing-high resistance that aligns close to the 100.00% Fibonacci projection level, indicating its potential significance as a barrier for further upward movement.
NZD/USD
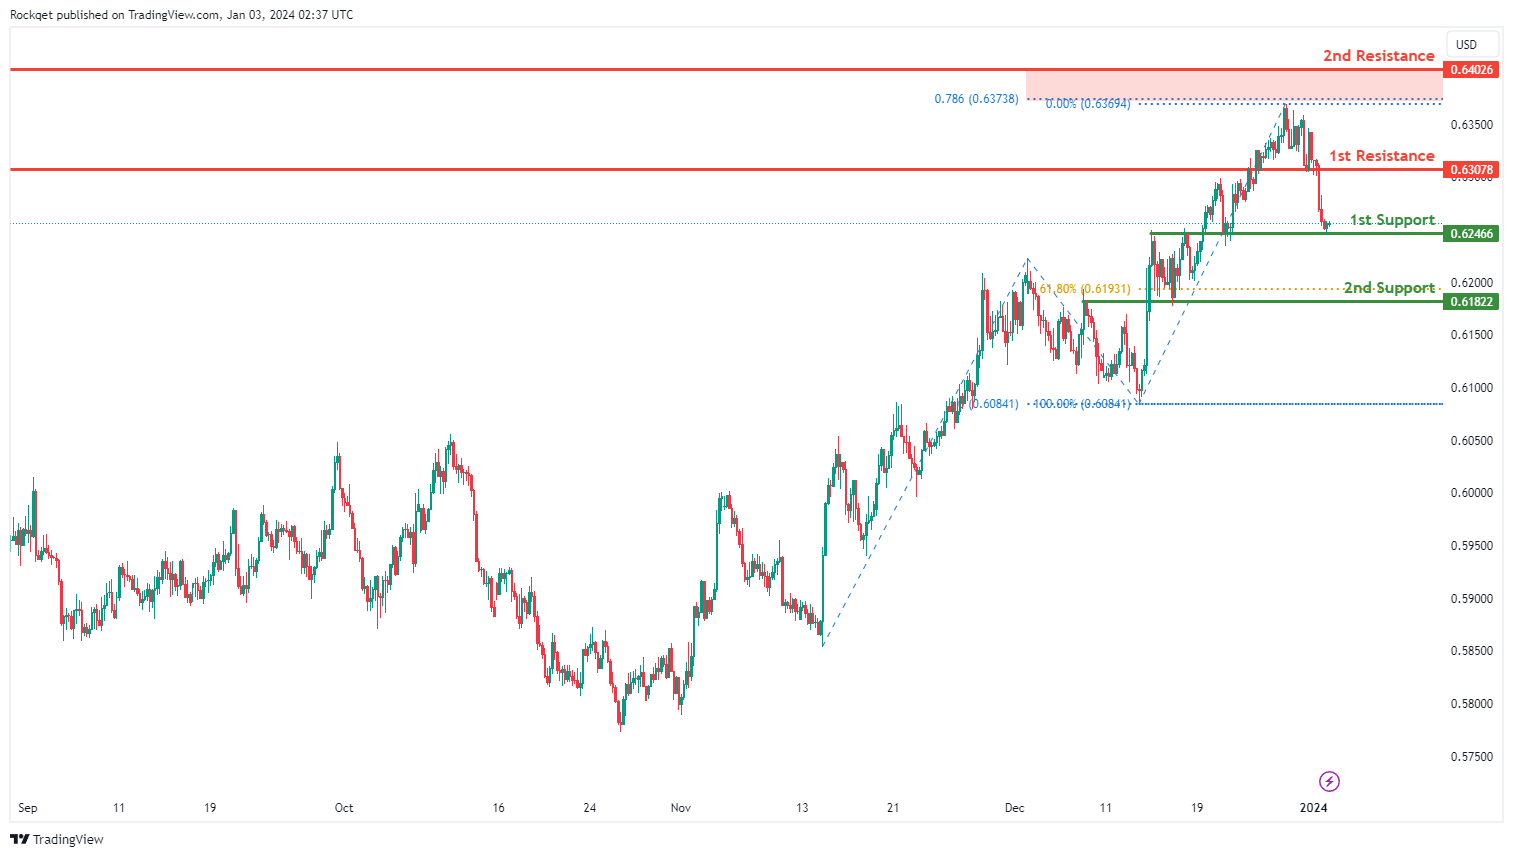
The NZD/USD chart currently exhibits an overall bearish momentum, indicating a new downtrend. However, there is a potential scenario for price to make a weak bullish bounce off the 1st support before resuming the downward trend.
The 1st support level at 0.6246 is identified as an overlap support. Further below, the 2nd support level at 0.6182 is also noted as an overlap support that aligns close to the 61.80% Fibonacci retracement level, further reinforcing its importance as a key support level.
To the upside, the 1st resistance level at 0.6307 is identified as an overlap resistance. Higher up, the 2nd resistance level at 0.6402 is marked as a swing-high resistance that aligns close to the 78.60% Fibonacci projection level, indicating its potential significance as a barrier for further upward movement.
DJ30:
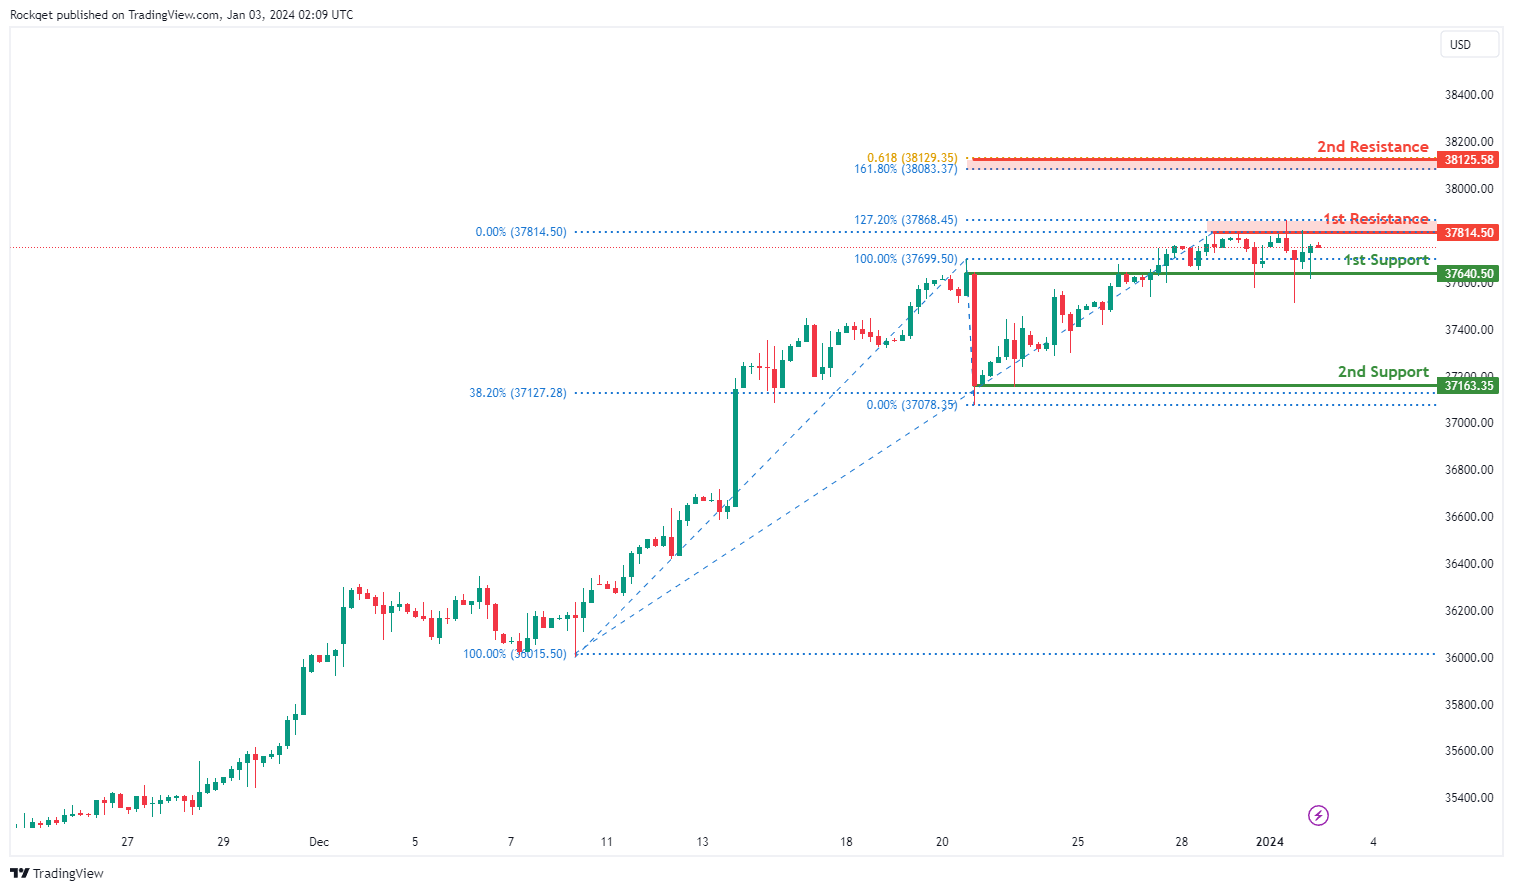
The DJ30 chart currently shows a bullish overall momentum, indicating an upward trend. There is a potential scenario for a bullish continuation towards the 1st resistance.
The 1st support at 37640.50 is considered favorable due to its identification as an overlap support, suggesting historical significance as a level where buying interest has previously emerged.
The 2nd support at 37163.35 is recognized as a swing low support and coincides with the 38.20% Fibonacci Retracement, adding confluence to its potential as a support level.
On the resistance side, the 1st resistance at 37814.50 is identified as a swing high resistance and aligns with the 127.20% Fibonacci Extension. This level may act as a barrier where selling interest could materialize.
The 2nd resistance at 38125.58 is noteworthy for multiple reasons, including the presence of the 61.80% Fibonacci Projection and the 161.80% Fibonacci Extension, adding significance to this potential resistance level.
GER40:
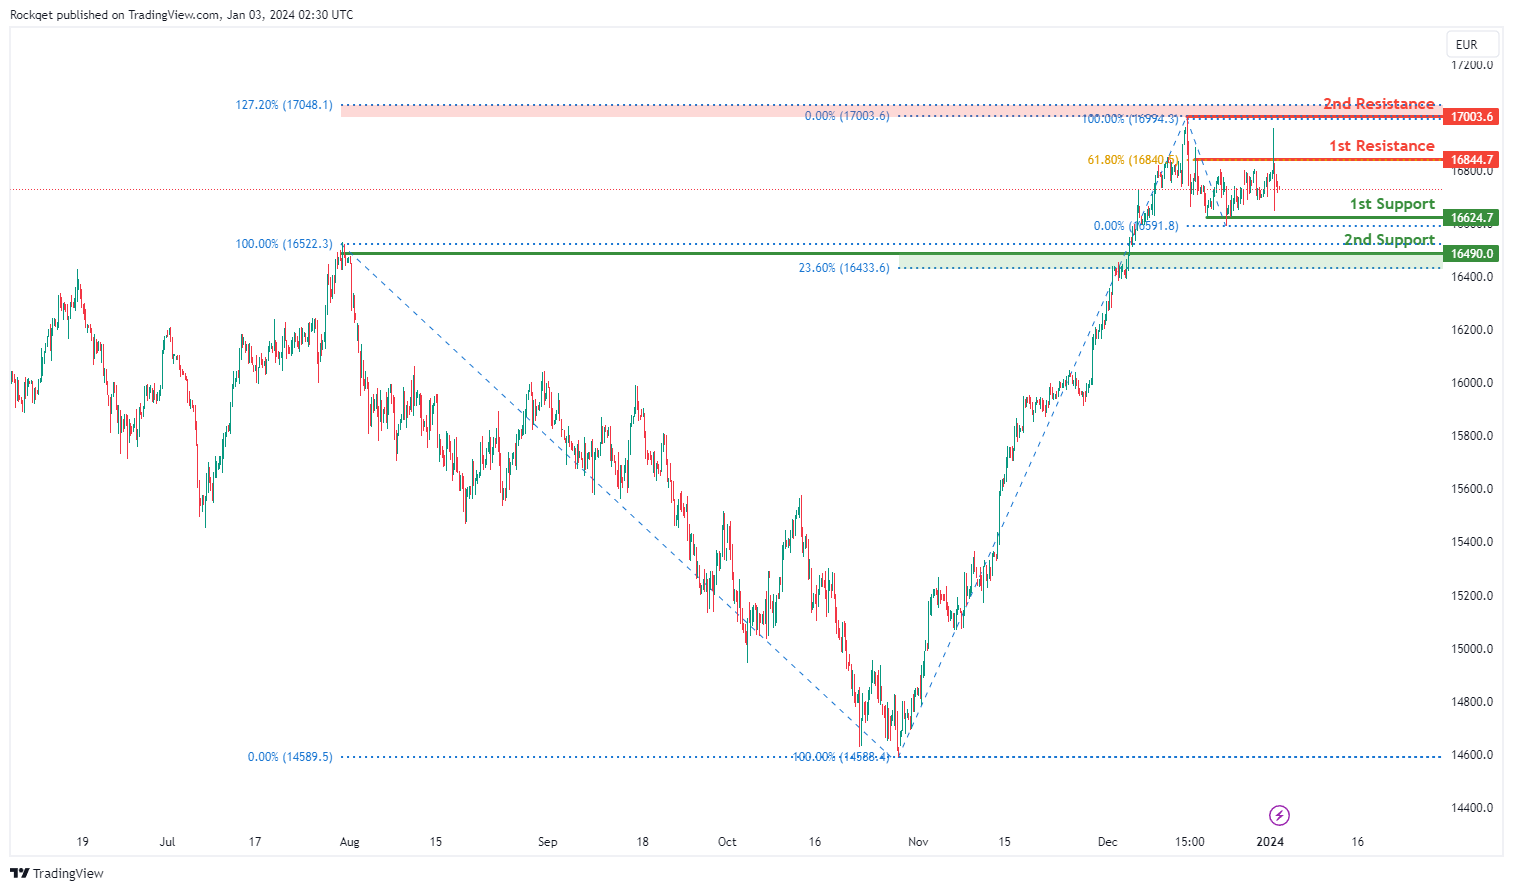
The GER40 chart currently exhibits a bearish overall momentum, indicative of a sustained downward trend. There is a plausible scenario suggesting a bearish continuation towards the 1st support level at 16624.70.
1st support is deemed robust as it represents a multi-swing low support, denoting historical significance where buying interest has previously manifested.
Additionally, the 2nd support at 16490.00 reinforces its strength, identified as an overlap support and coinciding with the 23.60% Fibonacci Retracement, providing an additional layer of support.
On the resistance side, the 1st resistance level at 16844.70 is marked as a pullback resistance and aligns with the 61.80% Fibonacci Retracement. This level may serve as a formidable barrier where selling interest could potentially materialize.
Furthermore, the 2nd resistance at 17003.60, recognized as a swing high resistance, corresponds with the 127.20% Fibonacci Extension, adding substantial significance to its potential as a resistance level.
US500:
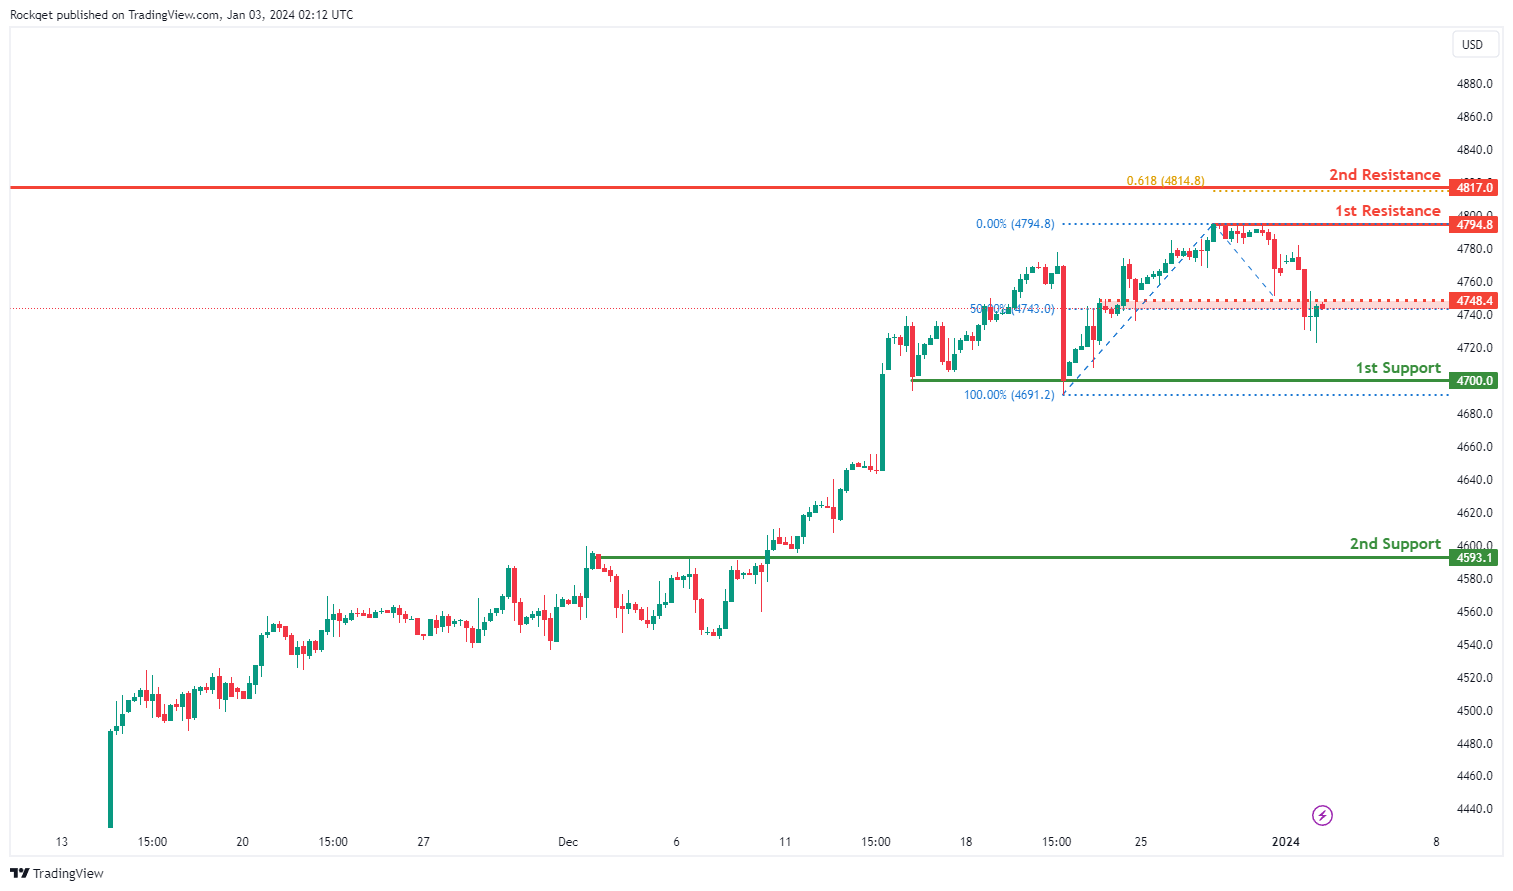
The US500 chart currently reflects a bullish overall momentum, signaling an upward trajectory. Several factors contribute to this positive momentum.
1st support at 4700.0 as a multi-swing low support, highlighting its historical significance as a level where buying interest has previously emerged.
Additionally, the 2nd support at 4593.1 is recognized as an overlap support, further reinforcing its potential strength as a support level.
In terms of resistance, the intermediate resistance at 4748.4 is marked as a pullback resistance, indicating a level where selling interest may materialize. The 1st resistance at 4794.8 aligns with a swing high resistance, suggesting a potential barrier where selling pressure could be observed.
Furthermore, the 2nd resistance at 4817.0 is notable for the presence of the 61.80% Fibonacci Projection, adding significance to its role as a potential resistance level.
BTC/USD:
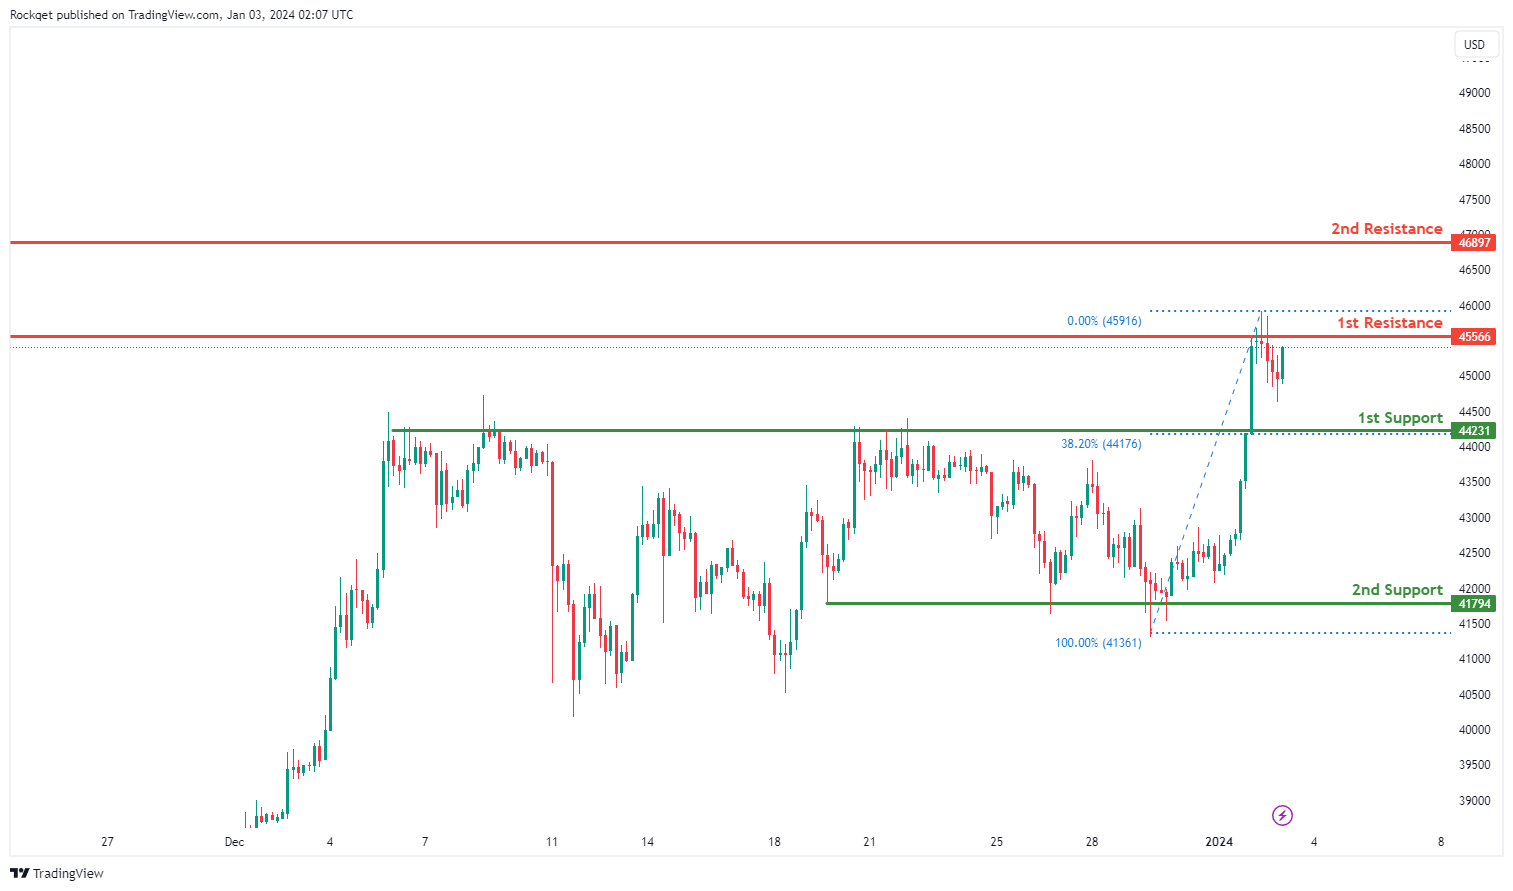
The BTC/USD chart currently exhibits a bullish overall momentum, indicating a positive upward trend. There is a potential scenario for a bullish continuation towards the 1st resistance.
The 1st support at 44231 is considered favorable due to its identification as an overlap support, suggesting historical significance as a level where buying interest has previously emerged. The 38.20% Fibonacci Retracement further adds confluence to the strength of this support level.
The 2nd support at 41794 is recognized as a multi-swing low support, reinforcing its potential as a strong support area.
On the resistance side, the 1st resistance at 45566 is identified as a pullback resistance, indicating a level where selling interest may emerge.
The 2nd resistance at 46897 is marked as a swing high resistance, representing a potential barrier where heightened selling pressure could be observed.
ETH/USD:
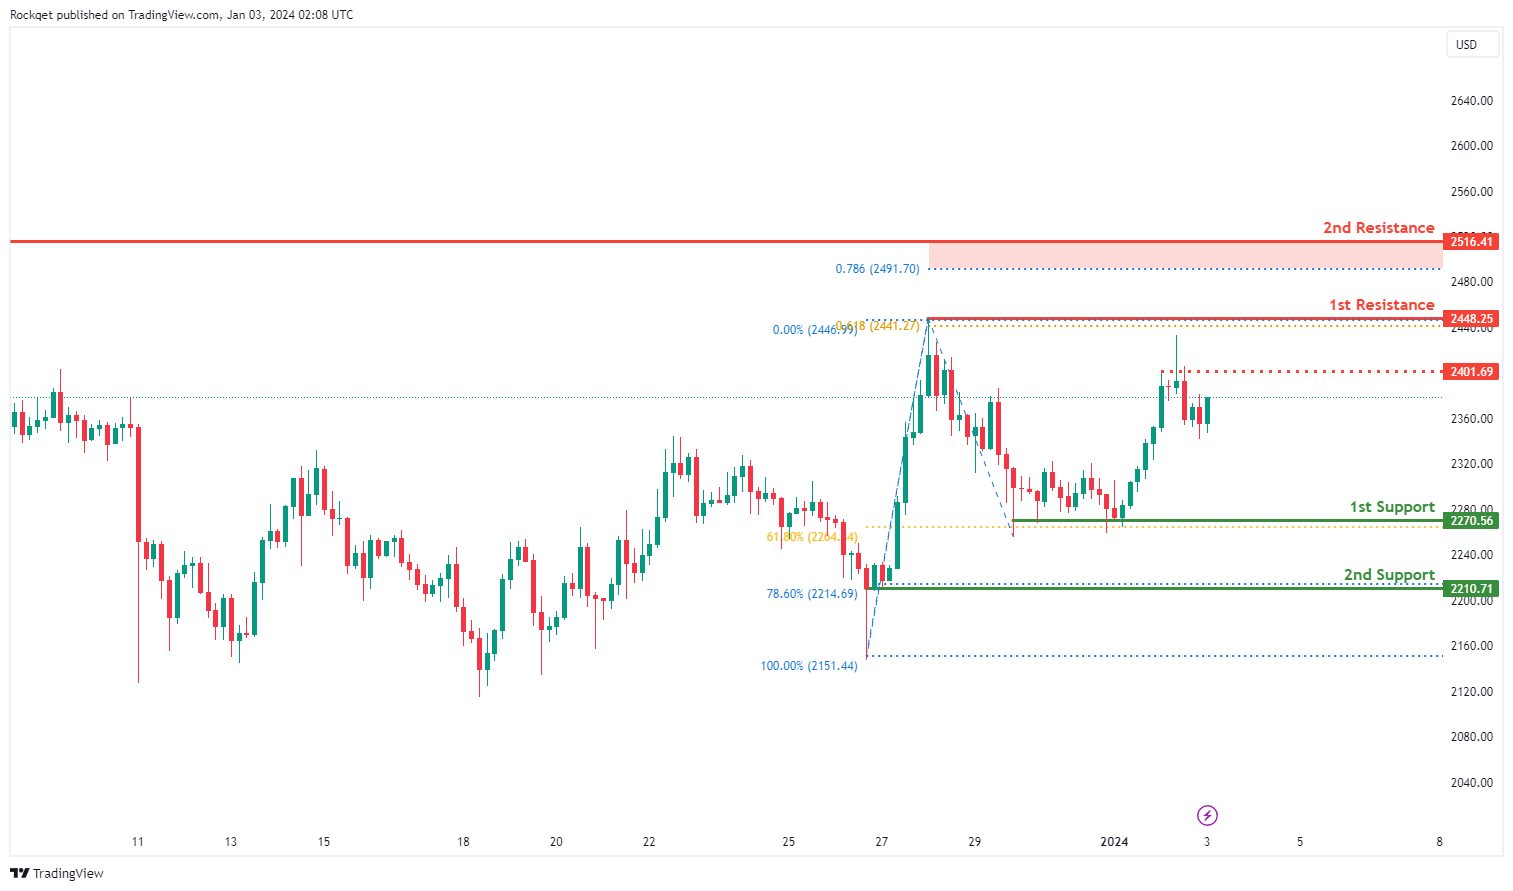
The ETH/USD chart currently shows a bullish overall momentum, indicating a positive upward trend. There is a potential scenario for a bullish continuation towards the 1st resistance.
The 1st support at 2270.56 is considered favorable due to its identification as a multi-swing low support, suggesting historical significance as a level where buying interest has previously emerged. The 61.80% Fibonacci Retracement adds confluence to the strength of this support level.
The 2nd support at 2210.71 is recognized as a pullback support, reinforcing its potential as a strong support area with the additional confluence of the 78.60% Fibonacci Retracement.
On the resistance side, the 1st resistance at 2448.25 is identified as a swing high resistance, indicating a level where selling interest may emerge. The 61.80% Fibonacci Projection adds significance to this resistance level.
The 2nd resistance at 2516.41 is marked as a swing high resistance with the added confluence of the 78.60% Fibonacci Projection.
WTI/USD:
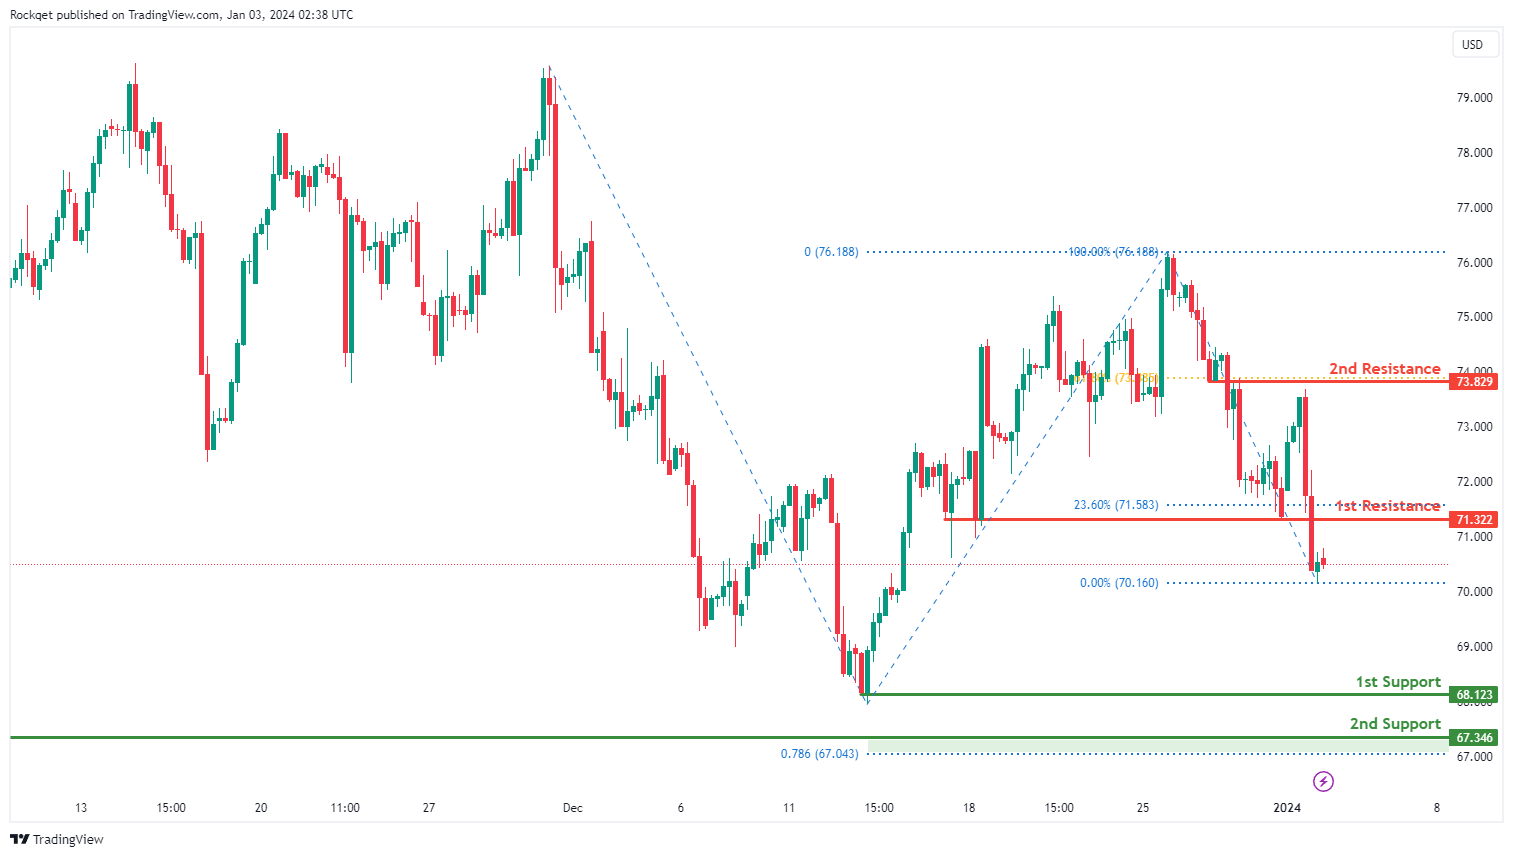
The WTI chart currently exhibits an overall bearish momentum. In this context, there is a potential scenario for price to fall towards the 1st support.
The 1st support level at 68.12 is identified as a swing-low support. Further below, the 2nd support level at 67.34 is marked as a multi-swing-low support that aligns close to the 78.60% Fibonacci projection level, reinforcing its importance as a key support level.
To the upside, the 1st resistance level at 71.32 is identified as a pullback resistance that aligns close to the 23.60% Fibonacci retracement level. Higher up, the 2nd resistance level at 73.82 is noted as an overlap resistance that aligns with the 61.80% Fibonacci retracement level, further indicating its potential significance as a barrier for further upward movement.
XAU/USD (GOLD):
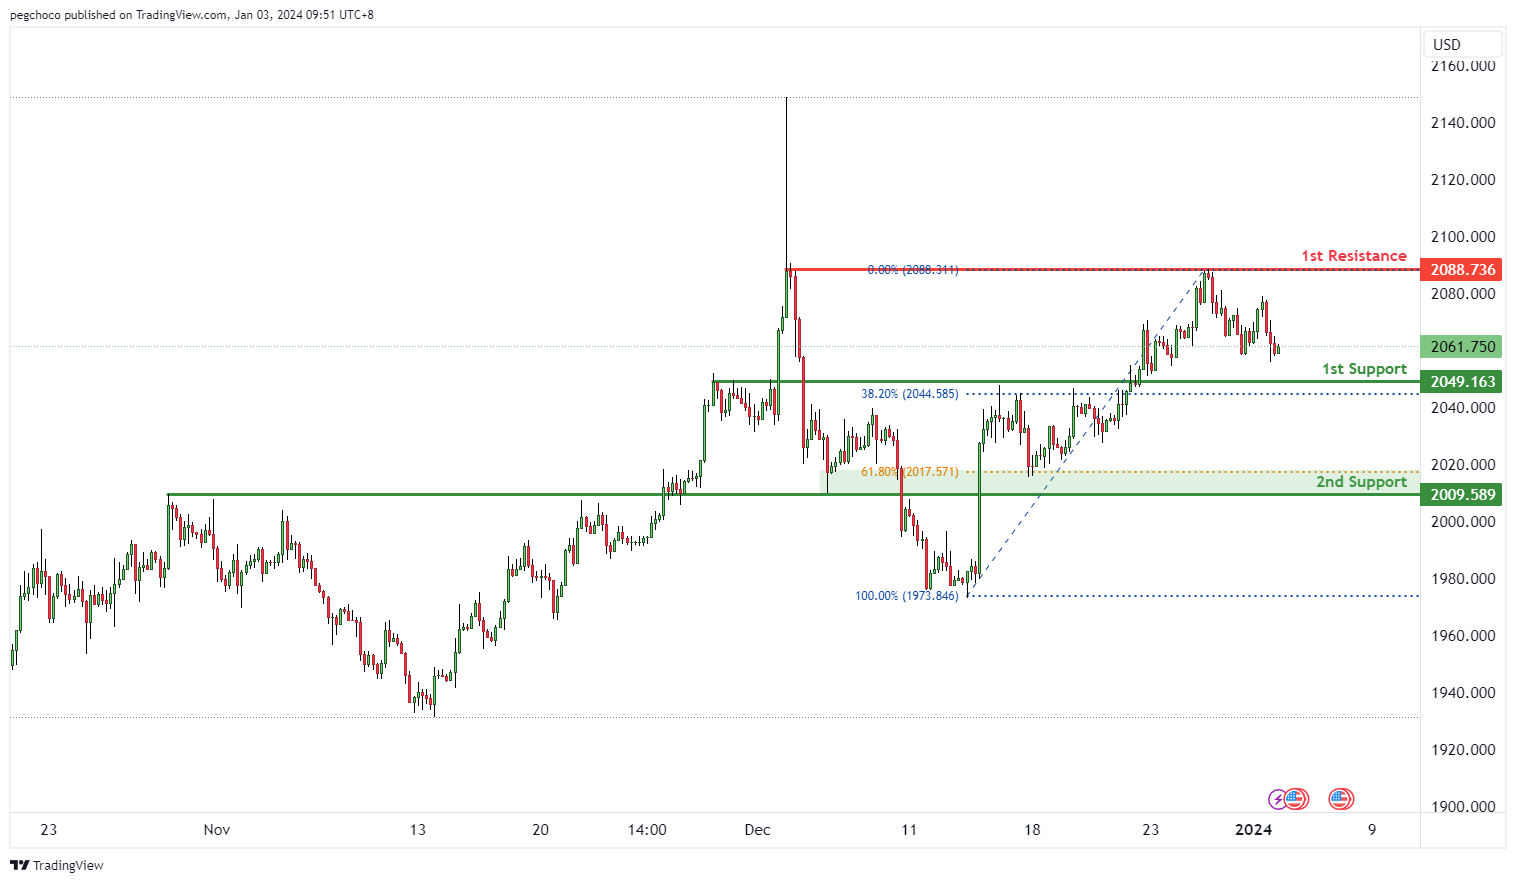
The XAU/USD chart currently has a bearish overall momentum, indicating that gold (XAU) is weaker compared to the US Dollar (USD). In the short term, there’s potential for a bearish continuation towards the 1st support level.
The 1st support at 2049.16 is categorized as a pullback support and is reinforced by the presence of the 38.20% Fibonacci Retracement level. This level may act as a significant area where buying interest could emerge, providing temporary support for XAU/USD.
The 2nd support at 2009.58 is identified as an overlap support, further emphasizing its significance as a potential support zone. The 61.80% Fibonacci Retracement adds to the confluence of support at this level.
On the resistance side, the 1st resistance at 2088.73 is categorized as a multi-swing high resistance. This level may act as a substantial barrier where selling interest could intensify, potentially impeding any bullish advances in the short term.
GBP/USD Daily Outlook
Daily Pivots: (S1) 1.2567; (P) 1.2663; (R1) 1.2716; More...
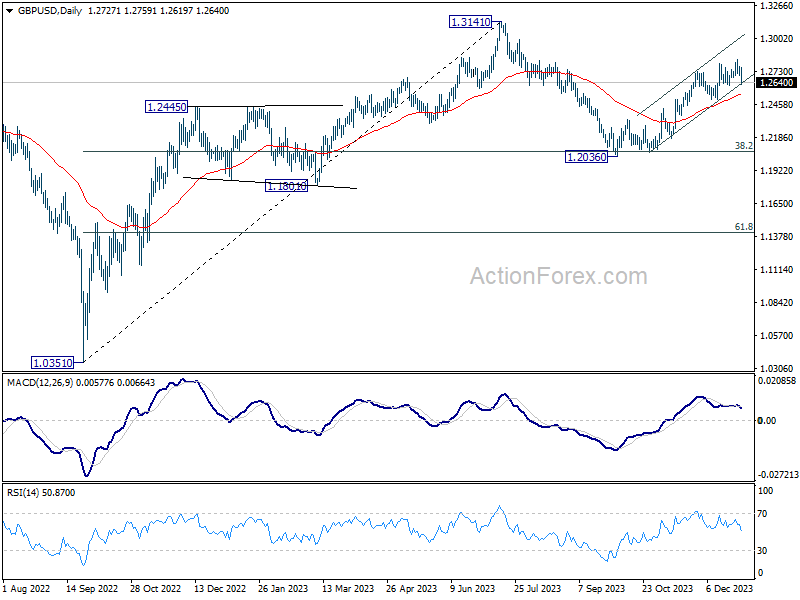
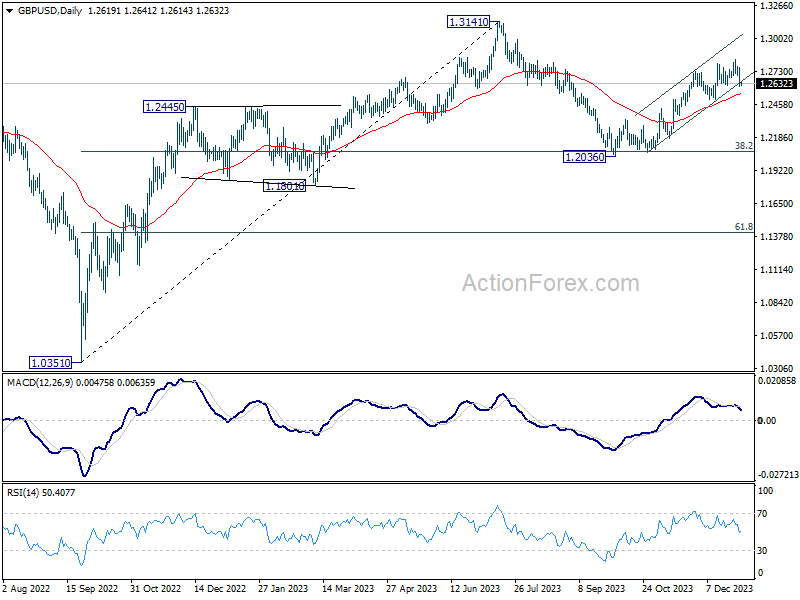
Intraday bias in GBP/USD stays neutral for the moment, as 1.2611 support remains intact. On break of 1.2826 will resume whole rally from 1.2036. However, break of 1.2611 will indicate short term topping, and turn bias back to the downside for 1.2499 support.
In the bigger picture, price actions from 1.3141 medium term top are seen as a corrective pattern to rise from 1.0351 (2022 low). Rise from 1.2036 is seen as the second leg that's in progress. Upside should be limited by 1.3141 to bring the third leg of the pattern. Meanwhile, break of 1.2499 support will argue that the third leg has already started for 38.2% retracement of 1.0351 (2022 low) to 1.3141 at 1.2075 again.
Dollar’s Rebound Pauses, Awaiting Direction from ISM Manufacturing and FOMC Minutes
Dollar softens mildly in quiet Asian session today. The greenback's rebound stalled ahead of near term resistance levels, as general market sentiment stabilized in US session overnight. Investors and analysts are now turning their attention ISM Manufacturing PMI and FOMC minutes, seeking guidance on the future on the next move of the greenback.
In the December meeting, Fed officials projected three rate cuts for the current year, as reflected in the dot plot. The market is particularly keen to understand the discussions surrounding this policy loosening. The timing of the first rate cut is a subject of high interest among investors and analysts. While it is expected that Fed will maintain its stance on data dependence, any indications of a dovish tilt in the policy could potentially trigger another downturn for Dollar.
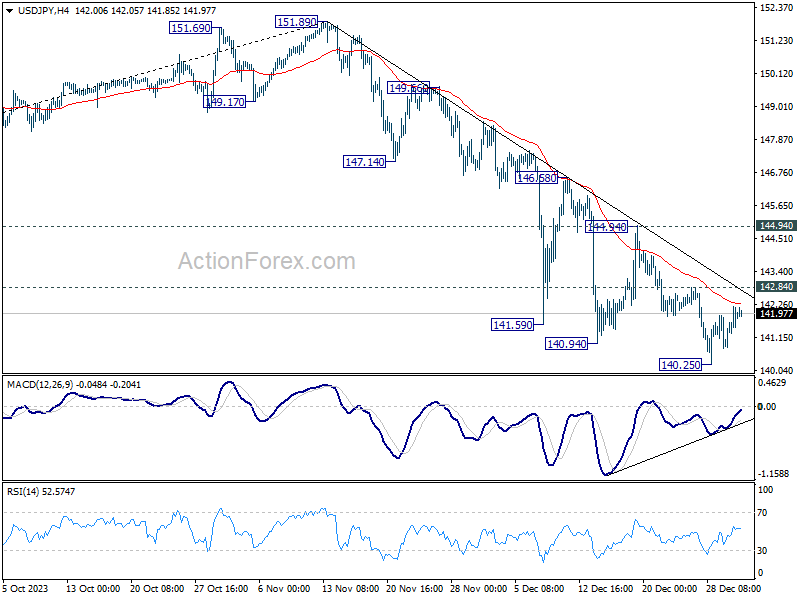
Technically, focuses remains on some Dollar pairs to gauge the chance of more sustainable rebound. Levels to watch include 1.0929 minor support in EUR/USD, 1.2611 minor support in GBP/USD, and 142.84 minor resistance in USD/JPY. Simultaneous break of these level is needed to confirm the underlying momentum of the greenback.
In Asia, at the time of writing, Hong Kong HSI is down -1.08%. China Shanghai SSE is down -0.26%. Singapore Strait Times is down -0.81. Japan is still on holiday. Overnight, DOW rose 0.07%. S&P 500 fell -0.57%. NASDAQ fell -1.63%. 10-year yield rose 0.080 to 3.946.
IMF's Georgieva: US on track for soft landing
In a CNN interview aired overnight, Kristalina Georgieva, Managing Director of IMF, provided an optimistic outlook for the US economy. She firmly stated that US is on track for "soft landing," suggesting a scenario where the economy will experience slowdown without slipping into recession.
Georgieva attributed this positive forecast to Fed's "decisiveness" in tightening monetary policy, which, according to her, has successfully started to mitigate inflationary pressures while avoiding a full-blown economic downturn.
In her message, Georgieva conveyed a sense of optimism for the general public, encouraging them to view the current economic scenario positively. She said, "You have a job, and interest rates are going to moderate this year because inflation is going down. Cheer up. It is a new year, people."
WTI oil heading back to 67.79 after initial volatility
Oil market experienced significant volatility on the first trading day of the year. Initially, oil prices saw an uptick, fueled by concerns over supply disruptions linked to escalating tensions in the Red Sea region, a vital gateway to the Suez Canal.
This surge was triggered by an incident where US helicopters thwarted an attack by Iran-backed Houthi forces on a vessel operated by Danish shipper Maersk in the Red Sea. Adding to the geopolitical complexities, an Iranian warship's entry into the Red Sea, reported by the semi-official Tasnim news agency, further heightened market anxieties.
However, as the day progressed, the oil markets reassessed the situation and concluded that direct engagement between the Iranian warship and American forces was unlikely. This reassessment led to a subsiding of initial fears regarding supply disruptions, causing oil prices to reverse their earlier gains and close lower.
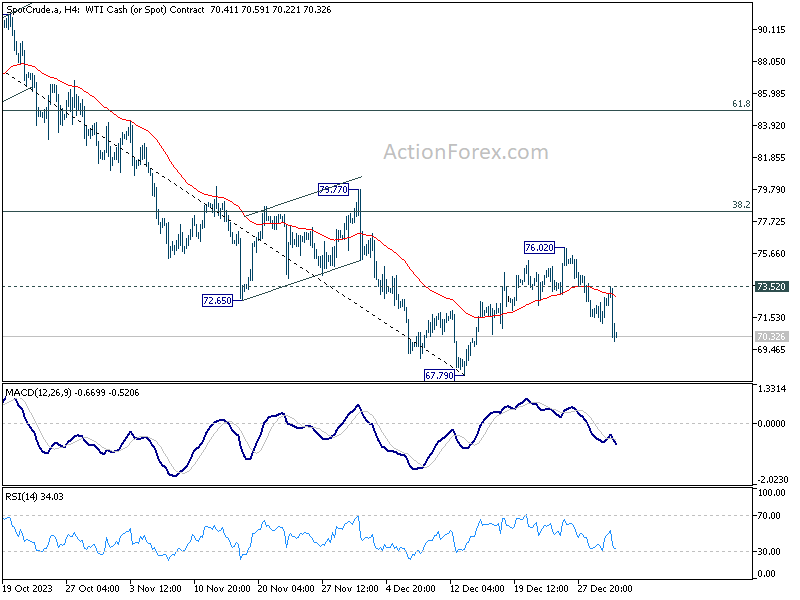
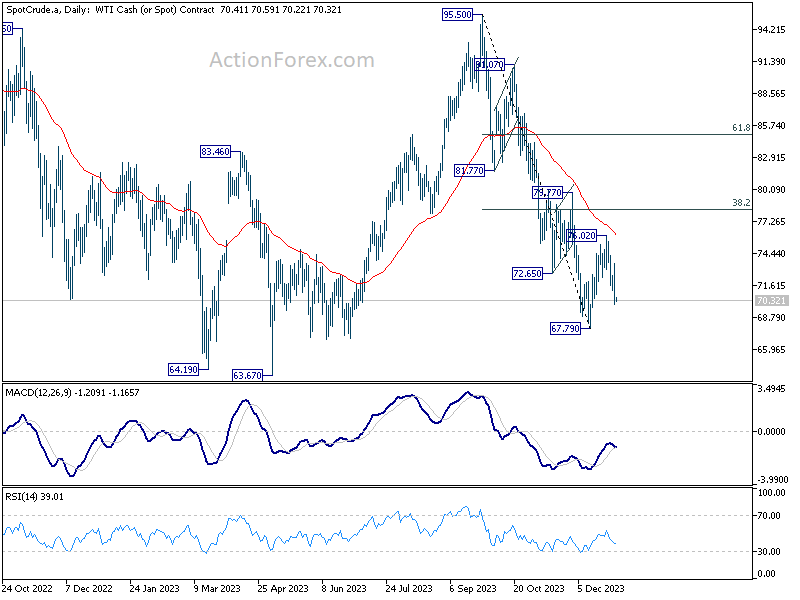
From a technical analysis standpoint, WTI's rebound from 67.79 short term bottom should have completed at 76.02. Rejection below 55 D EMA keeps near term outlook bearish. Further fall is expected as long as 73.52 minor resistance holds, to retest 67.79 low. Firm break there will resume larger decline from 95.50 (2023 high) to retest 63.67 (2023 low).
Nevertheless, break of 73.52 will extend the corrective pattern from 67.79 with another leg through 76.02 instead.
Looking ahead
Swiss PMI manufacturing and Germany unemployment data will be released in European session. But main focuses will be on US ISM manufacturing and FOMC minutes to be released later in the day.
GBP/USD Daily Outlook
Daily Pivots: (S1) 1.2567; (P) 1.2663; (R1) 1.2716; More...
Intraday bias in GBP/USD stays neutral for the moment, as 1.2611 support remains intact. On break of 1.2826 will resume whole rally from 1.2036. However, break of 1.2611 will indicate short term topping, and turn bias back to the downside for 1.2499 support.
In the bigger picture, price actions from 1.3141 medium term top are seen as a corrective pattern to rise from 1.0351 (2022 low). Rise from 1.2036 is seen as the second leg that's in progress. Upside should be limited by 1.3141 to bring the third leg of the pattern. Meanwhile, break of 1.2499 support will argue that the third leg has already started for 38.2% retracement of 1.0351 (2022 low) to 1.3141 at 1.2075 again.
Economic Indicators Update
| GMT | Ccy | Events | Actual | Forecast | Previous | Revised |
|---|---|---|---|---|---|---|
| 08:30 | CHF | Manufacturing PMI Dec | 43 | 42.1 | ||
| 08:55 | EUR | Germany Unemployment Change Dec | 20K | 22K | ||
| 08:55 | EUR | Germany Unemployment Rate Dec | 5.90% | 5.90% | ||
| 15:00 | USD | ISM Manufacturing PMI Dec | 47.1 | 46.7 | ||
| 15:00 | USD | ISM Manufacturing Prices Paid Dec | 50 | 49.9 | ||
| 15:00 | USD | ISM Manufacturing Employment Index Dec | 45.8 | |||
| 19:00 | USD | FOMC Minutes |
GBP/USD Dips Again, 200 SMA Is The Key To Fresh Increase
Key Highlights
- GBP/USD started a downside correction from the 1.2825 resistance.
- It traded below a key bullish trend line with support at 1.2715 on the 4-hour chart.
- EUR/USD also corrected lower below the 1.1020 support zone.
- The US ISM Manufacturing Index could increase slightly from 46.7 to 47.1 in Dec 2023.
GBP/USD Technical Analysis
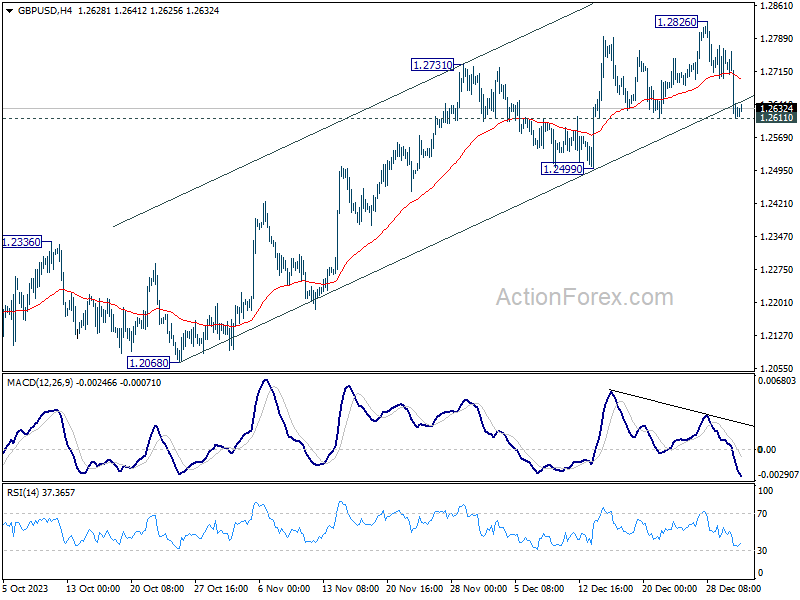
The British Pound faced resistance near the 1.2825 zone against the US Dollar. GBP/USD formed a short-term top and started a downside correction below 1.2750.
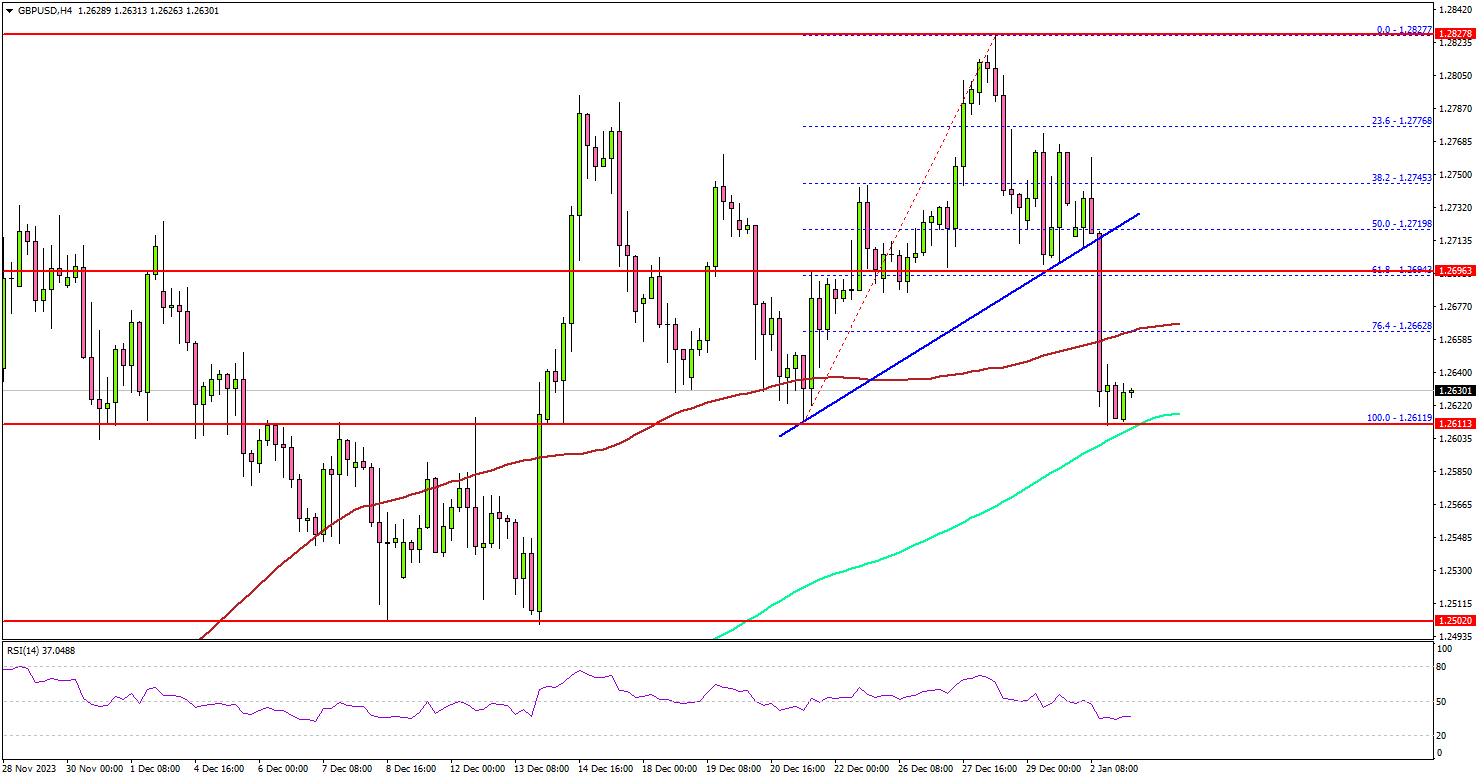
Looking at the 4-hour chart, the pair traded below a key bullish trend line with support at 1.2715. There was a spike below the 50% Fib retracement level of the upward move from the 1.2611 swing low to the 1.2827 high.
The pair even broke the 100 simple moving average (red, 4 hours). The next major support sits at 1.2610 or the 200 simple moving average (green, 4 hours).
A downside break below the 1.2600 zone could spark a sustained decline. The next major support is 1.2520, below which the pair might decline and test 1.2450. Any more losses might send the pair toward the 1.2300 zone.
On the upside, immediate resistance is near the 1.2680 level. The next key resistance is near the 1.2720 level. A close above the 1.2720 zone could open the doors for more upsides. The next stop for the bulls might be 1.2800.
Looking at EUR/USD, the pair also reacted to the downside and the bears were able to push it below the 1.1020 support.
Economic Releases
- US ISM Manufacturing Index for Dec 2023 – Forecast 47.1, versus 46.7 previous.
WTI oil heading back to 67.79 after initial volatility
Oil market experienced significant volatility on the first trading day of the year. Initially, oil prices saw an uptick, fueled by concerns over supply disruptions linked to escalating tensions in the Red Sea region, a vital gateway to the Suez Canal.
This surge was triggered by an incident where US helicopters thwarted an attack by Iran-backed Houthi forces on a vessel operated by Danish shipper Maersk in the Red Sea. Adding to the geopolitical complexities, an Iranian warship's entry into the Red Sea, reported by the semi-official Tasnim news agency, further heightened market anxieties.
However, as the day progressed, the oil markets reassessed the situation and concluded that direct engagement between the Iranian warship and American forces was unlikely. This reassessment led to a subsiding of initial fears regarding supply disruptions, causing oil prices to reverse their earlier gains and close lower.
From a technical analysis standpoint, WTI's rebound from 67.79 short term bottom should have completed at 76.02. Rejection below 55 D EMA keeps near term outlook bearish. Further fall is expected as long as 73.52 minor resistance holds, to retest 67.79 low. Firm break there will resume larger decline from 95.50 (2023 high) to retest 63.67 (2023 low).
Nevertheless, break of 73.52 will extend the corrective pattern from 67.79 with another leg through 76.02 instead.
IMF’s Georgieva: US on track for soft landing
In a CNN interview aired overnight, Kristalina Georgieva, Managing Director of IMF, provided an optimistic outlook for the US economy. She firmly stated that US is on track for "soft landing," suggesting a scenario where the economy will experience slowdown without slipping into recession.
Georgieva attributed this positive forecast to Fed's "decisiveness" in tightening monetary policy, which, according to her, has successfully started to mitigate inflationary pressures while avoiding a full-blown economic downturn.
In her message, Georgieva conveyed a sense of optimism for the general public, encouraging them to view the current economic scenario positively. She said, "You have a job, and interest rates are going to moderate this year because inflation is going down. Cheer up. It is a new year, people."
US PMI manufacturing finalized at 47.9, ends the year on a sour note
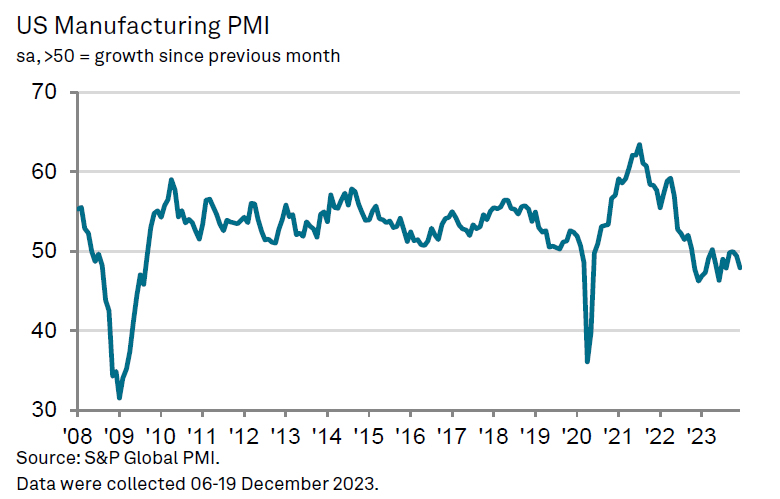
US PMI Manufacturing was finalized at 47.9 in December, down from November's 49.4.
Chris Williamson, Chief Business Economist at S&P Global Market Intelligence, said:
"US manufacturers ended the year on a sour note, according to S&P Global's PMI survey. Output fell at the fastest rate for six months as the recent order book decline intensified. Manufacturing will therefore likely have acted as a drag on the economy in the fourth quarter.
"The slowdown is spreading to the labor market. Payrolls were cut for a third month running as increasing numbers of firms grew concerned about the development of excess operating capacity. The fourth quarter has consequently seen factories reduce employment at a pace not seen since 2009 barring only the early pandemic lockdown months.
"With factories also cutting back sharply on their purchases of inputs in December, suppliers were also less busy on average, again hinting at the development of spare capacity.
"While there was some uplift in the rate of both raw material and factory gate selling price inflation, firms' costs notably continued to rise at a pace below the survey's long-run average to hint at historically subdued industrial price pressures.
"Given current order book trends, the overall picture from the survey is one of supply exceeding demand for many goods, which points to downside risks to production, employment and prices as we head into 2024. Potential supply chain disruptions need to be monitored, however, notably in terms of shipping, as the survey has clearly demonstrated in the past how supply chain tensions quickly feed through to higher prices."
EUR/USD Mid-Day Outlook
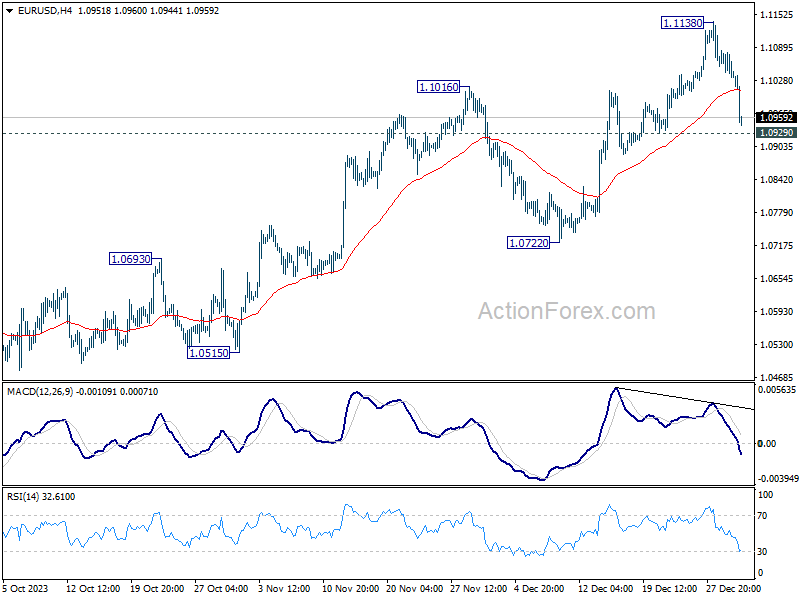
Daily Pivots: (S1) 1.1020; (P) 1.1052; (R1) 1.1070; More...
While EUR/USD's pull back from 1.1138 extends lower, it's still staying above 1.0929 support. Intraday bias remains neutral at this point. on the upside, break of 1.1138 will resume the rise from 1.0447 to retest 1.1274 high. Meanwhile, break of 1.0929 will indicate short term topping and turn bias back to the downside for 1.0772 support.
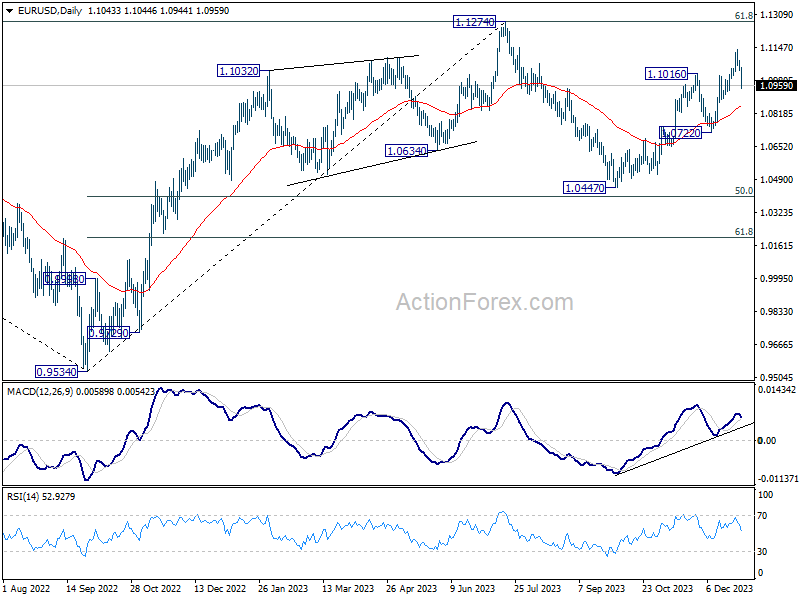
In the bigger picture, price actions from 1.1274 are viewed as a corrective pattern to rise from 0.9534 (2022 low). Rise from 1.0447 is seen as the second leg. While further rally could cannot be ruled out, upside should be limited by 1.1274 to bring the third leg of the pattern. Meanwhile, sustained break of 1.0722 support will argue that the third leg has already started for 1.0447 and below.
GBP/USD Mid-Day Outlook
Daily Pivots: (S1) 1.2698; (P) 1.2735; (R1) 1.2770; More...
While GBP/USD's pull back from 1.2826 extends lower today, it's staying above 1.2611 support so far. Intraday bias remains neutral first. On the upside, break of 1.2826 will resume whole rally from 1.2036. However, break of 1.2611 will indicate short term topping, and turn bias back to the downside for 1.2499 support.
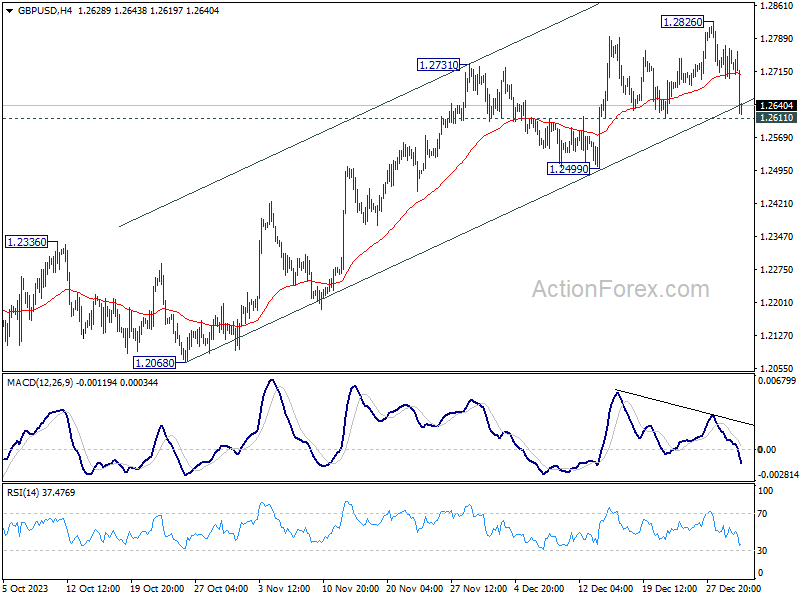
In the bigger picture, price actions from 1.3141 medium term top are seen as a corrective pattern to rise from 1.0351 (2022 low). Rise from 1.2036 is seen as the second leg that's in progress. Upside should be limited by 1.3141 to bring the third leg of the pattern. Meanwhile, break of 1.2499 support will argue that the third leg has already started for 38.2% retracement of 1.0351 (2022 low) to 1.3141 at 1.2075 again.