Sample Category Title
EUR/USD Stabilizes After Slide, FOMC Minutes Loom
- Euro slips to two-week low
- US ISM Manufacturing PMI expected to rise slightly
- FOMC minutes to be released later on Wednesday
- Germany, Eurozone to release CPI on Thursday
The euro has steadied on Wednesday after sustaining sharp losses a day earlier. In the European session, EUR/USD is trading at 1.0932, down 0.08% and its lowest level since December 21.
The US dollar has been struggling in recent weeks but came flying out of the gates on Tuesday, the first trading day of the New Year. The euro fell 0.88% against the dollar, its worst one-day showing since October. The dollar’s spike could be due to profit-taking as the data calendar was light on Tuesday and the dollar gained ground against all of the major currencies.
It’s a busy day for US releases after a lull during the week of Christmas. The ISM Manufacturing PMI is expected to rise to 47.1 for December, compared to 46.7 in November. The manufacturing sector has been in a miserable slump and hasn’t shown expansion since October 2022. Manufacturers have been squeezed by weak demand abroad and high borrowing costs. With the Fed expected to start cutting rates in March, we could see manufacturing respond with increased business activity.
The Federal Reserve releases the FOMC meeting of the December meeting later today. The meeting was highly significant as the Fed surprised the markets by failing to push back against rate-cut fever. The Fed signalled that it expected to trim rates three times in 2024, a major pivot from the well-worn script of ‘higher for longer’. Investors will be looking for details about the shift in Fed policy which has boosted the equity markets and weighed on the US dollar.
Germany and the eurozone will post the December inflation reports on Thursday. Last week, Spain posted lower-than-expected inflation numbers. Inflation has eased to 3.2% in Germany and 2.4% in the eurozone, as the ECB’s target of 2% is getting closer. Will the December numbers show inflation continues to fall? If so, the European Central Bank will be under pressure to lower rates. ECB President Lagarde has so far dismissed talk of rate cuts, but she may need to shift her hawkish stance if inflation continues to fall, as the eurozone economy is struggling and could use some relief in the form of rate cuts.
EUR/USD Technical
- There is resistance at 1.1069 and 1.1102
- 1.0958 and 1.0887 are the next support lines

Germany’s unemployment rises 5k, still holding up well
In December, Germany's unemployment count rose by 5k to 2.703m, a figure notably lower than the anticipated increase of 20k. This increment brings the total number of unemployed in Germany to 183k higher compared to the same period a year ago. Additionally, unemployment rate inched up from revised 5.8% to 5.9%, aligning with expectations.
Andrea Nahles, chair of Federal Employment Agency, acknowledged that economic challenges of 2023 have indeed impacted the labor market, but she also emphasized the market's relative resilience in the face of these stressors.
She noted, "If we look back at 2023, we can see that the weak economy has left its mark on the labor market — however, considering the extent of the stress and uncertainty, the labor market is still holding up well."
US DJIA Technical: Uptrend Intact With Looming Outperformance Over Nasdaq 100
- Nasdaq 100 outperformance over the Dow Jones Industrial Average (DJIA) since the start of the major uptrend phase has started to dissipate.
- A bullish rotation into the laggard, DJIA is considered a sign of a positive breadth development for the US stock market.
- Watch the key short-term support at 37,470.
Since our last analysis, the US Wall St 30 Index (proxy of the Dow Jones Industrial Average futures) has continued its march upwards as expected and hit a fresh all-time high of 37,855 yesterday, 2 January 2023. It ended yesterday’s US session with a small daily gain of +0.15%.
In contrast, the technology and growth-oriented mega “Magnificent 7” group of stocks that have a significant combined weightage of approximately 35% in the Nasdaq 100 sold off yesterday on the backdrop of negative news flows.
Barclays downgraded Apple to underweight for the first time since 2019 as it cited soft demand for the latest model of iPhone and a potential backlash on US semiconductors firms’ future sales to the Chinese market; the US White House may implement more stringent curbs on US semiconductors related exports to China as the leading Dutch semiconductor equipment maker, ASML has been pressured by the US Biden administration to cancel some of its top-end semiconductors peripherals (deep ultraviolet lithography machines) to China immediately ahead of export bans on the high-end chipmaking equipment came into effect.
The Nasdaq 100 was the worst performer among the major benchmark US stock indices yesterday with a daily loss of -1.7% versus the S&P 500 (-0.6%), and small-cap Russell 2000 (-0.7%).
The current major uptrend phases of the S&P 500, Nasdaq 100, and Dow Jones Industrial Average started in early October 2022 and the Nasdaq 100 has led the fort. Before yesterday’s sell-off in the “Magnificent 7”, the Nasdaq 100’s outperformance has started to dissipate since the start of November 2023 (see Fig 1).
Bullish rotation into the laggards; Dow Jones Industrial Average & Russell 2000
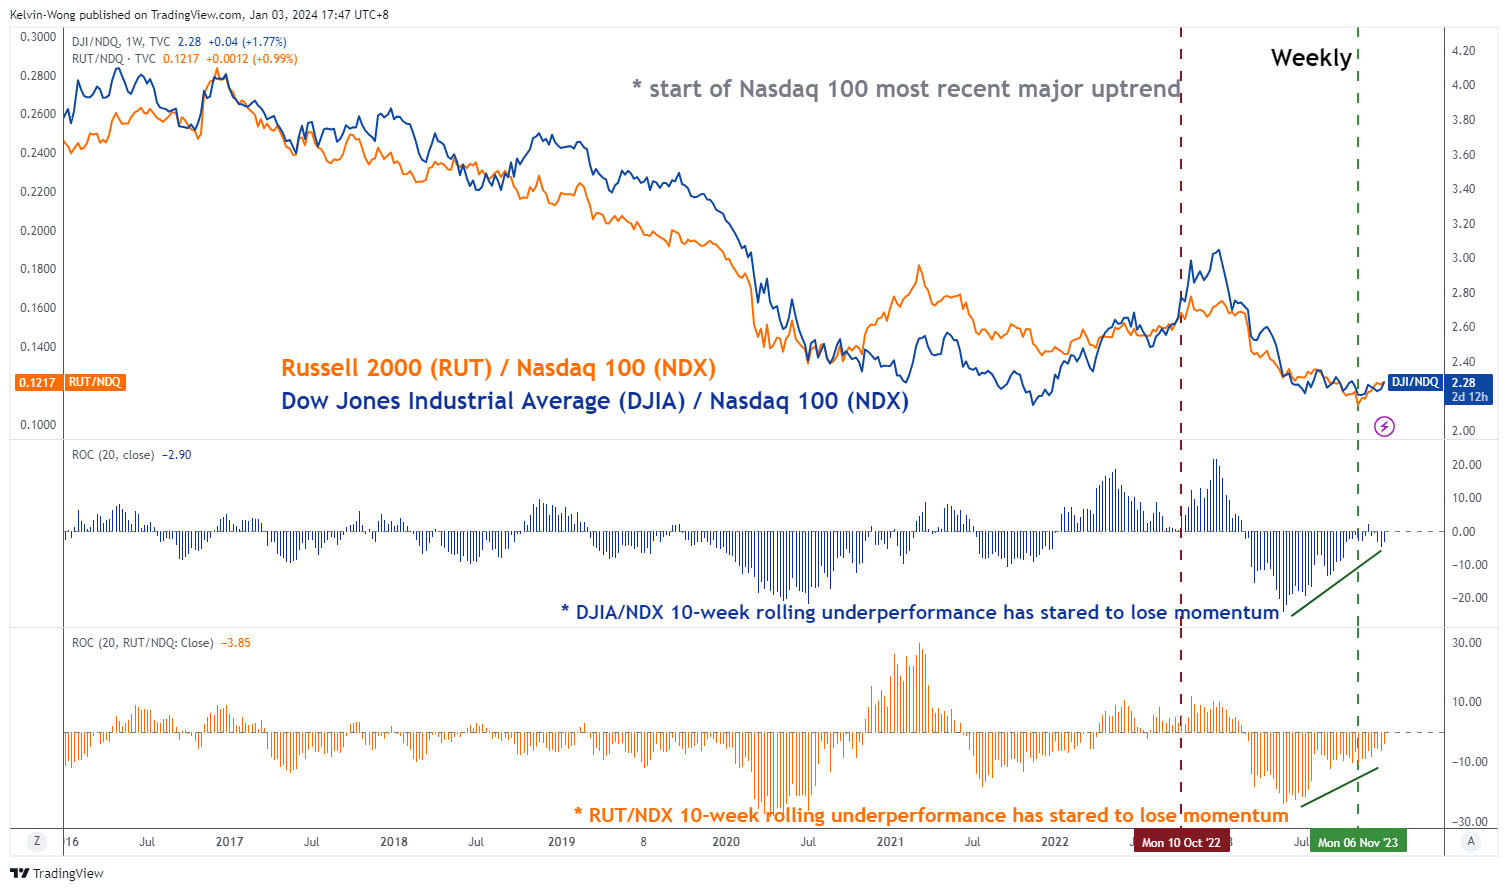
Fig 1: Ratio charts of DJIA & Russell 200 over Nasdaq 100 as of 2 Jan 2024 (Source: TradingView, click to enlarge chart)
The ratio chart of the Dow Jones Industrial Average (DJIA)over the Nasdaq 100 started to tick up on 6 November 2023 with its 10-week rolling underperformance measured by the ratio’s rate of change that has started to lose downside momentum which suggests a potential looming outperformance of DJIA over the Nasdaq 100.
This current movement of bullish rotation into the laggards of the US stock market is considered a healthy sign of improving breadth as the heavily concentrated leadership of the “Magnificent 7” that rode on the coat-tail of the “AI productivity” theme play is being dissipated which reduces the odds of the ongoing major uptrend phases in the US benchmark stock indices from turning in a frothy climatic melt-up.
Sell-off stalled at minor channel support
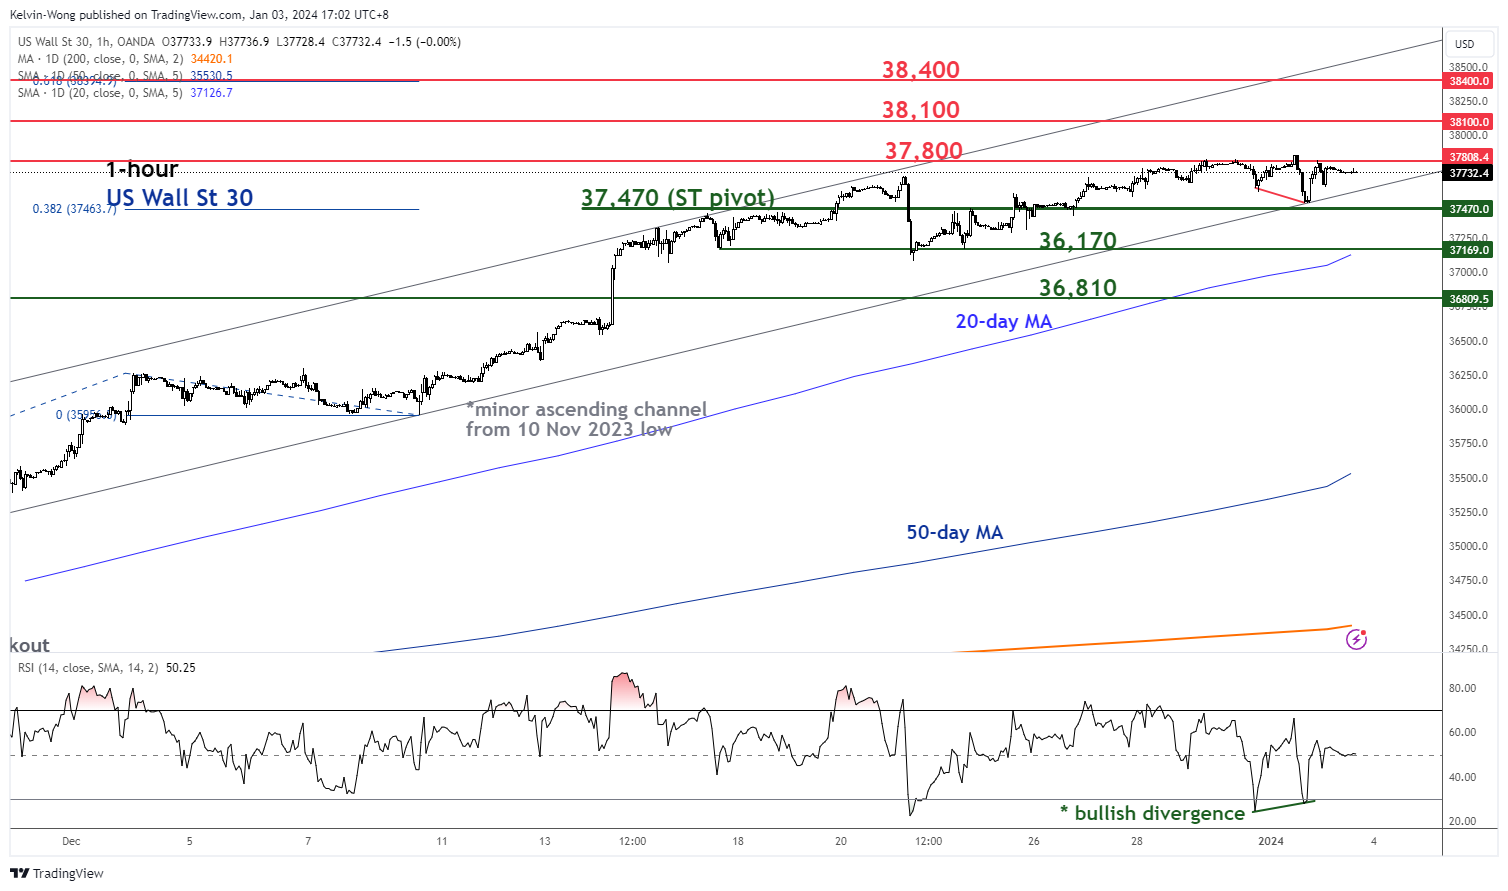
Fig 2: US Wall St 30 minor short-term trend as of 3 Jan 2024 (Source: TradingView, click to enlarge chart)
Yesterday’s intraday decline of – 0.9% in the US Wall St 30 Index has managed to stall at the lower boundary of its minor ascending channel in place since the 10 November 2023 low.
In conjunction, the hourly RSI momentum indicator has flashed out a bullish divergence condition at its oversold region which suggests a slowdown in bearish momentum that may lead to bullish inflection to kickstart the next impulsive upmove sequence in price actions.
Watch the 37,470 key short-term pivotal support and a clearance above 37,800 sees the next intermediate resistances coming in at 38,100 and 38,400 (upper boundary of the minor ascending channel & a cluster of Fibonacci extension levels).
On the flip side, failure to hold at 37,470 negates the bullish tone for a minor corrective decline towards the next immediate supports at 36,170 (also the 20-day moving average), and 36,810 (former all-time swing high area of 5 January 2022).
Gold Begins 2024 on a Weak Note
- Gold has a cautious start to the new year
- Technical signals weaken but need confirmation
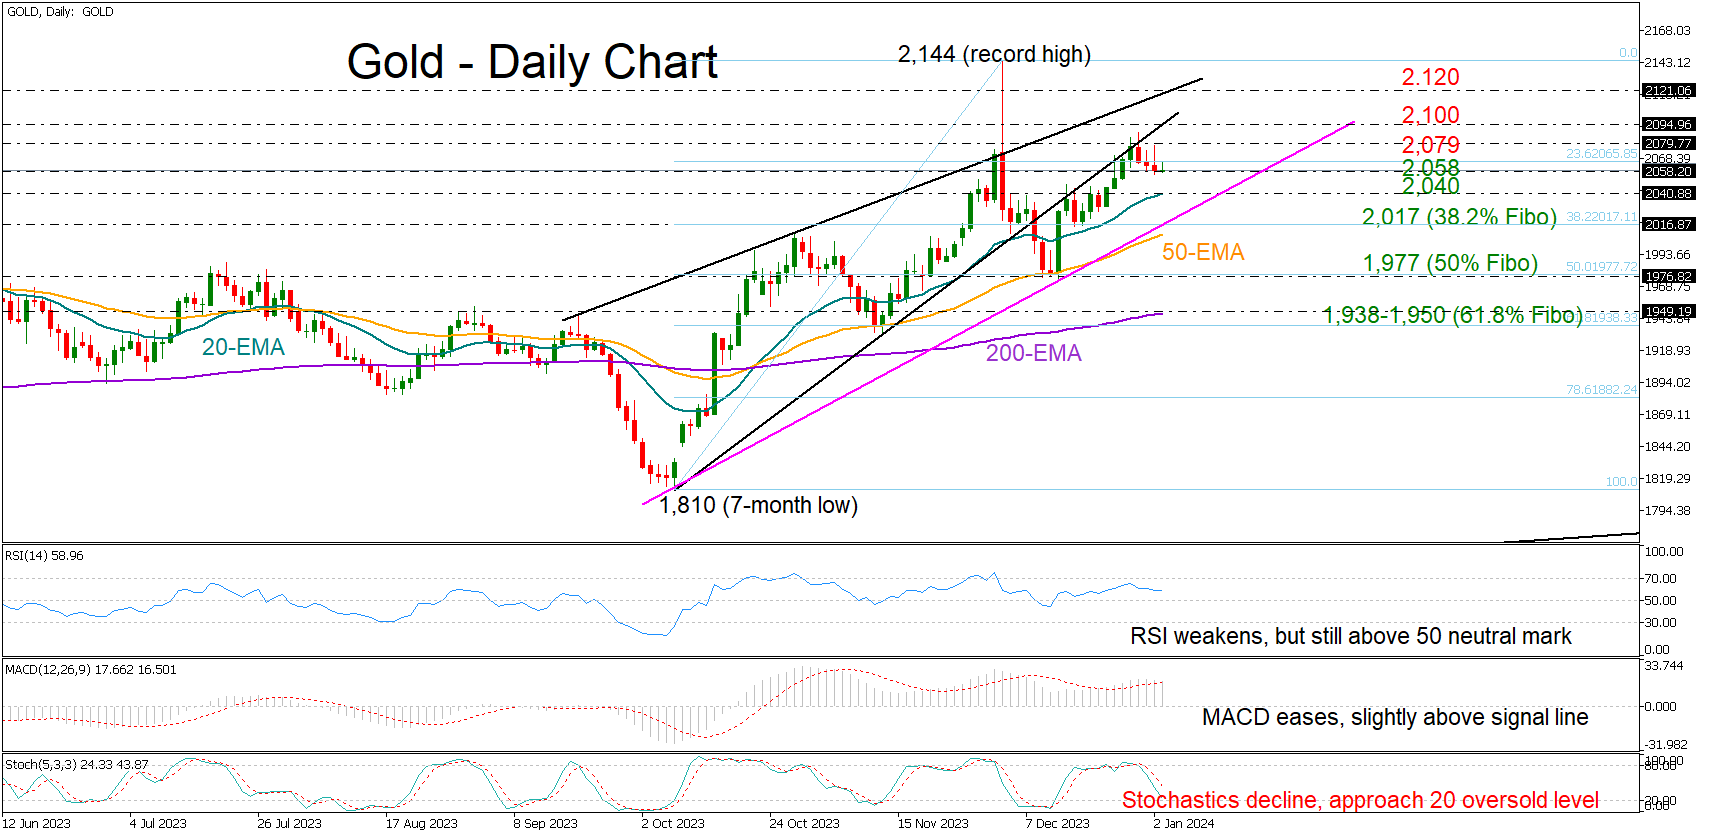
Gold opened the new year with mild losses after its bullish attempts to close above the May 2023 bar of 2,079 proved fruitless in the last week of December.
The price is currently trading muted slightly below the 23.6% Fibonacci retracement of the previous upleg at 2,065 but there is still a ray of hope for another upturn. The RSI is still clearly above its 50 neutral mark despite losing some ground, while the stochastic oscillator is a short distance above its 20 oversold level, suggesting that any additional declines might stall soon.
Should the bears breach the current support area of 2,058, the 20-day exponential moving average (EMA) could immediately add a footing around 2,040. If not, the sell-off might intensify towards the 38.2% Fibonacci mark of 2,017 and the 50-day EMA, where the tentative ascending line from the October 2023 low is positioned. Additional losses from there could press the precious metal towards the 50% Fibonacci of 1,977.
Alternatively, a move back above 2,065 will struggle for a close above the 2,079 border. Slightly higher, the 2,100 number could be of psychological importance, while the resistance line from September 2023 at 2,120 will be closely watched before all the attention turns to the record high of 2,144.
In brief, the latest pullback in the price is looking discouraging, but the bulls have not put down their weapons yet. A close above 2,065 could restore some buying appetite.
USDJPY Buyers Appear Strong in 2024
- USDJPY shows some progress
- MACD and RSI turn up
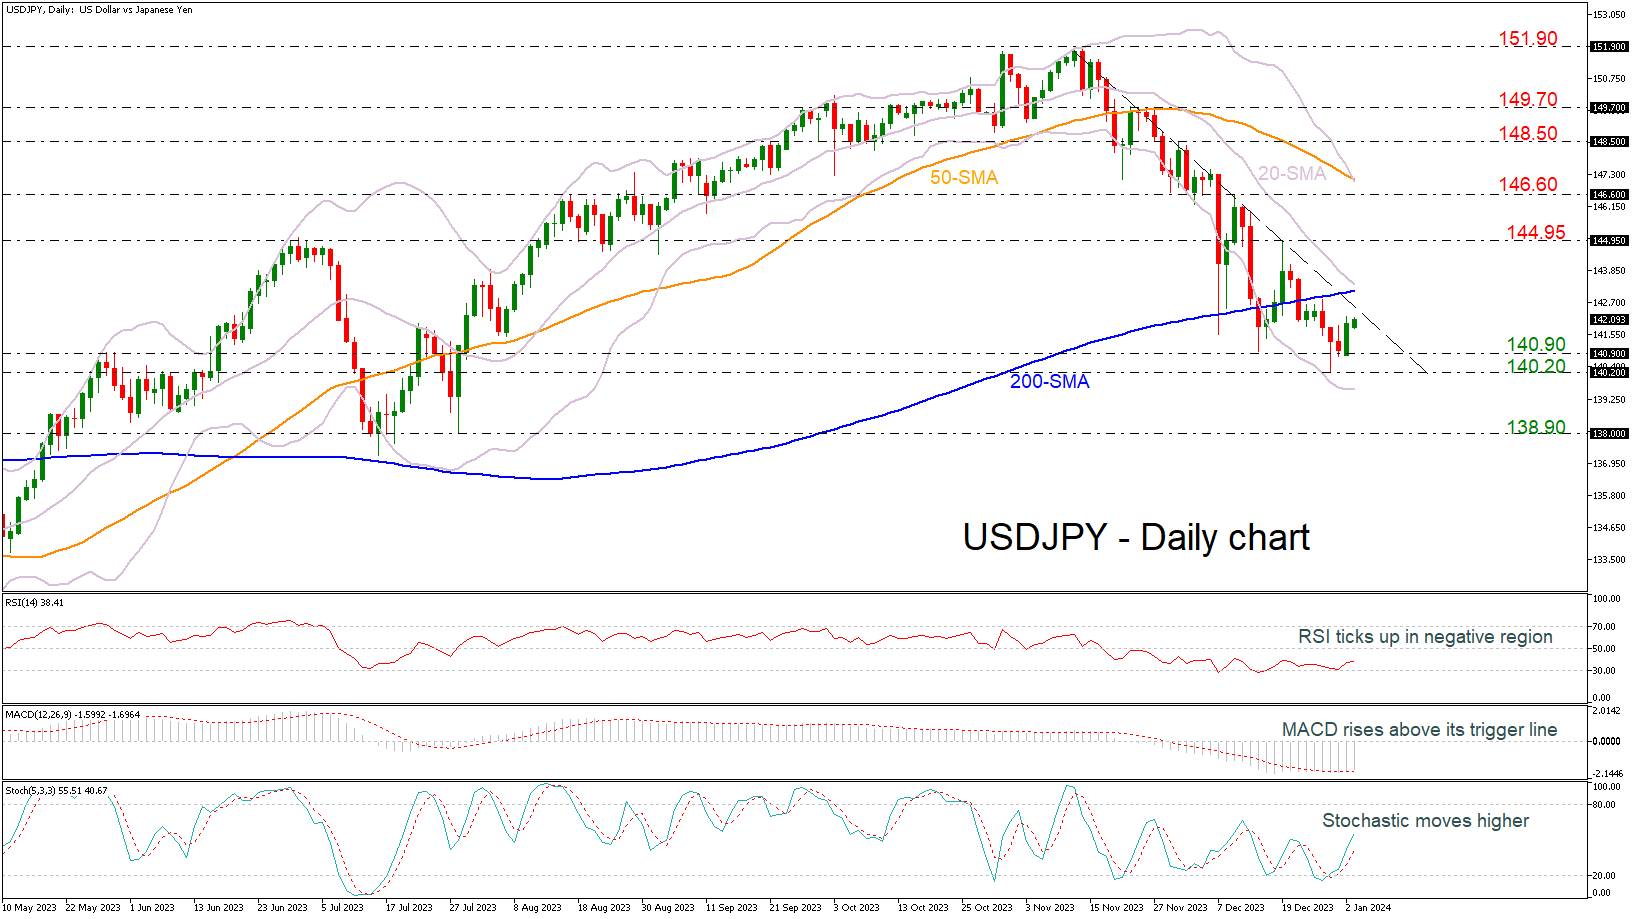
USDJPY started 2024 in a positive mode as it rebounded off the 140.90 support level with strong resistance coming from the steep descending trend line.
The RSI is below its 50 neutral mark, although it has strengthening, and the MACD is keeping its footing above its red signal line and within the negative area. Yet, the stochastic oscillator is looking for an upside reversal, but it’s uncertain if there is enough bullish power to boost the price towards the November top of 151.90.
In the event of an uptrend resumption above the immediate resistance lines of the downtrend line at 142.60, the 200-day simple moving average (SMA) at 143.15 and the mid-level of the Bollinger band at 143.40, the bulls might take a breather near the 144.95 barricade before stretching towards the 146.60 level. Should it give way, the door would open for the 50-day SMA, which overlaps with the upper Bollinger band at 147.00.
Nevertheless, the pair has key levels underneath for protection against selling forces. The 140.90 and the 140.20 support levels have been limiting downside movements over the past three weeks. If the bears take the lead again, the pair could plummet towards the 138.90 support, registered on July 28.
In brief, USDJPY buyers are trying to take control; however, it needs significant boost to change the current bearish outlook to bullish in the short-term timeframe.
Dollar Loved the Combination of Higher Yields and Some Risk Aversion
Markets
Core bonds started the year on the backfoot, extending the U-turn which started in the final trading week of the year following an astonishing December rally. German yields rose by 4.4 bps (10-yr) to 5.5 bps (2-yr) while US yields added 4.3 bps (30-yr) to 7.9 bps (3-yr). From a technical point of view, both the US Note future and German Bund future trade near the lower bound of steep upward channels. That bond rally is testimony to investor confidence in a goldilocks scenario: avoiding a recession while inflation returns to 2% inflation targets, allowing central banks to switch from rate hikes to rate cuts. The Fed at its December policy meeting embraced such scenario while the ECB was more reluctant, preaching higher-for-longer. Money markets in any case went a very long way in discounting a change of heart at central banks, pricing a cumulative 150 bps of rate cuts in both the US and Europe with cutting cycles respectively starting in March and April. While it might be a little early to fight December market momentum, we believe these normalization bets are way overdone. The NY-shortened trading week could immediately challenge or confirm last year’s turn. The US manufacturing ISM, JOLT job openings and Minutes of the pivotal December Fed policy meeting are scheduled for release today followed by ADP employment change and weekly jobless claims tomorrow and payrolls and non-manufacturing ISM on Friday. Anything bar big disappointments could trigger some profit taking on bond positions with investors returning to more neutral positions as 2024 gets going and awaiting more central bank guidance. Richmond Fed Barkin is the first one today to comment on the economic outlook. The European agenda centers around national (tomorrow) and aggregate (on Friday) inflation numbers for the month of December. Statistical base effects are expected to interfere with the disinflationary process, lifting headline inflation back above 3% Y/Y. This development should back the ECB’s higher-for-longer talk and could take some air out of the bond rally as well. Higher bond yields blocked stock market momentum yesterday. The EuroStoxx50 went for a test of last year’s high in the open, but eventually closed 0.2% lower. US losses reached up to 1.6% for Nasdaq in a tech-led setback. The dollar loved the combination of higher yields and some risk aversion with the trade-weighted greenback rallying from 101.42 to 102.20. Technically, DXY stays trapped in the downward trend channel since early November. EUR/USD fell from 1.1045 to 1.0942. A firmer floor below core bond yields could help a more firm bottoming out pattern in the dollar as well.
News & Views
In his New Year address to the nation, Czech President Petr Pavel advocated that it is time for the country to begin making concrete steps to fulfil its obligation to adopt the euro. He assessed that despite ongoing discussions about advantages and disadvantages of the euro for a country with an open economy that is highly reliant on exports, its position in the center of Europe makes the adoption of the common currency a ‘logical future’. For now, the President’s call is mainly a political statement, with no direct implications. The current government officially takes the line that it intends to meet the Maastricht criteria for adopting the euro as soon as possible, but didn’t set out any specific time frame. The economic confidence index of the UK institute of Directors dropped from -21 in November to -28 in December, the lowest level since August. Even as the overall index declined, business leaders in general were more upbeat on their own activity. Even so, the decline of the index caused the policy director at IoD , Roger Baker, to advocate an early BoE rate cut: "With inflationary pressures abating, business is in dire need of a boost if it is to help drive meaningful economic growth in 2024".
GBP/USD Retreats From Highs, USD/CAD Grinds Higher
GBP/USD declined below the 1.2715 support zone. USD/CAD is rising and might aim for more gains above the 1.3330 resistance.
Important Takeaways for GBP/USD and USD/CAD Analysis Today
- The British Pound started a fresh decline below the 1.2715 support zone.
- There is a key bearish trend line forming with resistance near 1.2680 on the hourly chart of GBP/USD at FXOpen.
- USD/CAD is showing positive signs above the 1.3260 support zone.
- There was a break above a major bearish trend line with resistance near 1.3260 on the hourly chart at FXOpen.
GBP/USD Technical Analysis
On the hourly chart of GBP/USD at FXOpen, the pair started a fresh decline from the 1.2820 zone. The British Pound traded below the 1.2715 support to move further into a bearish zone against the US Dollar.
The pair even traded below 1.2680 and the 50-hour simple moving average. Finally, the bulls appeared near the 1.2610 level. A low was formed near 1.2610 and the pair is now attempting a recovery wave.
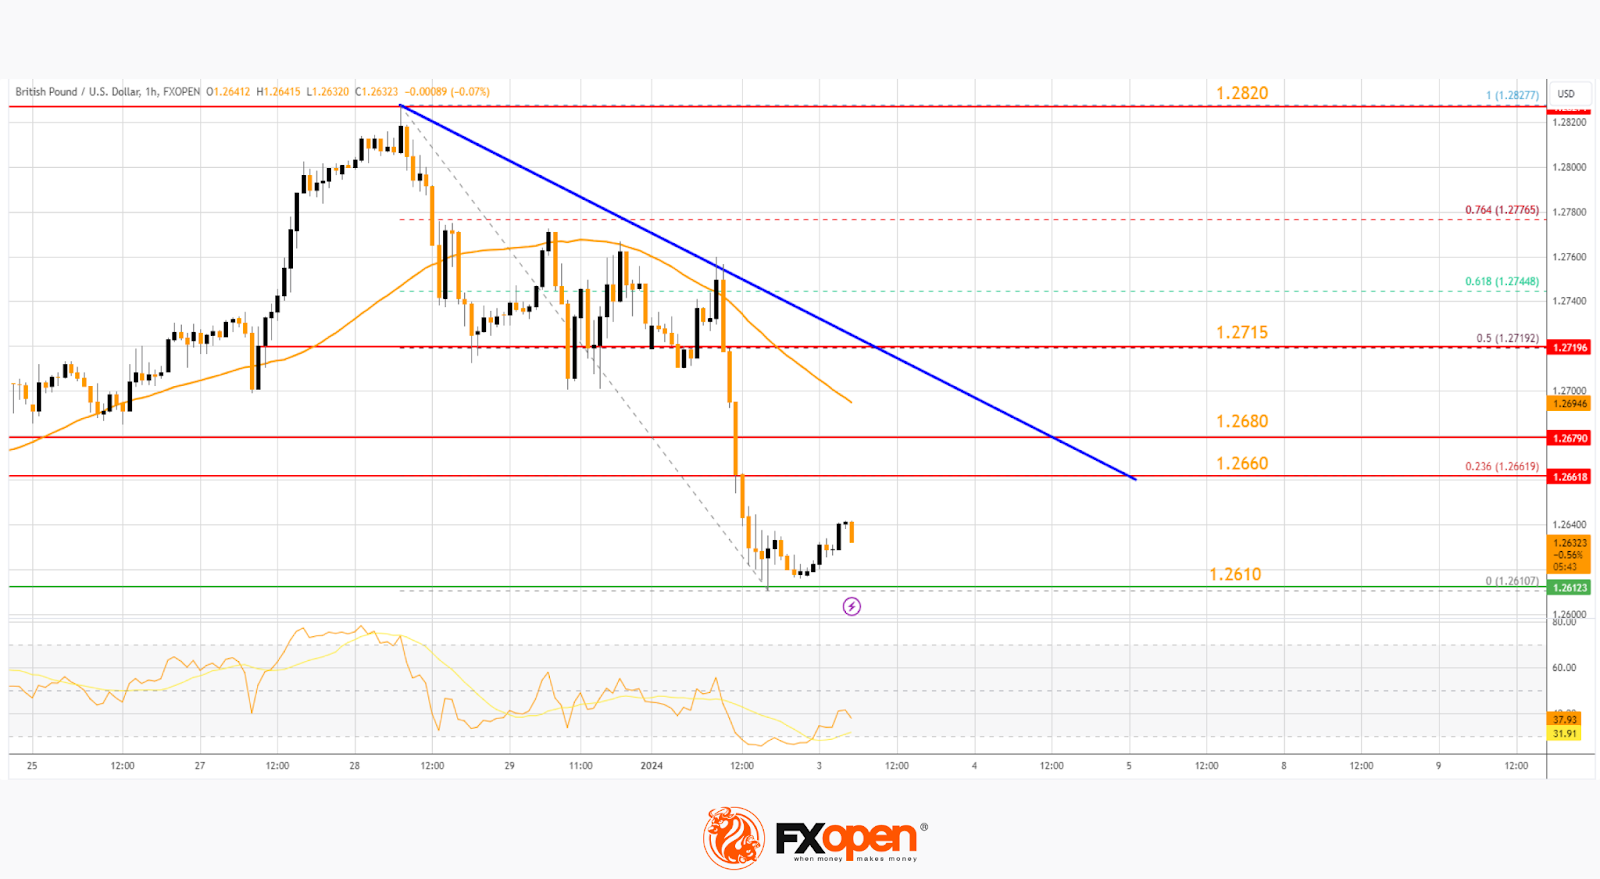
Immediate resistance on the upside is near the 23.6% Fib retracement level of the downward move from the 1.2827 swing high to the 1.2610 low at 1.2660. The first major resistance is near a key bearish trend line at 1.2680 or the 50-hour simple moving average.
A close above the 1.2680 resistance might spark a steady upward move. The next major resistance is near the 50% Fib retracement level of the downward move from the 1.2827 swing high to the 1.2610 low at 1.2715. Any more gains could lead the pair toward the 1.2820 resistance in the near term.
Initial support sits near 1.2610. The next major support is at 1.2565, below which there is a risk of another sharp decline. In the stated case, the pair could drop towards 1.2500.
USD/CAD Technical Analysis
On the hourly chart of USD/CAD at FXOpen, the pair formed a strong support above the 1.3175 level. The US Dollar started a fresh increase above the 1.3220 resistance against the Canadian Dollar.
There was a break above a major bearish trend line with resistance near 1.3260. The pair cleared the 50-hour simple moving average and climbed above 1.3300. There was a move above the 61.8% Fib retracement level of the main decline from the 1.3371 swing high to the 1.3177 low.
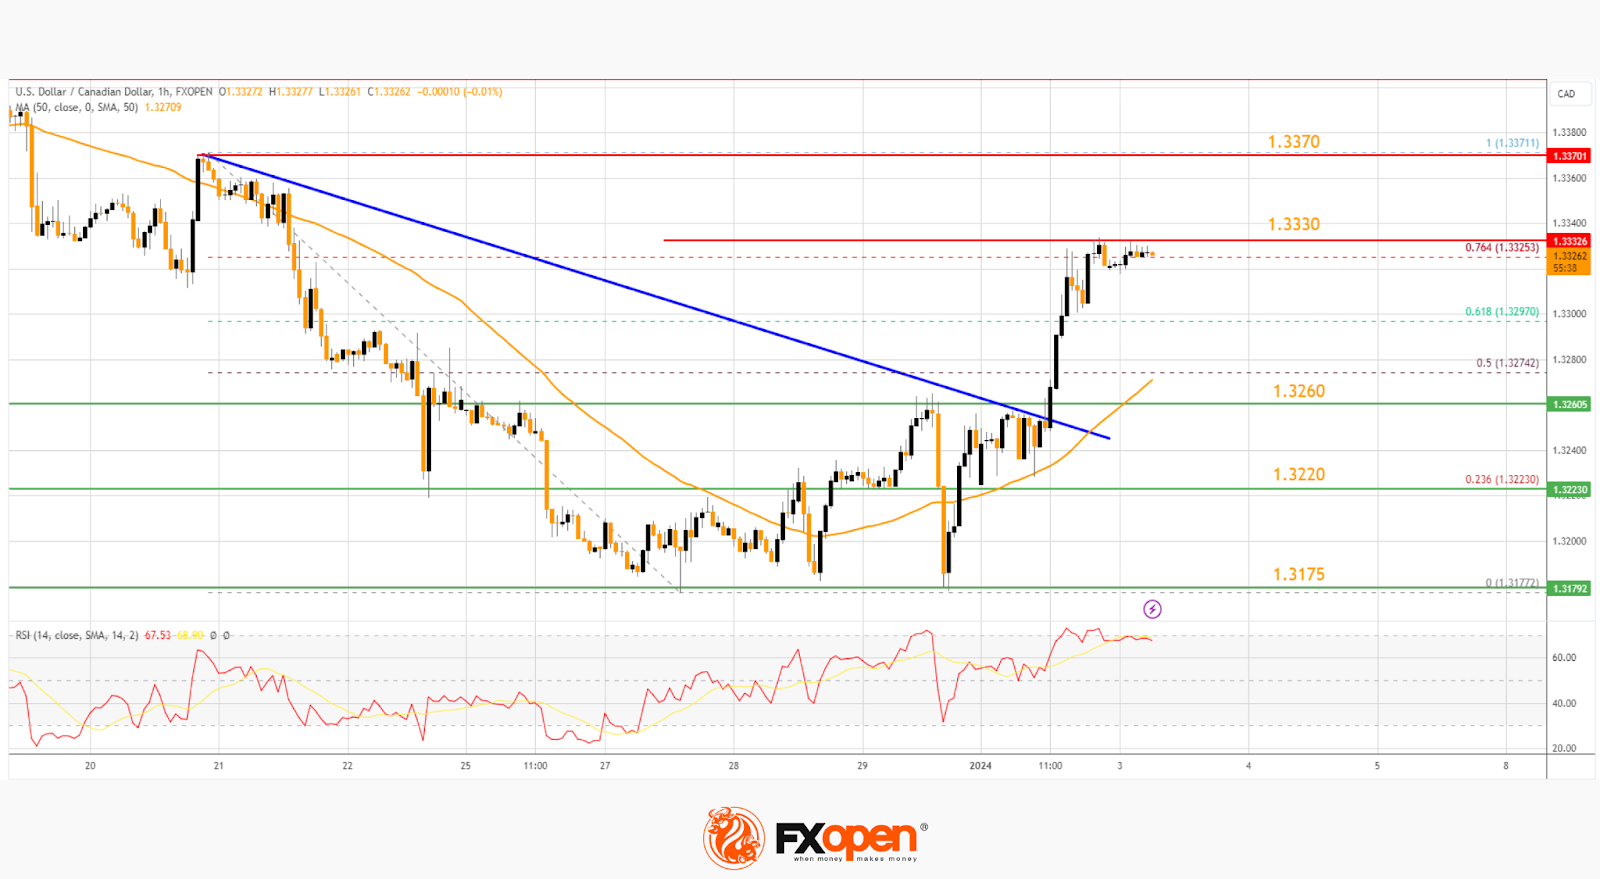
It is now consolidating near the 76.4% Fib retracement level of the main decline from the 1.3371 swing high to the 1.3177 low. Initial resistance sits near the 1.3330 zone.
A clear upside break above 1.3330 could start another steady increase. The next major resistance is the 1.3370 level. A close above the 1.3370 level might send the pair towards the 1.3850 level. Any more gains could open the doors for a test of the 1.3940 level.
Initial support is near the 50-hour simple moving average and 1.3260. The next major support is near 1.3220 on the same USD/CAD chart.
The main support sits near 1.3175. A downside break below this level could push the pair further lower. The next major support is near the 1.3140 support zone, below which the pair might visit 1.3080.
GBP/JPY Daily Outlook
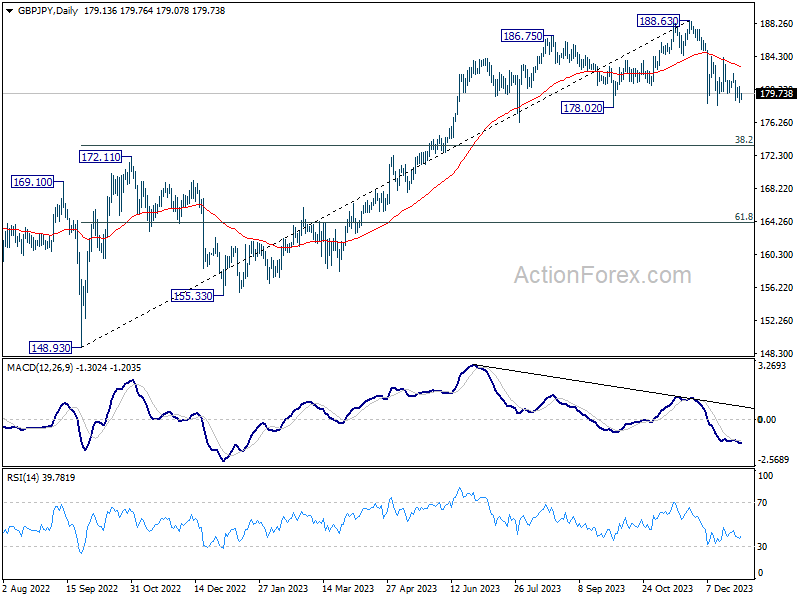
Daily Pivots: (S1) 178.40; (P) 179.52; (R1) 180.31; More...
Range trading continues in GBP/JPY and intraday bias remains neutral. Further decline is expected as long as 184.15 resistance holds. On the downside, break of will resume the decline from 188.63 and target 38.2% retracement of 148.93 to 188.63 at 173.46. However, decisive break of 184.15 will argue that pull back from 188.63 has completed and bring retest of this high.
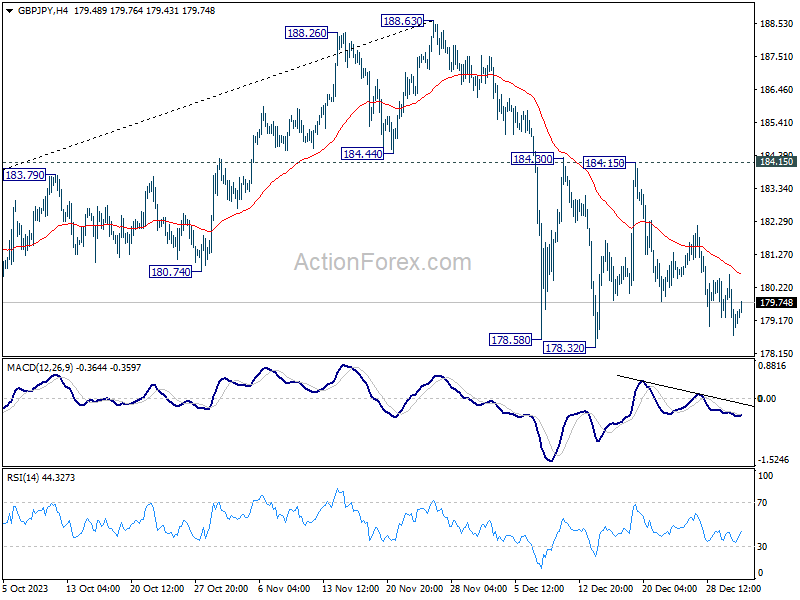
In the bigger picture, price actions from 188.63 medium term top are currently seen as a correction to the up trend from 148.93 (2022 low) only. As long as 172.11 resistance turned support holds, larger up trend from 123.94 (2020 low) is still in favor to resume through 188.63 at a later stage.
EUR/JPY Daily Outlook
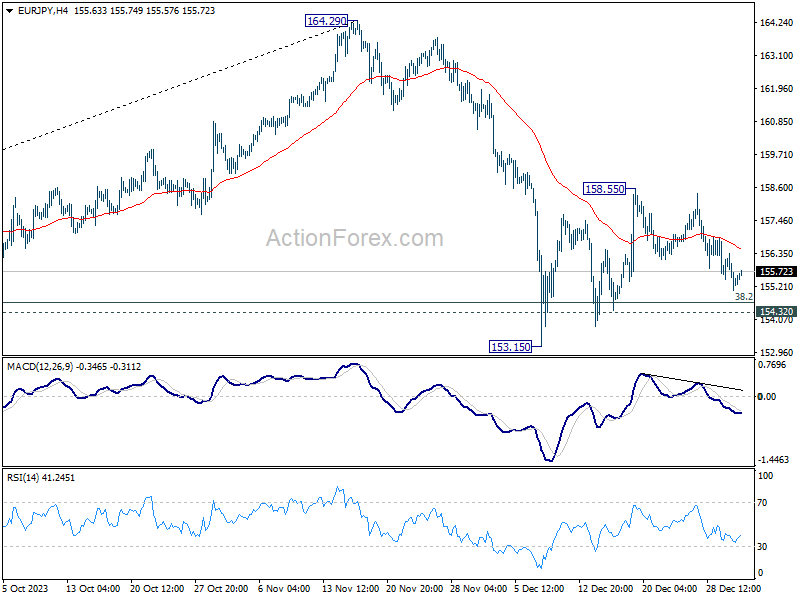
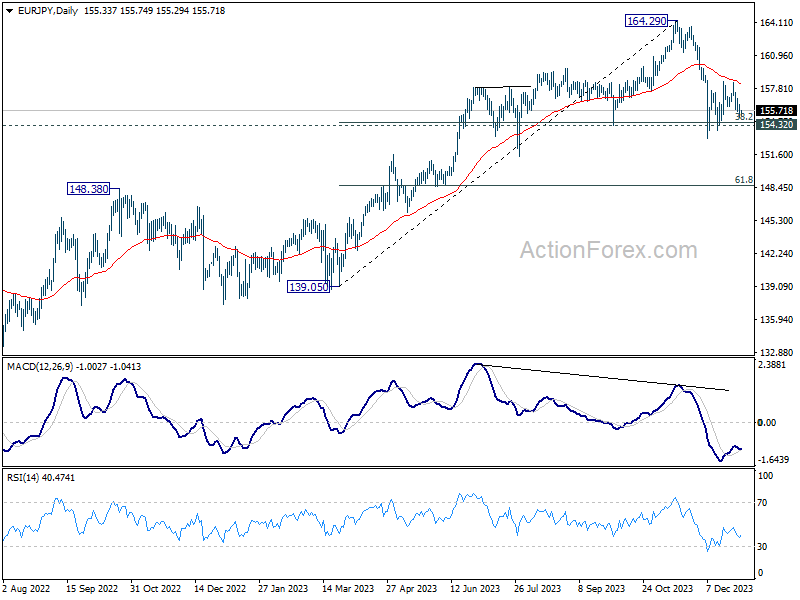
Daily Pivots: (S1) 154.84; (P) 155.59; (R1) 156.11; More...
Intraday bias in EUR/JPY remains neutral as range trading continues. On the upside, above 158.55 will resume the corrective rebound from 153.15. On the downside, break of 153.15 will resume whole fall from 164.39 to 61.8% retracement of 139.05 to 164.29 at 148.69.
In the bigger picture, price actions from 164.29 medium term top are tentatively seen as a correction to rise from 139.05 for now. As long as 148.48 resistance turned support holds (2022 high), larger up trend from 114.42 (2020 low) could still resume through 164.29 at a later stage.
EUR/GBP Daily Outlook
Daily Pivots: (S1) 0.8648; (P) 0.8668; (R1) 0.8690; More...
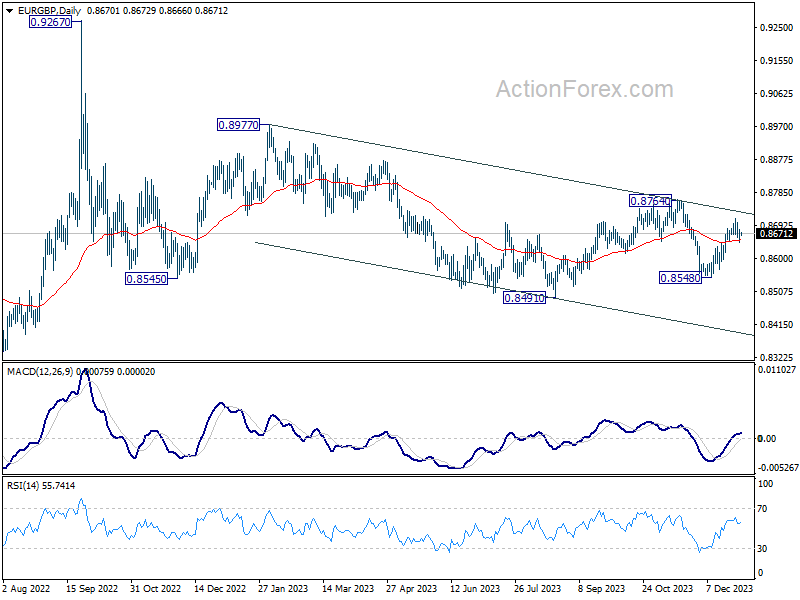
Intraday bias in EUR/GBP is turned neutral again as it recovered after brief dip to 0.8644. On the downside, firm break of 0.8644 will suggest that rebound from 0.8548 has completed at 0.8713 already. Deeper fall should be seen to retest 0.8548 support. On the upside, however, break of 0.8713 will resume the rebound to 0.8764 key resistance next.
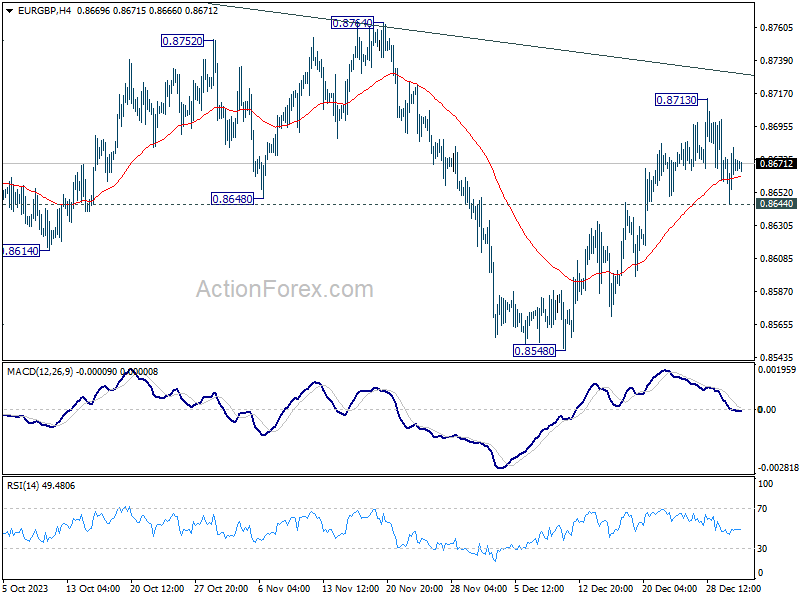
In the bigger picture, current development suggests that down trend from 0.9267 (2022 high) is still in progress. This decline is seen as the third leg of the pattern from 0.9499 (2020 high). Break of 0.8201 will target 100% projection of 0.9499 to 0.8201 from 0.9267 at 0.7969. In any case, outlook will stay bearish as long as 0.8764 resistance holds.