Sample Category Title
Weekend’s Developments Push Brent Crude Prices (June Contract) Back Above $100/b
Markets
Talks between the US and Iran failed this weekend. The diametrically opposed US 15-point plan and Iran’s 10-point version turned out to be a weak foundation after all. JD Vance said that Iran refused to burry its nuclear ambitions, singling out one specific issue as reason for the collapse. Iran said its delegation approached the meeting in Islamabad in good faith, but that the US failed to gain Iranian officials’ trust. To add more and new pressure on Iran, the US announced a blockade of all maritime traffic entering and exiting Iranian ports from today 10 am ET (4pm CET). By effectively closing the Strait of Hormuz, the US wants to squeeze out Iranian oil (revenues) while avoiding having to seize the oil export hub (Kharg island). Indirectly, it might lead to some Chinese pressure as the country is the main buyer of Iranian oil. Simultaneously with the start of the “open for all or close for all” policy, the US navy will sweep the Straight in search of sea mines. Iran reacted that military vessels attempting to approach Hormuz under any pretext would be considered a violation of the ceasefire. US President Trump reacted, amongst others, by repeating his military threat in case “any Iranian fires at us”. This weekend’s developments push Brent crude prices (June contract) back above $100/b. They rise from just above $94/b on Friday to currently more than $102/b. US Treasuries cede ground with the curve currently bear flattening. US yields add 3 to 4 bps. The dollar’s gains are moderate at best (EUR/USD 1.1685 from 1.1730). Asian stock markets lose around 1%-1.5% after last week’s impressive short squeeze. The damage today is way smaller than last Monday’s relief rally as the ceasefire, while fragile, still stands. That gives both parties slightly over a week to get back on speaking terms. An end to the ceasefire is the trigger point to really dent risk sentiment. On bond markets, there’s the oil perspective. We’ve already moved beyond the point where higher energy prices start having non-linear effects on other prices/the real economy as well. Central bankers suggested they’ll use a more agile approach this time around to shield those upward inflation risks. From tomorrow on, several of them including ECB Lagarde and BoE Bailey have the opportunity to give an update on their reaction functions at the annual IMF/World Bank meetings. Even since the start of the ceasefire last week, money markets didn’t (completely) close the door on a near-term, April, rate hike especially in Europe. June action (and later) is more of a done deal. Today’s eco calendar is empty, leaving room for the Iran trade (higher energy prices) to play out.
News & Views
Peter Magyar’s Tisza party secured a landslide victory in yesterday’s Hungarian parliamentary elections. Obtaining a projected 138 seats out of the 199 up for grabs means the now-former opposition party has a two-thirds majority. Tisza has the power to rewrite the constitution and restore what the European Commission has slammed as breaches to the rule of law and an erosion of democratic standards in 16 years of Orban rule. The latter’s Fidesz party is projected to win 55 seats compared to 133 in 2022. Magyar’s campaign centered around the skyrocketing inflation triggering a cost-of-living crisis, stagnant economic growth, poor public services and endemic corruption. That resonated strongly with the public, which drew en masse to the ballot. The 78% turnout was higher than in any general election since the fall of communism in the 1990s. The victory of the pro-European Tisza puts Hungary on track for smoother European cooperation and the unblocking of some €20bn in funds. The Hungarian forint in early Asian dealings rallies to an almost three-year high around EUR/HUF 367.7.
UK hiring activity deteriorated only slightly last month, the KPMG and REC monthly job report found, with the geopolitical developments so far not having stopped the trend of labour market stabilization. Permanent staff appointments declined only marginally for the second month in a row, while temp billings decreased modestly. The surveyors linked exacerbated uncertainty because of the Middle East war as well as rising costs to the fall. Some companies are pressing ahead with their previously delayed hiring plans and have offered some counterweight but may remain cautious in doing so going forward until the economic fallout of the Gulf conflict becomes clearer. Overall vacancies fell at the softest pace since last May, the third deceleration in a row, suggesting the downturn for labour demand is also easing. With demand still low, however, and candidates rising sharply, starting salaries increased more slowly. Labour supply expanded at the quickest rate in 2026 to date.
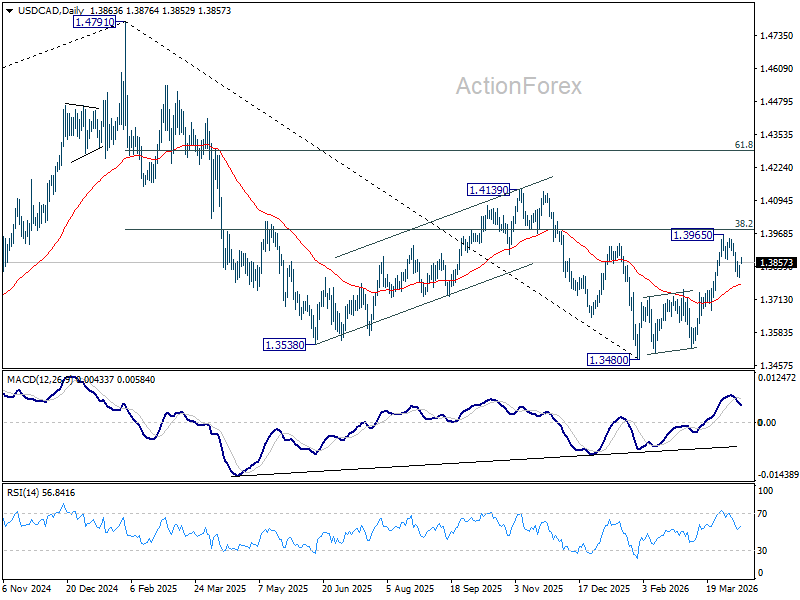
USD/CAD Daily Outlook
Daily Pivots: (S1) 1.3813; (P) 1.3830; (R1) 1.3860; More...
USD/CAD recovered notably today but stays well below 1.3965 resistance. Intraday bias remains neutral first. Consolidations could extend and another dip might be seen. But outlook will stay bullish as long as 38.2% retracement of 1.3840 to 1.3965 at 1.3780 holds. On the upside, firm break of 1.3965 will resume the rise from 1.3480. However, sustained break of 1.3780 will argue that the rebound from 1.3840 has completed, and bring deeper decline to 61.8% retracement at 1.3665 and below.
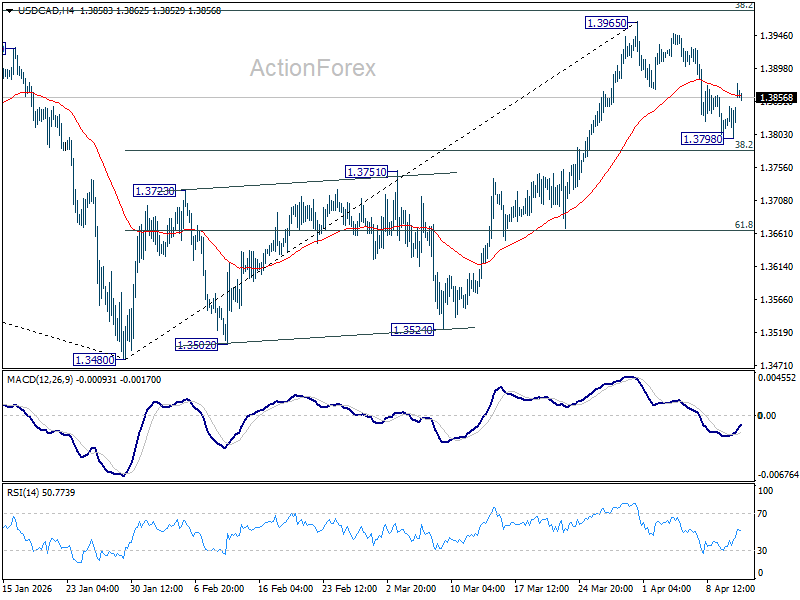
In the bigger picture, price actions from 1.4791 are seen as a corrective pattern to the whole up trend from 1.2005 (2021 low). Deeper fall could be seen, as the pattern extends, to 61.8% retracement of 1.2005 to 1.4791 at 1.3069. However, decisive break of 38.2% retracement of 1.4791 to 1.3480 at 1.3981 will argue that the correction has completed with three waves down to 1.3480 already. Further break of 1.4139 will confirm and bring retest of 1.4791 high.
Markets Calm as Oil Price Holds Below Crisis Levels, Dollar Gains but Lacks Conviction
Markets stayed composed in early trading, with oil holding below crisis levels despite renewed tensions around the Strait of Hormuz. Brent crude climbed toward $105 after US-Iran talks in Islamabad ended without a breakthrough, yet the absence of panic buying signals that traders are not pricing a full supply shock. Dollar edged higher on the headlines, but gains lacked conviction, reflecting a market that is unwinding the “peace premium” and resetting to cautious positioning rather than turning decisively risk-off.
The muted reaction across assets reinforces the idea that markets are shifting into a “vigilance mode” rather than panic. Asian equities traded lower, but losses were contained. Gold eased slightly on Dollar strength yet held firmly around the $4,700 level. The broader picture suggests that while geopolitical risk has re-entered pricing, it has not triggered disorderly repositioning.
The geopolitical backdrop remains fluid. The US-Iran talks, which stretched over 21 hours, ended without tangible process towards a formal agreement. The primary sticking point was Iran’s refusal to provide an affirmative commitment to abandon its nuclear program, while US demands on regional security remained unchanged. Iran’s counter-demands—including the unfreezing of assets, war reparations, and continued control over the Strait of Hormuz—were also rejected. The failure to bridge these gaps underscores the structural difficulty of reaching a comprehensive deal, even as both sides acknowledged the historic nature of the engagement.
Following the talks, US President Donald Trump announced that the US Navy would begin a blockade of ships entering or leaving the Strait of Hormuz. However, subsequent clarifications from the US Navy and CENTCOM indicate that enforcement is targeted at vessels linked to Iranian ports. This distinction is crucial. Rather than a blanket shutdown, the blockade functions as a surgical economic measure aimed at curbing Iran’s exports.
Restraint also comes from the timeline. The ceasefire remains in place until April 22, leaving a window for renewed negotiations or policy adjustments. Additionally, markets are still factoring in the possibility that deadlines could be extended once again by Trump, further delaying any definitive escalation.
Looking ahead, macro data will begin to intersect with geopolitical developments. US PPI will serve as the first hard signal of how energy costs are feeding into inflation, while the Fed’s Beige Book may offer early insights into economic conditions under rising uncertainty. In Europe, ECB’s policy accounts could reveal how close policymakers are to a rate hike as rising energy prices push them into a more hawkish stance. UK February GDP data will provide a snapshot of growth momentum ahead of the war. In the Asia-Pacific, another strong Australian jobs report would reinforce expectations of further RBA tightening in May.
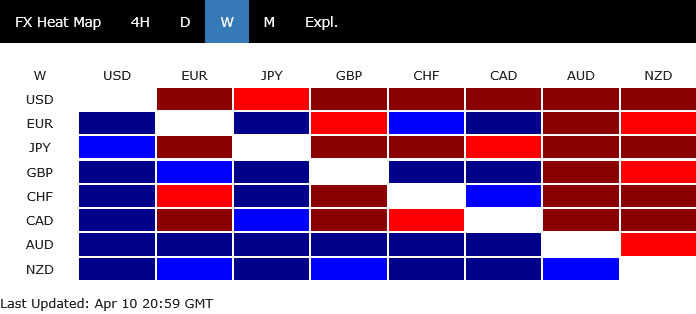
In currency markets, Dollar is currently the strongest for the day so far, followed by Loonie and Kiwi. Sterling is the weakest, with Swiss Franc and Aussie also underperforming. Euro and Yen are holding in the middle of the pack.
In Asia, at the time of writing, Nikkei is down -0.82%. Hong Kong HSI is down -1.11%. China Shanghai SSE is up 0.11%. Singapore Strait Times is down -0.39%. Japan 10-year JGB yield is up 0.027 at 2.469.
Oil Hits $105 but No Panic as Reality of Hormuz Blockade Falls Short of Headlines
Oil climbs to $105 after US announces a Hormuz blockade, but markets are not pricing a full-blown supply crisis. Instead, traders are unwinding the “peace premium” and resetting to pre-ceasefire risk levels, as the reality of a "targeted" disruption falls short of headline fears. With supply still flowing and diplomacy not fully collapsed, oil remains in a state of “tense vigilance.” Read more.
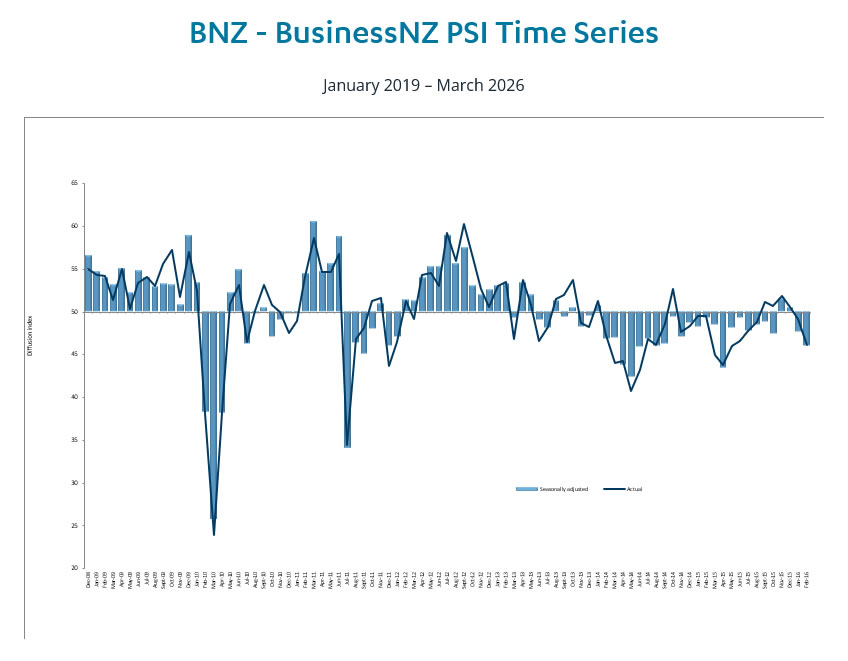
New Zealand PSI Drops to 46.0, BNZ Sees Economy Nearing Contraction
New Zealand’s services sector weakened further in March, with PSI falling to 46.0 and all key components remaining in contraction. BNZ now warns the economy could be nearing contraction, prompting a downgrade to its 2026 growth outlook. Read more.
USD/CAD Daily Outlook
Daily Pivots: (S1) 1.3813; (P) 1.3830; (R1) 1.3860; More...
USD/CAD recovered notably today but stays well below 1.3965 resistance. Intraday bias remains neutral first. Consolidations could extend and another dip might be seen. But outlook will stay bullish as long as 38.2% retracement of 1.3840 to 1.3965 at 1.3780 holds. On the upside, firm break of 1.3965 will resume the rise from 1.3480. However, sustained break of 1.3780 will argue that the rebound from 1.3840 has completed, and bring deeper decline to 61.8% retracement at 1.3665 and below.
In the bigger picture, price actions from 1.4791 are seen as a corrective pattern to the whole up trend from 1.2005 (2021 low). Deeper fall could be seen, as the pattern extends, to 61.8% retracement of 1.2005 to 1.4791 at 1.3069. However, decisive break of 38.2% retracement of 1.4791 to 1.3480 at 1.3981 will argue that the correction has completed with three waves down to 1.3480 already. Further break of 1.4139 will confirm and bring retest of 1.4791 high.
Shift of Power in Hungary – US Set to Block the Strait of Hormuz This Afternoon
In focus today
Tensions in the Middle East continue to take focus, as uncertainty surrounding the two-week cease-fire gains momentum after no deal was reached in the talks over the weekend.
It is a quieter week for key market events. On Tuesday, the US releases PPI and Sweden publish its final CPI readings. On Thursday, we get the Q1 GDP and the monthly batch of data from China. Euro area final HICP is also due, while the US reports industrial production and manufacturing output. Throughout the week, several ECB and Fed officials are scheduled to speak.
Economic and market news
What happened over the weekend
In Hungary, Péter Magyar's centre-right and pro-EU Tisza party beat Orban's nationalist Fidesz party in Sunday's parliamentary election. Viktor Orban conceded defeat after early results showed the opposition party leading with a projected two‑thirds majority in the 199‑seat parliament. Reported turnout at was record-high at 77.8% versus 67.8% at the previous parliamentary election. With Magyar's election win, the uncertainty surrounding the EU's aid packages to Ukraine and the next EU seven-year-budget is reduced, as there is a much smaller risk that Hungary will block or delay negotiations. Magyar, a former Orbán ally, campaigned on rebuilding trust with the EU and NATO, restoring the rule of law and joining the euro area by 2030. However, Magyar does not signal a clear break from Orbán's approach, shares several core positions and he is not seeking an abrupt cut in ties with Russia or clearly advocating for the provision of military aid to Ukraine.
In the Middle East, the situation remains fragile as the US and Iran over the weekend failed to reach an agreement in peace talks in Pakistan, raising doubts about whether the two-week ceasefire will hold. Disputes especially regarding the Strait of Hormuz and Iran's nuclear program appear to remain key sticking points. Iranian officials have not ruled out a second round of talks, even if no new date has been set. After the talks on Sunday, US President Trump announced that the US would launch a naval blockade of the Strait of Hormuz and destroy any mines that Iran had dropped in the Strait. Later, the US military's central command confirmed that the blockade will take place beginning today at 4pm CET, and this morning, President Trump elaborated that the US would block ships entering or exiting Iranian ports. Iran's Revolutionary Guards warned that any military vessel approaching the Strait of Hormuz would be treated as a ceasefire violation and met with a swift, forceful response, heightening the risk of serious escalation.
The oil market reacted swiftly to the breakdown of talks between the US and Iran over the weekend. Brent crude jumped back above USD100/bbl as the market has turned sceptical on the outlook for a near-term resumption of traffic through the Strait of Hormuz. It traded above USD110/bbl before the ceasefire announcement last week and there is a clear possibility it will rise back to this level of the sides does not restart talks the coming days.
In the US, March flash CPIs were released with headline inflation picking up as expected to 0.9% m/m SA and 3.3% y/y (Feb: 0.3%m/m SA, 2.4% y/y). The sharp increase is driven especially by energy prices that are up 10.9% m/m. Core CPI surprised slightly to the downside at 0.2% m/m against expectations of 0.3% m/m, due to softer services excl. shelter. Overall, it was a dovish report due to the steady development in core goods and services.
Norway's March core inflation held at 3.0% y/y, below the 3.1% y/y consensus and in line with Norges Bank's forecast, while headline inflation was 3.6% y/y, slightly higher than Norges Bank's forecast at 3.5% y/y. The Norwegian wage settlement ended with a central pay raise that is expected to result in overall wage growth of 4.4% in 2026. This is at the upper end of our expectations but is marginally lower than what Norges Bank assumed in the monetary policy report in March. Hence, the outcome should be neutral for Norges Bank. With Norges Bank back in March guiding towards a hike at "one of the forthcoming monetary policy meetings", the prints were regarded as more important than usual for the near-term pricing of May vs June as the most likely time for the first hike. With these prints the rate decision in May remains wide open, as markets are pricing approximately a 50/50 chance of a hike.
In Denmark, CPI increased to 1.2% y/y in March from 0.7% y/y in February, a sharp increase but slightly less than our 1.3% y/y forecast, as food prices continued their downward trend. Price surges on gasoline and diesel were especially the big inflation drivers in March.
Equities: Equity futures are pointing to an opening south of -1% today, mirroring the sell-off across Asia as the first round of negotiations between the US and Iran over the weekend failed. However, US markets were lower already on Friday, with the S&P 500 closing down -0.1% and HY credits -0.4%, despite solid inflation figures. In contrast, Stoxx 600 closed up 0.4% and OMX Nordic surged 1.3%, so we should expect a catch-down effect amplifying negative reaction in our markets today. Interestingly, the tech sector was one of the best-performing sectors in the US on Friday, despite software continuing to sell off. Semis could more than compensate for this weakness, however, which is interesting - and in line with our views, outlined in our equity strategy piece published last week. Materials and real estate also fared well, while it was defensive sectors like health care and staples selling off. Hence, risk appetite was fully visible throughout last week despite the negative closing.
FI and FX: Brent crude gap opens above US 100 per barrel on Monday morning after the US and Iran failed to reach an agreement over the weekend. Consequently, equities and equity futures are in red and the USD a bit stronger. US Treasury yields are modestly higher with 10y at 4.35%. EUR/USD trades at 1.1690, EUR/SEK sits at 10.90 after a 10-figure rebound in the US session on Friday and EUR/NOK starts the week at 11.15. The HUF is supported by the outcome in the Hungarian election where Orban was defeated. EUR/HUF drops almost 2% to just below 368, the lowest level since mid-2023.
Oil Hits $105 but No Panic as Reality of Hormuz Blockade Falls Short of Headlines
Oil prices climbed back toward $105 after the latest escalation around the Strait of Hormuz, but markets have stopped well short of panic pricing. Despite strong headlines around a US "total blockade" of the Strait of Hormuz following inconclusive US-Iran talks in Islamabad, the response has been controlled rather than explosive. The moves in Brent and WTI crude reflects a reversal of the earlier “peace premium”, with traders resetting to pre-ceasefire risk levels—unwinding expectations of a near-term diplomatic breakthrough without fully pricing a worst-case disruption scenario.
Targeted vs. Total Blockade
The muted reaction points to a critical nuance: the difference between a "targeted" and "total" blockade. US President Donald Trump’s rhetoric was sweeping, declaring that all ships entering or leaving the Strait would be blocked. However, the operational reality has been far more contained.
US Navy and CENTCOM clarifications indicate that enforcement is focused on vessels linked to Iranian ports. This effectively removes around 1.5–2 million barrels per day of Iranian exports, rather than shutting down the entire artery of global energy flows.
This distinction matters. While Iranian supply is significant, it is not system-critical in the same way as the full Strait of Hormuz, which carries roughly 15–18 million barrels per day. As long as flows from Saudi Arabia, Kuwait, and the UAE remain uninterrupted, the market avoids a full-scale supply shock.
Moreover, Iranian oil has long been constrained by sanctions and often routed through a “shadow fleet.” Its removal, while disruptive, is not an unknown risk. This helps explain why markets have adjusted rather than panicked.
Diplomatic "Door Ajar"
A second key factor is that the diplomatic door remains open. While the Islamabad talks failed to produce a framework, they did not collapse into confrontation. Both sides acknowledged the engagement, and the ceasefire technically remains in place until April 22. Markets are interpreting the blockade as a high-stakes negotiating tool rather than a definitive step toward war.
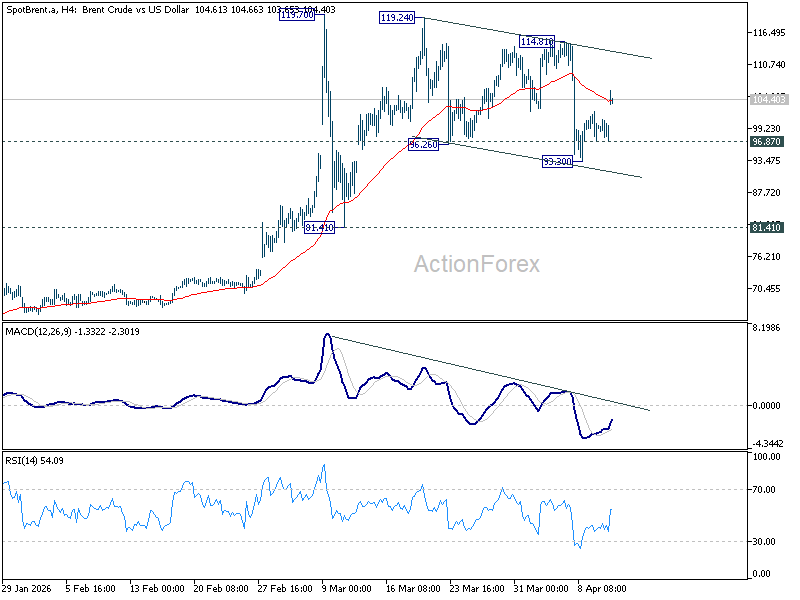
114.81 as key level for Brent
Technically, Brent’s rebound from 93.30 suggests near-term upside risk remains, but gains are likely capped by 114.81 resistance without clear escalation. On the downside, a break below 96.87 minor support would reopen bearish momentum toward 90.
However, a decisive break above 114.81 would signal that markets are shifting into full escalation pricing, opening the path for a rapid move through the 120 crisis threshold.
EUR/USD Strengthens Further, Bulls Eye Continued Upside
Key Highlights
- EUR/USD started a fresh increase above 1.1650.
- It cleared a key contracting triangle with resistance at 1.1610 on the 4-hour chart.
- GBP/USD could extend gains if it settles above 1.3500.
- WTI Crude Oil prices are again moving higher toward $112.
EUR/USD Technical Analysis
The Euro remained supported above 1.1500 against the US Dollar. EUR/USD gained bullish momentum for a move above 1.1620 and 1.1650.
Looking at the 4-hour chart, the pair settled above the 1.1665 level, the 100 simple moving average (red, 4-hour), and the 200 simple moving average (green, 4-hour). There was a clear move above a key contracting triangle with resistance at 1.1610.
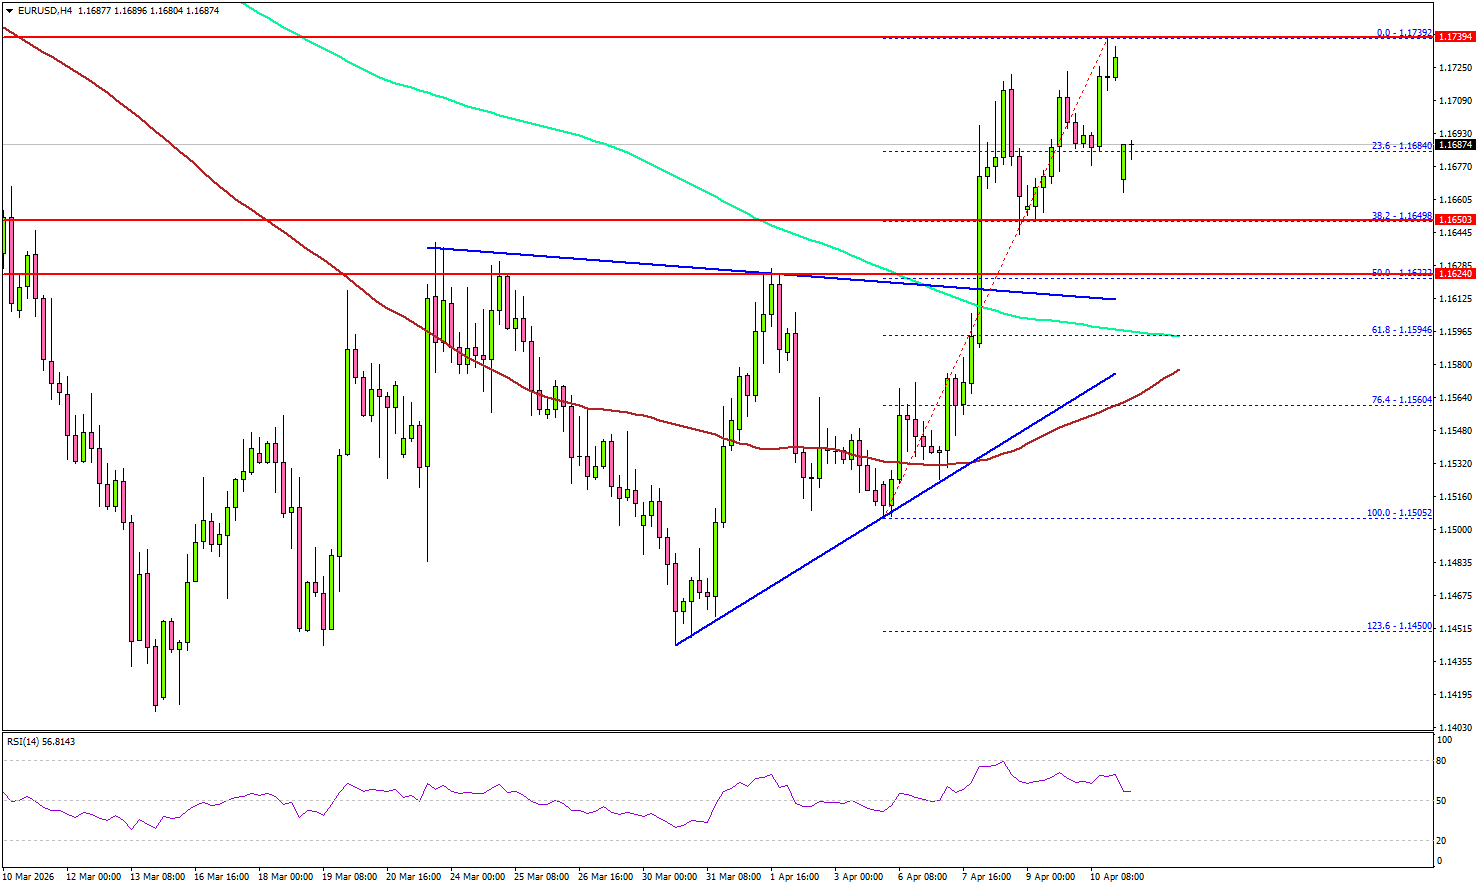
The pair tested the 1.1740 zone. If the bulls remain in action, they could aim for a move toward the 1.1780 level. The first major resistance sits at 1.1800.
The main resistance could be 1.1840. A close above 1.1840 could open the doors for gains above 1.1920. In the stated case, the bulls could aim for a move to 1.2000.
Immediate support is seen near 1.1685 or the 23.6% Fib retracement level of the upward move from the 1.1505 swing low to the 1.1739 high. The first key support sits at 1.1620. The next key area of interest might be near 1.1600 and the 200 simple moving average (green, 4-hour).
A close below 1.1600 might push the pair toward the 100 simple moving average (red, 4-hour). Any more losses could initiate a fresh move to 1.1500.
Looking at Oil, the price remained supported above $92 and again trying to clear the $110-$112 resistance zone.
Upcoming Key Economic Events:
- US Existing Home Sales for March 2026 (MoM) - Forecast -0.1%, versus +1.7% previous.
New Zealand PSI Drops to 46.0, BNZ Sees Economy Nearing Contraction
New Zealand’s services sector extended its downturn in March, adding to signs that the economy may be heading toward contraction. The BusinessNZ Performance of Services Index declined from 47.6 to 46.0, a level firmly in contraction territory and well below its long-term average of 52.8. The reading signals continued weakness in domestic demand amid a challenging global backdrop.
The details point to a clear loss of momentum. Activity/sales fell sharply from 47.5 to 44.6, while new orders/business dropped from 48.8 to 45.7, indicating weak forward demand. Employment also slipped from 47.0 to 46.4, suggesting firms are scaling back hiring plans. Other components, including supplier deliveries (48.5 to 47.3) and inventories (46.5 to 46.2), remained subdued. Notably, all sub-indexes stayed below 50, confirming a synchronized contraction across the sector.
External factors are increasingly weighing on sentiment. According to BusinessNZ CEO Katherine Rich, the conflict in Iran has hit discretionary spending industries particularly hard, reflecting declining consumer confidence. This is echoed in survey feedback, with negative comments rising to 69.1% from 56.4%, highlighting growing pessimism among businesses.
From a macro perspective, the implications are turning more serious. BNZ’s Stephen Toplis warned that the combined PMI/PSI indicator is suggesting "the economy could soon be contracting". While a formal recession call has not been made, BNZ has already moved to significantly downgrade its 2026 growth outlook.
Ceasefire Sends Oil Below $100 While Stocks Recover
Markets started last week a bit cautious but slightly positive. There was hope that tensions in Iran might ease, which helped stocks move a little higher. At the same time, the U.S. dollar weakened slightly as risk sentiment improved.
Midweek, sentiment improved more after news of a two-week ceasefire and further talks. Oil prices dropped back below $100, global equities moved higher, and the dollar weakened further. While the situation is not fully resolved, this progress reduced short-term risk.
Economic data showed some impact from earlier higher oil prices. U.S. inflation stayed around 3%, and consumer sentiment fell on concerns about rising costs. Gold remained supported, and USD/JPY again failed to break above 160, but is still holding at high levels.
Markets This Week
U.S. Stocks
The Dow Jones saw strong gains last week as markets reacted positively to the two-week ceasefire in Iran, raising hopes that the conflict may be nearing an end. While there are already signs that higher oil prices are starting to impact the economy, investors are hoping this will be short-term. However, there is still a risk that oil prices remain elevated for longer, which could limit further upside in stocks. As a result, the market may struggle to continue higher this week and could trade sideways in a wide range, with traders closely watching developments in negotiations and movements in oil prices. Resistance levels are at 48,500, 49,000, 49,600, and 50,000. Support is seen at 47,000, 46,000, and 45,000.
Japanese Stocks
Following the ceasefire news, Japanese stocks moved higher and closed near weekly highs, supported by a weaker yen and stronger U.S. equities. However, in the short term, the Nikkei looks slightly overbought, so a pullback early in the week is likely. Further upside will depend on oil prices falling more, as high energy costs remain a concern for the Japanese economy. Overall, the market may move sideways to slightly lower this week as traders continue to watch oil prices and global developments closely. Resistance is seen at 58,000, 58,500 and 60,000, while support is at 55,000, 54,000, 52,500, and 52,000.
USD/JPY
Resistance at 160 remained strong throughout last week, with the pair unable to break higher. Following the ceasefire news, USD/JPY dropped quickly to around 158 midweek as the yen strengthened on improved risk sentiment. However, toward the end of the week, the yen weakened again. U.S. inflation staying above 3% and higher oil prices make it difficult for the Bank of Japan to raise rates, keeping the interest rate gap between the U.S. and Japan wide. This helped USD/JPY move higher again into the close. The 10-day moving average has started to turn slightly lower, and with 160 still acting as strong resistance, trading the 158–160 range remains the preferred short-term strategy. Resistance is at 160.00, 160.50, 162, and 165, while support is seen at 158.50, 158.00, and 156.50.
Gold
Gold continued to move higher last week, supported by a weaker U.S. dollar as WTI prices fell. The move higher came in relatively quiet market conditions, but the trend remained steady throughout the week. The 10-day moving average is pointing higher, showing that short-term momentum is positive. For now, the preferred approach is to look to buy dips, with gold likely to continue testing higher levels. Resistance is at $4,800, $4,850, $5,000, and $5,100, while support is at $4,600, $4,500, and $4,400.
Crude Oil
WTI fell back below the $100 level by the end of last week after the ceasefire news in Iran. Prices dropped quickly midweek as traders sold on expectations that Trump is pushing to end the war before high oil prices significantly damage the U.S. economy. Negotiations are likely to continue, which should keep volatility high, but further large gains look less likely in the short term. Overall, expect WTI to trade sideways to lower this week in volatile conditions, creating trading opportunities. Resistance is at $100, $110, $120, $125, and $130, while support is at $90, $80, $75, $70, and $67.5.
Bitcoin
Bitcoin benefited from improved risk sentiment following the Iran ceasefire, closing the week near the highs of its recent range. It has been trading sideways for a long time, but this may not continue. If tensions in Iran keep easing, there is increasing potential for a breakout above $75,000. Resistance is at $75,000, $80,000, and $85,000, while support is at $65,000, $60,000, and $55,000.
This Week’s Focus
- Monday: U.S. Existing Home Sales
- Tuesday: Australia NAB Business Confidence, Japan Industrial Production, U.S. PPI
- Wednesday: China Trade Balance, E.U. Industrial Production, U.S. NY Empire State Manufacturing Index and Beige Book
- Thursday: Australia Unemployment Rate, China GDP and Chinese Unemployment Rate, U.K. GDP and Industrial Production, E.U. CPI, U.S Industrial Production
- Friday: E.U. Trade Balance
Headlines around the ongoing negotiations in Iran are likely to be the main focus this week, as the situation remains volatile and concerns continue about oil transport through the Strait of Hormuz. There are few major economic data releases, with U.S. PPI being the main highlight. Overall, market direction will be driven more by sentiment around Middle East oil supply than by economic data.
Eco Data 4/13/26
| GMT | Ccy | Events | Act | Cons | Prev | Rev |
|---|---|---|---|---|---|---|
| 22:30 | NZD | Business NZ PSI Mar | 46 | 48 | 47.6 | |
| 23:50 | JPY | Money Supply M2+CD Y/Y Mar | 2.00% | 1.60% | 1.70% | |
| 12:30 | CAD | Building Permits M/M Feb | -8.40% | -0.40% | 4.80% | 3.50% |
| 14:00 | USD | Existing Home Sales Mar | 3.98M | 4.01M | 4.09M | 4.13M |
| 22:30 | NZD |
| Business NZ PSI Mar | |
| Actual | 46 |
| Consensus | |
| Previous | 48 |
| Revised | 47.6 |
| 23:50 | JPY |
| Money Supply M2+CD Y/Y Mar | |
| Actual | 2.00% |
| Consensus | 1.60% |
| Previous | 1.70% |
| 12:30 | CAD |
| Building Permits M/M Feb | |
| Actual | -8.40% |
| Consensus | -0.40% |
| Previous | 4.80% |
| Revised | 3.50% |
| 14:00 | USD |
| Existing Home Sales Mar | |
| Actual | 3.98M |
| Consensus | 4.01M |
| Previous | 4.09M |
| Revised | 4.13M |
Dollar at Risk of Sharp Selloff if Markets Front-Run Islamabad Accord on Progress in US-Iran Talks
Attention is firmly on Islamabad as the United States and Iran begin their first high-level talks since the onset of war, with markets looking for signs of a breakthrough that could evolve into a broader Islamabad Accord. The outcome would be as a defining moment for energy markets, inflation, and global risk sentiment, with delegations led by US Vice President JD Vance already on the ground for what could shape the trajectory of the ceasefire and beyond.
At its core, the Islamabad meeting is not just another diplomatic event—it is the single most important macro catalyst in the current environment. The talks aim to transform a fragile two-week ceasefire into a more durable framework, with implications stretching from the reopening of the Strait of Hormuz to the normalization of global energy flows.
From here, three broad scenarios emerge. A breakdown in talks would see markets revert quickly to pre-ceasefire positioning, with oil surging back toward crisis levels and risk sentiment deteriorating. A “freeze” scenario—where dialogue continues without concrete progress—would likely leave markets range-bound, as optimism fades but no new escalation is priced in. The third and most market-moving outcome is the emergence of a framework for an eventual accord, even without a finalized deal.
Crucially, markets will not wait for signed agreements—they front-run credible trajectories. If investors see even a partial framework emerging from Islamabad, pricing could shift rapidly toward a de-escalation scenario. In that case, Dollar would be at risk of a sharp selloff, driven by improving risk appetite, falling oil prices, and a renewed focus on policy divergence against the Fed.
Three Scenarios: Breakdown, Freeze or Framework
The baseline framework for the Islamabad talks revolves around three possible paths: breakdown, freeze, or framework. Each scenario represents a different stage of geopolitical risk pricing and carries clear implications for global markets.
1. Breakdown: The "Operation Epic Fury" Reset
A breakdown would mark the most disruptive outcome. Failure to reach common ground would likely send markets back to pre-ceasefire positioning, with oil prices rebounding sharply toward $120 and equities reversing last week's gains. Investors would quickly reposition for renewed escalation, reintroducing inflation risks and tightening financial conditions.
2. The "Freeze": Range-Bound Purgatory
A “freeze” scenario, by contrast, would extend the current uncertainty. Continued dialogue without concrete commitments—particularly on the Strait of Hormuz or sanctions—would likely stall the recent rally. Markets could drift sideways, as the absence of progress caps optimism while the absence of escalation limits downside.
3. The Framework: Front-Running the Accord
The most constructive scenario is the emergence of a framework for an eventual Islamabad Accord. Importantly, markets do not require a finalized agreement to react. Even incremental progress—such as agreement on key issues or timelines—can be enough to trigger forward-looking positioning. With risk assets already supported by strong momentum since the ceasefire announcement, traders may move early, driving equities toward new highs and pulling oil back toward $90 or even lower as expectations shift toward de-escalation.
Risk-On Momentum Could Drive Dollar Lower
If markets begin to front-run a credible path toward an Islamabad Accord, the first and most immediate driver of Dollar weakness would be a powerful extension of risk-on sentiment. Equity markets have already built strong upward momentum, with S&P 500 posting its best weekly performance since November and now sitting within striking distance of record highs. In such an environment, investors are likely to lean aggressively into risk assets.
At the same time, Fed expectations provide a crucial tailwind to this move. Recent inflation data supports the view that the oil shock has not yet translated into broader inflation pressures. Core CPI edged up only modestly from 2.5% yoy to 2.6% yoy in March, offering little evidence of second-round effects. This keeps the Fed’s “transitory” narrative intact, allowing policymakers to look through the energy-driven spike in headline inflation.
There are, however, concerns around inflation expectations. The University of Michigan survey showed a sharp jump in one-year expectations from 3.8% to 4.8%, alongside a rise in long-run expectations to 3.4%. On the surface, this could challenge the Fed’s confidence. But these readings are backward-looking, with most responses collected before the April 7 ceasefire and the subsequent pullback in oil prices.
Besides, expectations are likely to be highly sensitive to developments in energy markets. If oil declines on progress toward an Islamabad Accord, inflation expectations could reverse just as quickly as they rose. This would reinforce the view that current inflation fears are not yet entrenched.
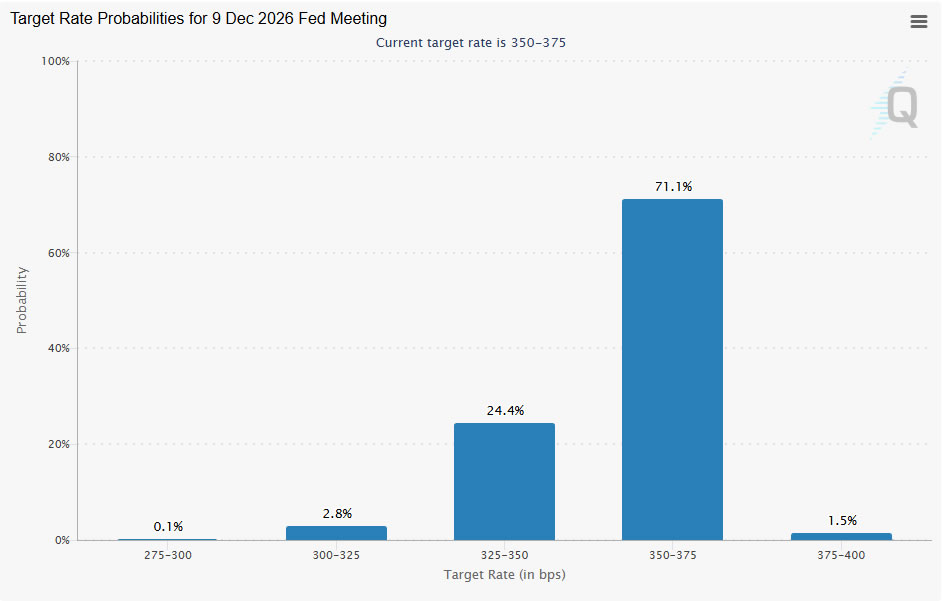
Market pricing reflects this balance. Futures indicate minimal probability of rate hikes by the end of the year, with odds near 1.5%. The majority expectation remains for the Fed to hold at 3.50–3.75% before eventually easing. In other words, rate cuts are seen as delayed rather than cancelled.
Hike vs Hold: The Split That Could Sink Dollar
The second key driver of Dollar weakness, if markets front-run an Islamabad Accord, lies in widening central bank policy divergence. In a de-escalation scenario, the Fed is likely to remain on hold in the near term and then pivot back toward rate cuts once the oil shock fades. This places it firmly in the “hold-to-ease” camp, in contrast to several major central banks that are either tightening or preparing to tighten further.
This emerging “hike versus hold” split is becoming increasingly pronounced. The European Central Bank, the Reserve Bank of Australia, the Bank of Japan, and likely the Bank of England form the tightening camp, while the Fed, Bank of Canada, Reserve Bank of New Zealand, and Swiss National Bank remain more cautious. Such divergence creates a structural headwind for the Dollar by compressing its yield advantage.
The ECB, in particular, stands out. With its policy rate at 2.00%, close to neutral, it has more room to raise rates compared to the Fed’s 3.50–3.75% range. Europe’s greater sensitivity to energy shocks also increases the urgency for tightening, as policymakers seek to prevent second-round inflation effects from taking hold.
By contrast, the Fed is already operating near the upper bound of its neutral range, as highlighted in recent FOMC minutes. With the labor market stable rather than overheating, policymakers can afford to pause and assess incoming data. If inflation pressures ease alongside falling oil prices, the next move is more likely to be a cut than a hike.
The RBA further reinforces this divergence. Already in an active tightening cycle this year, it faces inflation pressures from both strong domestic demand and supply-side disruptions linked to the closure of the Strait of Hormuz. Markets are pricing additional hikes in the coming months, widening the policy gap with the Fed.
In this context, policy divergence acts as a powerful secondary force amplifying Dollar downside. If risk-on sentiment initiates the move, shifting yield dynamics can sustain it, making any selloff in the Dollar both sharper and more persistent.
AUD/USD Eyes 0.72 Break, EUR/USD to Follow if Accord Scenario Plays Out
In the event that markets front-run a credible Islamabad Accord, FX markets are likely to move decisively. The combination of risk-on sentiment and widening policy divergence would favor currencies like Australian Dollar and Euro, while putting sustained pressure on Dollar.
AUD/USD stands out as the clearest beneficiary. Improved global risk appetite and widening the rate differential could propel it through 0.72 key resistance. That would set up resumption of the medium term up trend. In such a scenario, AUD/USD’s move toward 0.80 would become more than a tactical trade, and evolve into a base case for carry-focused investors
EUR/USD is also positioned for upside, with a retest of the 1.20 key psychological level likely under a de-escalation scenario. Importantly, the ECB’s tolerance for Euro strength could have subtlety shifted. While policymakers previously expressed concern about excessive Euro strength due to its deflationary impact, the current environment is different. With energy-driven inflation pressures elevated, a stronger Euro could help contain import costs, reducing the urgency to resist currency appreciation. A sustained break above 1.20 would therefore carry different implications than in previous cycles. Rather than being seen as a policy problem, it could be tolerated—or even welcomed—as part of the broader effort to stabilize inflation.
S&P 500 Uptrend Holds, Dollar Index Risks Renewed Downtrend
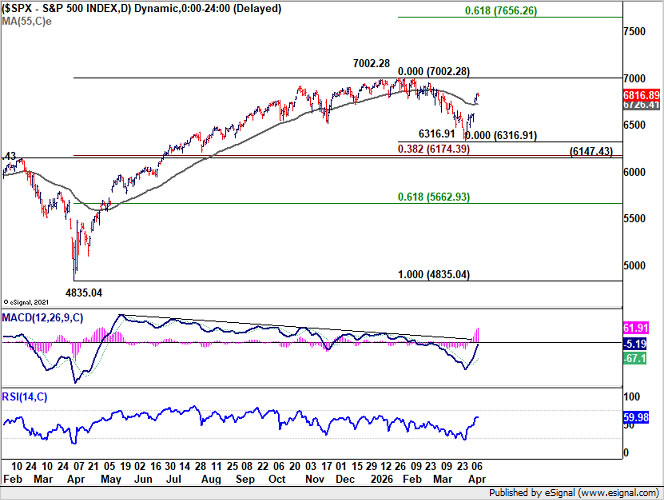
S&P 500’s strong rebound last week suggests that the corrective decline from 7,002.28 has likely completed at 6,316.91. Notably, firm support emerged from a key cluster zone, including 6,147.43 resistance-turned-support, 38.2% retracement of 4,835.04 to 7,002.28 at 6,174.39, and the 55 W EMA (now at 6,457.95). This confluence reinforces the view that the longer-term uptrend remains intact.
Retest of the 7002.28 high should be seen next. While initial upside may be capped there, potentially extending the current consolidation pattern with another pullback, decisive break would signal resumption of the broader uptrend. In that case, the next target lies at the 61.8% projection of 4,835.04 to 7,002.28 from 6,316.91 at 7,656.26.
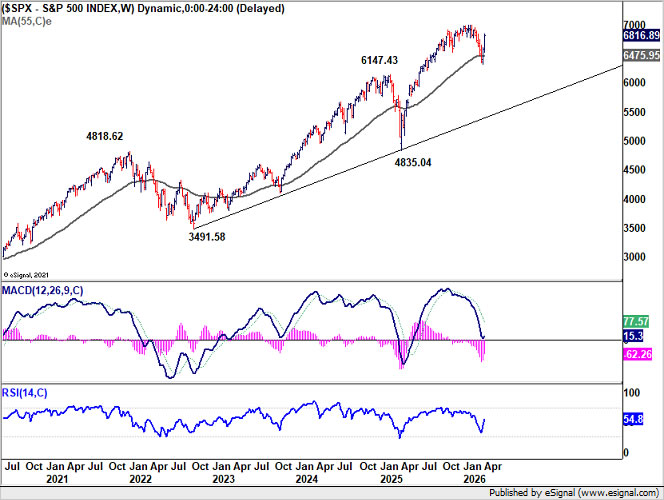
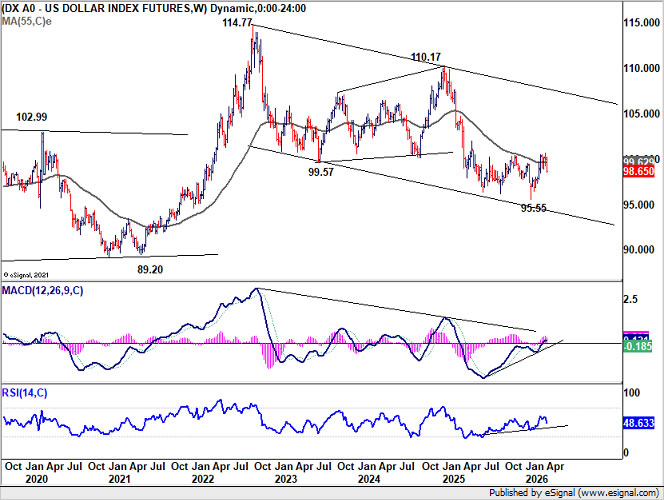
For Dollar Index, 98.65 support is now in focus following last week’s decline. Firm break below this level would suggest that the rebound from 95.55 has already topped at 100.64. The rejection near 38.2% retracement of 100.17 to 95.55 at 101.13, alongside the 55 W EMA (now at 99.62), keeps the medium-term outlook Bearish.
Should 98.65 give way, retest of the 95.55 low should be seen next. Decisive break below that level would confirm the resumption of the broader downtrend from the 114.77 (2022 high).
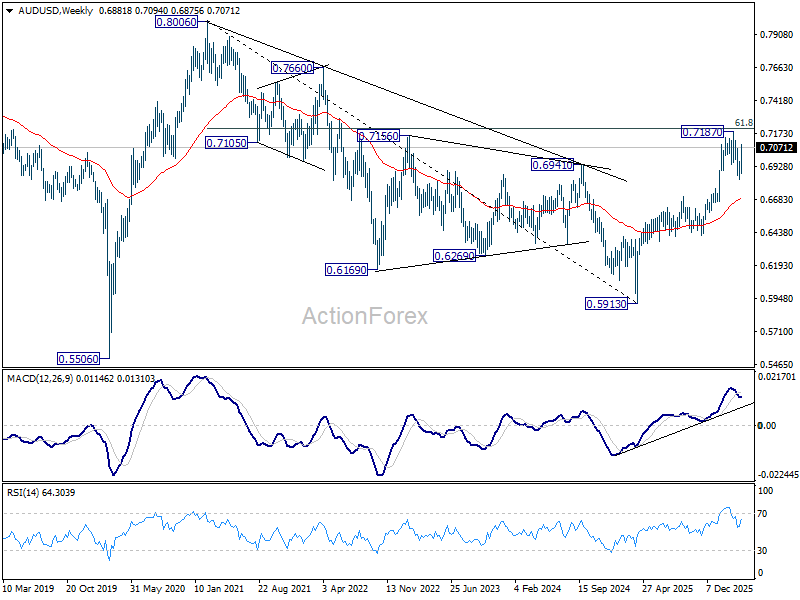
AUD/USD Weekly Report
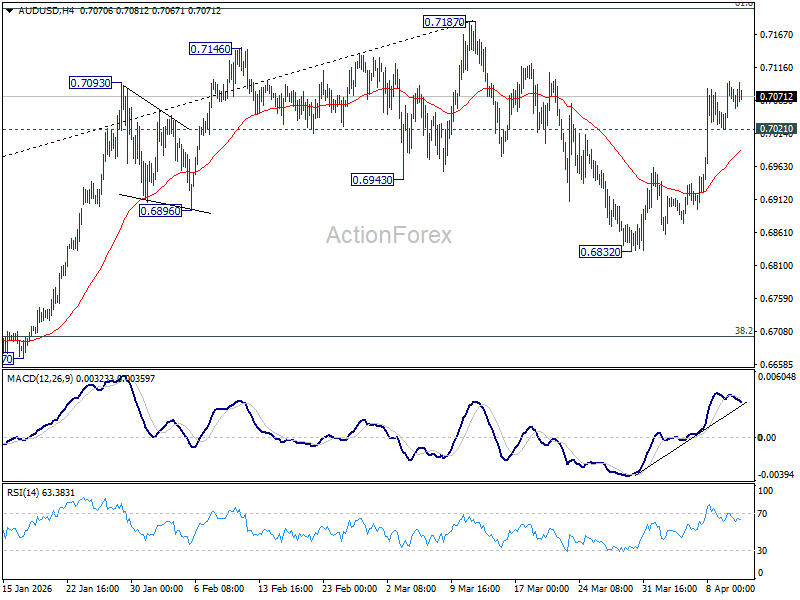
AUD/USD's strong rebound last week suggests that pullback from 0.7187 has completed at 0.6832 already. Initial bias stays mildly on upside this week for retesting 0.7187. Strong resistance could be seen there to bring another fall to extend the near term corrective pattern. On the downside, below 0.7021 minor support will turn intraday bias neutral again first.
In the bigger picture, as long as 0.6706 cluster support holds, rise from 0.5913 (2024 low) should still be in progress. Decisive break of 61.8% retracement of 0.8006 to 0.5913 at 0.7206 will solidify the case that it's already reversing the down trend from 0.8006 (2021 high). However, firm break of 0.6706 will dampen this bullish case, and bring deeper fall back to 0.6420 support, and possibly below.
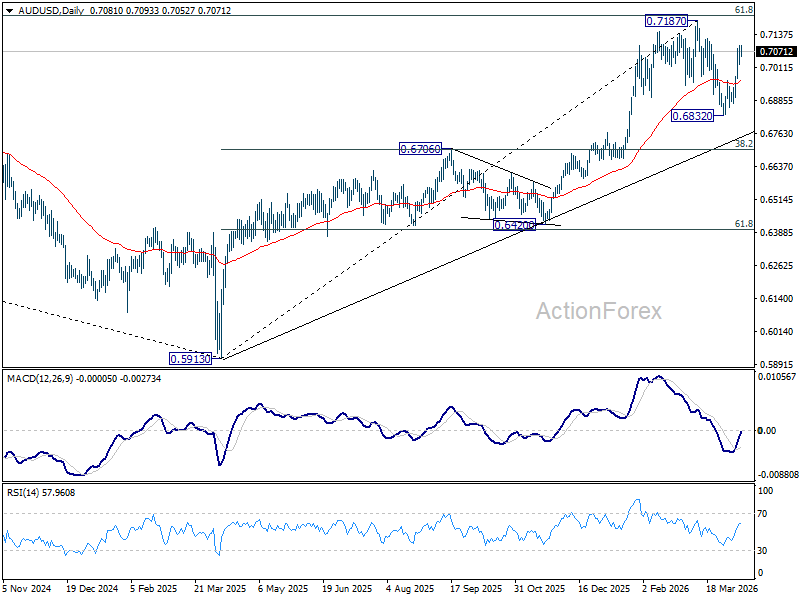
In the long term picture, rise from 0.5913 is seen as the third leg of the whole pattern from 0.5506 (2020 low). It's still early to judge if this is an impulsive or corrective pattern. But in either case, further rise should be seen back to 0.8006 and possibly above. This will remain the favored case as long as 55 W EMA (now at 0.6683) holds.