Sample Category Title
AUD/USD Technical Analysis: Bulls Regain Control as Key Psychological Level Holds
- The AUD/USD technical outlook is decidedly bullish, with the path of least resistance to the upside.
- The pair successfully broke out above the primary descending trendline on the Daily chart.
- Bullish momentum is reinforced by a "Golden Cross" formation on the 4-hour chart.
- The 0.7130 level stands as the next major hurdle for the bulls.
The Australian Dollar has undergone a significant shift in momentum over the past few sessions. After a period of corrective price action, AUD/USD appears to be finding its feet, buoyed by a successful defense of critical support zones and a breakout of descending trendline resistance.
The Daily Chart: The Big Picture
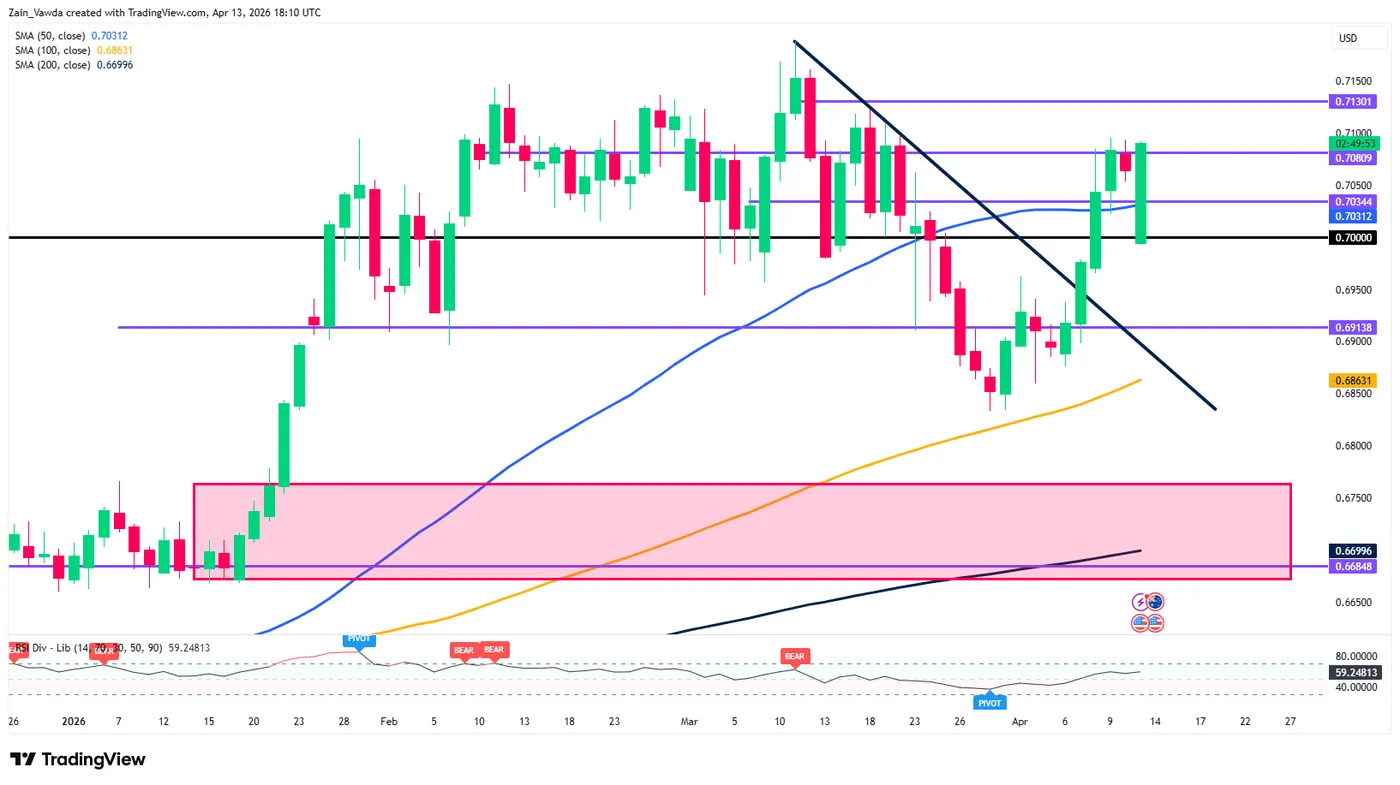
On the daily timeframe, AUD/USD remains in a broad constructive phase despite the volatility seen through February and March. The pair recently came within a whisker of the 100-day MA printing a low around the 0.6833 handle.
The most notable development on this timeframe is the breakout above the primary descending trendline (black line) originating from the year-to-date highs. After consolidating near the 0.7000 psychological handle, price action is now challenging the 0.7080 resistance. A daily close above this level would clear the path for a retest of the 0.7130 mark before the YTD highs at 0.7187 comes into focus.
AUD/USD Daily Chart, April 13, 2026
Source:TradingView.com
The H4 Chart: Bullish Momentum Accelerates
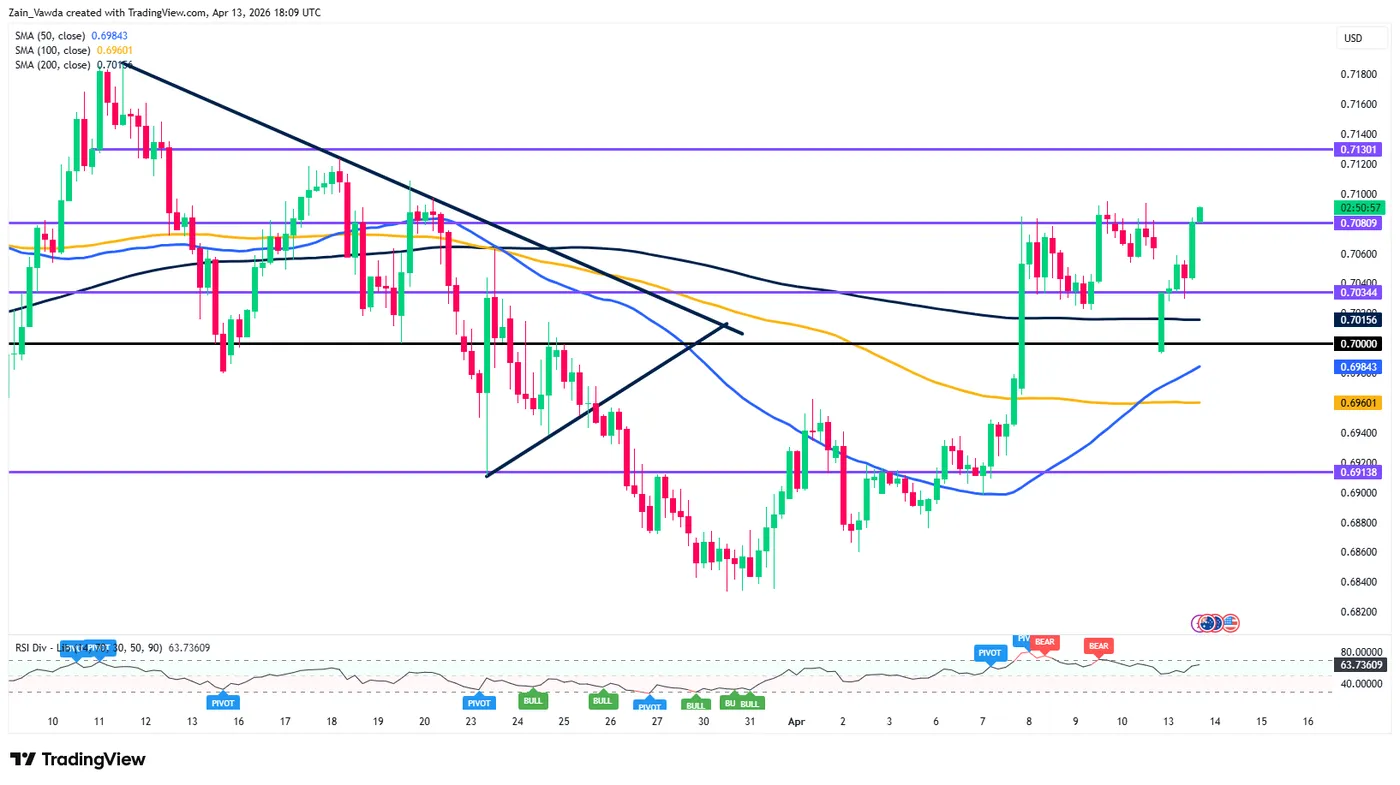
Shifting to the 4-hour chart, the bullish narrative is reinforced by the "Golden Cross" formation, where the 50-day MA has crossed above the 100 and 200-day MAs. This technical signal often precedes sustained trending moves.
We can see a clear "V-shaped" recovery from the late March lows. The pair has successfully flipped the 0.7000 level from resistance to support. Currently, the RSI (Relative Strength Index) is hovering near the 66 level; while this indicates strong bullish momentum, it suggests there is still some "headroom" before the pair reaches overbought territory, allowing for further upside in the short term.
AUD/USD Four-Hour Chart, April 13, 2026
Source:TradingView.com
The H1 Chart: Intraday Precision
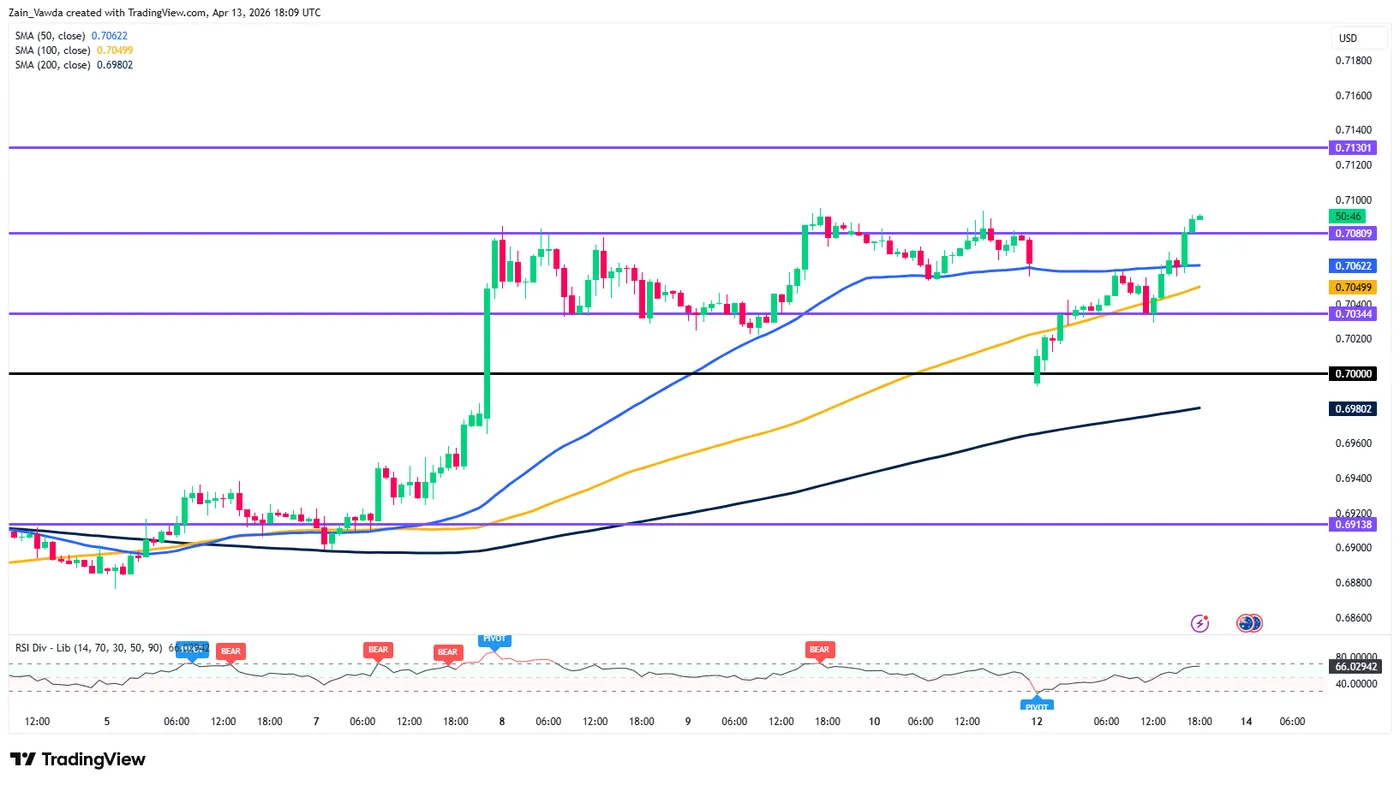
The 1-hour chart provides a granular look at the recent breakout. After a brief period of consolidation between 0.7034 and 0.7080, the pair has just printed a strong bullish candle, piercing the upper boundary of this range.
The intraday moving averages (50, 100, and 200) are perfectly fanned out in a bullish alignment, suggesting that any minor pullbacks are likely to be met with fresh buying interest. The immediate focus for intraday traders will be the 0.7080 level; as long as price holds above this on a retest, the next logical target is the swing high at 0.7130.
Key Levels to Watch
- Resistance: 0.7080, 0.7130, 0.7150
- Support: 0.7034, 0.7000 (Psychological), 0.6913
AUD/USD One-Hour Chart, April 13, 2026
Source:TradingView.com
The RSI across multiple timeframes is not yet flashing "exhaustion" signals, though the Bearish Divergence labels on the H1 indicator suggest that the slope of the ascent might moderate. Traders should watch for a potential "throwback" to the 0.7034 area for a lower-risk entry if the current breakout stalls.
In short, the technical outlook for AUD/USD is decidedly bullish. The confluence of a trendline breakout on the Daily, a moving average crossover on the H4, and a range breakout on the H1 suggests that the path of least resistance remains to the upside. The 0.7130 level stands as the next major hurdle for the bulls.
USD Index – Downside Remains at Risk Despite Fresh Signals of War Escalation
The dollar opened higher on Monday, following fresh signs of escalation in the Middle East after US/Iran peace talks failed, but lacked strength to maintain gains, reversing a good part of its overnight advance during European and early US trading.
Although greenback played a role of leading safe-haven asset during the five-week war, last week’s sharp drop on optimistic outlook and easing bets for tighter Fed monetary policy, have dented its firm stance.
Also, today’s quick reversal of overnight’s gains, warns that traders might be changing their perception after disappointing actions of the US military, as well as frequent and conflicting messages from President Trump.
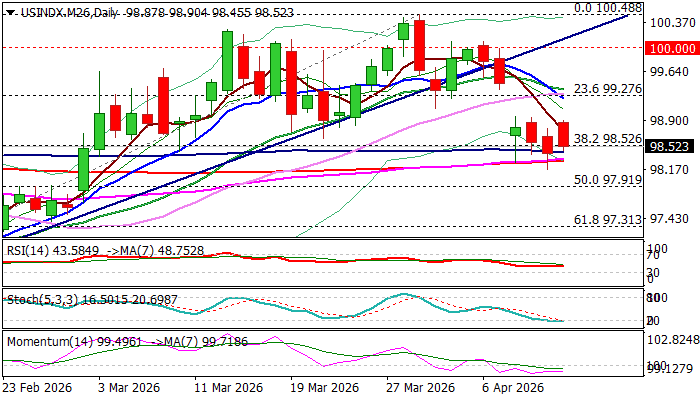
This may add to building pressure on dollar, as near-term action is weighed by last week’s large bearish candle (the dollar was down 1.6% for the week), while technical picture on daily chart is weakening (14-d momentum remains in the negative territory / multiple bear-crosses of 5/10/20/30 DMAs).
However, negative signals remain challenged by strong supports at $98.42/30 zone, consisting of converged100 / 55 / 200 DMAs (including 55/200DMA golden cross) and top rising and thickening daily Ichimoku cloud.
Fresh weakness needs to register a clear break of these supports to signal continuation of the bear-leg from $100.48 (new 2026 high, posted on Mar 31) and open way for deeper correction of $95.35/$100.48 rally (the latest pullback has so far retraced around 38.2% of the move).
Recent tops at $98.95zone formed a lower platform which currently acts as initial but significant resistance, with potential break higher to still require stronger upside action and fill last week’s gap ($99.45/$98.45), to neutralize near-term bearish structure.
Res: 98.80; 98.95; 99.23; 99.45
Sup: 98.42; 98.30; 97.91; 97.40
USDCHF Wave Analysis
USDCHF: ⬇️ Sell
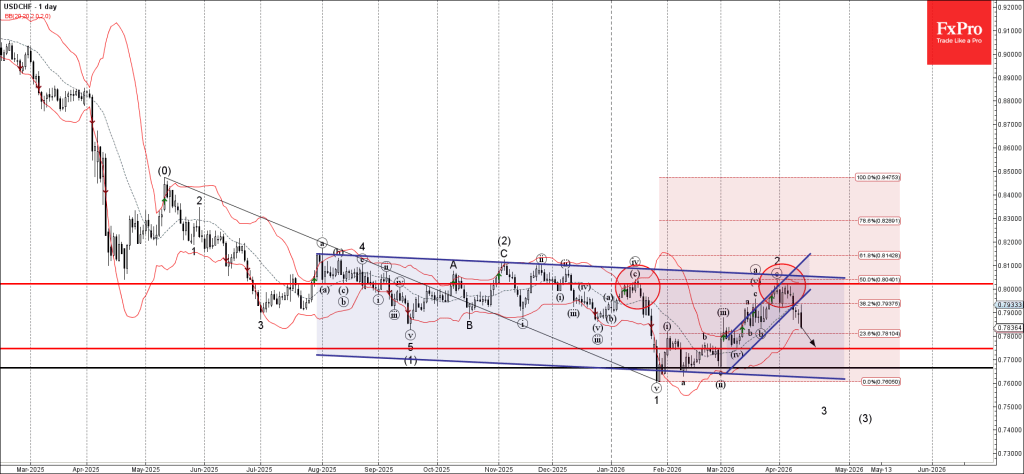
- USDCHF broke daily up channel
- Likely to fall to support level 0.7745
USDCHF currency pair recently broke the daily up channel from the start of March – which accelerated the active impulse wave 3.
The active impulse wave 3 belongs to the intermediate impulse wave (3) from the start of November.
Given the clear daily downtrend, USDCHF currency pair can be expected to fall further to the next support level 0.7745 (low of the previous correction iv).
EURJPY Wave Analysis
EURJPY: ⬆️ Buy
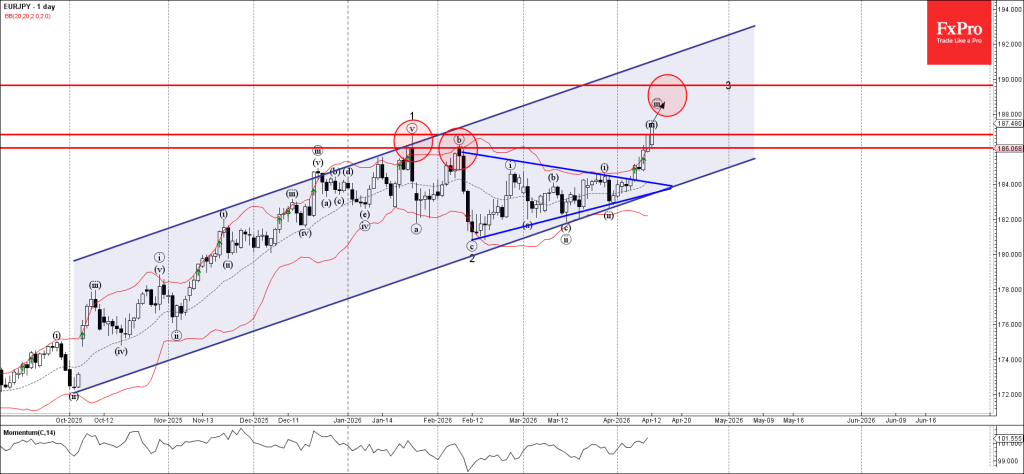
- EURJPY broke resistance zone
- Likely to rise to resistance level 190.00
EURJPY currency pair recently broke through the resistance zone between the resistance level 186.0 (top of wave b from February) and resistance level 186.85 (top of wave 1 from January)
The breakout of this resistance zone accelerated the active impulse waves iii and 3.
Given the clear daily uptrend, EURJPY currency pair can be expected to rise to the next resistance level 190.00 (target price for the completion of the active impulse wave 3.).
S&P 500 Wave Analysis
S&P 500: ⬆️ Buy
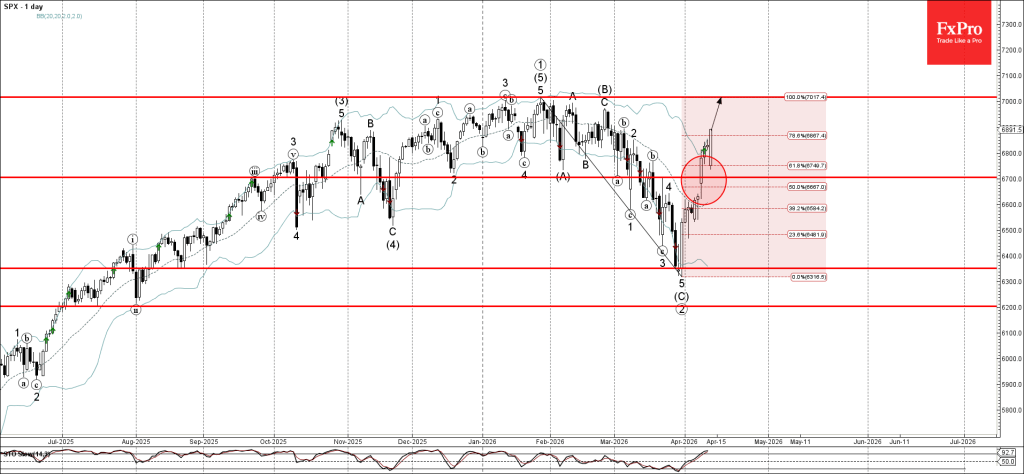
- S&P 500 broke the resistance level 6700.00
- Likely to rise to resistance level 7000.00
S&P 500 index recently broke the resistance level 6700.00 – which was set as the upward target in our earlier forecast for this index.
The breakout of the resistance level 6700.00 coincided with the breakout of the 50% Fibonacci correction of the previous ABC correction 2 from January.
S&P 500 index can be expected to rise further to the next round resistance level 7000.00, which formed monthly Double Top in January.
Eco Data 4/14/26
| GMT | Ccy | Events | Act | Cons | Prev | Rev |
|---|---|---|---|---|---|---|
| 23:01 | GBP | BRC Like-For-Like Retail Sales Y/Y Mar | 3.10% | 0.70% | ||
| 00:30 | AUD | Westpac Consumer Confidence Apr | -12.50% | 1.20% | ||
| 01:30 | AUD | NAB Business Conditions Mar | 6 | 7 | 6 | |
| 01:30 | AUD | NAB Business Confidence Mar | -29 | -1 | 0 | |
| 03:00 | CNY | Trade Balance (USD) Mar | 51.1B | 107.5B | 213.6B | |
| 04:30 | JPY | Industrial Production M/M Feb F | -2.00% | -2.10% | -2.10% | |
| 10:00 | USD | NFIB Business Optimism Index Mar | 95.8 | 98.6 | 98.8 | |
| 12:30 | USD | PPI M/M Mar | 0.50% | 1.20% | 0.70% | 0.50% |
| 12:30 | USD | PPI Y/Y Mar | 4.00% | 4.60% | 3.40% | |
| 12:30 | USD | PPI Core M/M Mar | 0.10% | 0.50% | 0.50% | 0.30% |
| 12:30 | USD | PPI Core Y/Y Mar | 3.80% | 4.20% | 3.90% | 3.80% |
| 23:01 | GBP |
| BRC Like-For-Like Retail Sales Y/Y Mar | |
| Actual | 3.10% |
| Consensus | |
| Previous | 0.70% |
| 00:30 | AUD |
| Westpac Consumer Confidence Apr | |
| Actual | -12.50% |
| Consensus | |
| Previous | 1.20% |
| 01:30 | AUD |
| NAB Business Conditions Mar | |
| Actual | 6 |
| Consensus | |
| Previous | 7 |
| Revised | 6 |
| 01:30 | AUD |
| NAB Business Confidence Mar | |
| Actual | -29 |
| Consensus | |
| Previous | -1 |
| Revised | 0 |
| 03:00 | CNY |
| Trade Balance (USD) Mar | |
| Actual | 51.1B |
| Consensus | 107.5B |
| Previous | 213.6B |
| 04:30 | JPY |
| Industrial Production M/M Feb F | |
| Actual | -2.00% |
| Consensus | -2.10% |
| Previous | -2.10% |
| 10:00 | USD |
| NFIB Business Optimism Index Mar | |
| Actual | 95.8 |
| Consensus | 98.6 |
| Previous | 98.8 |
| 12:30 | USD |
| PPI M/M Mar | |
| Actual | 0.50% |
| Consensus | 1.20% |
| Previous | 0.70% |
| Revised | 0.50% |
| 12:30 | USD |
| PPI Y/Y Mar | |
| Actual | 4.00% |
| Consensus | 4.60% |
| Previous | 3.40% |
| 12:30 | USD |
| PPI Core M/M Mar | |
| Actual | 0.10% |
| Consensus | 0.50% |
| Previous | 0.50% |
| Revised | 0.30% |
| 12:30 | USD |
| PPI Core Y/Y Mar | |
| Actual | 3.80% |
| Consensus | 4.20% |
| Previous | 3.90% |
| Revised | 3.80% |
Sunset Market Commentary
Markets
In less than a week 1) an Iranian civilization was about to be wiped out 2) before Pakistani mediation resulted in a two-week ceasefire and the first high-level talks over the weekend only for the latter to 3) break down after 21 hours and bringing us de facto back to 1). After negotiations fell apart, the Trump administration announced its own Strait of Hormuz blockade - effective 4PM (our time) - to deprive Iran from its remaining oil revenue. The Middle East country responded by threatening regional ports if enemy-affiliated vessels try breaching its territorial waters. Trump afterwards upped the ante further by suggesting to go after critical infrastructure such as water and electricity plants, “which are very easy to hit.”
The market reaction to the latest developments is a kneejerk risk off one, but in a guarded manner. The ceasefire in theory is agreed to last until April 21, leaving still some (be it limited) time for de-escalation and diplomacy. News outlet Axios reported that Pakistan, Egypt and Turkey over the coming days will continue mediating with US and Iran and some negotiators, particularly from the Iranian side, kept the door open for further talks. Needless to say the situation is very unpredictable. In awaiting the outcome, stocks lose ground in Europe and the US. The likes of the EuroStoxx50 declines by 1%, Wall Street opens 0.3%-0.7% lower. Global yield curves bear flatten gently with rising oil (Brent back above $100) and gas (Dutch TTF futures +9%) driving rate hike bets. The market implied probability for an April ECB move rose from around a third to 45% with a cumulative 70 bps of rate increases priced in for 2026. German rates rise 2-3 bps, slightly underperforming vs swap and Treasuries. The latter lose minor ground, spurring 1 bp increases. UK gilts are the laggards with rates across the Channel adding 2.5-4 bps. FX investors favour the US dollar slightly over most global peers but gains are technically insignificant. DXY crawls towards the 99 barrier. EUR/USD struggles to maintain the 1.17 but is off the intraday lows. The Japanese yen is among the worst performers. A speech by BoJ governor Ueda (see below) has doused some of the lingering speculation for an April rate hike. USD/JPY is nearing the symbolically important 160 barrier again, EUR/JPY is even hitting new all-time highs. The Hungarian forint in CE space is surging towards the highest levels in four years, breaking through important resistance around EUR/HUF 367.7 (2023 HUF-highs) in the process. The move follows a landslide victory in yesterday’s elections by the pro-European Tisza party. It secured a two-third majority, giving it the power to rewrite the constitution and to some extend undo 16 years of Orban rule which often clashed with the European Commission. Hungarian (swap) rates drop almost 40 bps (!) with lower risk premia driving the move.
News & Views
The German government agreed on a €1.6bn fiscal package to contain fuel prices. Over a period of two months, the gasoline tax will be reduced by 17 cents per liter. Other, smaller, measures include a tax-free employer relief bonus of up to €1000, stricter antitrust oversight of fuel pricing and a potential tax or regulatory measures on oil companies’ excess profits. Earlier this spring, Spain (€5bn) , Italy (€3-4bn), Ireland (€1.6-1.8bn, Greece (€0.3-0.4bn) and France (€0.1-0.2bn) announced similar temporary relief measures. There’s some clear fragmentation between broad, consumer-heavy packages in Southern Europe and the more limit response in the likes of Germany and France which are either fiscally-constrained or wary of repeating huge subsidies like 4 years ago.
Japanese money markets reduced April rate hike bets by the Bank of Japan from 55% to 33% following a speech by BoJ governor Ueda read out by his deputy, Himono. He suggested that oil prices push up energy costs in the short term, but that their impact on underlying inflation is uncertain. “If the output gap worsens, that could weigh on underlying inflation. On the other hand, if rising crude oil prices heighten the public’s medium- and long-term inflation expectations, that could push up underlying inflation.” Given lingering uncertainty over the Middle East, the BoJ will scrutinize how future developments affect the outlook. While vigilance is necessary and core CPI is still on track to hit the 2% target, BoJ Ueda didn’t fully embrace the near-term rate hike scenario.
USD/JPY Mid-Day Outlook
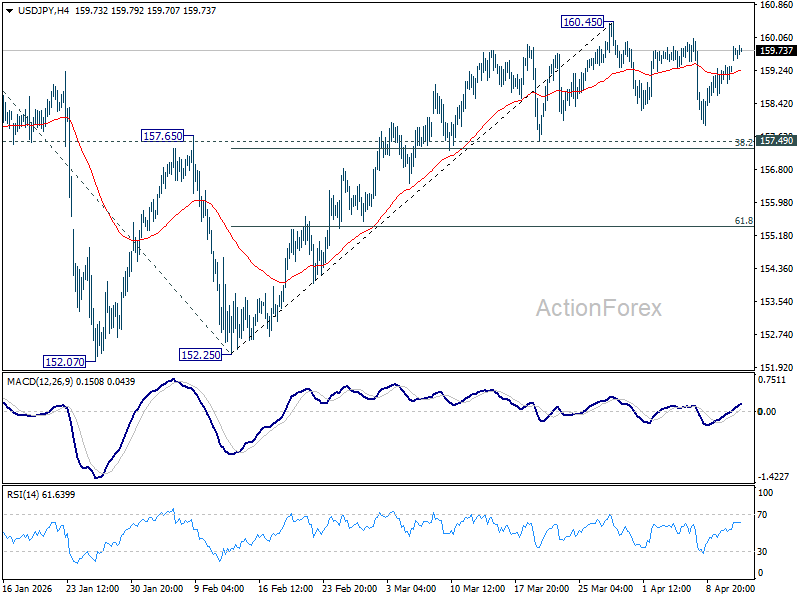
Daily Pivots: (S1) 158.98; (P) 159.23; (R1) 159.56; More...
Range trading continues in USD/JPY and intraday bias stays neutral. Consolidations from 160.45 could still extend further. But outlook will stay bullish as long as 157.49 cluster support (38.2% retracement of 152.25 to 160.45 at 157.31) holds. On the upside break of 160.45 will target a retest on 161.94 high. However, firm break of 157.31/49 will bring deeper fall back to 61.8% retracement at 155.38 next.
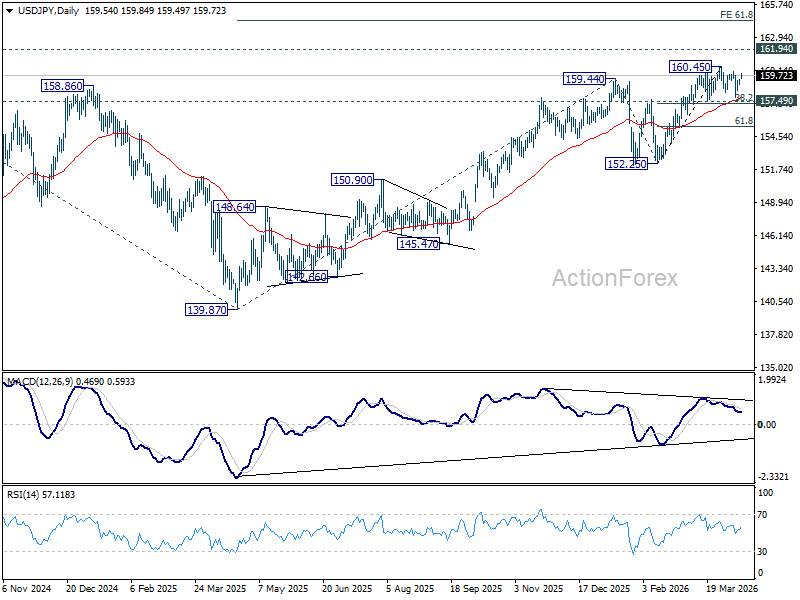
In the bigger picture, outlook is unchanged that corrective pattern from 161.94 (2024 high) should have completed with three waves at 139.87. Larger up trend from 102.58 (2021 low) could be ready to resume through 161.94. This will remain the favored case as long as 55 W EMA (now at 155.24) holds. Firm break of 161.94 will pave the way to 61.8% projection of 102.58 to 161.94 from 139.87 at 176.75.
USD/CHF Mid-Day Outlook
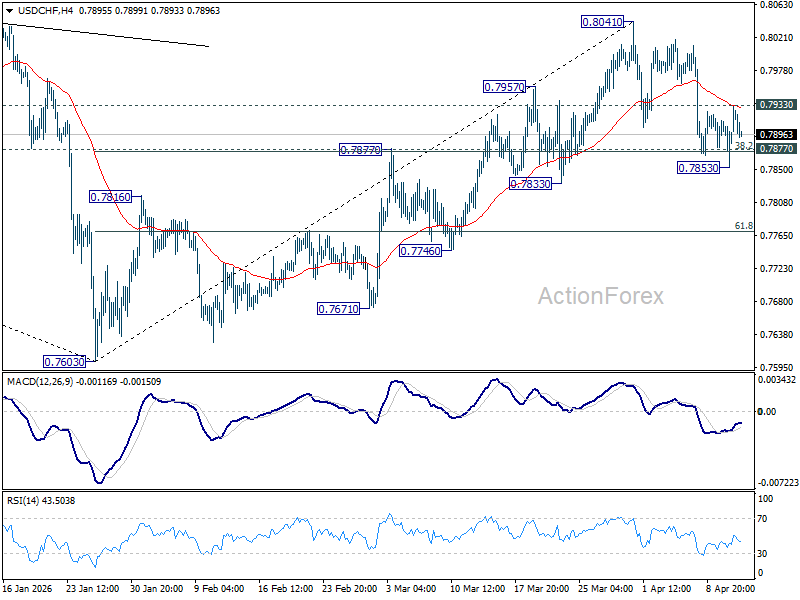
Daily Pivots: (S1) 0.7859; (P) 0.7888; (R1) 0.7921; More….
Intraday bias in USD/CHF stays neutral at this point. On the downside, sustained trading below 0.7877 cluster support (38.2% retracement of 0.7603 to 0.8041 at 0.7874) will argue that the rise from 0.7603 has completed, and bring deeper fall to 61.8% retracement at 0.7770 and below. Nevertheless, firm break of 0.7925 minor resistance will turn bias back to the upside for retesting 0.8041.
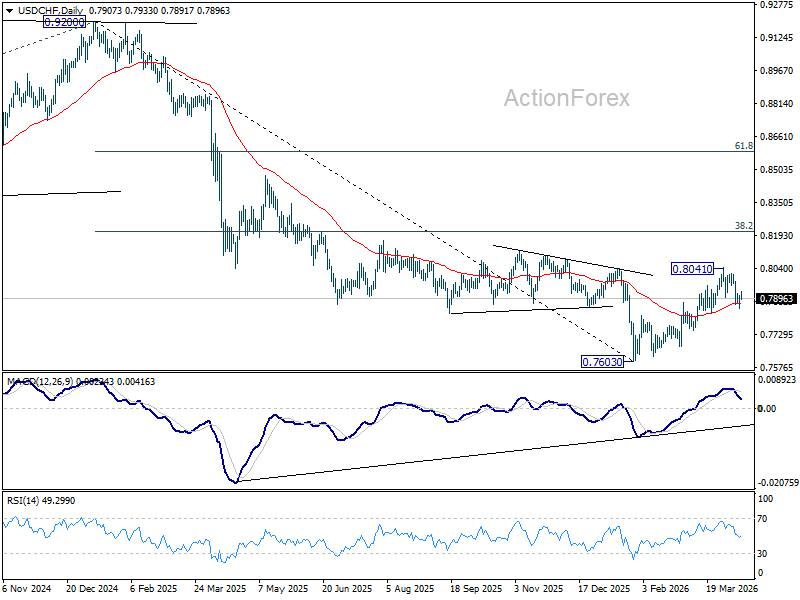
In the bigger picture, rebound from 0.7603 medium term bottom is seen as correcting the fall from 0.9200 only. Rejection by 55 W EMA (now at 0.8071) will affirm this bearish case, and setup down trend resumption to 100% projection of 1.0146 (2022 high) to 0.8332 from 0.9200 at 0.7382 at a later stage. Though, sustained break of 55 W EMA will suggest that it's probably correcting the larger scale down trend from 1.0146 (2022 high).
GBP/USD Mid-Day Outlook
Daily Pivots: (S1) 1.3422; (P) 1.3451; (R1) 1.3491; More...
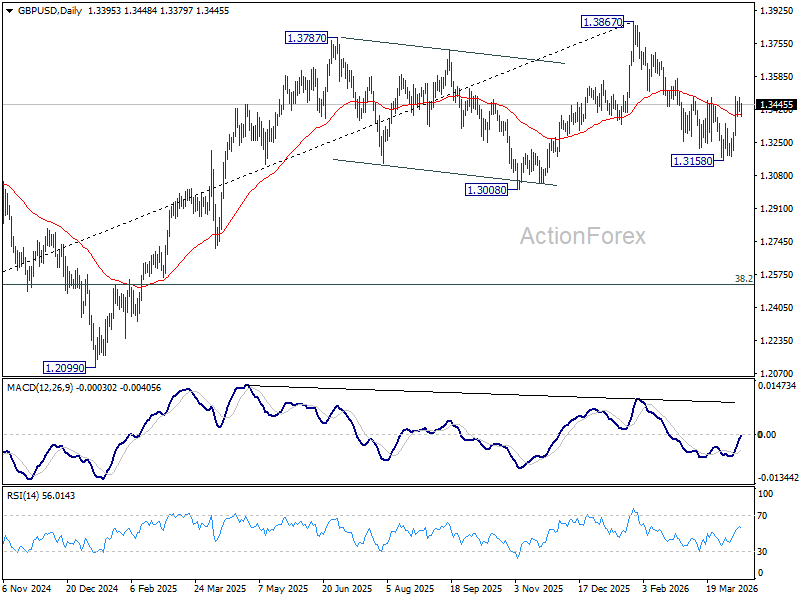
Intraday bias in GBP/USD remains neutral and more consolidations could be seen below 1.3483 temporary top. On the upside, above 1.3483 will resume the rebound from 1.3158, and target 61.8% retracement of 1.3867 to 1.3158 at 1.3596. Firm break there will bring retest of 1.3867 high. Nevertheless, sustained break of 55 4H EMA (now at 1.3355) will bring retest of 1.3158 instead.
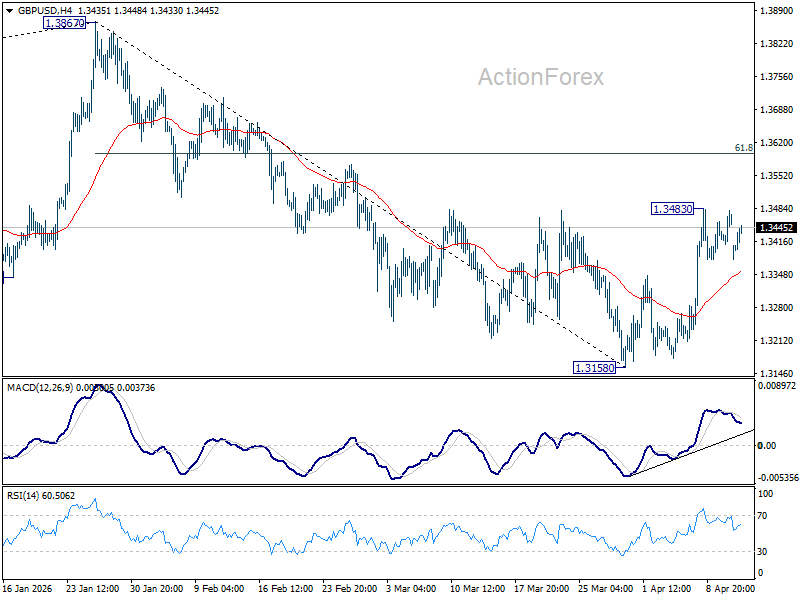
In the bigger picture, current development suggests that price actions from 1.3867 are merely a corrective pattern within the broader up trend from 1.0351 (2022 low). With 1.3008 support intact, medium term bullishness is maintained and break of 1.3867 is back in favor for a later stage, towards 1.4248 key resistance (2021 high).