Sample Category Title
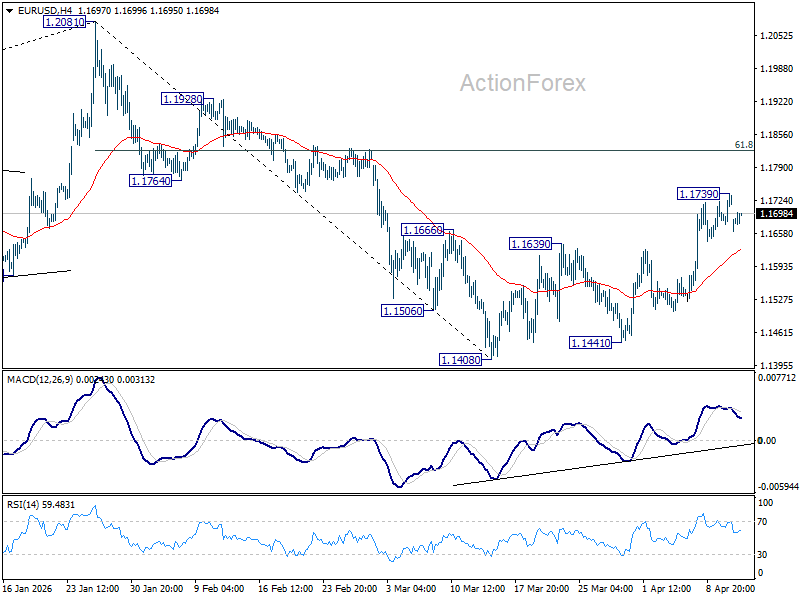
EUR/USD Mid-Day Outlook
Daily Pivots: (S1) 1.1689; (P) 1.1714; (R1) 1.1751; More….
Intraday bias in EUR/USD remains neutral and more consolidations could be seen below 1.1739 temporary top. On the upside, above 1.1739 will target 61.8% retracement of 1.2081 to 1.1408 at 1.1824. Decisive break there will pave the way to retest 1.2081 high. Nevertheless, sustained break of 55 4H EMA (now at 1.1627) will argue that rebound from 1.1408 has completed as a corrective move, and bring retest of this low.
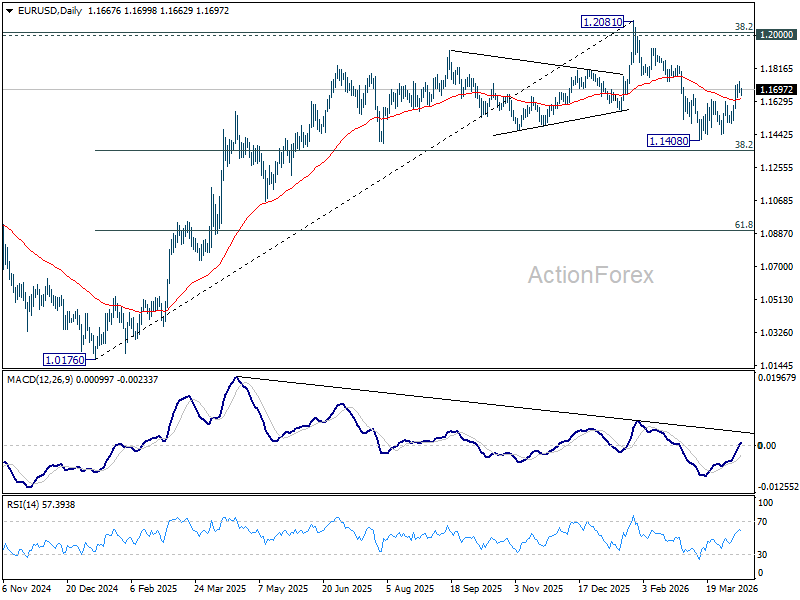
In the bigger picture, the strong support from 38.2% retracement of 1.0176 to 1.2081 at 1.1353 suggests that the pullback from 1.2081 is more likely a corrective move. Strong support was also found in 55 W EMA (now at 1.1513). Focus is back on 1.2 key cluster resistance level. Decisive break there will carry long term bullish implications. Nevertheless, break of 1.1408 support will revive the case of medium term bearish trend reversal.
Markets in ‘Geopolitical Purgatory’: Is Oil Price at $100 Expensive or Cheap?
Markets are strikingly calm despite the breakdown in Islamabad talks, not because risks are low—but because nothing has been decided yet. With the US-Iran ceasefire deadline on April 22 still more than a week away, markets are stuck in “geopolitical purgatory,” pricing uncertainty rather than a definitive outcome. A central question for traders is whether current oil prices at $100 is expensive. Or, Strait of Horumz stays closed well into the second half of the year, $100 could be remembered as a buying opportunity, the "cheap" price.
There had been hopes for progress toward a broader peace framework in Islamabad. In hindsight, the talks functioned less as a peace summit and more as a strategic census. Both sides used the 21-hour engagement to probe each other’s red lines rather than negotiate a final agreement. For Washington, the meeting provided political cover to demonstrate that diplomacy was attempted, even as the groundwork for military escalation is laid. For Tehran, it offered an opportunity to present itself as the reasonable party while testing the resolve of the US delegation. The wide gap between positions remains intact, and it is known to both parties.
Two developments following the talks have quickly reshaped the narrative.
The first is US President Donald Trump’s announcement of a naval blockade of the Strait of Hormuz. While later clarified as targeted rather than total, it marks a significant shift from negotiating access to enforcing control.
Previously, reopening the Strait was central to ceasefire discussions. The move toward blockade and mine-clearing operations signals a transition from diplomacy to enforcement, raising the risk of direct naval skirmishes that could quickly unravel the fragile truce.
The second key shift is in rhetoric around energy prices. Trump’s Fox News admission that oil and gasoline prices may remain elevated through November’s midterm elections suggests expectations for a prolonged period of tension. This contrasts sharply with earlier claims that price spikes would be temporary.
This change matters for markets. If the Strait reopens quickly, oil near $100 may prove expensive. But if disruptions persist into the second half of the year, current levels could be remembered as relatively cheap, with the war premium becoming a structural feature rather than a temporary spike.
That April 22 deadline is the key inflection point. Once it passes, the rules of engagement shift, and the market will be forced to reprice either toward sustained escalation or renewed de-escalation. Until then, oil, equities, and currencies are likely to remain trapped in this uneasy equilibrium, with volatility suppressed but risks building beneath the surface.
In the currency markets, Loonie is currently the strongest one for the day, followed by Dollar, and then Swiss Franc. Aussie is the weakest, followed by Yen, and then Euro. Kiwi and Sterling are positioning in the middle of the pack.
In Europe, at the time of writing, FTSE is down -0.44%. DAX is down -1.13%. CAC is down -0.90%. UK 10-year yield is up 0.038 at 4.812. Germany 10-year yield is up 0.021 at 3.082. Earlier in Asia, Nikkei fell -0.74%. Hong Kong HSI fell -0.90%. China Shanghai SSE rose 0.06%. Singapore Strait Times fell -0.91%. Japan 10-year JGB yield rose 0.032 to 2.474.
Gold Momentum Fades Despite Dollar Weakness, $5,000 Rejection in the Making?
Gold fails to break higher despite favorable conditions, with fading momentum near $5,000 signaling a possible rejection as markets hesitate to chase the rally. Read More.
BoJ Ueda Cites Dual Impact of Oil Prices, Keeps Markets Guessing on Next Rate Hike
BoJ Governor Kazuo Ueda warns that rising oil prices could either weaken growth or push inflation higher, underscoring a complex policy outlook. With no clear signal ahead of the April meeting, markets are left guessing on the next move as geopolitical risks cloud the outlook. Read more
New Zealand PSI Drops to 46.0, BNZ Sees Economy Nearing Contraction
New Zealand’s services sector weakened further in March, with PSI falling to 46.0 and all key components remaining in contraction. BNZ now warns the economy could be nearing contraction, prompting a downgrade to its 2026 growth outlook. Read more.
EUR/USD Mid-Day Outlook
Daily Pivots: (S1) 1.1689; (P) 1.1714; (R1) 1.1751; More….
Intraday bias in EUR/USD remains neutral and more consolidations could be seen below 1.1739 temporary top. On the upside, above 1.1739 will target 61.8% retracement of 1.2081 to 1.1408 at 1.1824. Decisive break there will pave the way to retest 1.2081 high. Nevertheless, sustained break of 55 4H EMA (now at 1.1627) will argue that rebound from 1.1408 has completed as a corrective move, and bring retest of this low.
In the bigger picture, the strong support from 38.2% retracement of 1.0176 to 1.2081 at 1.1353 suggests that the pullback from 1.2081 is more likely a corrective move. Strong support was also found in 55 W EMA (now at 1.1513). Focus is back on 1.2 key cluster resistance level. Decisive break there will carry long term bullish implications. Nevertheless, break of 1.1408 support will revive the case of medium term bearish trend reversal.
Crude Surges 8%, DXY Jumps as US Naval Blockade Targets Iranian Oil Exports
- Peace talks between the US and Iran collapsed
- Crude oil prices surged 7-8% following the news, as the US blockade aims to cut off Iran's oil exports of about 1 million barrels per day.
- European equities plunged, with the STOXX 600 falling 0.7%, reflecting a widespread "risk-off" sentiment
- DXY eyes a retest of 99.50
The "Fear Trade" is back on the menu this Monday. Geopolitical tensions have hit a fever pitch after peace talks between the US and Iran in Pakistan ended in a stalemate. Vice President Vance has officially departed Islamabad, leaving a void where a diplomatic resolution was hoped for, as Tehran reportedly balked at Washington’s proposed terms.
In a swift and characteristic escalation, President Trump has responded by ordering a full-scale US. military blockade of all Iranian ports. This isn't just a "wait and see" scenario; the operation is slated to go live tomorrow.
The Logistics of the Blockade According to US Central Command, the enforcement begins at 10 a.m. ET (1400 GMT) on Monday. The military has emphasized that this will be an "impartial" operation, targeting vessels of all nations attempting to enter or exit Iranian coastal areas.
Crucially for global trade and the energy markets:
- Strait of Hormuz: Vessels transiting to non-Iranian ports will reportedly not be impeded.
- Financial Penalties: President Trump added a further layer of pressure on Sunday, stating that U.S. forces would intercept any vessel in international waters found to have paid transit tolls to Iran.
Market Impact: The "war premium" that had begun to bake out of the markets last week is likely to come screaming back. We are looking at a binary risk environment:
- Oil (WTI & Brent): Markets gapped higher after the weekend but are trading flat at present. While the Strait remains "open" for now, the risk of a miscalculation or a retaliatory closure by Tehran is high. The IRGC also stated that any ship approaching the Strait would be seen as violating the ceasefire.
- The Dollar (DXY) and Gold: The DXY also gapped higher while Gold gapped down and extended its slide in the Asian session. Gold has since turned and trades largely flat on the day.
Currency Power Balance
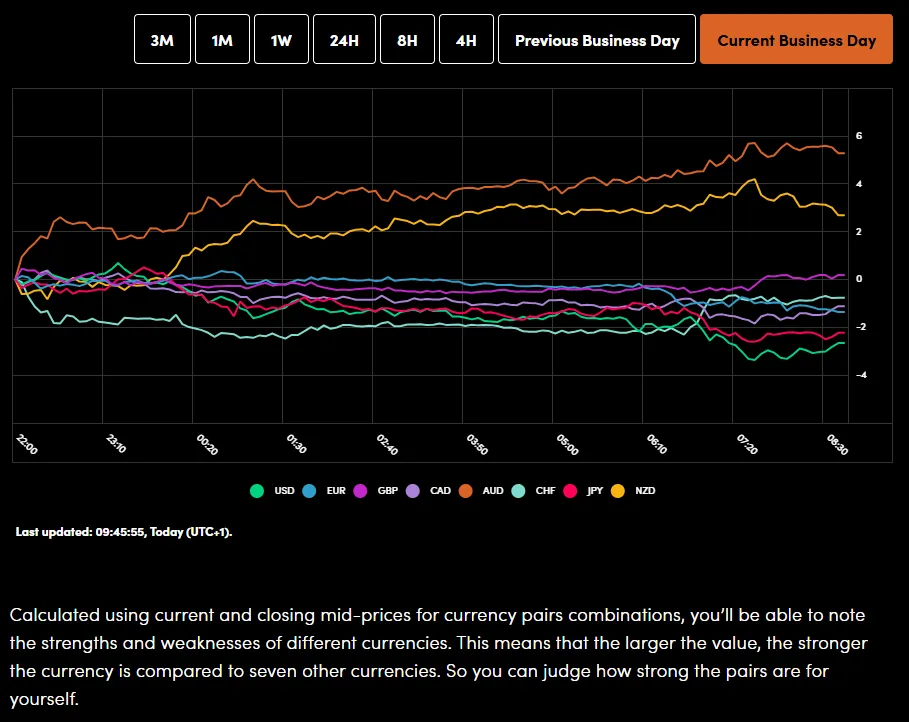
Source: OANDA Labs
Supply Chains: Commercial mariners are awaiting a formal notice, but the "toll intercept" threat adds a significant layer of legal and operational risk for global shipping firms.
The diplomatic window has slammed shut, and we are moving from words to warships once more. Expect high volatility as the Monday continues.
European Open: Geopolitical risk roils markets
The "peace rally" proved short-lived. European equities tumbled on Monday morning as the optimistic narrative of a diplomatic breakthrough in the Middle East evaporated. The collapse of US-Iran negotiations and Washington’s aggressive move to blockade Iranian ports have sent traders scrambling back to defensive positions.
The pan-European STOXX 600 fell 0.7% to 610.44 points by 0718 GMT, effectively halting the momentum from last week’s 3% gain. The regional sentiment is decidedly "risk-off," with Germany's DAX sliding 1% and the FTSE 100 retreating 0.4%.
The market map this morning shows a clear split between those benefiting from the "war premium" and those vulnerable to it:
Winners: The Energy sector (.SXEP) is the lone bright spot, gaining 0.8% as it tracks the rally in oil.
Losers: Travel and Leisure (.SXTP) has been hit hardest, plunging 1.9% on fears of rising fuel costs and disrupted global mobility.
Heavily Weighted Drags: Banks (.SX7E) and Industrials (.SXNP) are under significant pressure, down 1.5% and 1% respectively, as the broader economic outlook dims.
The outlook moving forward
The DXY is up 0.4% today as markets react to the breakdown of Islamabad talks. Crude has surged 7-8% on the news of a U.S. naval blockade targeting the 1 million barrels per day Iran has been leaking into the market.
The Strategic Play Washington’s goal is two-fold: drain Tehran’s coffers and pressure major importers like China and India to force Iran back to the negotiating table.
Why Haven’t Markets Fully Imploded? Despite the escalation, two factors are keeping a floor under sentiment:
- Diplomatic Channels: The fact that Iran actually attended the Islamabad talks suggests the door isn't permanently locked.
- Infrastructure Safety: We haven't seen a return to the physical destruction of energy facilities, which would cause more permanent "scarring" to supply.
We are in a high-stakes game of geopolitical chicken. If the blockade holds and exports drop, Asian demand will tighten global supply even further, keeping the bid under Crude firm.
Outside of the geopolitical noise, the focus shifts to central bank "reaction functions" as the Spring IMF meetings kick off in Washington. With a heavy slate of speeches on the calendar, the core question is how policymakers will handle the current energy shock.
Expect the DXY to remain tethered to energy price volatility. However, keep an eye on the 99.50 level, this marks the top of last week’s "ceasefire gap" and should attract significant selling interest if tested.

For all market-moving economic releases and events, see the MarketPulse Economic Calendar. (click to enlarge)
Chart of the Day - DXY
The US Dollar Index (DXY) is currently navigating a technical crossroads as geopolitical tensions flare.
Price action recently broke below an ascending channel, and we saw a retest of the 200-day SMA (98.50) and 50-day SMA (98.61). A sustained break below this moving average cluster could see the index slide toward the 97.70 support.
However, after the weekend gap this looks less likely in the near-term with a move higher looking more appealing if the geopolitical status quo remains unchanged.
A move higher may find that selling interest remains heavy near 99.50, the critical gap-fill zone.
USD Index Daily Chart, April 13, 2026
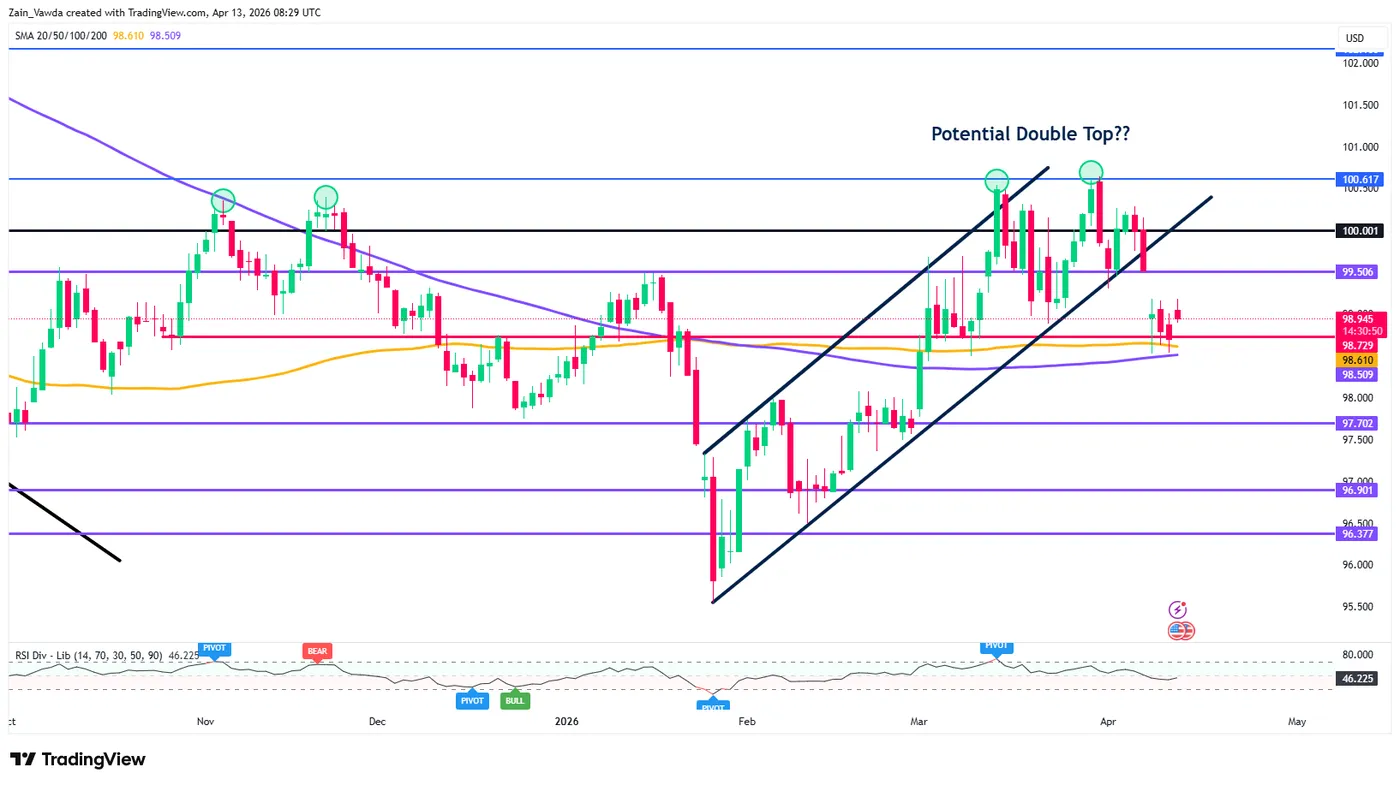
Source: TradingView.com (click to enlarge)
Traders should be wary of "headline risk" today. After the weekend developments we need to see how the situation plays out in real time before risk the risks can be adequately assessed. Until then the risk remains skewed to the upside for Oil and the USD and downside for risk assets including Gold.
Hopes for the Talks Dashed, but Tensions Have Eased
- The breakdown in US-Iran talks has led to price gaps.
- The dollar is regaining ground amid rising demand for safe-haven assets.
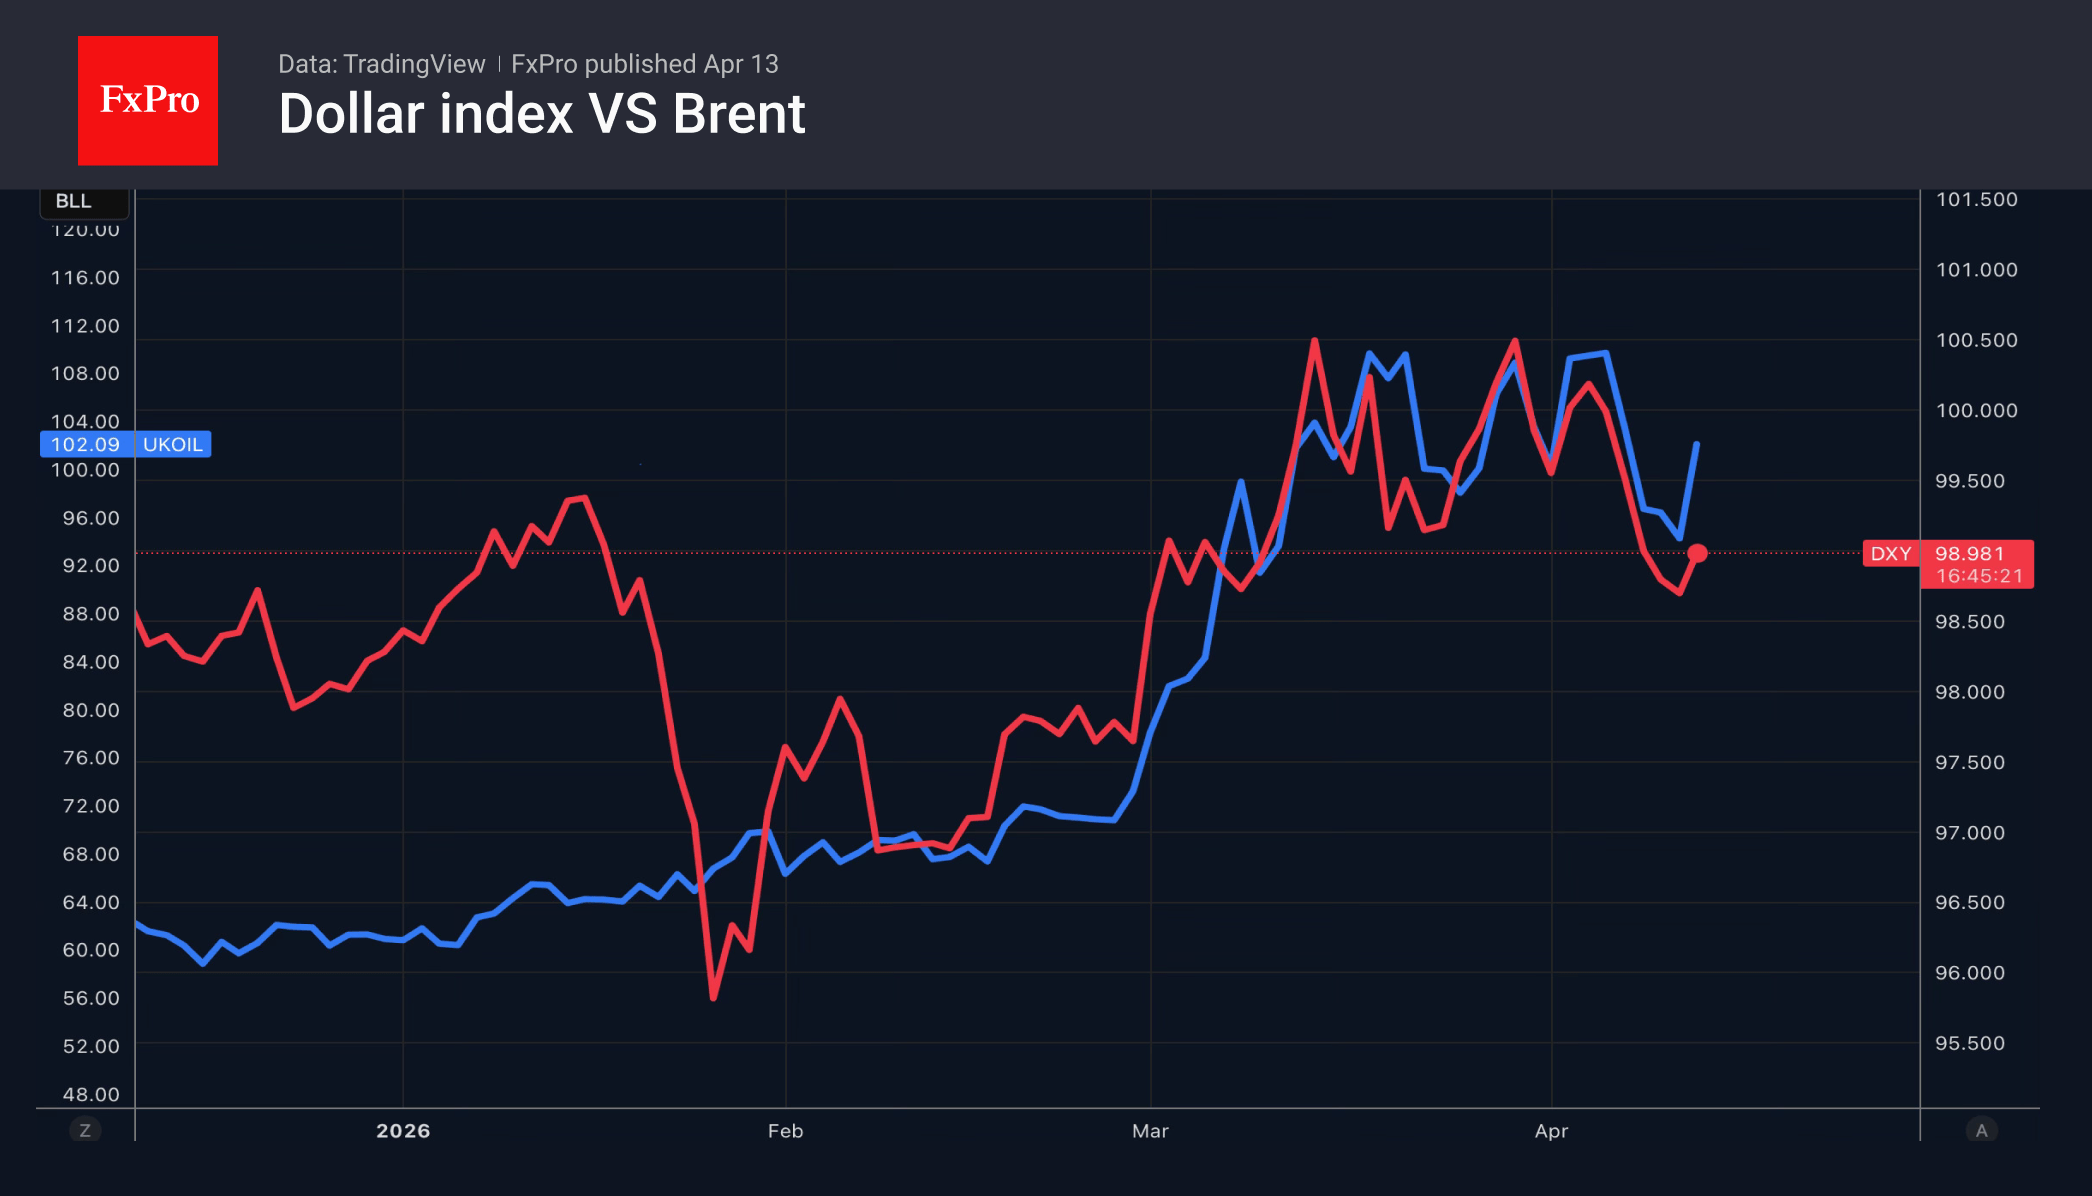
The US dollar opened the week with a gap higher after US-Iran talks failed to end the conflict. Tehran refused to abandon its nuclear ambitions, whilst the United States intends to block its tankers from passing through the Strait of Hormuz. To date, the conflict in the Middle East has removed around 13 million barrels per day from the oil market. If we add 2 million barrels per day of Iranian exports to this figure, Brent risks rising even further, dragging the USD index with it, as the two have been moving in tandem over the last couple of months.
The situation could either worsen or improve. A pessimistic scenario suggests that, having been backed into a corner, Tehran will strike at Saudi Arabia’s alternative routes, whilst the Houthis block another vital oil artery – the Bab al-Mandeb Strait. However, investors remain hopeful that negotiations will resume, as officials on both sides have suggested. Moreover, a blockade of the strait would signal de-escalation following a threat to destroy an ancient civilisation.
If the war was a reason to buy the US dollar as a safe-haven currency, and US-Iran talks a reason to sell it, what should one do now?
A prolonged closure of the Strait of Hormuz would deal the heaviest blow to the economies of Europe and Asia. According to Wall Street Journal experts, the chances of a US recession within 12 months have risen slightly – from 27% to 33%. Experts expect slower GDP growth – 2% rather than 2.2% – and faster inflation. Prices are forecast to rise by 3.2% by the end of 2026, rather than 2.6%.
As oil prices rise amid the ongoing conflict in the Middle East, the risk of core inflation accelerating in the US will increase through second-order effects. In March, the figure showed a modest month-on-month increase of 0.2% and a year-on-year increase of 2.6%. However, the figure for April will clearly be higher. This will fuel speculation about a Fed rate hike and strengthen the US dollar.
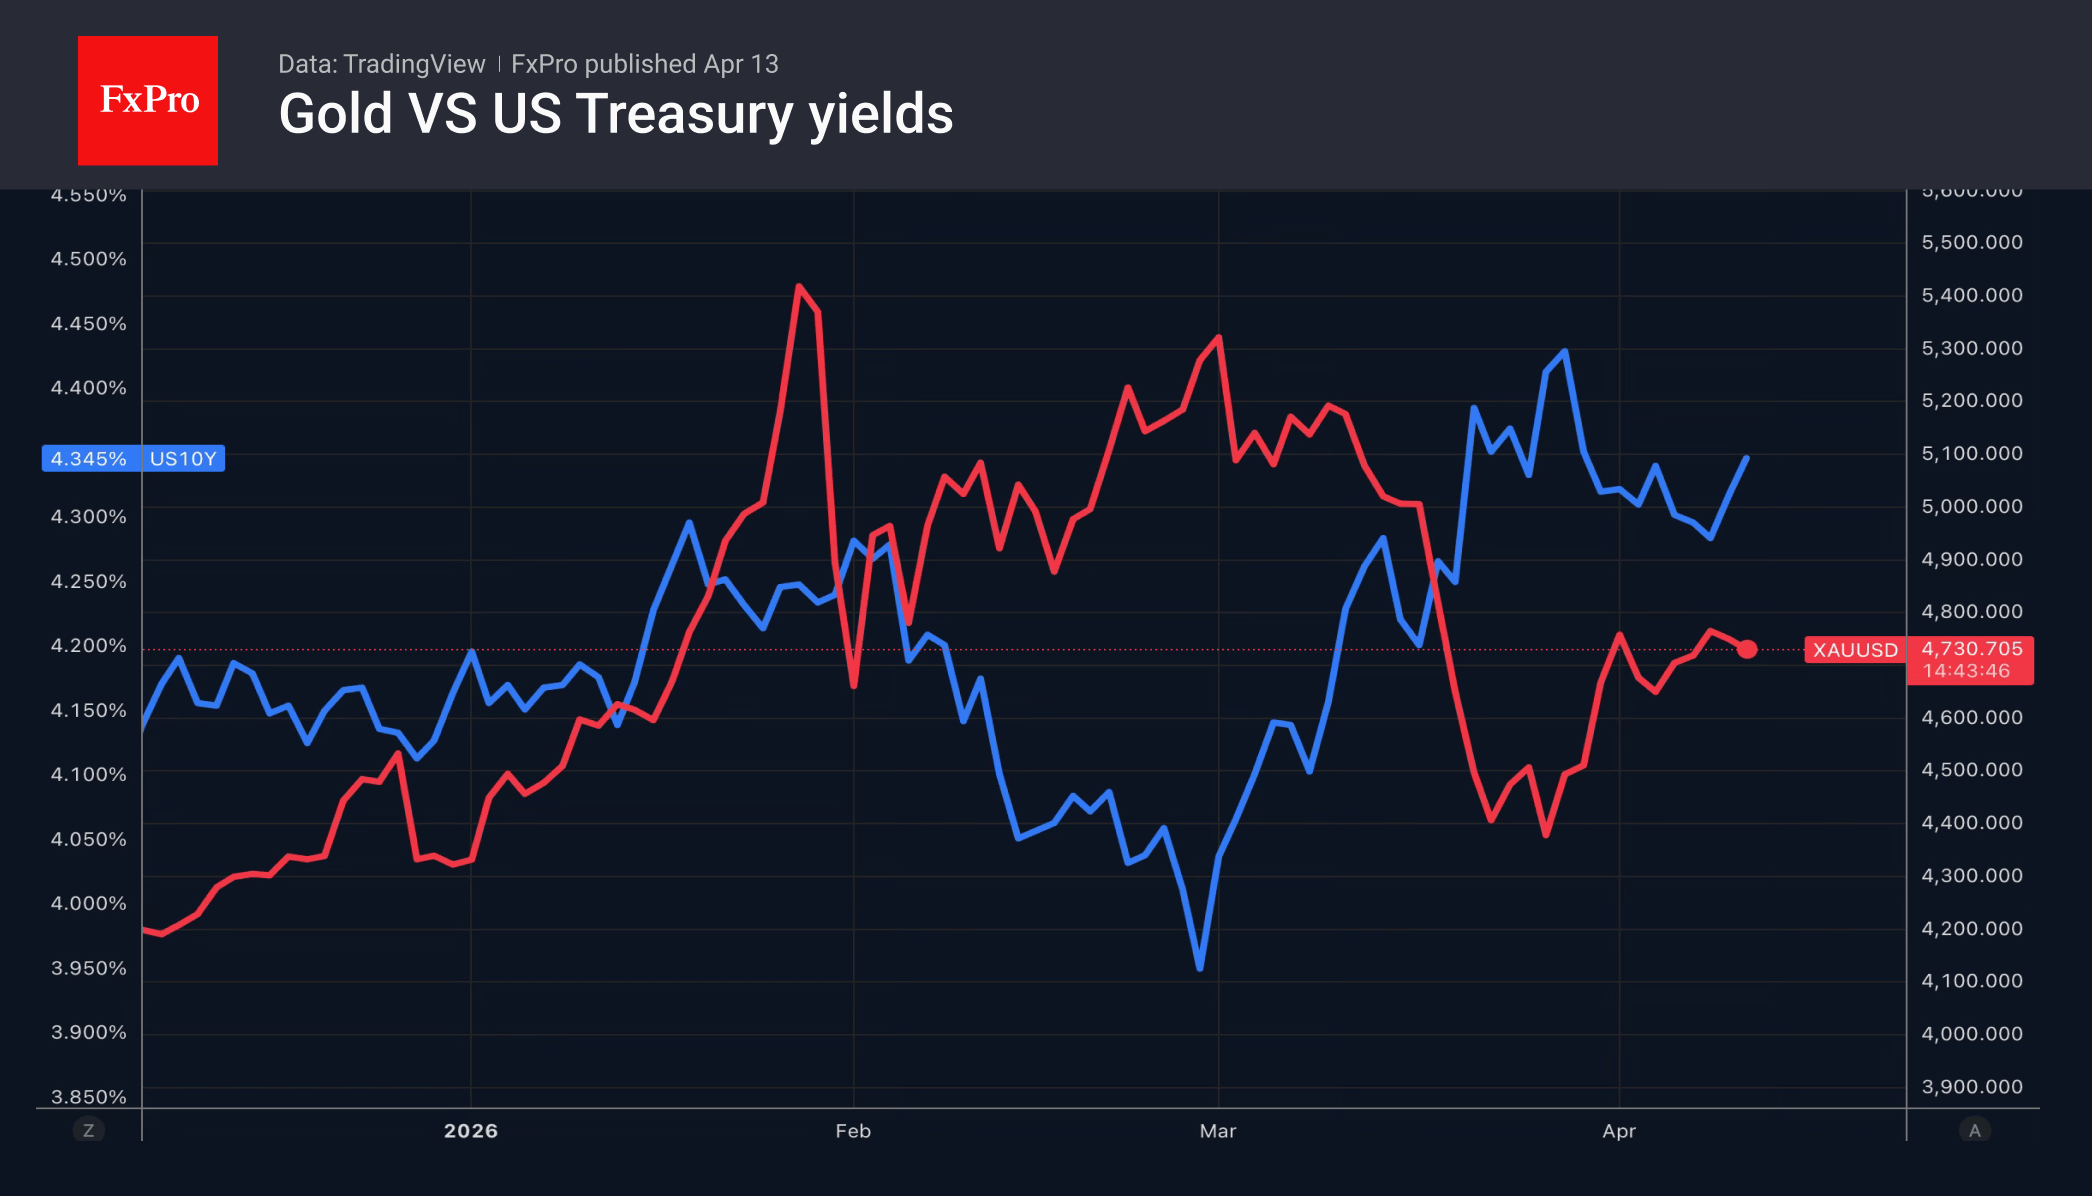
Unsurprisingly, news of the breakdown in US-Iran talks has clipped gold’s wings, with the metal closing last week at $4,750. Monday’s trading opened with a gap down, and the price soon slipped to $4,635, but by the time of writing had recovered nearly $100 from the day’s lows. In recent days, the precious metal has risen on expectations that the Fed will remain passive despite rising inflation, which will lead to a decline in real Treasury yields. The protracted conflict in the Middle East risks changing the rules of the game.
Crypto Market Has Once Again Retreated into a Range
Market Overview
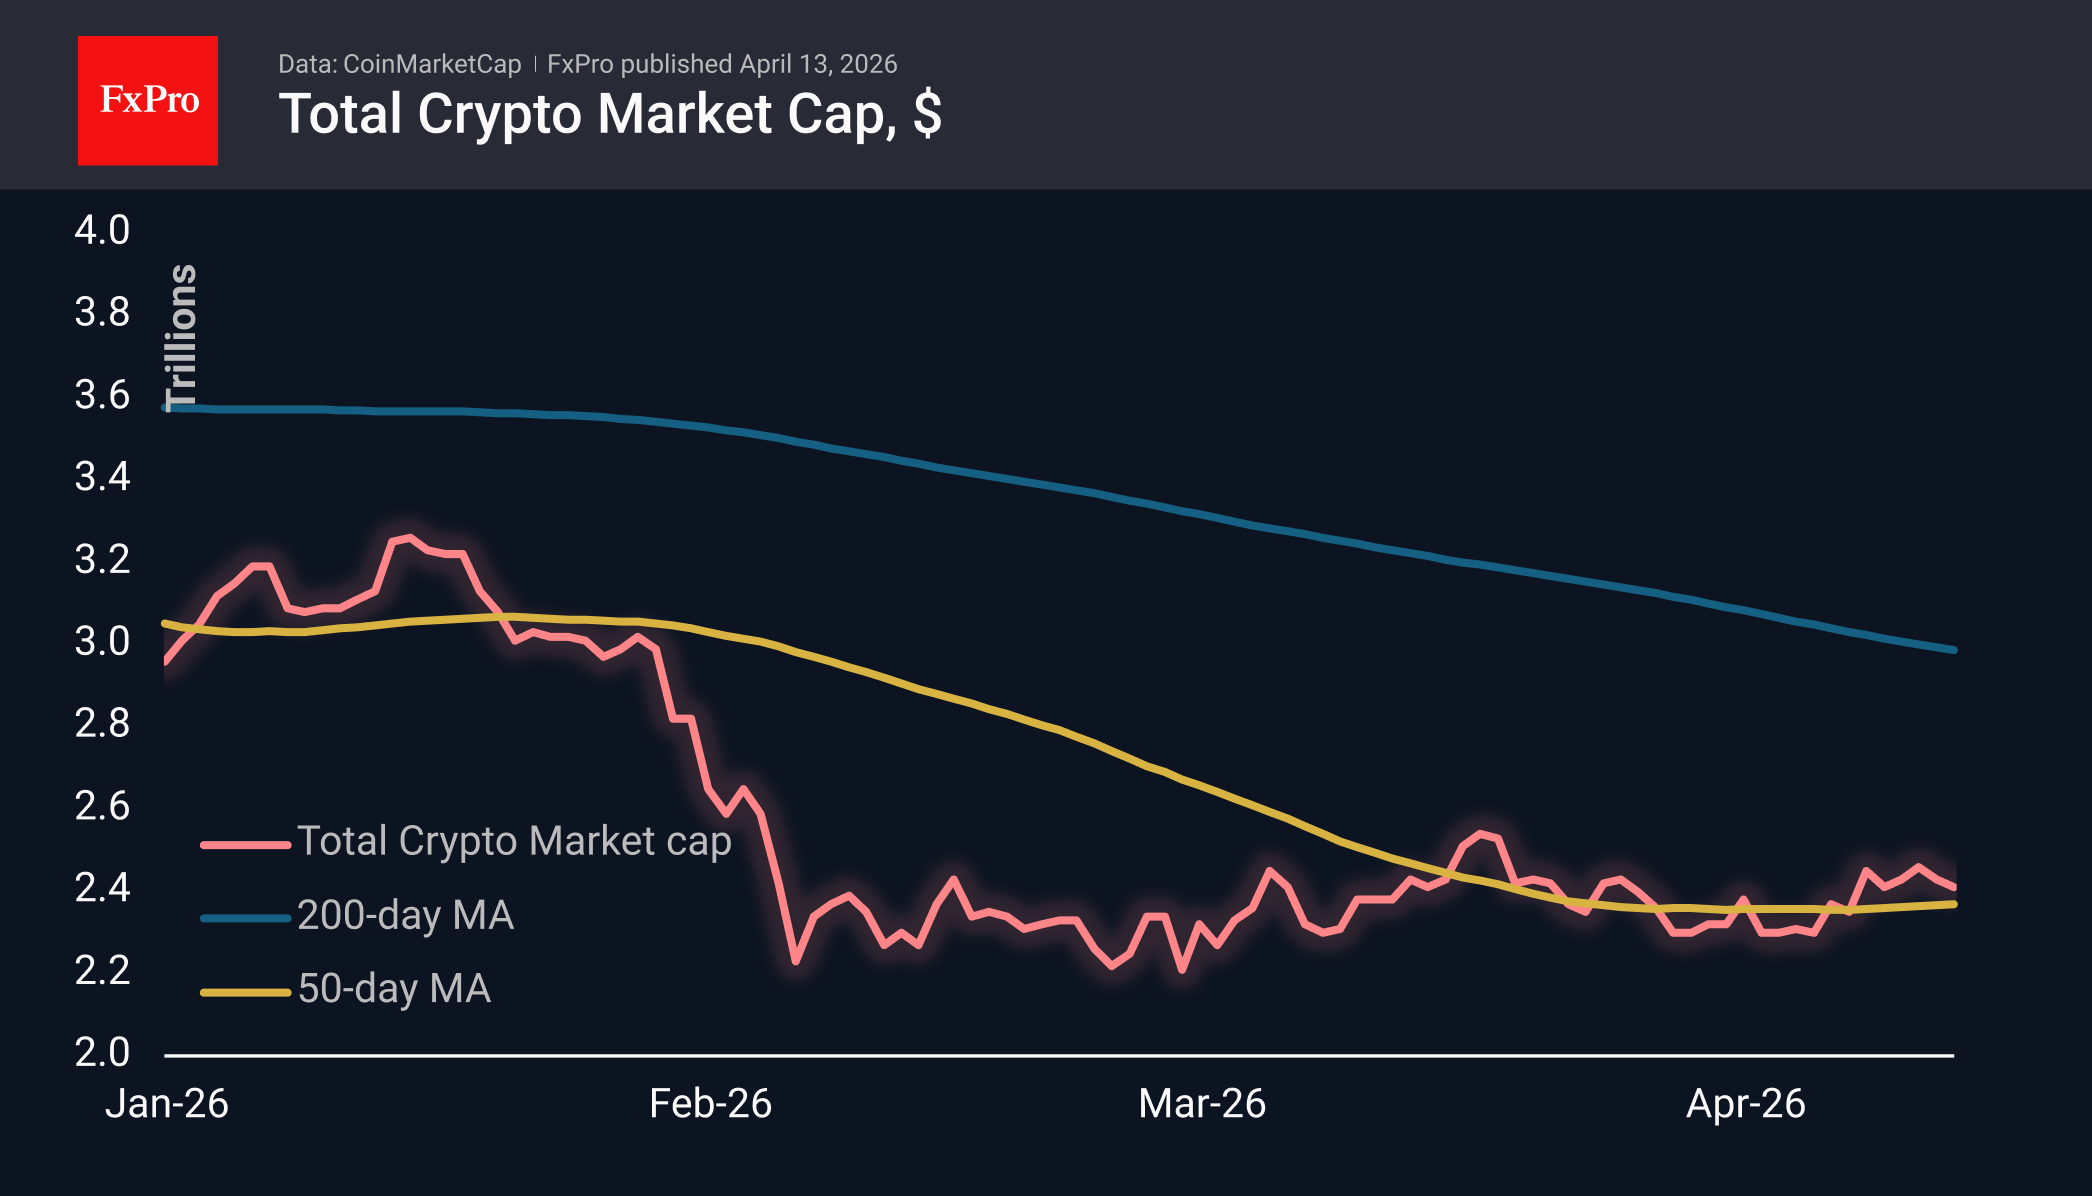
The crypto market, with a market capitalisation of $2.42 trillion, is 2% higher than a week ago but has lost 2.3% over the past 24 hours, as investors shift towards safe-haven assets amid developments in Iran. A new escalation has pushed cryptocurrencies back to mid-last-week levels. Among the top coins for the day, Aave (+8.5%), Zcash (+3.3%) and Dash (+2.3%) are leading the way. The laggards on the list are IOTA (−4%), Algo (−3.7%) and Neo (−3.1%).
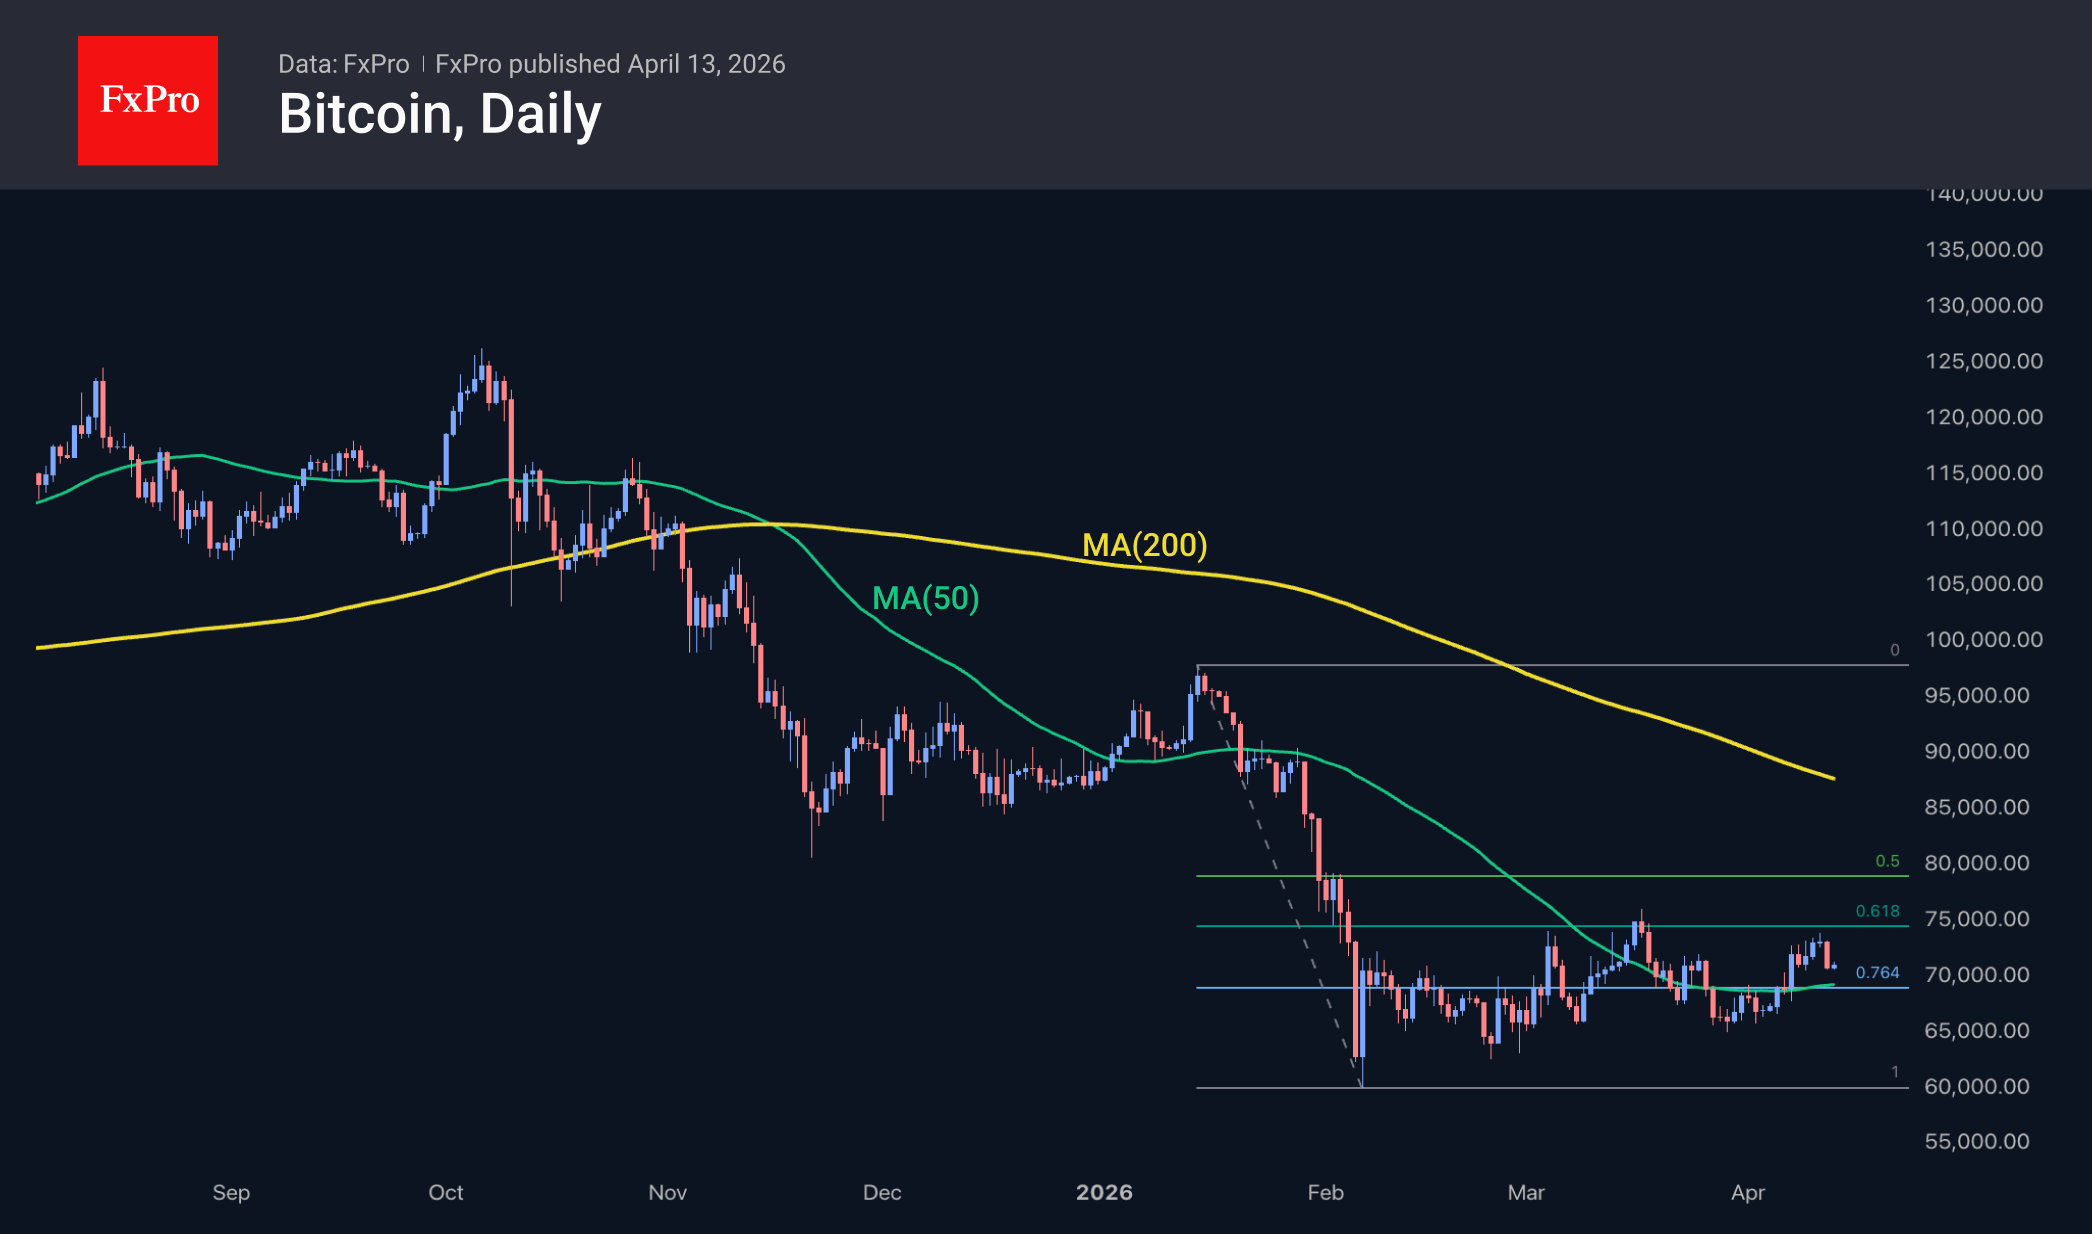
Bitcoin has retreated from above $73K to around $71K. This marks the third pullback from the upper boundary of the consolidation range, which corresponds to 61.8% of the downward move seen at the start of the year. The bears have once again prevented the market from embarking on an upward trajectory, though BTC remains above the 50-day moving average, indicating a positive medium-term trend.
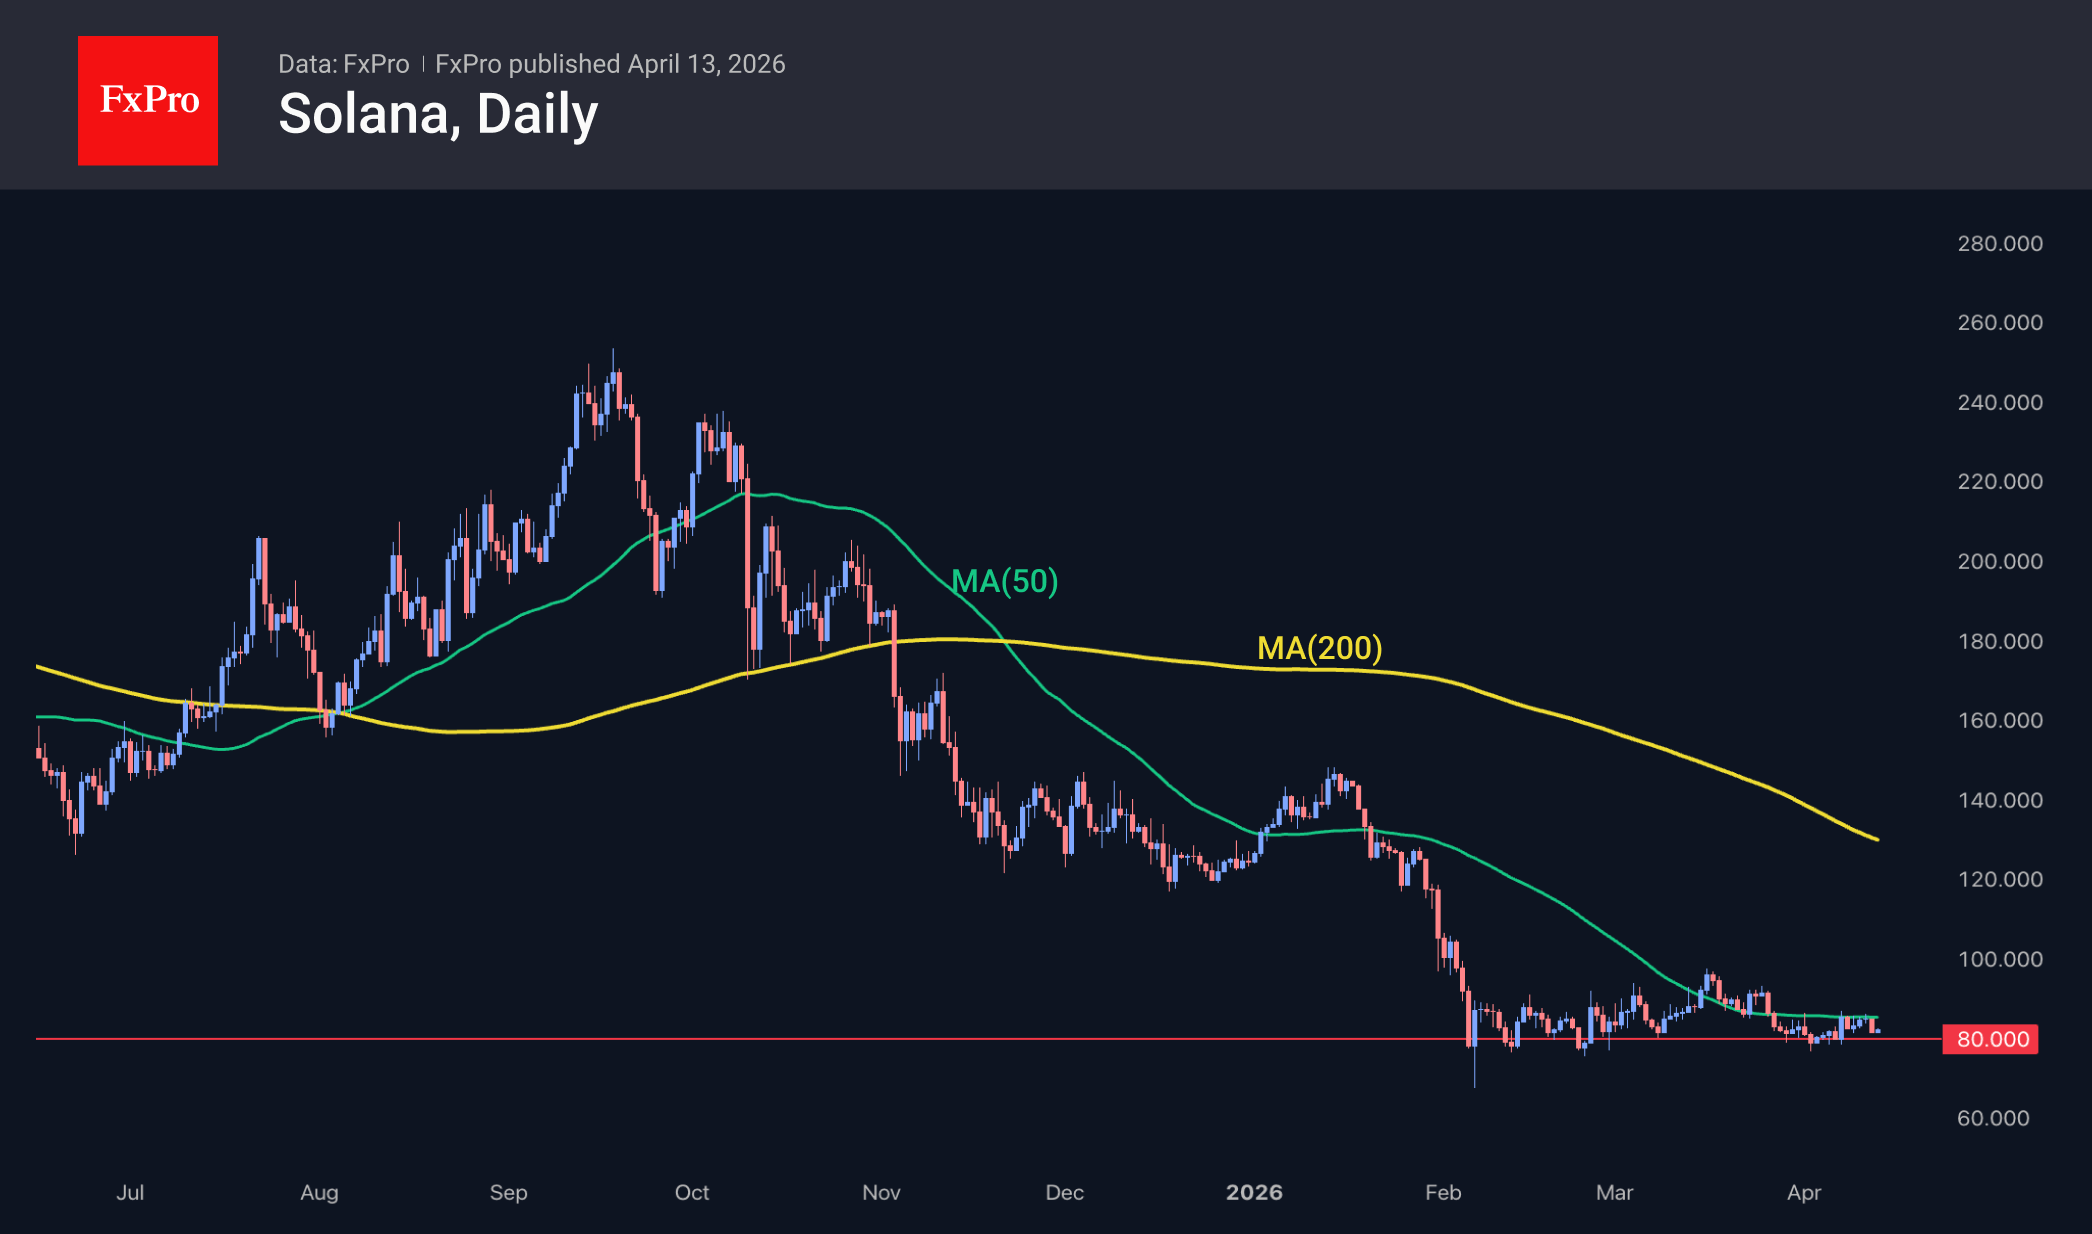
The same cannot be said for Solana, where the 50-day MA has acted as active resistance since the end of March. Although the coin remains above the $80 signal level, its prolonged stay near long-term support indicates relentless selling pressure and suggests that support may soon break. In that case, the potential target could be the $50–$60 range, where the coin was at the end of 2023, or even $20–$35, from where the last bull market began.
News Background
Inflows into US spot Bitcoin ETFs have reached their highest level in the past six weeks. According to SoSoValue, net inflows into spot BTC ETFs totalled $786.3 million. Inflows into spot Ethereum ETFs have also resumed, totalling $187.1 million.
Bitcoin and Ethereum are close to levels that signal a trend reversal, according to macro analyst Jordi Visser. In his view, for the upward movement to be consolidated, BTC needs to break above $76K and ETH above $2.4K.
Activity on the Ethereum network has approached February’s record high, a bullish signal amid ETH consolidation, notes analyst CryptoOnchain.
Shares in BitMine, the largest mining company holding Ethereum on its balance sheet, have begun trading on the New York Stock Exchange (NYSE). BitMine CEO Tom Lee described the listing as an important milestone for the company.
The Japanese government has approved amendments to the Financial Instruments and Exchange Act, under which cryptocurrencies are classified as financial instruments. The new rules also tighten requirements for crypto asset issuers.
Gold Momentum Fades Despite Dollar Weakness, $5,000 Rejection in the Making?
Gold had a near-perfect macro backdrop to extend higher last week, with Dollar weakness intensifying ahead of the Islamabad talks between the US and Iran. Yet, the rally has struggled to gain traction toward the $5,000 psychological level. The failure to capitalize on favorable fundamentals is beginning to raise questions about whether the current move is running out of momentum.
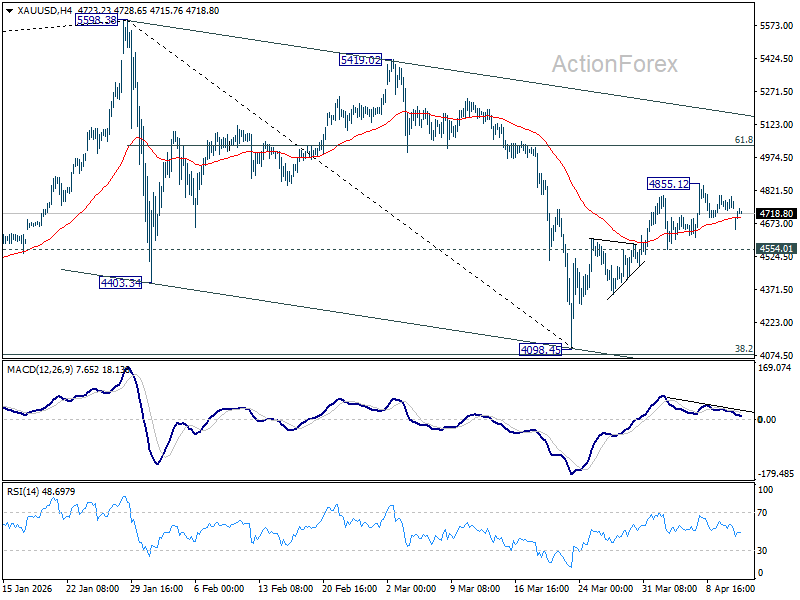
The loss of upside momentum is becoming apparent. Bearish divergence condition in 4H MACD is showing clear signs of fading strength. The rebound from 4,098.45 is more consistent with a distribution phase than a renewed accumulation cycle. In other words, rather than fresh buying driving prices higher, the market may be seeing gradual profit-taking into strength.
At the same time, Gold is not collapsing. The early-week gap lower today, triggered by the lack of progress in US-Iran negotiations, was quickly reversed as Dollar strength faded. This resilience indicates that there is still underlying demand supporting prices, preventing a sharper reversal.
However, this support may prove insufficient to push prices significantly higher. The $5,000 psychological level represents a major barrier, both technically and behaviorally. It is likely to attract selling interest from institutional players looking to lock in gains from lower levels.
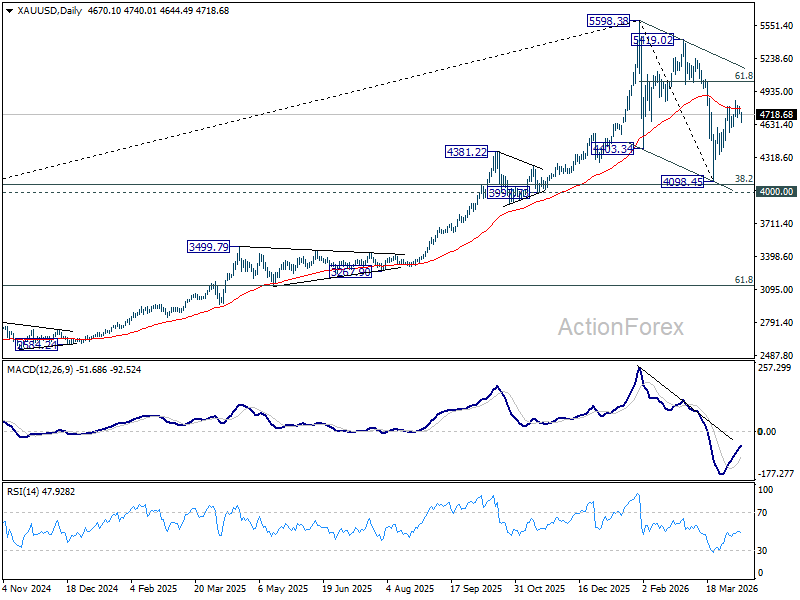
Technically, further gains are still possible as long as 4,554.02 minor support holds. The rebound from 4,098.45 could extend through 4,855.12. However, key resistance lies at 61.8% retracement of 5,598.38 to 4,098.45 at 5,025.40. This zone sits just above the 5,000 handle and reinforces the idea of a heavy ceiling. Without a strong catalyst, the probability of sustained gains beyond this region appears limited.
On the downside, a break below 4,554.01 minor support would be an early signal that the rebound has completed. Such a move would shift focus back toward the 4,098.45 low, with scope for an extension toward 4,000 psychological level.
Taken together, while residual demand may support prices in the short term, fading momentum and strong resistance near 5,000 increase the risk that the rally is topping out. Unless a new catalyst emerges to accelerate Dollar weakness, the balance of risks is gradually tilting toward a rejection scenario rather than a sustained breakout.
BoJ Ueda Cites Dual Impact of Oil Prices, Keeps Markets Guessing on Next Rate Hike
Bank of Japan Governor Kazuo Ueda struck a cautious tone, warning that rising crude oil prices and instability in global financial markets could pose fresh risks to Japan’s outlook. Speaking via remarks delivered by Deputy Governor Ryozo Himino, Ueda emphasized the need for "vigilance" as Middle East tensions intensify, noting that energy-driven shocks could disrupt both growth and inflation dynamics.
While Ueda maintained that Japan’s gradual economic recovery and solid wage gains are keeping underlying inflation on track toward the 2% target, he highlighted growing uncertainty around the oil outlook. A prolonged conflict could weigh on factory output through supply chain disruptions, potentially widening the output gap and dampening inflation. At the same time, he acknowledged that higher energy costs could lift medium- to long-term inflation expectations, creating a two-sided risk for policymakers.
"If the output gap worsens, that could weigh on underlying inflation. On the other hand, if rising crude oil prices heighten the public's medium- and long-term inflation expectations, that could push up underlying inflation," he said.
Importantly, Ueda offered no clear signal on the policy path ahead of the April 27–28 meeting. Markets had been looking for clues on a possible rate hike. But for now, BoJ policymakers appear focused on assessing how the evolving geopolitical situation feeds into economic activity, price trends, and financial conditions before making any decisive move.
USD/JPY Rises for Third Day: Will There Be Yen Intervention or Not
USD/JPY rose to 159.73 on Monday. The Japanese yen has fallen for a third consecutive day due to a fresh surge in oil prices following the failure of the United States and Iran to reach an agreement at talks in Islamabad.
US President Donald Trump has announced plans to block the Strait of Hormuz and is considering resuming attacks on Iran, dramatically increasing the risks of an escalating global energy crisis.
The protracted conflict is narrowing the Bank of Japan's room for manoeuvre. A split remains within the regulator: some members are concerned about rising inflation, while others worry about the risks of an economic slowdown. The BoJ is scheduled to meet on 27-28 April.
Economy Minister Ryosei Akazawa noted that monetary policy could be used to curb inflation through support for a stronger yen.
The exchange rate is now approaching the key level of 160 per dollar. Previously, this area served as a trigger for currency interventions by the Japanese authorities.
Technical Analysis
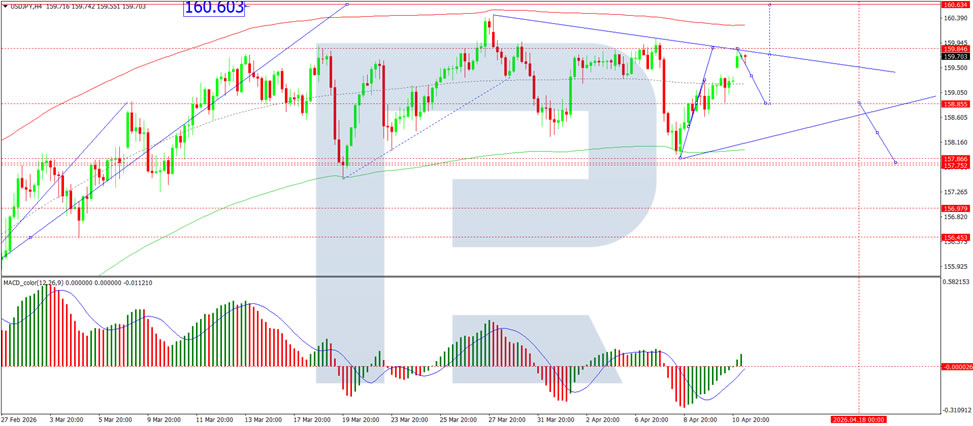
On the H4 chart, USD/JPY formed a consolidation range around the 158.88 level and, with an upside breakout, completed a growth wave to 159.82. Today, the beginning of a correction to the 158.88 level is expected, followed by a rise to 160.60. Subsequently, a new downward impulse to 157.70 is anticipated, with the prospect of a continued correction to 156.00. Technically, this scenario is confirmed by the MACD indicator-its signal line is below the zero level and pointing strictly upwards, reflecting the potential for the wave to continue.
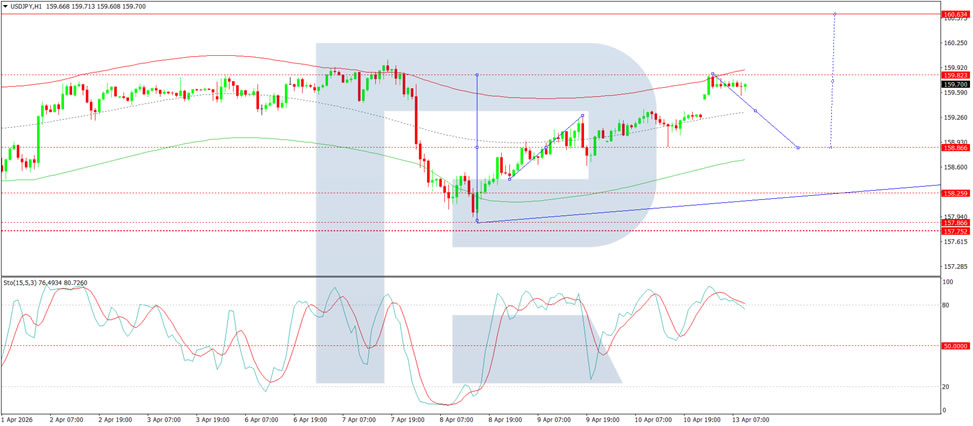
On the H1 chart, the market completed a growth wave structure to 159.82. Today, the probability of the next downward wave developing to the 158.88 level (testing from above) will be considered. The scenario is confirmed by the Stochastic oscillator-its signal line is above the 80 level and pointing strictly downwards to 20, indicating that downside potential remains in the short term.
Conclusion
USD/JPY continues its three-day rally as failed US-Iran talks in Islamabad triggered a fresh spike in oil prices, with President Trump threatening to block the Strait of Hormuz and resume attacks. The yen remains under pressure, while the Bank of Japan faces internal divisions over how to respond to competing inflation and growth risks. With the pair approaching the psychologically significant 160 level-a previous intervention trigger-markets are on high alert for potential action from Japanese authorities. Technical indicators suggest a possible near-term correction before further upside, but the yen's fate ultimately hinges on whether geopolitical tensions escalate or ease in the coming days.
WTI Oil Price Jumps Above $100 on Fresh Geopolitical Turmoil
WTI oil price jumped on Monday, expressing strong concerns of market participants after peace talks between the US and Iran over the weekend failed.
Opening with a gap higher and above psychological $100 level, with the contract price gaining over 5% during early Monday trading, fades optimism for potential solution of the war in the Middle East that put the whole region in fire and threatens to spill over in a domino-effect.
Failure of peace talks and the latest threats of President Trump that the US will close the Strait of Hormuz, raises worries of stronger supply shortage, particularly following Trump’s comments that oil and gas prices will remain elevated through the US midterm election in November, as the latest calculations point to approx. 750,000 barrels per day supply shortage.
Analysts also expressed their worries about wider conflict as Trump said that the US army will close the way out of Hormuz to all ships, awaiting to see reaction from China, in such scenario.
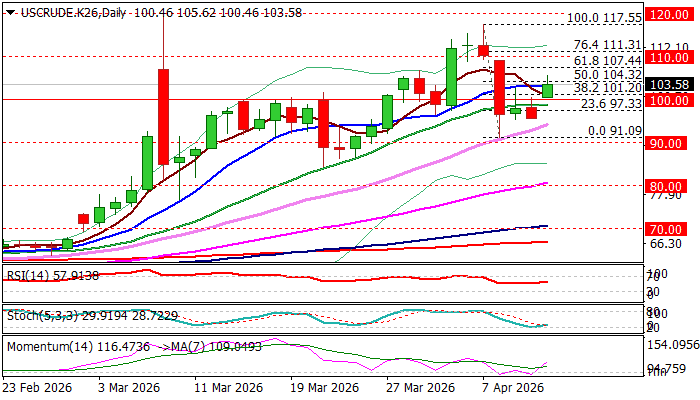
Monday’s price rise hit over 50% retracement of $117.55/$91.09 bear-leg, signaling formation of a higher low and shifting near-term focus to the upside.
Daily studies remain predominantly bullish (strengthening positive momentum / MAs in almost full bullish setup) contributing to supportive factors from recent developments on the fundamental side.
Sustained break above cracked 50% retracement (104.32) to confirm strong bullish stance and expose targets at $107.44 (Fibo 61.8%) and $110.00 (round figure).
Near-term bias is expected to remain with bulls while the price holds above $100.
Res: 104.32; 105.62; 107.44; 110.00
Sup: 102.00; 101.20; 100.00; 97.38
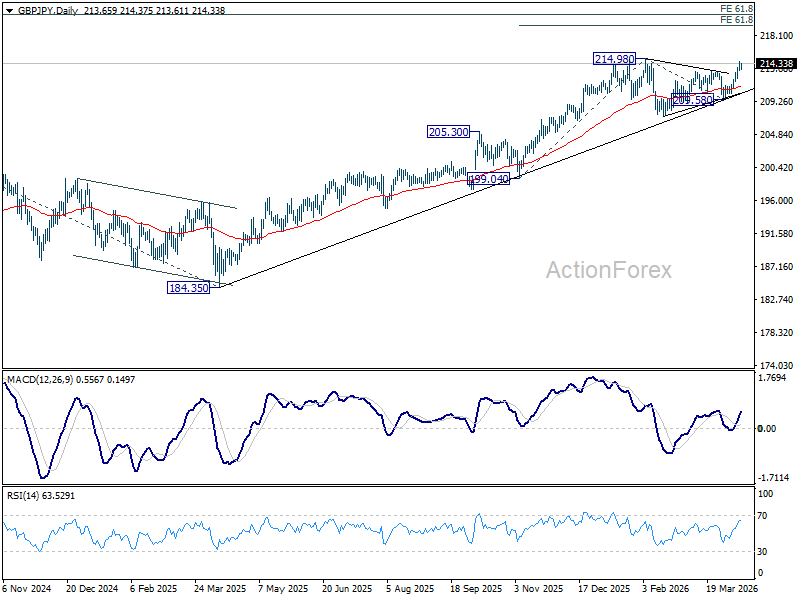
GBP/JPY Daily Outlook
Daily Pivots: (S1) 213.75; (P) 214.17; (R1) 214.85; More...
Intraday bias in GBP/JPY remains on the upside for retesting 214.98 high. Firm break there will confirm larger up trend resumption, and target 61.8% projection of 199.04 to 214.98 from 209.58 at 219.43. On the downside, below 213.47 minor support will delay the bullish case, and turn intraday bias neutral again first.
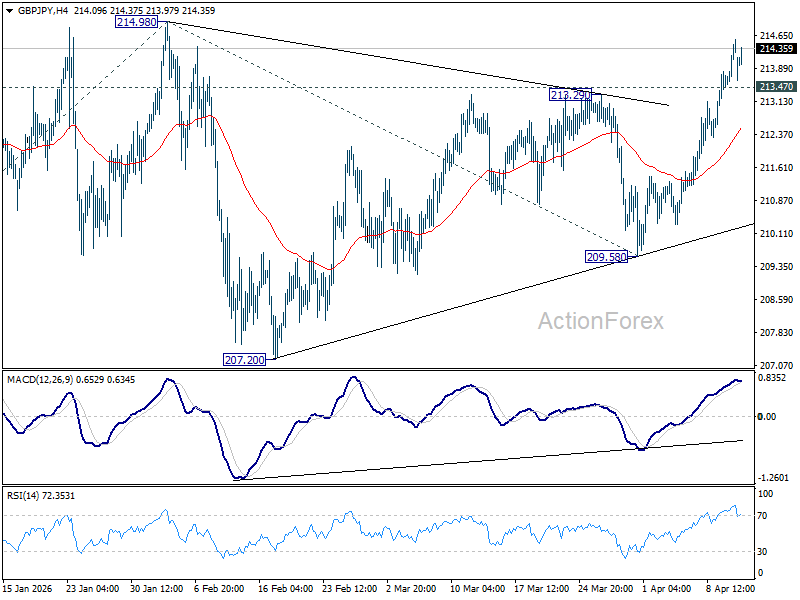
In the bigger picture, up trend from 123.94 (2020 low) is still in progress. Firm break of 214.98 will target 61.8% projection of 148.93 (2022 low) to 208.09 (2024 high) from 184.35 at 220.90. This will remain the favored case as long as 55 W EMA (now at 204.47) holds, even in case of another deep pullback.