Sample Category Title
Sunset Market Commentary
Markets
US headline CPI accelerated to 0.9% M/M in March, the fastest monthly pace since June 2022. On an annual basis, inflation increased from 2.4% to 3.3%, in line with our KBC Nowcast estimate but just below the 3.4% consensus estimate. It was the highest outcome since May 2024. Gasoline accounted for almost three-quarters of the US CPI rise in the biggest price rise on record since 1967. Energy prices overall increased by 10.9% M/M, the most since 2005. Other details showed used-car prices falling for a fourth straight month with grocery prices also falling. Services costs excluding energy rose by 0.2% M/M with airfares up 2.7%. Shelter prices rose 0.3% M/M. The pace of core CPI steadied at 0.2% M/M with annual underlying inflation ticking up from 2.5% to 2.6%. Looking forward to April, our KBC Nowcast model expect headline CPI to rise further to 3.8% Y/Y (+0.6% M/M) assuming gas prices slightly above current levels ($4.15/gallon). Core CPI is forecast to stick at 2.6%. US Treasuries very briefly spiked higher as inflation headlines hit the screens, but that move didn’t stick. If any, Treasuries tend to cede some ground going into this weekend negotiations between the US and Iran in Islamabad. With Iran’s 10-point proposal and the US 15-point plan being diametrically opposed, the best outcome probably is to meet again somewhere in the near future and extend the fragile cease-fire. Israel’s role against Lebanon might be crucial in determining the potential success. In the meantime, Iran keeps a very strong grip on the Straight of Hormuz both via its selective toll-booth system and via a loss of confidence at stranded vessels to embark on the passage. US yields currently add around 2 bps across the curve. German Bunds and especially UK gilts underperform. German yields are 4 to 5 bps higher on the day while the UK yield curve bear steepens with yields 5.5 bps (2-yr) to 9 bps (30-yr) higher. Brent crude initially traded with an upward bias today ($96/b to $98/b) after Iran news agencies denied news that a negotiating team had already arrived in Pakistan. They emphasized that negotiations will be suspended as long as the US does not fulfill its commitment to a ceasefire in Lebanon. There were also headline of Iran-backed militia hitting targets in Kuwait. Brent crude afterwards returned to $96/b after Ukrainian President Zelensky’s top aide suggested nearing a deal with Russia to stop the war. On FX markets, the dollar is slightly weaker at EUR/USD 1.1726. European stock markets add 0.75% to their recovery with key US indices currently mixed (-0.3% for Dow, +0.5% for Nasdaq).
News & Views
Hungary heads to the polls on Sunday in what may prove its most consequential parliamentary election in two decades. Prime Minister Viktor Orbán and his Fidesz party are seeking to extend a 16-year hold on power. Over that period, Orbán has steadily consolidated authority, often at the expense of rule-of-law standards and EU norms, according to the European Commission, leaving Budapest frequently at odds with Brussels. The standoff resulted in roughly €20bn of EU funds remaining frozen. Recent polling, however points to a potentially dramatic shift: Péter Magyar, a former Fidesz insider who broke away in 2024 to found the Tisza movement, has surged in popularity. In some surveys he commands a lead large enough to secure a two-thirds parliamentary majority. Markets have responded favourably to the prospect of a more pro-European government, anticipating improved relations with Brussels, access to suspended funds and a return to more orthodox policymaking, developments already reflected in lower long-term yields and a firmer forint. Yet uncertainty remains elevated. Polls are divided and often politically skewed, electoral reforms over the past decade may tilt the playing field towards the incumbent and turnout will be critical—leaving investors wary of asymmetric risks, particularly for the Hungarian currency, despite the prevailing market optimism. At the EUR/HUF 377, the forint almost fully reversed initial losses post the war in the Middle East. Aat 6.45%, the forint 10-y swap yield also already trades about 1.0% below the mid-March peak (Risk-off) levels.
Statistics Canada reported March labour market data close to expectations. Employment rose modestly (+14k), but this came on the back of a 109k cumulative decline over the previous two months. Employment was still 87k higher Y/Y, due to a rise at the end of last year. The unemployment rate was unchanged at 6.7%. Positive job growth was reported in 'other services' (+15k) and also in natural resources (+10k) but employment declined in finance, insurance, real estate, rental, and leasing (-11k). Average hourly wages increased 4.7% Y/Y (was 3.9% Y/Y in February). After broad-based USD strength in the month of March, the loonie recently regained ground to currently trade near 1.382 (peak 1.396 end March).
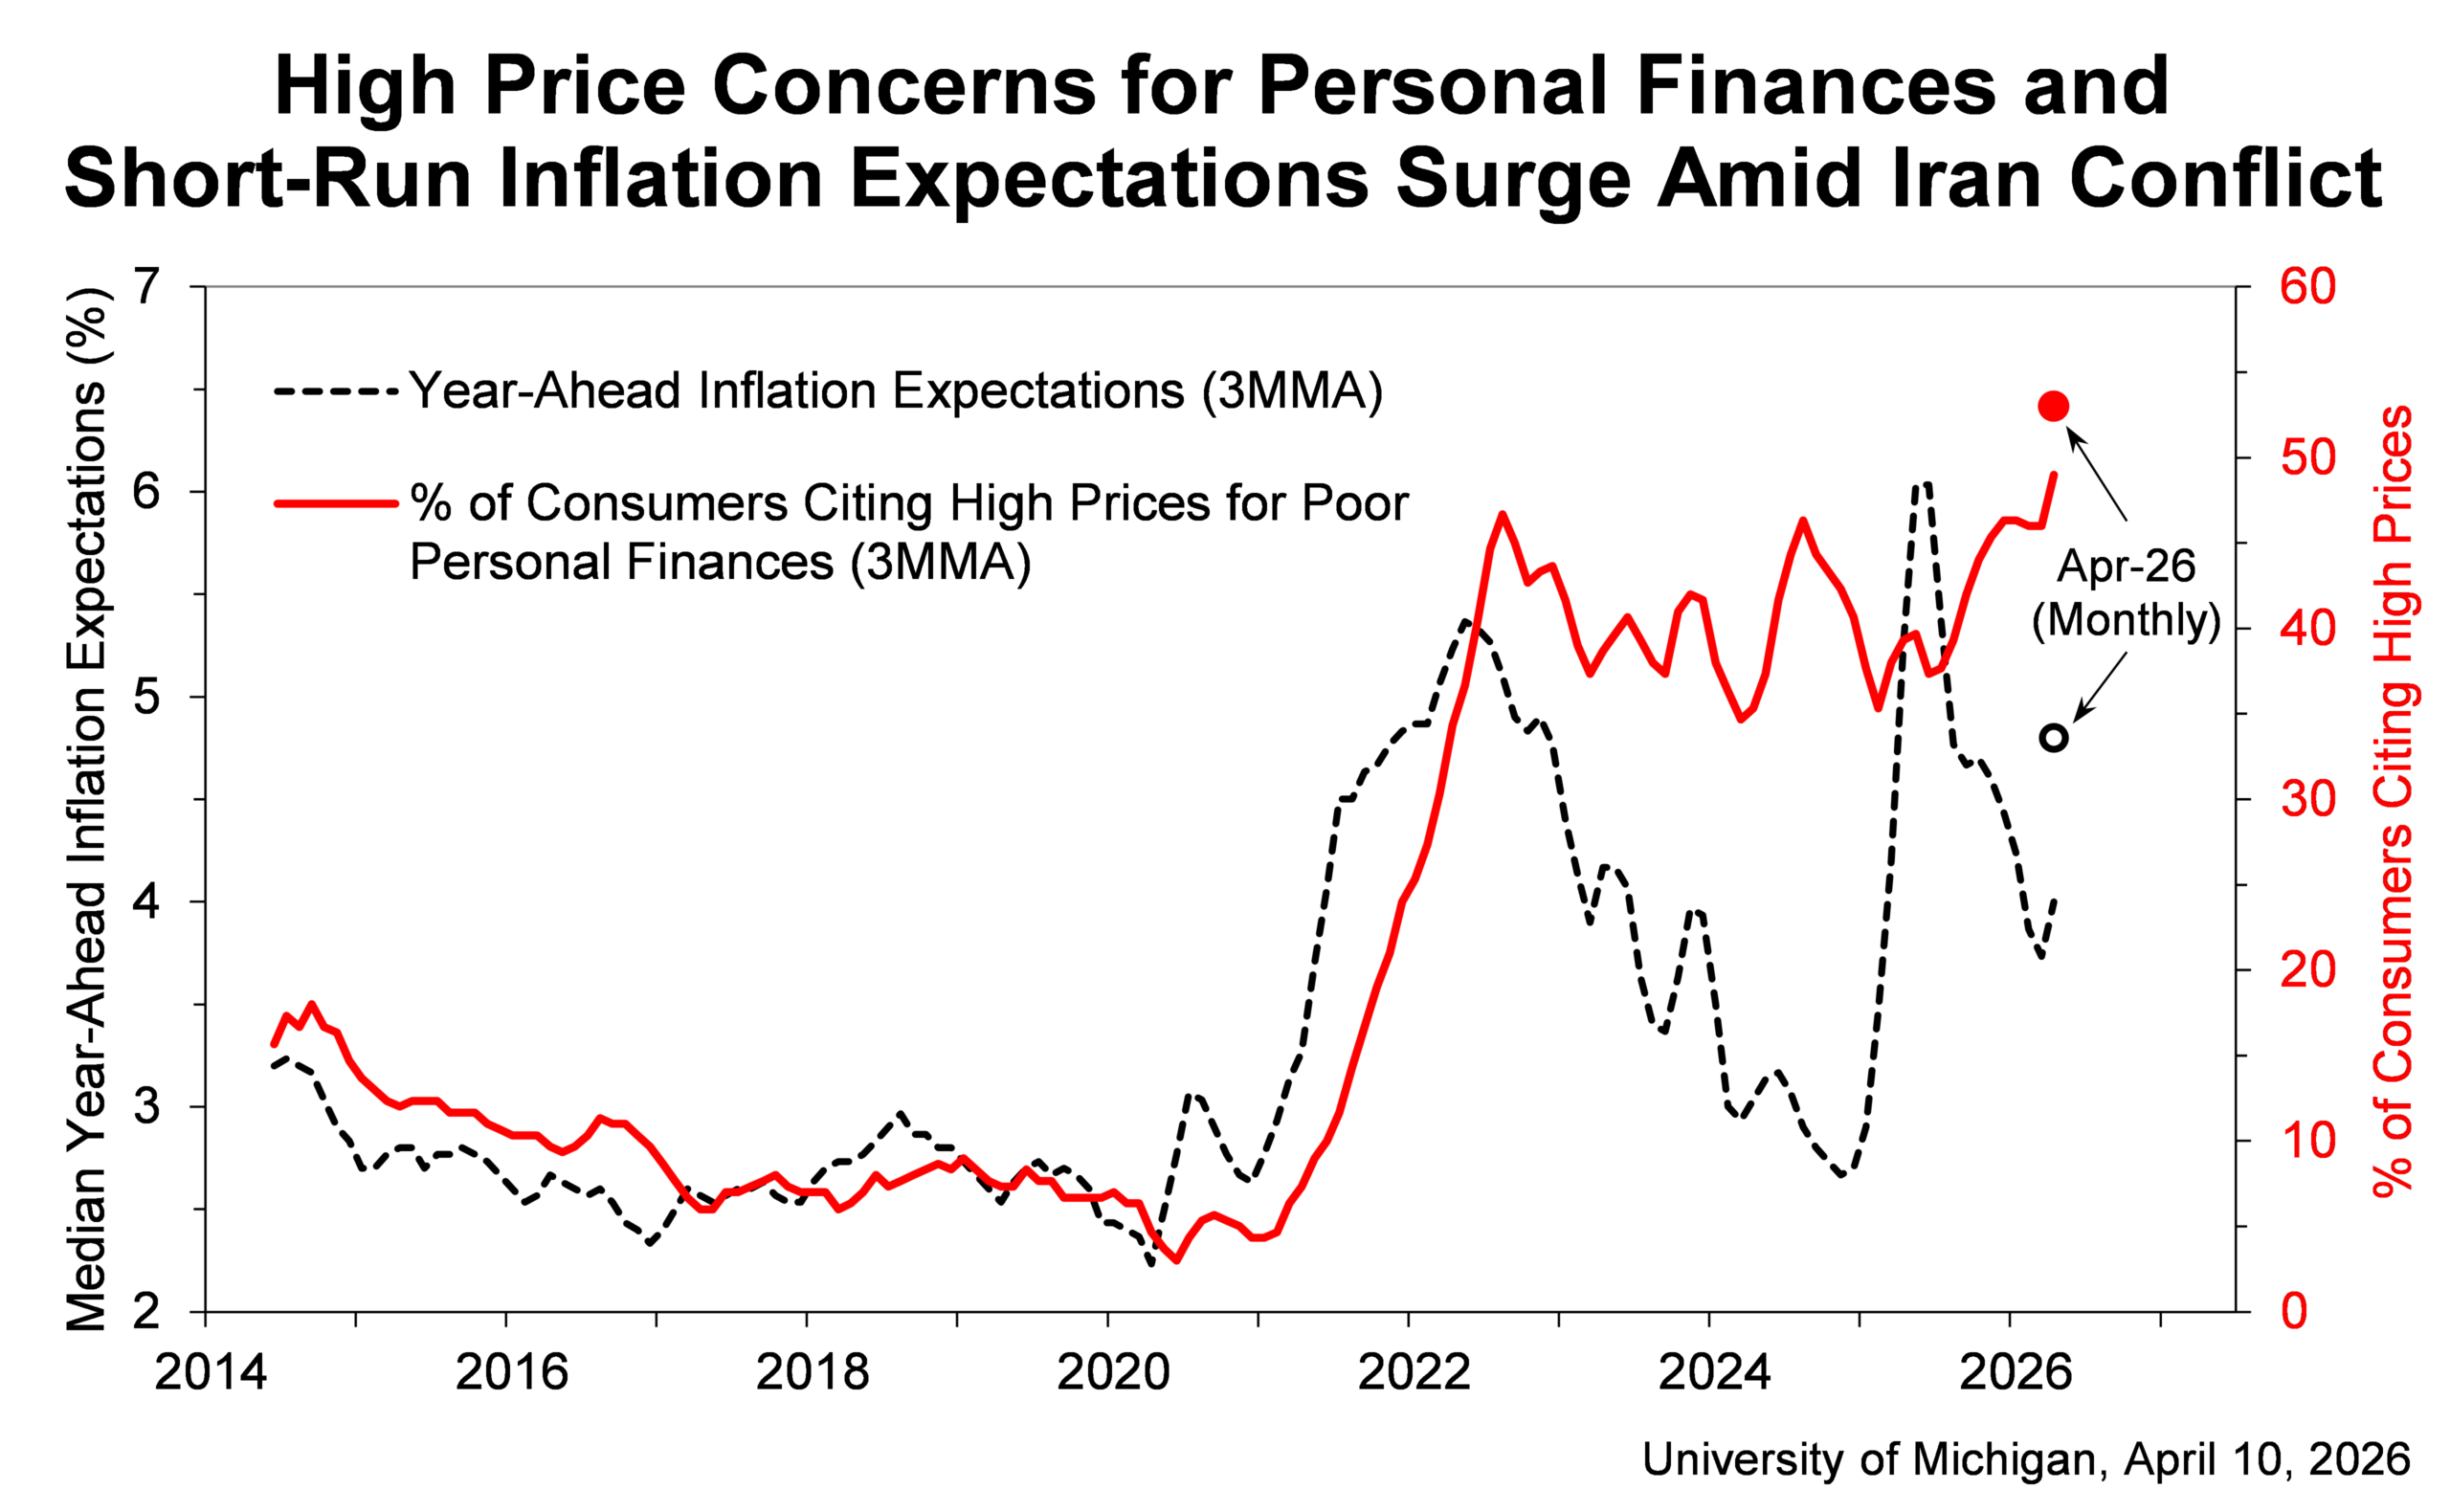
US Inflation Expectations Surge to 4.8% as Michigan Sentiment Slumps to 47.6
The University of Michigan Consumer survey showed a sharp surge in inflation expectations in April, with one-year expectations jumping from 3.8% to 4.8%, the largest monthly increase since April 2025. Long-run expectations also rose from 3.2% to 3.4%, marking the highest level since November 2025 and signaling that inflation concerns are becoming more persistent.
At the same time, overall sentiment deteriorated notably. The headline index fell from 53.3 to 47.6, with Current Conditions dropping from 55.8 to 50.1 and Expectations declining from 51.7 to 46.1, pointing to a broad-based weakening in consumer confidence.
Survey Director Joanne Hsu noted that many respondents blamed the Iran conflict for worsening economic conditions, particularly through higher energy prices. However, with most interviews conducted before the April 7 ceasefire announcement, sentiment could improve if supply disruptions ease and gasoline prices moderate.
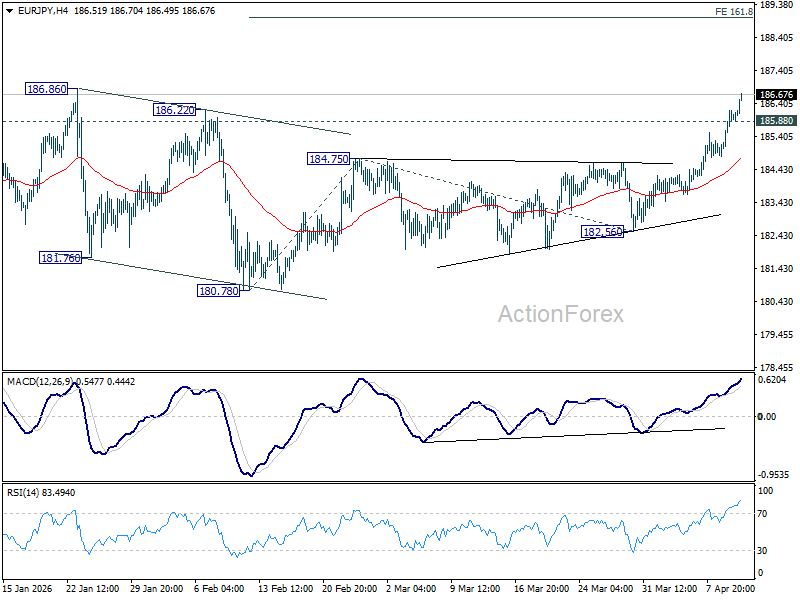
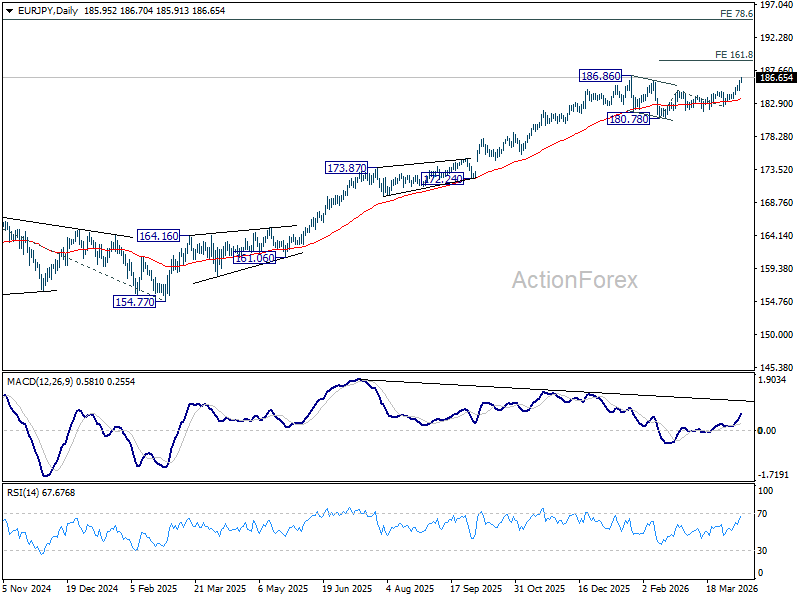
EUR/JPY Mid-Day Outlook
Daily Pivots: (S1) 185.15; (P) 185.71; (R1) 186.54; More...
EUR/JPY's rally accelerates higher today and intraday bias remains on the upside for 186.86 high. Firm break there will resume larger up trend. Next near term target is 161.8% projection of 180.78 to 184.75 from 182.56 at 188.98. On the downside, below 185.88 minor support will delay the bullish case and turn intraday bias neutral first.
In the bigger picture, consolidations from 186.86 might still extend. But as long as 55 W EMA (now at 176.56) holds, the larger up trend from 114.42 (2020 low) remains intact. Firm break of 186.86 will pave the way to 78.6% projection of 124.37 (2022 low) to 175.41 (2025 high) from 154.77 at 194.88 next.
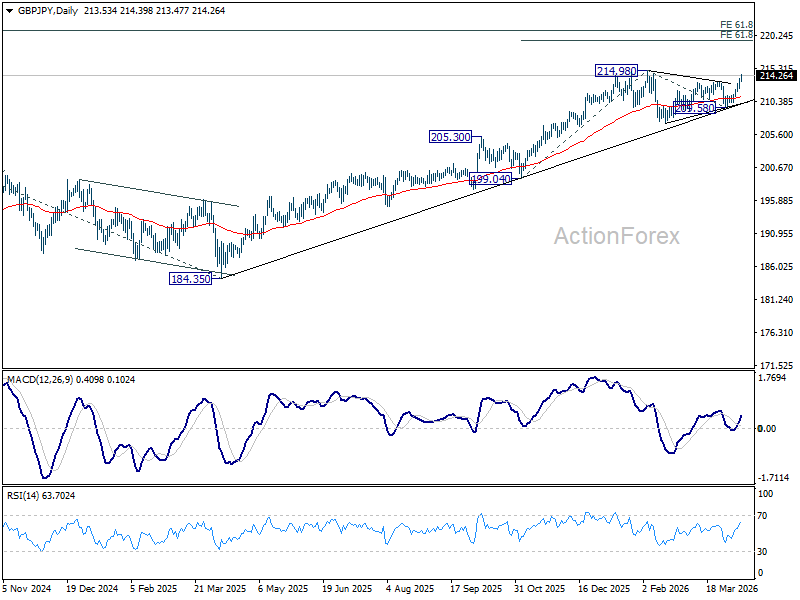
GBP/JPY Mid-Day Outlook
Daily Pivots: (S1) 212.69; (P) 213.27; (R1) 214.22; More...
GBP/JPY's rally from 209.58 accelerate higher today and intraday bias stays on the upside for 214.98 high. Firm break there will confirm larger up trend resumption. Next target is 61.8% projection of 199.04 to 214.98 from 209.58 at 219.43. On the downside, below 213.47 minor support will delay the bullish case, and turn intraday bias neutral again first.
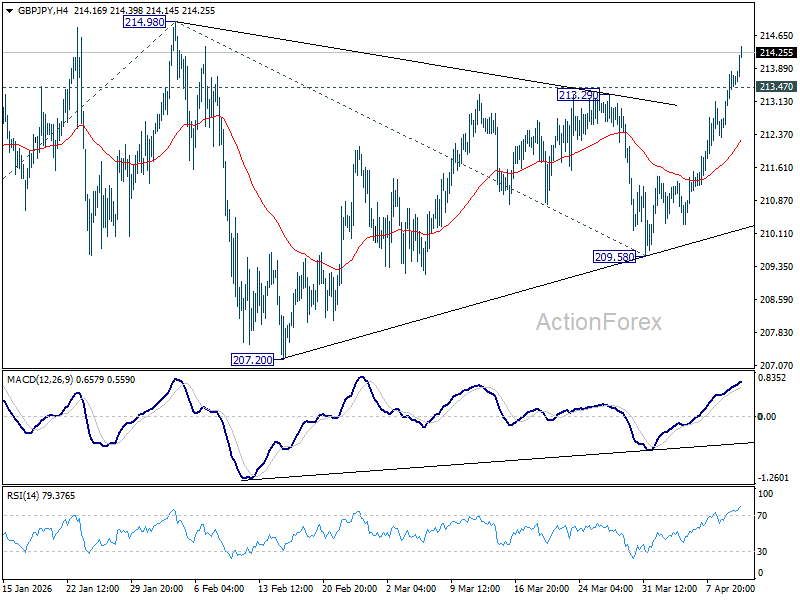
In the bigger picture, up trend from 123.94 (2020 low) is still in progress. Firm break of 214.98 will target 61.8% projection of 148.93 (2022 low) to 208.09 (2024 high) from 184.35 at 220.90. This will remain the favored case as long as 55 W EMA (now at 204.08) holds, even in case of another deep pullback.
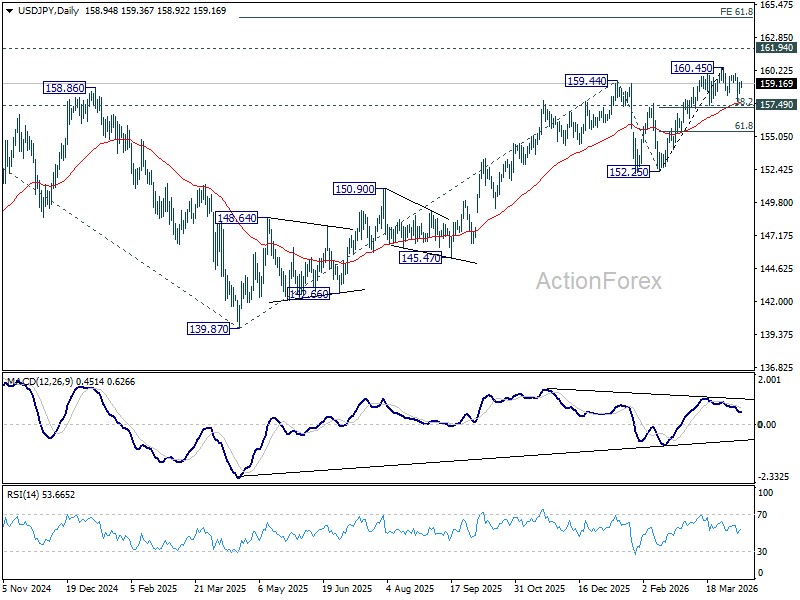
USD/JPY Mid-Day Outlook
Daily Pivots: (S1) 158.54; (P) 158.92; (R1) 159.38; More...
Intraday bias in USD/JPY remains neutral as consolidation from 160.45 is still in progress. Further rise is expected as long as 157.49 cluster support (38.2% retracement of 152.25 to 160.45 at 157.31) holds. Firm break of 160.45 will resume the rise from 152.25 to retest 161.94 high. However, firm break of 157.31/49 will bring deeper fall back to 61.8% retracement at 155.38 next.
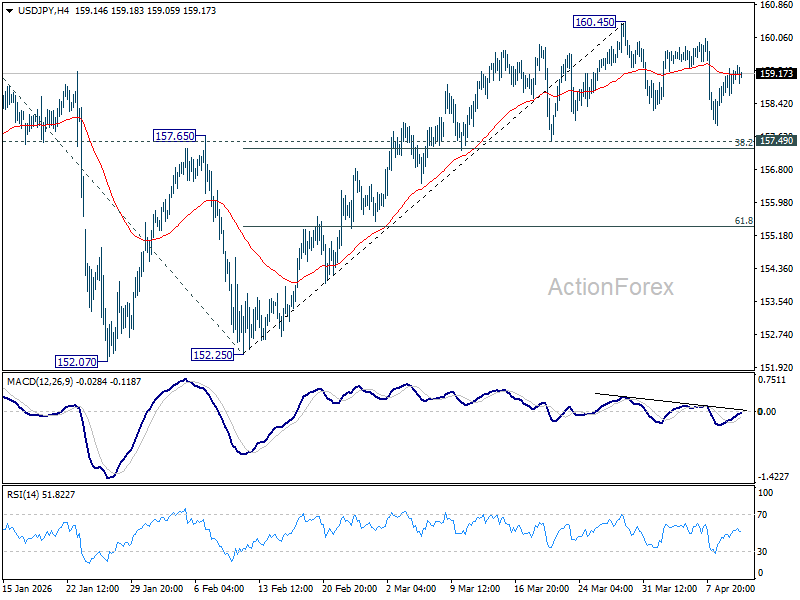
In the bigger picture, outlook is unchanged that corrective pattern from 161.94 (2024 high) should have completed with three waves at 139.87. Larger up trend from 102.58 (2021 low) could be ready to resume through 161.94. This will remain the favored case as long as 55 W EMA (now at 152.97) holds. Firm break of 161.94 will pave the way to 61.8% projection of 102.58 to 161.94 from 139.87 at 176.75.
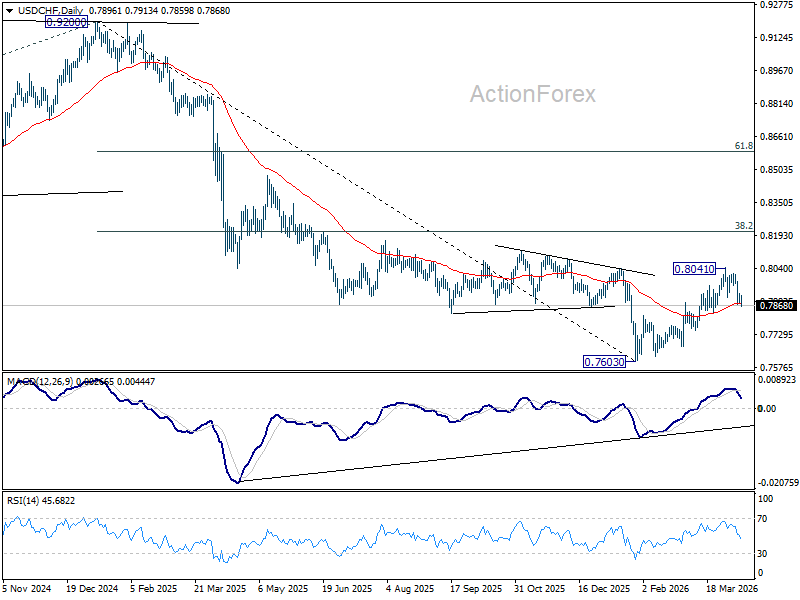
USD/CHF Mid-Day Outlook
Daily Pivots: (S1) 0.7881; (P) 0.7903; (R1) 0.7927; More….
Intraday bias in USD/CHF is back on the downside as fall from 0.8041 is resuming. Sustained break of 0.7877 cluster support (38.2% retracement of 0.7603 to 0.8041 at 0.7874) will argue that the rise from 0.7603 has completed, and bring deeper fall to 61.8% retracement at 0.7770 and below. Nevertheless, above 0.7925 minor resistance will turn intraday bias neutral again first.
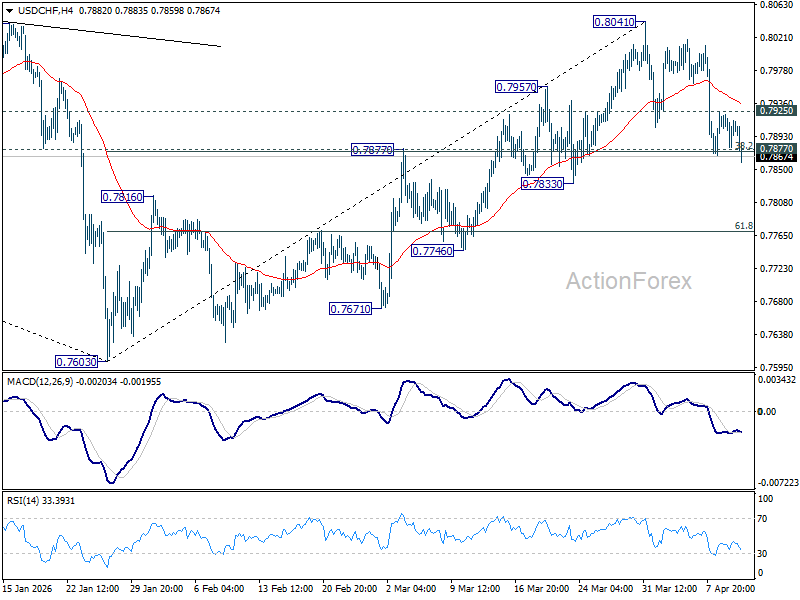
In the bigger picture, rebound from 0.7603 medium term bottom is seen as correcting the fall from 0.9200 only. rejection by 55 W EMA (now at 0.8081) will affirm this case, and setup down trend resumption to 100% projection of 1.0146 (2022 high) to 0.8332 from 0.9200 at 0.7382 at a later stage. Though, sustained break of 55 W EMA will suggest that it's probably correcting the larger scale down trend from 1.0146 (2022 high).
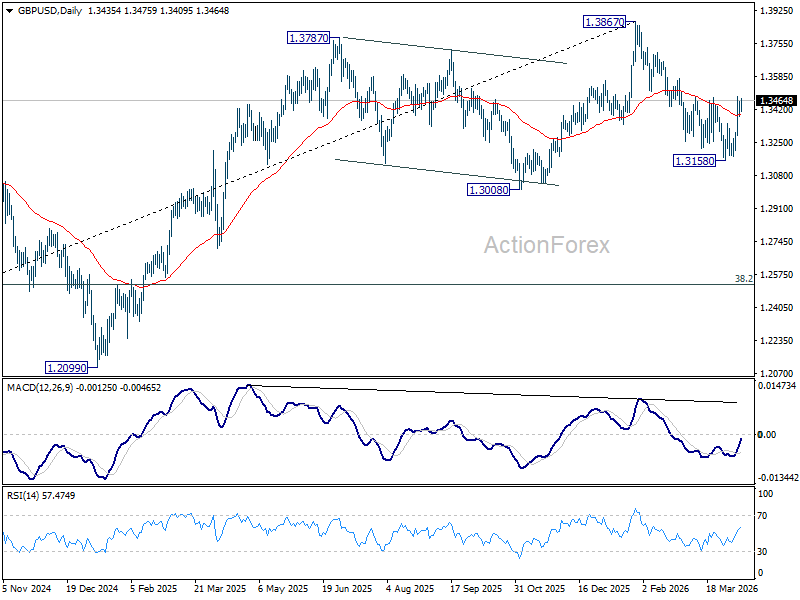
GBP/USD Mid-Day Outlook
Daily Pivots: (S1) 1.3392; (P) 1.3425; (R1) 1.3470; More...
Intraday bias in GBP/USD stays neutral and more consolidations could be seen below 1.3483 temporary top. Fall from 1.3867 could have completed as a correction at 1.3158 already. Above 1.3483 will target 61.8% retracement of 1.3867 to 1.3158 at 1.3596. Firm break there will bring retest of 1.3867 high. Nevertheless, sustained break of 55 4H EMA (now at 1.3337) will dampen this bullish view and bring retest of 1.3158 instead.
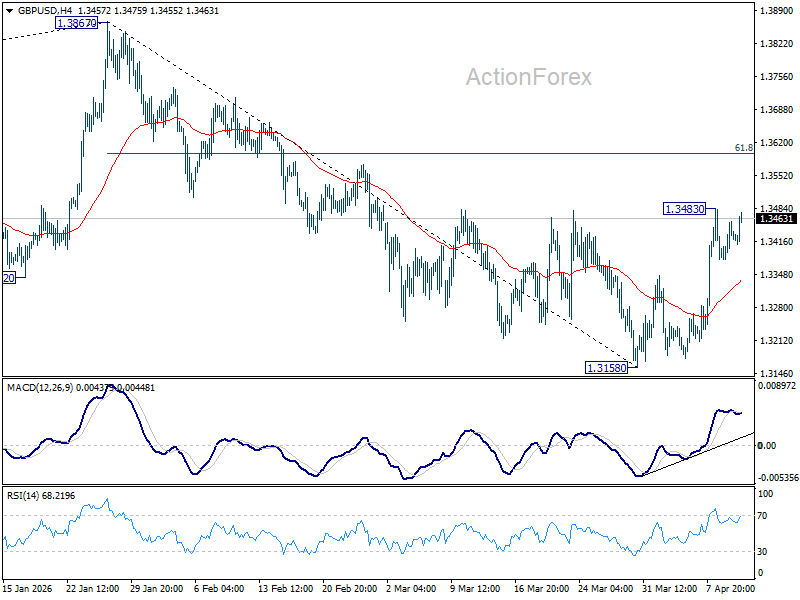
In the bigger picture, current development suggests that price actions from 1.3867 are merely a corrective pattern within the broader up trend from 1.0351 (2022 low). With 1.3008 support intact, medium term bullishness is maintained and break of 1.3867 is back in favor for a later stage, towards 1.4248 key resistance (2021 high).
US: Inflation Jumps to a Near Two-Year High in March
The Consumer Price Index (CPI) shot higher by 0.9% month-on-month (m/m) in March, meeting the Bloomberg consensus forecast. On a twelve-month basis, CPI jumped to a near two-year high of 3.3% (from 2.4% in February).
- A surge in energy costs accounted for more than three-quarters of the monthly gain in headline, led by a 21.2% m/m surge in gasoline prices. Food prices were flat on the month, as a pullback in grocery costs (-0.2% m/m) was offset by a similar gain in "food away from home".
Excluding food and energy, core inflation rose 0.2% m/m, a tick weaker than consensus, but matching February's gain. On a twelve-month basis, core prices were up 2.6% (from 2.5% in February).
Services inflation was up 0.2% m/m, following a gain of 0.3% m/m the month prior. Primary shelter costs heated up at touch, though this was offset by some cooling in non-housing services, which were up just 0.1% m/m – its slowest monthly gain since May 2025.
Core goods prices rose 0.1% m/m, as gains in apparel, recreational goods, household furnishings, and new vehicles were partially offset by a steep pullback in medical goods and another decline in used vehicle prices.
Key Implications
It goes without saying that higher energy prices were going to be a focal point of this morning's release – accounting for most of the gain in headline inflation. While core prices came in a bit softer than expected, it feels a bit backward looking as the surge in energy costs are likely to pressure prices for other goods and services higher in the months ahead. This will be happening alongside the continued passthrough of higher tariff costs, suggesting inflation's near-term direction of travel is likely to be higher.
With the labor market appearing to be on a firmer footing, the bar for further rate cuts is set higher. Policymakers can afford to remain patient and sit tight for the time being. Fed futures were largely unchanged following this morning's release and are currently pricing in just 8 basis points of rate cuts by year-end.
Canada’s Unemployment Rate Holds Steady Amid Weak Hiring
Canada’s economy added 14k jobs in March (+0.1% m/m), more-or-less in line consensus expectations for a 15k gain. Employment was essentially flat across job types, with full-time employment edging down slightly (-1k) while private-sector employment rose by 15k on the month.
The unemployment rate was unchanged at 6.7% after February’s increase. The labour force grew by 15k in March, while the participation rate was unchanged at 64.9%. Importantly, the layoff rate is in line with pre-pandemic values, while 15.2% of February's unemployed found work in March, in line with the rate in 2025 (14.7%), but below the 19.1% recorded in the same months in 2017-2019. The data suggest that the high unemployment rate is "mostly driven by slower hiring, rather than by increased layoffs."
Job gains were concentrated in “other services” (+15k) and natural resources (+10k), while finance, insurance, real estate, rental and leasing posted the largest decline (-11k).
Wage growth firmed further, with average hourly wages up 4.7% year-on-year (y/y) in March, accelerating from 3.9% in February. However, wages were lifted by the changing composition of the workforce. Holding the composition of employment fixed, average hourly wages were up 3.6% y/y, in line with January and February 2025.
Key Implications
The labour report came in as expected, showcasing the lack of dynamism in the Canadian labour market. The unemployment rate remains elevated, with the lack of hiring showcasing the general apprehension in the economy. With the economy continuing to progress in fits and starts, and uncertainty sky-high, the outlook is for subdued job growth and a steady unemployment rate.
The outlook remains fraught, with the energy shock beginning to be felt in the economy, and no clarity on the direction of the conflict. How long the conflict lasts and energy supplies remain disrupted, will determine the size of the inflation shock. For now, weak demand conditions should provide some offset to inflationary pass-through, allowing the Bank of Canada to stay on the sidelines and wait to see how things play out.
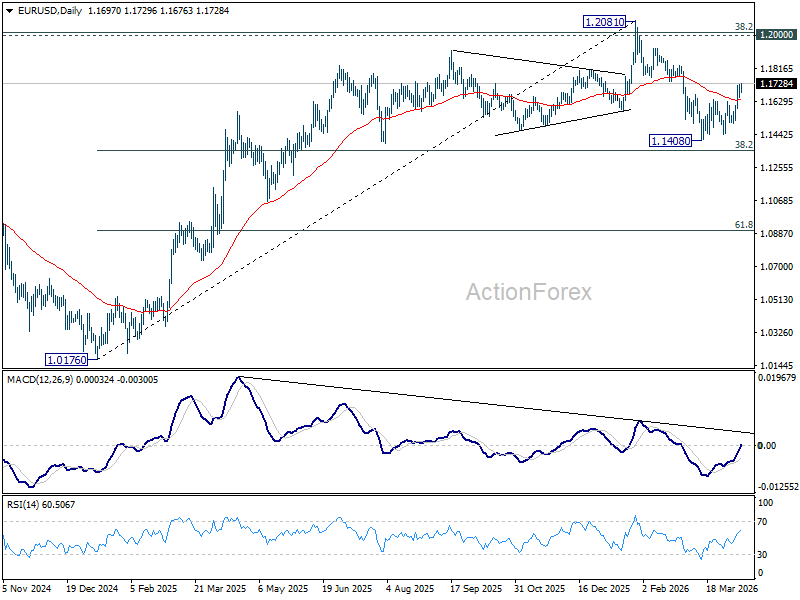
EUR/USD Mid-Day Outlook
Daily Pivots: (S1) 1.1658; (P) 1.1692; (R1) 1.1733; More….
Intraday bias in EUR/USD is back on the upside with break of 1.1720 temporary top. Rise from 1.1408 is resuming and should target 61.8% retracement of 1.2081 to 1.1408 at 1.1824. Decisive break there will pave the way to retest 1.2081 high. On the downside, below 1.1642 minor support will turn intraday bias neutral again first.
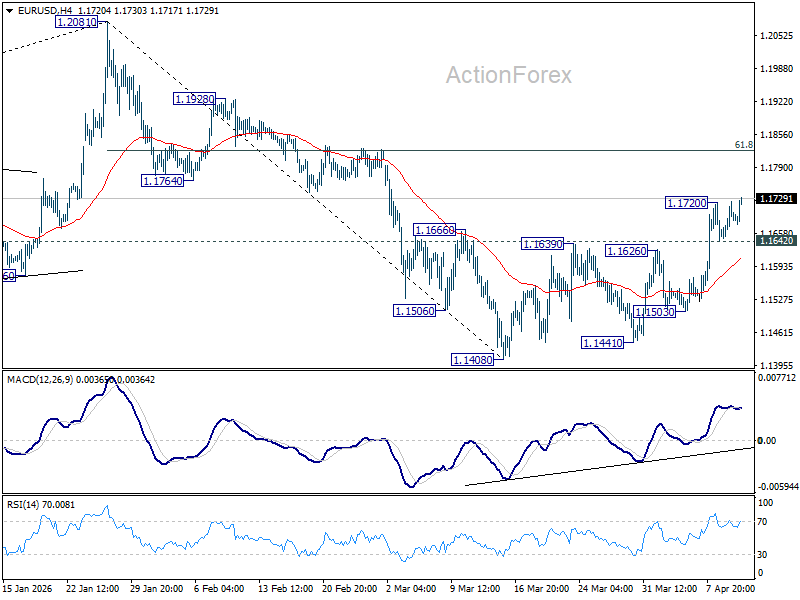
In the bigger picture, the strong support from 38.2% retracement of 1.0176 to 1.2081 at 1.1353 suggests that the pullback from 1.2081 is more likely a corrective move. Strong support was also found in 55 W EMA (now at 1.1505). Focus is back on 1.2 key cluster resistance level. Decisive break there will carry long term bullish implications. Nevertheless, break of 1.1408 support will revive the case of medium term bearish trend reversal.