Sample Category Title
USD/CHF Daily Outlook
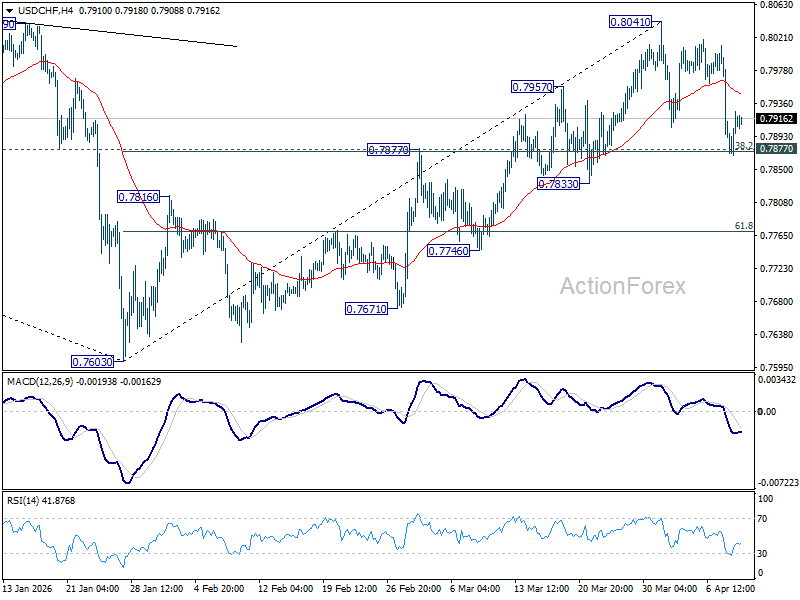
Daily Pivots: (S1) 0.7855; (P) 0.7927; (R1) 0.7985; More….
USD/CHF recovered after drawing support from 0.7877 cluster support (38.2% retracement of 0.7603 to 0.8041 at 0.7874). Intraday bias stays neutral first with price actions from 0.8041 seen as a consolidation pattern. With 0.7874/7 intact, rally from 0.7603 is expected to resume through 0.8041 later. However, decisive break of 0.7874/7 will argue that the rise has completed, and bring deeper fall to 61.8% retracement at 0.7770 and below.
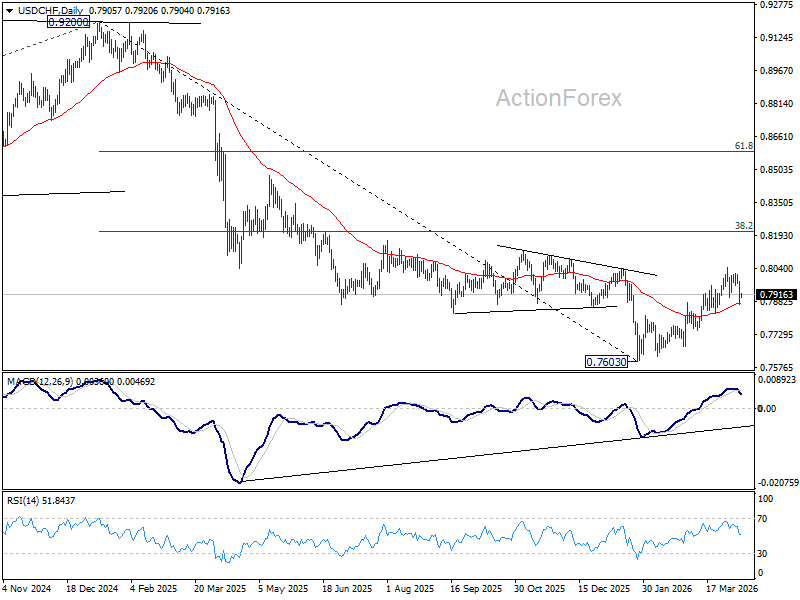
In the bigger picture, rebound from 0.7603 medium term bottom is seen as correcting the fall from 0.9200 only. rejection by 55 W EMA (now at 0.8081) will affirm this case, and setup down trend resumption to 100% projection of 1.0146 (2022 high) to 0.8332 from 0.9200 at 0.7382 at a later stage. Though, sustained break of 55 W EMA will suggest that it's probably correcting the larger scale down trend from 1.0146 (2022 high).
US 10-Year Yield “V” Shaped Rebound Signals Rejection of Iran Ceasefire Optimism
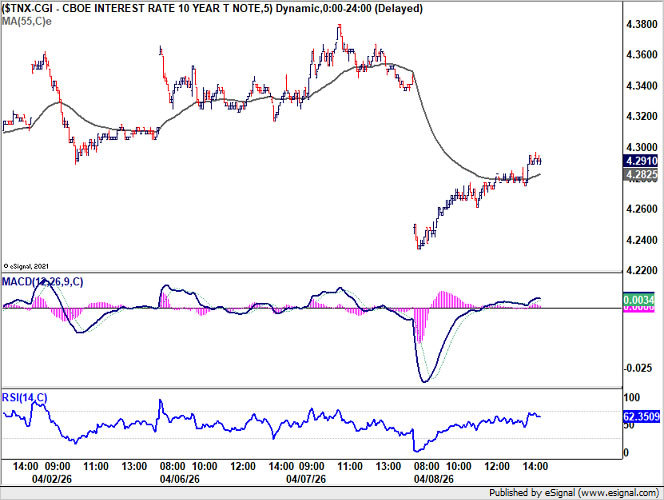
The market reaction to the two-week US-Iran ceasefire is already turning, with signs of rejection of ceasefire optimism emerging across key asset classes. What initially appeared as a decisive de-escalation could be reassessed as a fragile truce, not peace, with markets are pricing risk re-entry as early doubts take hold. The most telling signal lies in the rates market. The US 10-year yield "V-shaped" reversal—from an initial drop to 4.234 overnight, and then back to close 4.291—highlights a sharp shift in sentiment. It should be highlighted that 4.300 was nearly reclaimed.
This is not a stable repricing of lower risk, but a bond market rejecting the peace trade, with the yields rebound signals skepticism on de-escalation. This reversal carries broader implications. It suggests that the rates market are not pricing clean disinflation, as the initial assumption of easing energy pressures is being questioned.
Oil markets reinforce this narrative. Brent’s recovery from near $93 back to around $100 suggests that the war premium is creeping back. FX markets are adjusting in tandem. Dollar is stabilizing and recovering mildly, paring ceasefire-driven losses as euphoria fading. The move reflects a broader shift from optimism to caution.
What’s driving this rapid reversal is not just market positioning, but developments on the ground. The ceasefire is already facing compliance issues, with doubts emerging within the first 24 hours.
Iran’s Parliament Speaker Mohammad Bagher Ghalibaf accused the US of violating multiple clauses. At the center of the dispute is the "Lebanon Gap" as key fault line. While Iran and mediators claim the ceasefire should cover the Israel-Hezbollah front, Washington has rejected that interpretation, with strikes in Beirut continuing. This divergence is not a minor detail—it is a structural flaw in the agreement.
At the same time, the Strait of Hormuz remains a critical uncertainty. Despite reopening headlines, Hormuz still contested despite reopening claims, with Iranian naval threats requiring transit “permission” keeping shipping conditions fragile.
Taken together, these developments explain why negotiations risk collapsing before they begin. Institutional investors could already be pricing in a higher probability that upcoming talks will fail to produce a durable agreement.
Looking ahead, the Islamabad talks is next binary catalyst. A high-level US delegation led by Vice President JD Vance is expected to begin formal talks in Islamabad on Friday to attempt to solidify the "two-week pause" into something more durable. However, If the US insists on "complete denuclearization" and Iran insists on "lifting all sanctions" as prerequisites for a permanent deal, the ceasefire is merely a 14-day clock ticking toward a larger escalation.
In parallel, data like those from MarineTraffic over the next 12 hours will be the ultimate "truth-teller" regarding whether the Strait of Hormuz is actually open for commercial transit or if insurance premiums will remain at prohibitive, war-time levels. Until then, ceasefire is a 14-day clock, not a resolution, and markets are shifting from optimism to conditional skepticism.
In the currency markets, Dollar is the worst performer so far this week, followed by Yen and Loonie. Kiwi leads gains, with Aussie and Sterling also firm, while Euro and Swiss Franc trade in the middle of the pack.
In Asia, at the time of writing, Nikkei is down -0.65%. Hong Kong HSI is down -0.25%. China Shanghai SSE is down -0.73%. Singapore Strait Times is down -0.24%. Japan 10-year JGB yield is up 0.026 at 2.398. Overnight, DOW rose 2.85%. S&P 500 rose 2.51%. NASDAQ rose 2.80%. 10-year yield fell -0.052 to 4.291.
Fed Minutes: Rates Near Neutral, Cuts Still Seen but No Longer a Given
Federal Reserve minutes delivered a clear message: rate cuts are no longer on autopilot. With policy now near neutral, officials signaled that further easing will depend on a sustained decline in inflation—not just expectations. At the same time, Middle East tensions and oil price risks have created a rare two-sided policy dilemma, where both rate cuts and hikes remain possible. Read More.
RBNZ’s Breman: Ready to Act Decisively with Rate Hikes if Inflation Jumps
RBNZ Governor Anna Breman delivered a clear hawkish signal: if inflation starts rising again, the central bank is ready to act decisively with rate hikes. With risks now tilted to the upside, easing is off the table as policymakers focus on preventing a renewed inflation surge. Geopolitical tensions and supply disruptions are adding uncertainty, but the policy bias is clear—RBNZ is prepared to tighten again if price pressures build. Read More.
USD/CHF Daily Outlook
Daily Pivots: (S1) 0.7855; (P) 0.7927; (R1) 0.7985; More….
USD/CHF recovered after drawing support from 0.7877 cluster support (38.2% retracement of 0.7603 to 0.8041 at 0.7874). Intraday bias stays neutral first with price actions from 0.8041 seen as a consolidation pattern. With 0.7874/7 intact, rally from 0.7603 is expected to resume through 0.8041 later. However, decisive break of 0.7874/7 will argue that the rise has completed, and bring deeper fall to 61.8% retracement at 0.7770 and below.
In the bigger picture, rebound from 0.7603 medium term bottom is seen as correcting the fall from 0.9200 only. rejection by 55 W EMA (now at 0.8081) will affirm this case, and setup down trend resumption to 100% projection of 1.0146 (2022 high) to 0.8332 from 0.9200 at 0.7382 at a later stage. Though, sustained break of 55 W EMA will suggest that it's probably correcting the larger scale down trend from 1.0146 (2022 high).
GBP/USD Picks Up Pace, Is a Breakout Now Imminent?
Key Highlights
- GBP/USD started a fresh surge above 1.3350 and 1.3440.
- It cleared a key bearish trend line with resistance at 1.3280 on the 4-hour chart.
- EUR/USD also climbed higher above the 1.1650 resistance.
- WTI Crude Oil prices trimmed most gains and traded below $95.
GBP/USD Technical Analysis
The British Pound found support at 1.3150 and started a fresh increase against the US Dollar. GBP/USD gained pace for a move above 1.3250 and 1.3350.
Looking at the 4-hour chart, the pair cleared a key bearish trend line with resistance at 1.3280 to enter a positive zone. The pair settled well above 1.3400, the 100 simple moving average (red, 4-hour), and the 200 simple moving average (green, 4-hour).
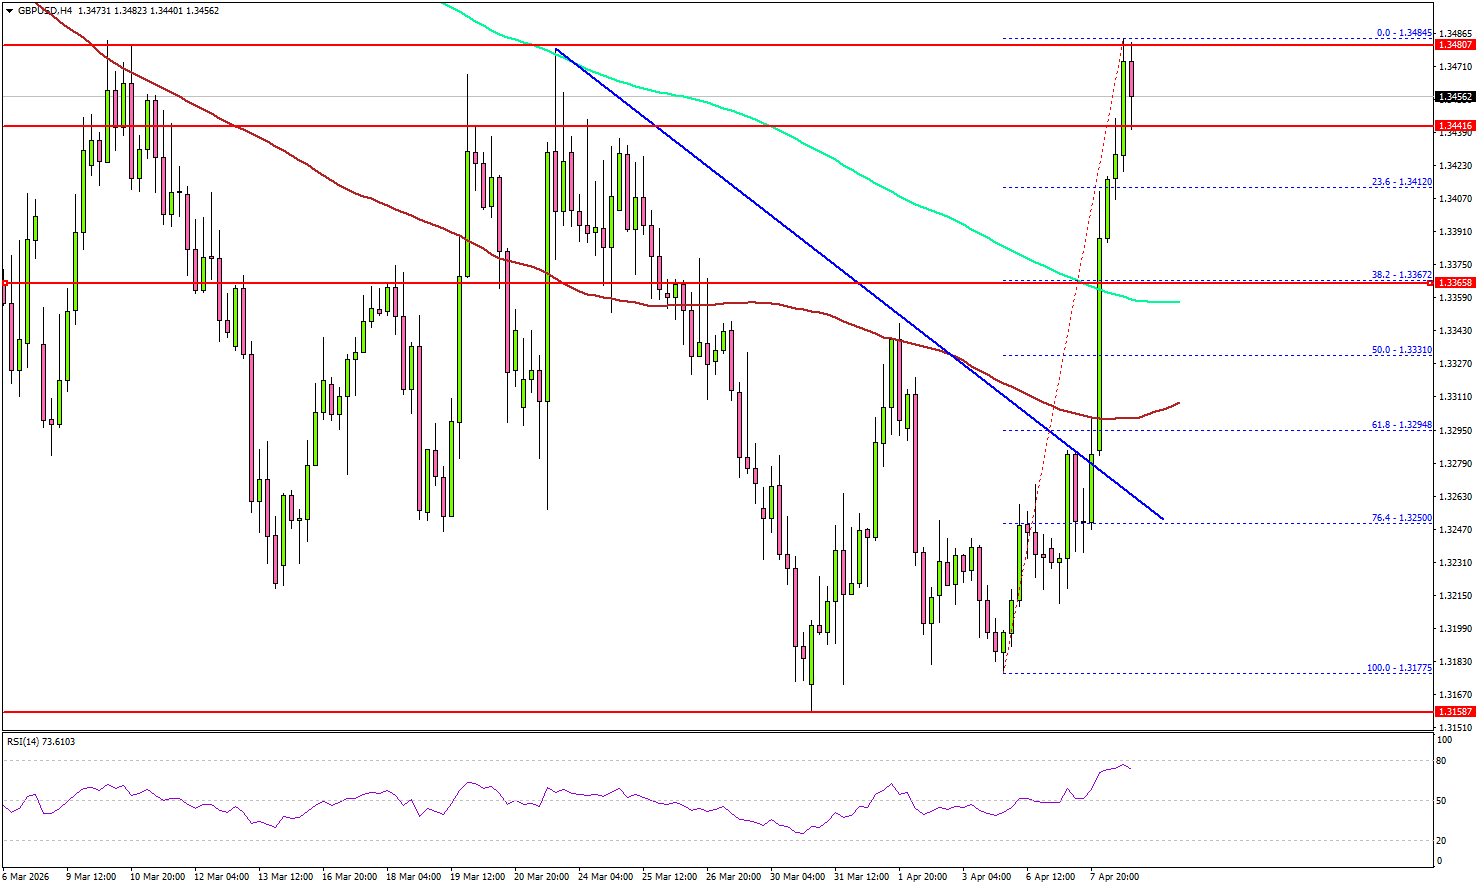
The pair tested the 1.3485 resistance and started a consolidation phase. Immediate support is seen near 1.3410 and the 23.6% Fib retracement level of the upward move from the 1.3177 swing low to the 1.3485 high.
The first key support sits at 1.3365. The next key area of interest might be near 1.3300 or the 61.8% Fib retracement level of the upward move from the 1.3177 swing low to the 1.3485 high.
A close below 1.3300 might call for heavy losses. In the stated case, it could even revisit 1.3220. On the upside, the pair could face resistance near the 1.3500 zone. The first major resistance sits at 1.3550. The main resistance could be 1.3620. A close above 1.3620 could open the doors for gains above 1.3650. In the stated case, the bulls could aim for a move to 1.3750.
Looking at Oil, the price started a fresh decline amid peace talks, and the bears were able to push the price below $95.
Upcoming Key Economic Events:
- US Initial Jobless Claims - Forecast 210K, versus 202K previous.
- US Gross Domestic Product for Q4 2025 – Forecast 0.7% versus previous 0.7%.
RBNZ’s Breman: Ready to Act Decisively with Rate Hikes if Inflation Jumps
RBNZ Governor Anna Breman delivered a clear warning that inflation risks are shifting to the upside, reinforcing a tightening bias despite a softer growth outlook. Speaking to Bloomberg TV, Breman said “the balance of risks have shifted in terms of inflation,” signaling growing concern that price pressures could re-accelerate.
More importantly, Breman left little ambiguity about the policy response. She stressed that if medium-term inflation begins to rise, “we will act decisively and that means rate hikes.” This marks a firm signal that the RBNZ is prepared to tighten again if needed, rather than tolerate a renewed inflation cycle.
Geopolitical uncertainty remains a key wildcard. Breman highlighted supply-side disruptions stemming from the conflict, noting that both the duration and scale of the impact remain unclear. This uncertainty is keeping the RBNZ in a data-dependent stance, but with a clear bias: inflation risks are rising, and policy will lean restrictive if those risks materialize.
Fed Minutes: Rates Near Neutral, Cuts Still Seen but No Longer a Given
The clearest signal from the March FOMC minutes is that policymakers collectively shifted away from any presumption of continued easing. With rates now judged to be “within a range of plausible estimates of its neutral level” following last year’s 75bps cuts, the bar for further policy easing has been materially raised.
The decision to hold at 3.50–3.75% was nearly unanimous, with only Stephen Miran dissenting in favor of a 25bps cut. The dominant driver behind the pause was “elevated” uncertainty tied to the Middle East conflict. Officials acknowledged that while economic activity remained solid, the external shock had introduced a level of unpredictability that warranted patience rather than pre-emptive action.
Crucially, the characterization of policy as near neutral marks a structural shift in the Fed’s reaction function. Earlier in the cycle, rate cuts were seen as necessary to avoid overtightening. That logic has now changed. With policy no longer clearly restrictive, easing is no longer automatic—it must be justified by incoming data. As the minutes suggest, any additional cuts would likely require inflation to “decline in line with their expectations.”
That conditionality is reinforced by a subtle but important shift in timing expectations. While many participants still anticipate that it “would likely become appropriate to lower” rates over time, “a couple” explicitly pushed back the expected timing of cuts due to recent inflation readings. This reflects growing discomfort with easing too early while price pressures remain sticky.
At the same time, the Fed is grappling with unusually pronounced two-sided risks. On one side, policymakers warned that a prolonged Middle East conflict could weaken labor markets, noting that higher oil prices may “reduce households’ purchasing power, tighten financial conditions, and reduce growth abroad,” potentially justifying rate cuts. On the other, “many participants” flagged the risk that persistent energy-driven inflation could “call for rate increases” to keep expectations anchored.
The result is a policy stance defined by balance rather than bias. As the minutes emphasized, policy is “not on a preset course” and will be determined “meeting by meeting.” This reinforces a reactive framework where both cuts and hikes remain on the table, depending on how inflation and growth evolve.
FOMC Members Highlight Inflation Risks in March
The Federal Reserve Open Market Committee (FOMC) held the federal funds rate at a target range of 3.50% to 3.75% in March.
The minutes showed that the committee is still concerned about inflation remaining above 2%. Some noted that "progress in reducing inflation had been absent in recent months" and that "the rate of increase in core goods prices remained well above the pace likely to be consistent with the sustainable achievement of the Committee's inflation objective". However, the expectation remains that inflation would gradually reach the "2 percent objective after the effect of increased tariffs and higher oil prices had faded." A prolonged conflict in the Middle East was cited as an upside risk where higher energy prices could raise input costs and these "would be more likely to pass through to core inflation." Partly due to the risks to the outlook, "the vast majority or participants" noted that progress to the inflation target "could be slower than previously expected" and that the risk of inflation staying above the target had increased.
With respect to the labor market, participants judged it to be roughly balanced. The rate of job creation was expected to stay in line with slower labor force growth, leaving the unemployment rate relatively unchanged. However, the risks to the labor market were judged to be skewed to the downside, with low net job creation, higher unemployment among prime age workers, and the concentration of job gains in the health-care sector being cited as reasons. "Many participants" also cited "business contacts and surveys suggesting that firms were likely to delay or reduce hiring in anticipation of AI adoption".
Importantly, "[m]any participants judged that, in time, it would likely become appropriate to lower the target range for the federal funds rate if inflation were to decline," as expected. However, the minutes noted that, "[s]ome participants judged that there was a strong case for a two-sided description" of future interest rate decisions, to better reflect that "upward adjustments to the target range" might be necessary if inflation were to stay above the target range. The minutes emphasized that policy decisions would be made on a "meeting-by-meeting" basis.
The risks to the outlook remained high and "the vast majority of participants judged that upside risks to inflation and downside risks to employment were elevated" and that they "had increased with developments in the Middle East".
Key Implications
Unsurprisingly, the risks around the inflation outlook were pronounced in the weeks after the onset of the conflict in the Middle East. The duration of the conflict is a key factor for inflation going forward and the participants reaffirmed that they would be making decisions on a meeting-by-meeting basis.
Despite today's news of a ceasefire, energy prices remain elevated, while the course of the conflict and any future disruptions remain highly uncertain. The inflation shock has started and will gradually disseminate through the economy. Nonetheless, our baseline view is that as the shock gradually fades, so too will inflation pressures. This may open the door for the Fed to normalize rates in the latter half of the year.
(FED) Minutes of the Federal Open Market Committee
March 17–18, 2026
A joint meeting of the Federal Open Market Committee and the Board of Governors of the Federal Reserve System was held in the offices of the Board of Governors on Tuesday, March 17, 2026, at 10:30 a.m. and continued on Wednesday, March 18, 2026, at 9:00 a.m.1
Developments in Financial Markets and Open Market Operations
The manager turned first to an overview of broad market developments during the intermeeting period. Earlier in the period, concerns about artificial intelligence (AI) disruptions to certain business models led to declines in policy rate expectations and interest rates and weighed on equity prices. The conflict in the Middle East—which started later in the period—resulted in sharp increases in energy prices, raised questions about the macroeconomic outlook, and caused a notable repricing in several asset classes. Respondents to the Open Market Desk Survey of Market Expectations (Desk survey) viewed the U.S. macroeconomic outlook as little changed, apart from an increase in near-term inflation projections; the manager noted, however, that survey responses came in the early days of the conflict.
The manager observed that front-month futures prices for crude oil increased about 50 percent over the period. The significantly smaller rise of the longer-dated futures prices compared with the front-end futures, however, could have indicated expectations that most of the recent increase in oil prices will be relatively short lived. Other market prices were consistent with this interpretation. For example, the one-year inflation swap rate rose nearly 50 basis points over the period, but forward measures of inflation compensation at horizons beyond one year were little changed.
The manager then turned to policy rate expectations. The near-term federal funds rate path implied by futures prices shifted higher, on net, over the period, with a rate cut not fully priced in until December. The modal path based on options prices also shifted higher and was consistent with no rate change this year, compared with one 25 basis point cut previously. The distribution of federal funds rate outcomes early next year implied by options prices shifted notably to higher values and became more dispersed; as a result, the probability of rate hikes through that period increased to about 30 percent. By contrast, the median of the modal paths reported in the Desk survey continued to show two 25 basis point rate cuts this year, although survey respondents pushed out the timing of those cuts slightly compared with their previous expectations. The manager noted, however, that market intelligence suggested that some survey respondents appeared to have shifted their expectations in the direction of fewer rate cuts in the days after the survey was conducted.
Treasury yields ended the intermeeting period higher, on net, more so at the short end. Changes in term premiums appeared to account for a substantial fraction of the changes in yields, likely reflecting factors such as the greater general uncertainty induced by the conflict in the Middle East and shifts in investor positioning. Treasury market liquidity diminished a bit over the period, in line with the increase in yield volatility, but the Treasury market continued to function well.
Broad equity prices fell about 5 percent over the period. The software sector underperformed the broader market again over the intermeeting period, as AI-related concerns weighed especially heavily on the sector. The same concerns were also evident in segments of the credit market. Leveraged loan prices for software firms declined sharply over the period, whereas prices in other sectors were more stable. There were also notable increases in redemption requests at several private credit funds that offer investors limited liquidity through quarterly redemption opportunities. The manager noted that the staff will continue to monitor the situation closely.
The manager then discussed international developments. Foreign equities outperformed U.S. equities in 2025 and in early 2026, but their prices had declined more than those of U.S. equities since the start of the conflict in the Middle East. The exchange value of the dollar had experienced sharp swings over the previous several weeks but was roughly unchanged, on net, year to date. Sentiment toward the dollar appeared to have become more positive in the last several days of the intermeeting period, buoyed by the dollar's traditional safe-haven status and the U.S.'s position as a net energy exporter. With elevated energy prices causing global inflationary pressures, several central banks previously expected by market participants to either remain on hold or ease policy further—including the European Central Bank, the Bank of Canada, and the Swiss National Bank—were now expected to hike rates modestly this year.
The manager observed that money market conditions had remained broadly stable amid ongoing reserve management purchases (RMPs). Over the intermeeting period, the effective federal funds rate remained unchanged at 1 basis point below the interest on reserve balances (IORB) rate, and rates on repurchase agreements (repo) remained generally near the IORB rate. Overnight reverse repo operations saw minimal usage except at month-ends, and standing repo operations were used on only a couple of days, which were days with relatively high volumes of Treasury securities settlements. On one of those days, standing repo usage reached $30 billion, the third-largest volume since the inception of the standing operations. The manager saw this development, together with interdealer repo rates being not much above the standing repo rate that day, as suggesting a greater willingness of at least some counterparties to use the operations when economically sensible following the changes to standing repo operations implemented in December. The manager assessed that money market conditions as well as various indicators of reserve conditions were consistent with reserves remaining within the ample range.
Finally, the manager discussed the expected trajectory of key components of the Federal Reserve's balance sheet. System Open Market Account (SOMA) holdings were expected to continue to grow with RMPs. In April, tax payments were expected to cause wide swings in the Treasury General Account and reserves. Reserves were expected to hit their trough in late April, at which point they would be about equal to the level that had prevailed at the end of last year. After April, reserves were projected to average about $3 trillion through September. The manager noted that, after April, the monthly pace of RMPs was likely to be reduced significantly as swings in nonreserve liabilities were expected to moderate; the adjustment was likely to be somewhat gradual.
By unanimous vote, the Committee ratified the Desk's domestic transactions over the intermeeting period. There were no intervention operations in foreign currencies for the System's account during the intermeeting period.
Staff Review of the Economic Situation
The information available at the time of the meeting indicated that real gross domestic product (GDP) continued to expand at a solid pace, particularly after accounting for the effects of the federal government shutdown in the fourth quarter of last year. The unemployment rate was little changed in recent months, though job gains continued to be low. Consumer price inflation remained elevated.
Total consumer price inflation—as measured by the 12-month change in the personal consumption expenditures (PCE) price index—was 2.8 percent in January. Core PCE price inflation, which excludes changes in consumer energy prices and many consumer food prices, was 3.1 percent in January. Both total and core inflation measures were about 1/4 percentage point higher than their levels a year earlier. Core goods price inflation had picked up over that period, a development that the staff largely attributed to the effects of higher tariffs. Core services price inflation had declined relative to a year earlier, led by a slowing in housing services price inflation, while core nonhousing services price inflation was little changed. Based on data from the consumer price index and the producer price index, the staff estimated that total PCE price inflation was 2.8 percent in February, while core PCE price inflation was 3.0 percent.
The unemployment rate was 4.4 percent in February, the same as its level in September of 2025. The average monthly change in total payroll employment was low over January and February. The effects of a strike in the health-care sector and unusually harsh winter weather weighed on payrolls in February, but those effects were expected to unwind in March. The employment cost index increased 3.4 percent over the 12 months ending in December, and average hourly earnings rose 3.8 percent over the 12 months ending in February; both measures were slightly below their year-earlier levels.
Real GDP growth was solid last year, although it was held down in the fourth quarter by the effects of the federal government shutdown. Available indicators suggested that real GDP growth had picked up in the first quarter of this year, partially boosted by the unwinding of the effects of the government shutdown. Real private domestic final purchases (PDFP)—which comprises PCE and private fixed investment and which often provides a better signal of underlying economic momentum than does GDP—rose at a faster pace than real GDP last year. Available indicators suggested that real PDFP growth in the first quarter had stepped up from its pace last year. Incoming data indicated that real goods exports rose sharply at the start of the year after having fallen in the fourth quarter. After surging in November and December, real goods imports remained about flat in January, as continued strong imports of high-tech goods were offset by declines in imports of consumer goods.
Economic activity abroad continued to expand at a moderate pace in the fourth quarter, largely supported by strong high-tech exports from Mexico and several Asian economies. By contrast, real GDP grew only modestly in the euro area and in the U.K., and it contracted in Canada. Recent data pointed to foreign GDP having continued to expand at a moderate pace so far this year.
Foreign headline inflation generally remained near central banks' targets, despite still-elevated services price inflation in some economies. Some measures of near-term inflation expectations increased, as energy and other commodity prices surged with the Middle East conflict. Over the intermeeting period, most foreign central banks kept their policies on hold, although the Reserve Bank of Australia raised its policy rate 25 basis points in March, citing inflationary pressures stemming from tight resource utilization.
Staff Review of the Financial Situation
Over the intermeeting period, the market-implied expected path of the federal funds rate moved higher, largely reflecting a shift in the anticipated timing of easing toward the end of this year. The two-year nominal Treasury yield increased, on net, primarily driven by higher inflation compensation, consistent with rising near-term inflation concerns tied to surging energy prices following developments in the Middle East. By contrast, the 10-year nominal Treasury yield was little changed on net.
Broad equity price indexes declined and the one-month option-implied volatility on the S&P 500 index increased notably, as concerns about Middle East developments appeared to weaken investor confidence. Stocks of firms in sectors exposed to potential disruptions caused by AI, such as software, declined more notably.
In advanced foreign economies, the surge in energy prices led to notable increases in measures of short-term inflation compensation and sovereign bond yields. The broad dollar index increased moderately, as both a deterioration in market risk sentiment and the status of the U.S. as a net energy exporter supported the dollar. Foreign equity prices decreased modestly, on net, but were volatile. Sovereign credit spreads widened in many emerging market economies, especially in those economies most reliant on energy imports.
Conditions in U.S. short-term funding markets remained orderly over the intermeeting period. The effective federal funds rate was unchanged, and average spreads in both secured and unsecured funding markets were generally stable. Ongoing RMPs appeared to help support stable money market conditions and to damp upward pressure on repo rates.
In domestic credit markets, financing conditions remained somewhat restrictive for households and small businesses while remaining neutral for medium-sized businesses and municipalities. Conditions remained somewhat restrictive for commercial real estate (CRE) because of a combination of high financing costs and relatively tight underwriting requirements. Although borrowing costs continued to be elevated relative to their average levels since the Global Financial Crisis (GFC), credit flows to medium-sized and large businesses were strong, and corporate debt spreads remained narrow by historical standards. However, firms judged to have significant exposure to AI disruption saw sharp increases in their borrowing costs.
Credit continued to be generally available to most businesses, households, and municipalities. By contrast, credit to households with lower credit scores and to small businesses remained somewhat tight. In the residential mortgage market, the volume of mortgage refinancing increased, but home-purchase borrowing remained subdued. Credit remained readily available for qualified borrowers who met standard conforming loan criteria.
The credit performance of corporate bonds remained solid for both investment- and speculative-grade firms and was supported by robust profits at large corporations. The 12-month trailing default rate declined to around the 25th percentile of its post-GFC range. Market-implied measures of year-ahead expected defaults were little changed and were near the median of their historical distributions. Likewise, the credit performance of leveraged loans was little changed. Overall delinquency rates for small businesses, CRE, mortgages insured by the Federal Housing Administration, and consumer loans remained elevated. In addition, investor concerns about private credit appeared to be increasing because of the sector's high exposure to software-related business loans that were vulnerable to AI disruption.
Staff Economic Outlook
The staff projection of economic activity was not as strong as the one prepared for the January meeting, primarily reflecting incoming data and less expected support from financial conditions. The staff had built in only a small effect on economic activity of the lower equity prices and higher crude oil prices associated with reactions to developments in the Middle East. All told, real GDP growth was expected to run about in line with potential growth through 2028. As a result, the unemployment rate was expected to remain near its current level through most of next year and then to edge down to the staff's estimate of the longer-run natural rate of unemployment.
The staff's inflation forecast for this year was slightly higher, on balance, than the one prepared for the January meeting, primarily reflecting incoming data and an expected boost to consumer energy prices given the recent run-up in crude oil prices. With the effects of higher crude oil prices and tariffs on inflation expected to wane later this year, inflation was projected to return to its previous disinflationary trend and to be close to 2 percent by the end of next year.
The staff continued to view the uncertainty around the forecast as elevated considering the potential economic effects of developments in the Middle East, government policy changes, and the adoption of AI. Risks to the forecasts of employment and real GDP growth were seen as tilted to the downside. Risks to the inflation projection were viewed as a little more skewed to the upside than at the time of the January meeting. With inflation having remained above 2 percent since early 2021, along with the potential effects of Middle East developments, a salient risk was that inflation could prove to be more persistent than the staff anticipated.
Participants' Views on Current Conditions and the Economic Outlook
In conjunction with this FOMC meeting, participants submitted their projections of the most likely outcomes for real GDP growth, the unemployment rate, and inflation for each year from 2026 through 2028 and over the longer run. The projections were based on participants' individual assessments of appropriate monetary policy, including their projections of the federal funds rate. Participants also provided their individual assessments of the level of uncertainty and the balance of risks associated with their projections. The Summary of Economic Projections was released to the public following the conclusion of the meeting.
Participants generally observed that overall inflation remained above the Committee's 2 percent longer-run goal. Some participants remarked that further progress in reducing inflation had been absent in recent months. Some participants noted that the rate of increase in core goods prices remained well above the pace likely to be consistent with the sustainable achievement of the Committee's inflation objective, at least in part reflecting the effects of tariffs. In addition, some participants commented that, although price increases in the housing services category had slowed considerably over the past year and were now close to their pre-pandemic pace, increases in nonhousing core services prices had continued to be elevated relative to their pre-pandemic pace.
Several participants noted that most measures of longer-term inflation expectations remained consistent with the Committee's 2 percent objective. Several participants observed, however, that measures of near-term inflation expectations had risen in recent weeks, reflecting the substantial rise in oil prices caused by events in the Middle East.
Participants anticipated that, under appropriate monetary policy, inflation would gradually move down toward the Committee's 2 percent objective after the effect of increased tariffs and higher oil prices had faded. Participants generally expected that the effects of tariffs on core goods prices would diminish this year, though they assessed that the pace and timing at which these effects would fade had become more uncertain since the time of the January meeting. Participants also expected that higher oil prices would increase inflation in the near term and delay the anticipated decline in inflation toward the Committee's 2 percent objective. Several participants remarked that the ongoing deceleration in housing services prices was likely to continue to exert downward pressure on overall inflation. Several participants also expected higher productivity growth, associated with technological or deregulatory developments, to put downward pressure on inflation. Participants noted that a prolonged conflict in the Middle East would likely lead to more persistent increases in energy prices and that these higher input costs would be more likely to pass through to core inflation. Some participants highlighted the possibility that, after several years of above-target inflation, longer-term inflation expectations could become more sensitive to energy price increases. Partly as a result of these factors, the vast majority of participants noted that progress toward the Committee's 2 percent objective could be slower than previously expected and judged that the risk of inflation running persistently above the Committee's objective had increased.
With regard to the labor market, participants observed that the unemployment rate had been little changed in recent months, while job gains had remained low. Most participants judged that the recent data readings, such as those for job openings, layoffs, hiring, and nominal wage growth, continued to suggest that the labor market was broadly in balance, with the low rate of job growth roughly in line with slower labor force growth. Some of these participants commented that the February payroll employment data were held down by a strike in the health-care sector and by the effects of unusually harsh winter weather. Several other participants, however, highlighted signs of potential softening in the labor market, including a slight increase in the unemployment rate among prime-age workers, the concentration of job growth in the health-care sector—excluding the effects of the February strike—and in a few other sectors, and survey measures of job availability that had declined in recent months. Some participants noted that business survey responses or their business contacts continued to express caution in hiring decisions amid uncertainty about the near-term economic outlook and concern about the longer-term effects of AI and other technologies on the labor market.
With respect to the outlook for the labor market, the majority of participants expected the unemployment rate to remain little changed and for net job creation and labor force growth to remain low, while a couple of participants expected labor market conditions to soften. The vast majority of participants judged that risks to the employment side of the mandate were skewed to the downside. In particular, many participants cautioned that, in the current situation of low rates of net job creation, labor market conditions appeared vulnerable to adverse shocks. They pointed to the possibility that a further fall in labor demand could push the unemployment rate sharply higher in a low-hiring environment or that the concentration of job gains in a few less cyclically sensitive sectors was potentially signaling heightened vulnerability in the overall labor market. Many participants cited evidence from business contacts and surveys suggesting that firms were likely to delay or reduce hiring in anticipation of AI adoption, although a few noted that instances of AI-related layoffs remained rare or that firms generally reported using AI to augment, rather than replace, workers. Most participants highlighted the risk that a protracted conflict in the Middle East could weigh on business sentiment and further reduce hiring.
Participants observed that economic activity appeared to be expanding at a solid pace. Participants generally noted that consumer spending had been resilient, importantly supported by gains in household wealth. Participants observed that business fixed investment remained robust, largely reflecting strength in the technology sector. With respect to the agricultural sector, a couple of participants remarked that farmers were experiencing strains due to higher fuel and fertilizer prices associated with the conflict in the Middle East.
Participants generally anticipated that the pace of real GDP growth would remain solid in 2026. Most participants expected growth to be supported by AI-related investment, continued favorable financial conditions, fiscal policy, or changes in regulatory policy. Most participants cautioned that the recent developments in the Middle East had raised the uncertainty surrounding their outlook for economic activity and had increased the associated downside risks.
In their consideration of monetary policy at this meeting, participants noted that inflation remained above the Committee's 2 percent objective and that available indicators suggested that economic activity had been expanding at a solid pace. They observed that job gains had remained low and that the unemployment rate had been little changed in recent months. Participants agreed that uncertainty about the economic outlook remained elevated and that the conflict in the Middle East was an additional source of uncertainty. Against this backdrop, almost all participants supported maintaining the current target range for the federal funds rate at this meeting. With the policy rate having been lowered 75 basis points in the second half of last year, these participants generally viewed the policy rate as within a range of plausible estimates of its neutral level. They judged that leaving the policy rate unchanged kept the Committee well positioned to determine the extent and timing of additional adjustments to the policy rate based on the incoming data, the evolving outlook, and the balance of risks. Most participants commented that it was too early to know how developments in the Middle East would affect the U.S. economy and judged it prudent to continue to monitor the situation and assess the implications for the appropriate stance of monetary policy. One participant preferred to lower the target range for the federal funds rate 25 basis points, expressing the concern that the current stance of policy remained restrictive and was contributing to weak labor demand and elevated downside risks to the labor market.
With regard to the outlook for monetary policy, in light of the heightened degree of economic uncertainty, participants emphasized the importance of being nimble in adjusting the stance of policy in response to incoming data, the evolving outlook, and the balance of risks. Many participants judged that, in time, it would likely become appropriate to lower the target range for the federal funds rate if inflation were to decline in line with their expectations. A couple of these participants highlighted that, in their projection for the appropriate path of the policy rate, they had pushed their assessment of the most likely timing of rate cuts further into the future in light of recent readings on inflation. Some participants judged that there was a strong case for a two-sided description of the Committee's future interest rate decisions in the postmeeting statement, reflecting the possibility that upward adjustments to the target range for the federal funds rate could be appropriate if inflation were to remain at above-target levels. All participants agreed that monetary policy was not on a preset course and would be determined on a meeting-by-meeting basis.
In discussing risk-management considerations that could bear on the outlook for monetary policy, the vast majority of participants judged that upside risks to inflation and downside risks to employment were elevated, and the majority of participants noted that these risks had increased with developments in the Middle East. In particular, most participants raised the concern that a protracted conflict in the Middle East could lead to a further softening in labor market conditions, which could warrant additional rate cuts, as substantially higher oil prices could reduce households' purchasing power, tighten financial conditions, and reduce growth abroad. Many participants pointed to the risk of inflation remaining elevated for longer than expected amid a persistent increase in oil prices, which could call for rate increases to help bring inflation down to the Committee's 2 percent objective and keep longer-term inflation expectations firmly anchored. Most participants reiterated, however, that it was too early to know how developments in the Middle East would affect the U.S. economy and judged it prudent to continue to monitor the situation and assess the implications for the appropriate stance of monetary policy. With upside risks to inflation and downside risks to employment both elevated, some participants remarked that it was important that the Committee follow its balanced approach in promoting the Federal Reserve's employment and inflation goals, taking into account the extent of departures from those goals and the potentially different time horizons over which employment and inflation were projected to return to levels judged consistent with the Committee's mandate.
Several participants discussed issues related to the Federal Reserve's balance sheet and monetary policy implementation, including the relationship between bank liquidity regulations and the demand for reserves. A couple of these participants also commented on the role of standing repo operations in the implementation of monetary policy and supported further study of centrally clearing these operations in light of the evolving structure of money markets.
Committee Policy Actions
In their discussions of monetary policy for this meeting, members agreed that available indicators suggested that economic activity had been expanding at a solid pace. They noted that job gains had remained low and the unemployment rate had been little changed in recent months. Members agreed that inflation remained somewhat elevated.
Members acknowledged that uncertainty about the economic outlook remained elevated. They noted that the implications of developments in the Middle East for the U.S. economy were uncertain. Members concurred that the Committee was attentive to the risks to both sides of its dual mandate.
In support of the Committee's goals, almost all members agreed to maintain the target range for the federal funds rate at 3-1/2 to 3-3/4 percent. One member voted against that decision and preferred to lower the target range 1/4 percentage point. Members agreed that in considering the extent and timing of additional adjustments to the target range for the federal funds rate, the Committee would carefully assess incoming data, the evolving outlook, and the balance of risks. Members agreed that the postmeeting statement should affirm their strong commitment both to supporting maximum employment and to returning inflation to the Committee's 2 percent objective.
Members agreed that in assessing the appropriate stance of monetary policy, the Committee would continue to monitor the implications of incoming information for the economic outlook. They would be prepared to adjust the stance of monetary policy as appropriate if risks emerged that could impede the attainment of the Committee's goals. Members also agreed that their assessments would take into account a wide range of information, including readings on labor market conditions, inflation pressures and inflation expectations, and financial and international developments.
At the conclusion of the discussion, the Committee voted to direct the Federal Reserve Bank of New York, until instructed otherwise, to execute transactions in the SOMA in accordance with the following domestic policy directive, for release at 2:00 p.m.:
"Effective March 19, 2026, the Federal Open Market Committee directs the Desk to:
- Undertake open market operations as necessary to maintain the federal funds rate in a target range of 3-1/2 to 3-3/4 percent.
- Conduct standing overnight repurchase agreement operations at a rate of 3.75 percent.
- Conduct standing overnight reverse repurchase agreement operations at an offering rate of 3.5 percent and with a per-counterparty limit of $160 billion per day.
- Increase the System Open Market Account holdings of securities through purchases of Treasury bills and, if needed, other Treasury securities with remaining maturities of 3 years or less to maintain an ample level of reserves.
- Roll over at auction all principal payments from the Federal Reserve's holdings of Treasury securities. Reinvest all principal payments from the Federal Reserve's holdings of agency securities into Treasury bills."
The vote also encompassed approval of the statement below for release at 2:00 p.m.:
"Available indicators suggest that economic activity has been expanding at a solid pace. Job gains have remained low, and the unemployment rate has been little changed in recent months. Inflation remains somewhat elevated.
The Committee seeks to achieve maximum employment and inflation at the rate of 2 percent over the longer run. Uncertainty about the economic outlook remains elevated. The implications of developments in the Middle East for the U.S. economy are uncertain. The Committee is attentive to the risks to both sides of its dual mandate.
In support of its goals, the Committee decided to maintain the target range for the federal funds rate at 3-1/2 to 3-3/4 percent. In considering the extent and timing of additional adjustments to the target range for the federal funds rate, the Committee will carefully assess incoming data, the evolving outlook, and the balance of risks. The Committee is strongly committed to supporting maximum employment and returning inflation to its 2 percent objective.
In assessing the appropriate stance of monetary policy, the Committee will continue to monitor the implications of incoming information for the economic outlook. The Committee would be prepared to adjust the stance of monetary policy as appropriate if risks emerge that could impede the attainment of the Committee's goals. The Committee's assessments will take into account a wide range of information, including readings on labor market conditions, inflation pressures and inflation expectations, and financial and international developments."
Voting for this action:Jerome H. Powell, John C. Williams, Michael S. Barr, Michelle W. Bowman, Lisa D. Cook, Beth M. Hammack, Philip N. Jefferson, Neel Kashkari, Lorie K. Logan, Anna Paulson, and Christopher J. Waller.
Voting against this action: Stephen I. Miran.
Stephen I. Miran preferred to lower the target range for the federal funds rate by 1/4 percentage point at this meeting.
Consistent with the Committee's decision to leave the target range for the federal funds rate unchanged, the Board of Governors of the Federal Reserve System voted unanimously to maintain the interest rate paid on reserve balances at 3.65 percent, effective March 19, 2026. The Board of Governors of the Federal Reserve System voted unanimously to approve the establishment of the primary credit rate at the existing level of 3.75 percent.
It was agreed that the next meeting of the Committee would be held on Tuesday–Wednesday, April 28–29, 2026. The meeting adjourned at 10:15 a.m. on March 18, 2026.
Notation Vote
By notation vote completed on February 17, 2026, the Committee unanimously approved the minutes of the Committee meeting held on January 27–28, 2026.
By notation vote completed on March 2, 2026, the Committee unanimously approved updates to the Program for Security of FOMC Information to reduce operational complexities. Committee organizational documents are reviewed at least annually, including at the January meeting of each year, and adjusted as appropriate.
Attendance
Jerome H. Powell, Chair
John C. Williams, Vice Chair
Michael S. Barr
Michelle W. Bowman
Lisa D. Cook
Beth M. Hammack
Philip N. Jefferson
Neel Kashkari
Lorie K. Logan
Stephen I. Miran
Anna Paulson
Christopher J. Waller
Thomas I. Barkin, Mary C. Daly, Austan D. Goolsbee, Sushmita Shukla, and Cheryl L. Venable, Alternate Members of the Committee
Susan M. Collins, Alberto G. Musalem, and Jeffrey R. Schmid, Presidents of the Federal Reserve Banks of Boston, St. Louis, and Kansas City, respectively
Joshua Gallin, Secretary
Matthew M. Luecke, Deputy Secretary
Michelle A. Smith, Assistant Secretary
Mark E. Van Der Weide, General Counsel
Richard Ostrander, Deputy General Counsel
Trevor A. Reeve, Economist
Stacey Tevlin, Economist
Beth Anne Wilson, Economist
Stephanie R. Aaronson, Shaghil Ahmed, Michael T. Kiley, Elizabeth Klee, and Andrea Raffo, Associate Economists
Roberto Perli, Manager, System Open Market Account
Julie Ann Remache, Deputy Manager, System Open Market Account
Daniel Aaronson, Interim Director of Research, Federal Reserve Bank of Chicago
Jose Acosta, Senior System Engineer II, Division of Information Technology, Board
Alyssa Arute,2 Assistant Director, Division of Reserve Bank Operations and Payment Systems, Board
Ayelen Banegas, Principal Economist, Division of Monetary Affairs, Board
Alessandro Barbarino, Special Adviser to the Board, Division of Board Members, Board
William F. Bassett, Senior Associate Director, Division of Financial Stability, Board
Michele Cavallo, Special Adviser to the Board, Division of Board Members, Board
Daniel Cooper, Vice President, Federal Reserve Bank of Boston
Francisco Covas, Deputy Director, Division of Supervision and Regulation, Board
Stephanie E. Curcuru, Deputy Director, Division of International Finance, Board
Ryan A. Decker, Special Adviser to the Chair, Division of Board Members, Board
Laura J. Feiveson, Special Adviser to the Board, Division of Board Members, Board
Andrew Figura, Senior Associate Director, Division of Research and Statistics, Board
Andrew T. Foerster, Senior Research Advisor, Federal Reserve Bank of San Francisco
Glenn Follette, Associate Director, Division of Research and Statistics, Board
Shigeru Fujita, Senior Economic Advisor and Economist I, Federal Reserve Bank of Philadelphia
Jenn Gallagher,3 Assistant to the Board, Division of Board Members, Board
Jonathan Glicoes, Senior Financial Institution Policy Analyst II, Division of Monetary Affairs, Board
Luca Guerrieri, Senior Associate Director, Division of International Finance, Board
Christopher J. Gust, Senior Associate Director, Division of Monetary Affairs, Board
Valerie S. Hinojosa, Section Chief, Division of Monetary Affairs, Board
Jane E. Ihrig, Special Adviser to the Board, Division of Board Members, Board
Benjamin K. Johannsen, Deputy Associate Director, Division of Monetary Affairs, Board
Don H. Kim,2 Senior Adviser, Division of Monetary Affairs, Board
Kevin L. Kliesen, Assistant Vice President, Federal Reserve Bank of St. Louis
Scott R. Konzem, Senior Economic Modeler II, Division of Monetary Affairs, Board
Christopher J. Kurz, Assistant Director, Division of Research and Statistics, Board
Andreas Lehnert, Director, Division of Financial Stability, Board
Logan T. Lewis, Assistant Director, Division of International Finance, Board
Byron Lutz, Deputy Associate Director, Division of Research and Statistics, Board
Rebecca McCaughrin,2 Policy and Market Analysis Director, Federal Reserve Bank of New York
Benjamin W. McDonough, Secretary, Office of the Secretary, Board
Davide Melcangi, Economic Research Advisor, Federal Reserve Bank of New York
Norman J. Morin, Special Adviser to the Board, Division of Board Members, Board
David Na, Acting Group Manager, Division of Monetary Affairs, Board
Edward Nelson, Senior Adviser, Division of Monetary Affairs, Board
David Newville, Director, Division of Consumer and Community Affairs, Board
Anna Nordstrom, Head of Markets, Federal Reserve Bank of New York
Marcelo Ochoa, Principal Economist, Division of Monetary Affairs, Board
Alyssa T. O'Connor, Special Adviser to the Board, Division of Board Members, Board
John A. O'Trakoun, Senior Policy Economist, Federal Reserve Bank of Richmond
Ekaterina Peneva, Assistant Director, Division of Research and Statistics, Board
Damjan Pfajfar, Vice President, Federal Reserve Bank of Cleveland
Eugenio P. Pinto, Special Adviser to the Board, Division of Board Members, Board
Zeynep Senyuz, Special Adviser to the Board, Division of Board Members, Board
A. Lee Smith, Senior Vice President, Federal Reserve Bank of Kansas City
Francisco Vazquez-Grande, Group Manager, Division of Monetary Affairs, Board
Jeffrey D. Walker,2 Senior Associate Director, Division of Reserve Bank Operations and Payment Systems, Board
William Wascher, Deputy Director, Division of Research and Statistics, Board
Min Wei, Senior Associate Director, Division of Monetary Affairs, Board
Benedict Wensley,2 Policy and Market Analysis Advisor, Federal Reserve Bank of New York
Lauren E. Wiese, Information Services Senior Analyst, Division of Monetary Affairs, Board, and Federal Reserve Bank of Chicago
Jonathan Willis, Vice President, Federal Reserve Bank of Atlanta
Rebecca Zarutskie, Senior Vice President, Federal Reserve Bank of Dallas
_______________________
Joshua Gallin
Secretary
1. The Federal Open Market Committee is referenced as the "FOMC" and the "Committee" in these minutes; the Board of Governors of the Federal Reserve System is referenced as the "Board" in these minutes. Return to text
2. Attended through the discussion of developments in financial markets and open market operations. Return to text
3. Attended from the discussion of the economic and financial situation through the end of the meeting. Return to text
Petrodollar Trade is Over, Dollar Tumbles – EUR/USD, AUD/USD & Dollar Index (DXY) Overview
The US Dollar has seen its best days throughout the last two months, with the infamous Petrodollar trade grabbing all the attention from Market participants and flows.
Crude Oil prices, denominated and traded in US Dollars, rose by close to 100% from mid-February to just yesterday, amid a historic and brutal conflict in the Middle East.
A 6-week-long operation led by the US and Israeli armies against the Islamic regime of Iran completely changed the geopolitical picture, which in turn affected Markets in a striking manner.
The de facto closure of the Strait of Hormuz, which facilitates the movement of close to 20% of global Energy commodity flows, has completely rocked inflation expectations and, for the regular Economy and all its participants, prices at the pump.
With much higher petrol prices, entire regions, particularly those dependent on Middle Eastern oil, had to race to hedge against the risk of shortages, and, by doing so, convert their currencies to the US Dollar, which created its own self-fulfilling prophecy.
Add to it pre-existing short-positioning, and a Fed that was starting to get priced for rate hikes as Inflation expectations exploded, and the cocktail for the Greenback was a profitable one.
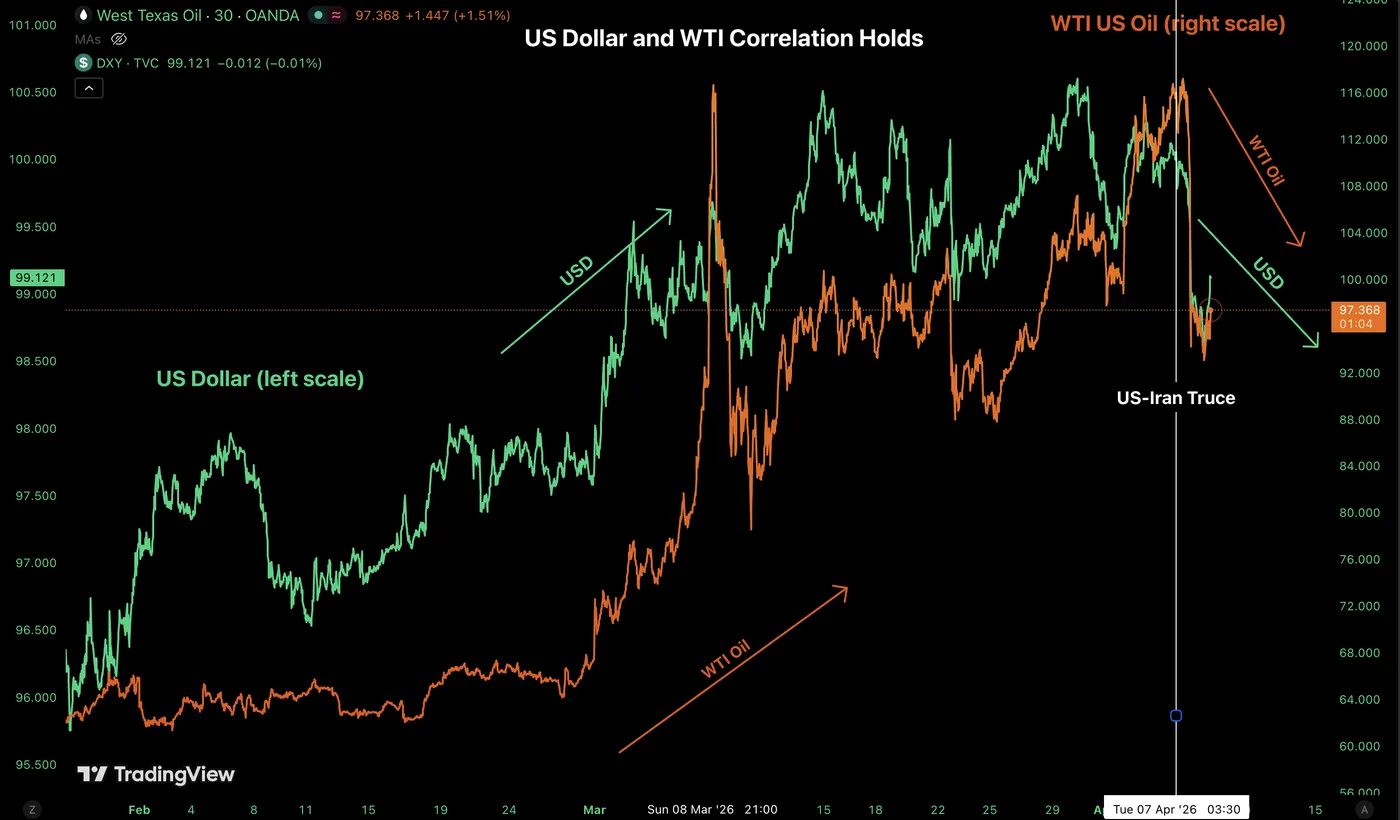
The Petrodollar trade – Oil and US Dollar Correlation. Source: TradingView. April 8, 2026
However, since yesterday evening, the situation has taken quite an unexpected turn. Markets were slowly pricing the potential for a truce, with US pressure to reach a ceasefire extending, but less than 36 hours before the headline, Iran had just rejected a US proposition.
Yet, the pressure from the Trump Administration actually worked, and the two sides reached a deal, albeit still quite a foggy one for now.
The prior ease in tone had formed a double top in the Dollar Index, but the lack of progress in the situation had kept angst high in the currency Markets.
However, yesterday's Ceasefire headline brought the hammer to the US Dollar.
After the news, the Dollar lost close to a percentage point against most of its FX peers, and has boarded a similar move in today's action.
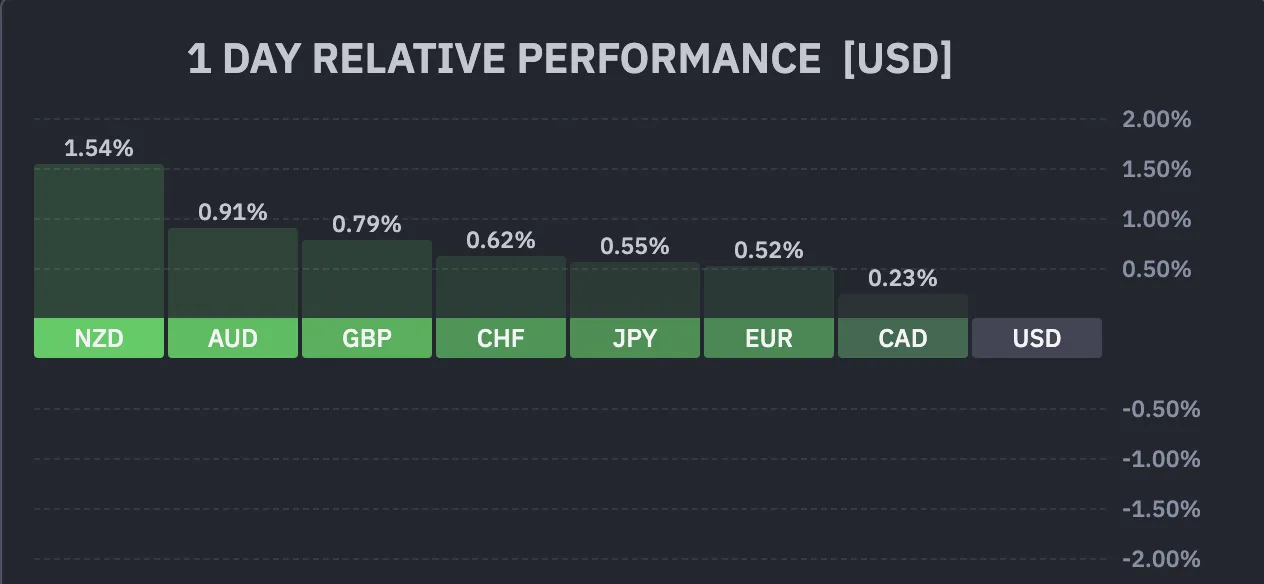
Current Session's FX Performance – Courtesy of Finviz. April 8, 2026
A short-term pullback has emerged in the past few hours, but the uptrend from the past months has taken a decisive turn.
We will look at the Dollar Index, EUR/USD, and AUD/USD to assess the current state of the Market and whether the Dollar will actually suffer from the latest geopolitical truce.
Dollar Index 4H Chart
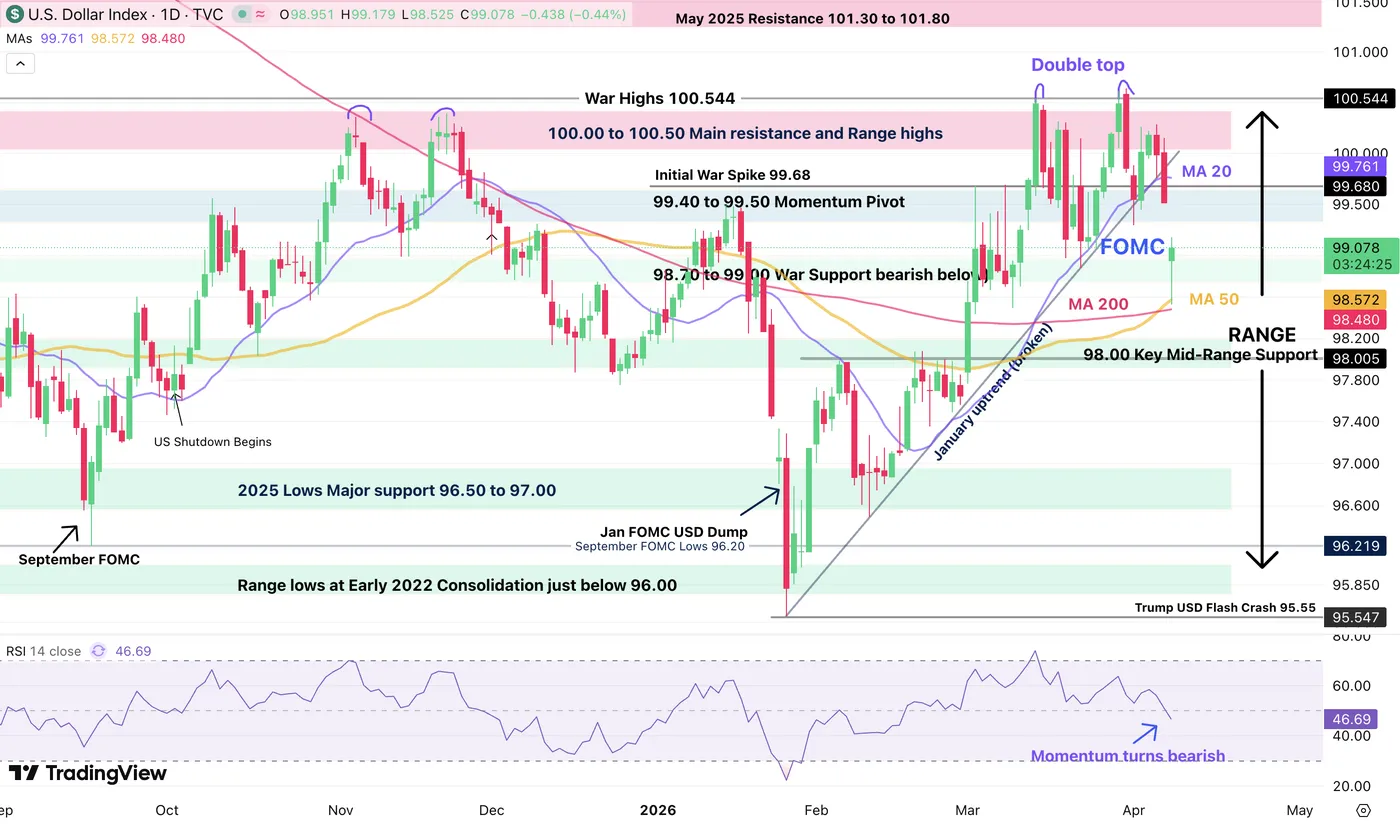
Dollar Index Daily Chart, April 8, 2026 – Source: TradingView
The US Dollar has officially broken its January uptrend after today's gap lower in the Dollar Index.
After forming a double top in recent action, sellers have now officially taken control by breaking the 20-Day Moving average (99.75), but stalled at the quintessential 98.70 - 99.00 War Support.
With WTI correcting higher, the USD is following suit, but this for now only hints at a pullback from oversold conditions (in shorter timeframes) – The counter move has now stalled; any continuation higher should stall around 99.50 (Gap fill) and this would offer optimal entries on Dollar shorts.
Levels of interest for the Dollar Index:
Resistance Levels
- 99.40 to 99.50 Momentum Pivot (and Gap Fill level)
- Initial War Spike 99.68
- Weekly range highs 100.00
- 100.00 to 100.50 Main Resistance Zone
- War Highs 100.544
Support Levels
- 98.70 to 99.00 Support (War support)
- 98.57 50 and 200 4H MA (recent lows)
- 98.00 2025 Support
- Support 97.40 to 97.60
- 2025 Lows 96.40 to 96.80 Support
AUD/USD 4H Chart and Technical Levels
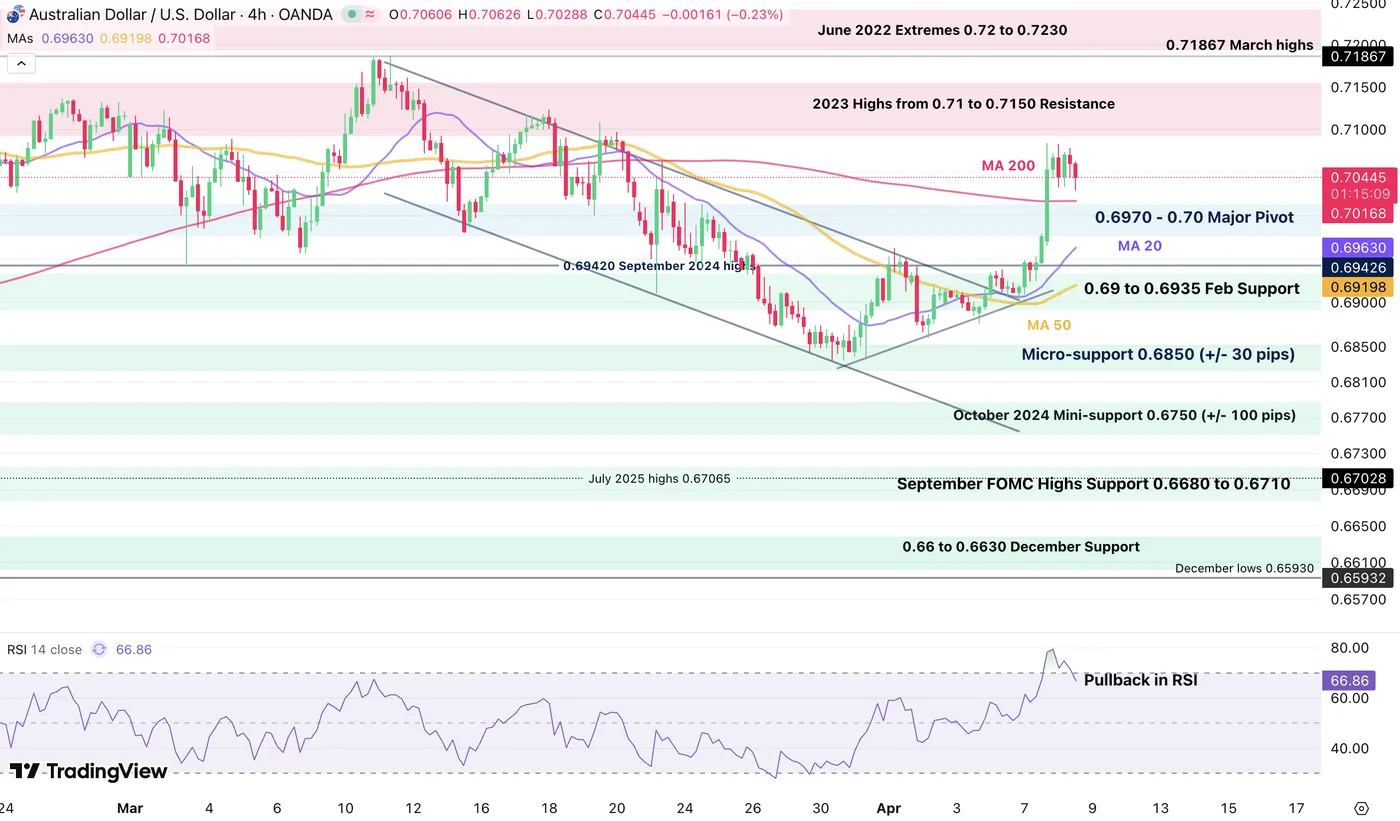
AUD/USD 4H Chart, April 8, 2026 – Source: TradingView
AUD/USD largely reversed its mid-March tumble lower, stalling around its 0.618% Fibonacci level (0.7080).
With a short-term pullback in the US Dollar, AUD/USD bulls could take the advantage again when the RSI eases enough as long as the narrative does not turn again.
The 4H 200-period MA could provide an interesting entry point (0.70170).
Levels of interest for AUD/USD:
Resistance Levels
- 0.7080 rebound highs
- 2023 Highs from 0.71 to 0.7150 Resistance
- 0.71867 March highs
- June 2022 Extremes 0.72 to 0.7230
Support Levels
- 4H 200-period MA - 0.70170
- 0.6970 - 0.70 Major Pivot
- 0.69 to 0.6935 Early Feb Support
- 0.68340 War lows
- Micro-support 0.6850 (+/- 30 pips)
- October 2024 Mini-support 0.6750 (+/- 100 pips)
EUR/USD 4H Chart and Technical Levels
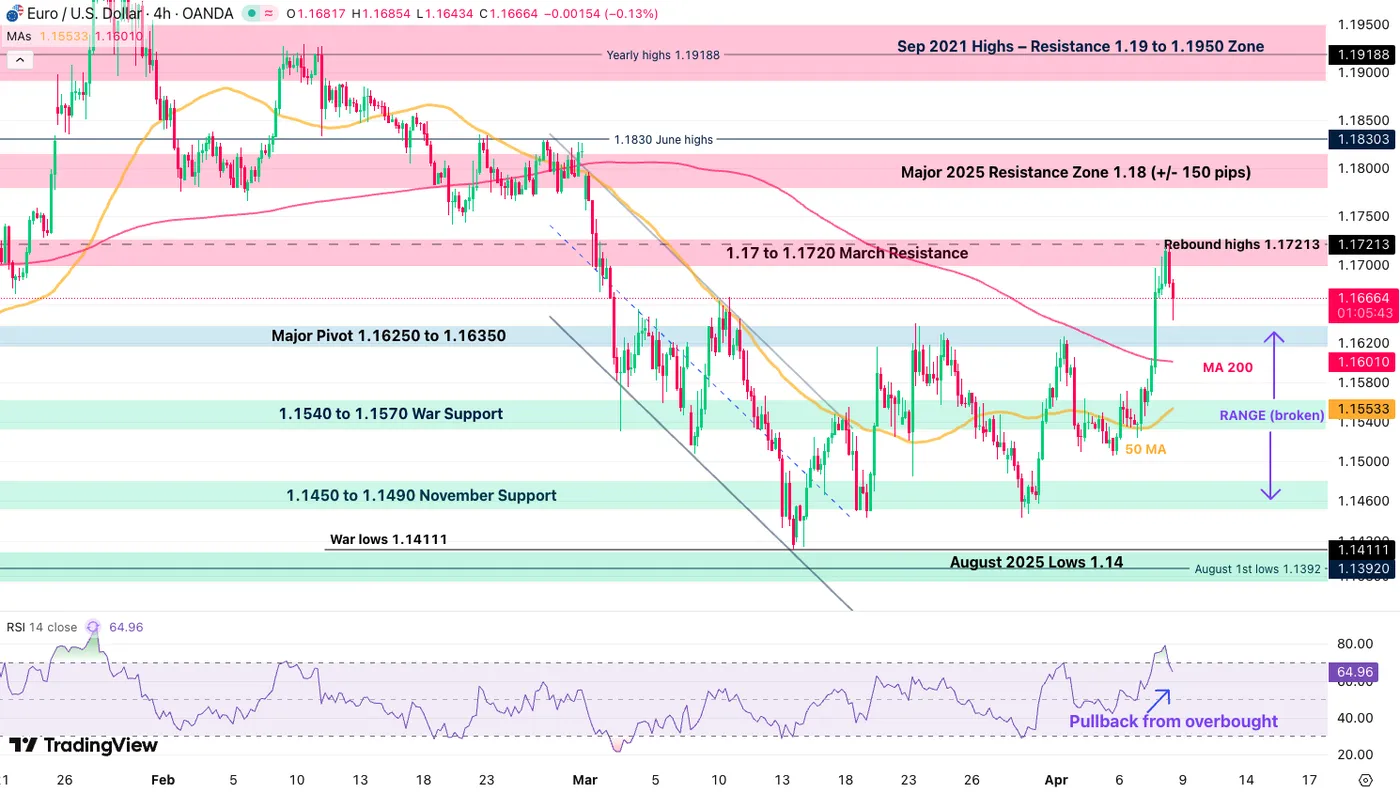
EUR/USD 4H Chart, April 8, 2026 – Source: TradingView
EUR/USD has officially broken its 1.14 to 1.16 War consolidation zone, and will look to confirm the breakout.
Retesting and rejecting the Major Pivot zone would guarantee a stronger phase ahead for the most popular FX pair.
Levels to place on your EUR/USD charts:
Resistance Levels
- 1.17 to 1.1720 March Resistance
- Rebound highs 1.17213
- Resistance Zone around 1.18 (+/- 150 pips)
- 1.1830 June 2025 highs
- Sep 2021 Highs – Resistance 1.19 to 1.1950 Zone
Support Levels
- Major Pivot 1.16250 to 1.16350
- 1.1540 to 1.1570 War Support
- 1.1475 to 1.15 November Support
- War lows 1.1410
Safe Trades and keep a close eye on Ceasefire news!
Gold (XAU/USD) Stalls at Critical $4900/oz Resistance as Bear Signal Flashes
- Gold (XAU/USD) rallied to near $4,850/oz after the US-Iran ceasefire and subsequent oil price slide, but stalled and pulled back toward $4,780 due to concerns over the truce's fragility.
- Price movements are supported by US Dollar weakness and market pricing for interest rate cuts in the second half of 2026, which provide a floor for the non-yielding bullion.
- Technically, gold is struggling at the critical $4900 resistance level (the 200 SMA)
Gold prices experienced a rollercoaster session on Wednesday, April 8, 2026, as a sudden shift in the geopolitical landscape forced traders to reassess their risk premiums.
After testing intraday highs near $4,850/oz level following news that a two-week ceasefire has been reached between the US and Iran.
Spot gold (XAU/USD) faced a corrective pullback toward the $4,780 level as the day progressed however as risks of a ceasefire violation and overall concern keep bulls in check.
For weeks, the "war premium" has been the primary engine for the decline in precious metals. The reason being that the rise in Oil prices stoked inflationary fears and thus weighed on Gold prices.
However, the announcement, which includes the crucial reopening of the Strait of Hormuz saw oil prices slide back below $100 per barrel and a cooling of the safe-haven bid that has characterized Q1 2026. This led to the Gold rally.
What is Driving Movements Today?
The US-Iran Ceasefire: The 48-hour ultimatum previously set by the US administration ended with a diplomatic breakthrough. This has eased immediate fears of a wider regional conflagration, leading to profit-taking in the "safe-haven" complex. As we often see, gold is the first to fly on fear and the first to be sold when the clouds begin to part.
Dollar Softness & Rate Cut Bets: Despite the de-escalation, the US Dollar Index (DXY) remains under pressure, slipping 0.8% against the Euro. Markets are increasingly pricing in aggressive rate cuts for the second half of 2026 as global growth forecasts from the World Bank suggest a slowdown in emerging markets. Lower yields continue to provide a sturdy floor for non-yielding bullion.
The "Turbo-Gold" Effect: Silver outperformed its yellow sibling today, rallying nearly 7% to hit $77/oz. This "turbo-charged" move in silver often signals a broader bullish conviction in the metals sector, suggesting that even if gold pauses to breathe, the underlying trend remains firmly to the upside.
Risks Moving Forward: A Double-Edged Sword
While the ceasefire is a welcome relief for global stability, it introduces a period of binary risk for gold investors:
- Fragility of the Truce: This is a two-week window. Any violation of the terms or a failure to reach a long-term agreement during this period could see gold gap down toward the $4500/oz support zone almost and potentially lower.
- Central Bank Appetite: A key risk to the downside would be a pivot in central bank behavior. While J.P. Morgan and UBS anticipate continued strong buying (averaging 585 tonnes per quarter), any indication that high prices are finally deterring official sector accumulation could remove a primary support pillar.
- The Inflation Conundrum: If energy prices stabilize due to the Hormuz reopening, we could see a faster-than-expected cooling of headline inflation. This might allow the Fed and markets to price in rate cuts again which in turn could aid Gold bulls and facilitate a push beyond the $5000/oz handle.
Technical Outlook - XAU/USD
Gold (XAU/USD) on the H4 timeframe is currently locked in a critical battle between recovering momentum and major technical resistance.
After rebounding from the $4250 floor, the precious metal has carved out a series of higher lows, successfully reclaiming the 50 and 100 SMAs.
However, the rally is now stalling as it encounters the 200 SMA (currently at $4903) and the psychological $5000 barrier. Today’s price action shows a slight retreat, mirroring the RSI "BEAR" signal which suggests momentum is overextended in the short term.
Upside: A clean break above $4900 is required to challenge the $5000 level.
Downside: Support sits firmly at the $4688 pivot. Should this fail, a retest of the SMA cluster near $4615 is likely.
Expect consolidation as the market digests recent gains before the next major impulsive move.
Gold (XAU/USD) Four-Hour Chart, April 8, 2026
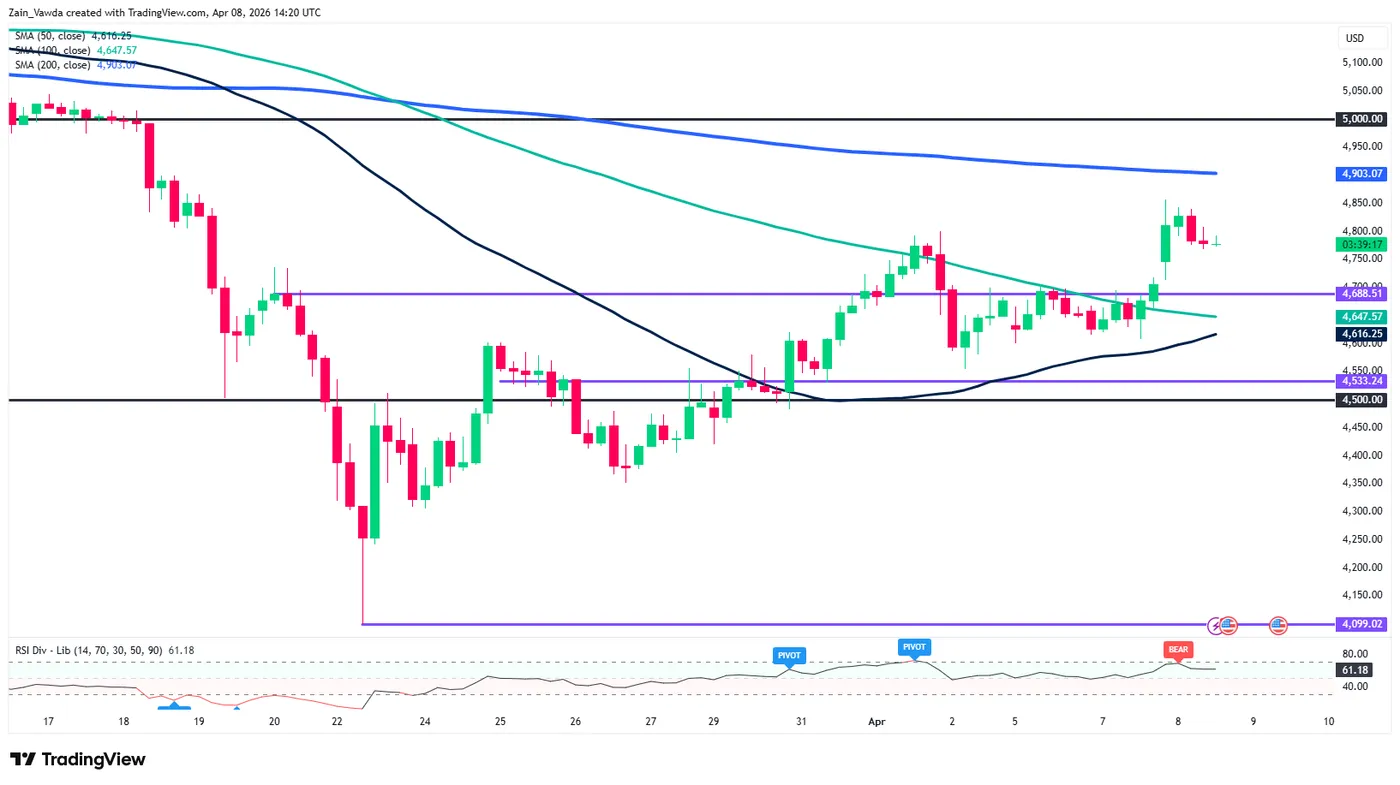
Source: TradingView (click to enlarge)
The immediate geopolitical heat is cooling, but the structural bull case for gold underpinned by central bank diversification and a return to a global monetary order remains intact. Expect volatility to remain high as we navigate this two-week diplomatic window.
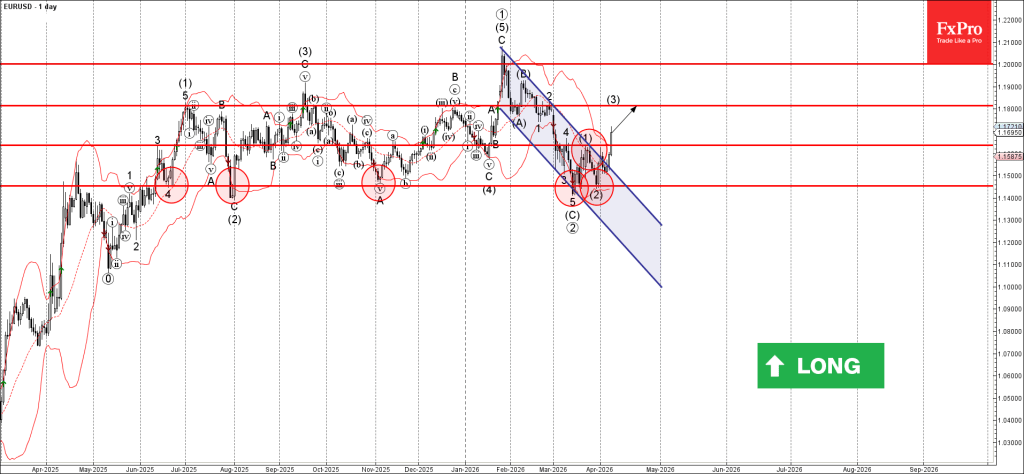
EURUSD Wave Analysis
EURUSD: ⬆️ Buy
- EURUSD broke key resistance level 1.1635
- Likely to rise to resistance level 1.1800
EURUSD currency pair recently broke the key resistance level 1.1635 (which stopped earlier waves (4) and 2) and the resistance trendline of the daily down channel from January.
The breakout of these resistance levels accelerated the active intermediate impulse wave (3) – which started earlier from the strong long-term support level 1.1455.
Given the clear daily uptrend, EURUSD currency pair can be expected to rise to the next resistance level 1.1800 (top of wave 2 from February).