Sample Category Title
Platinum Wave Analysis
Platinum: ⬆️ Buy
- Platinum broke the resistance zone
- Likely to rise to resistance level 2200.00
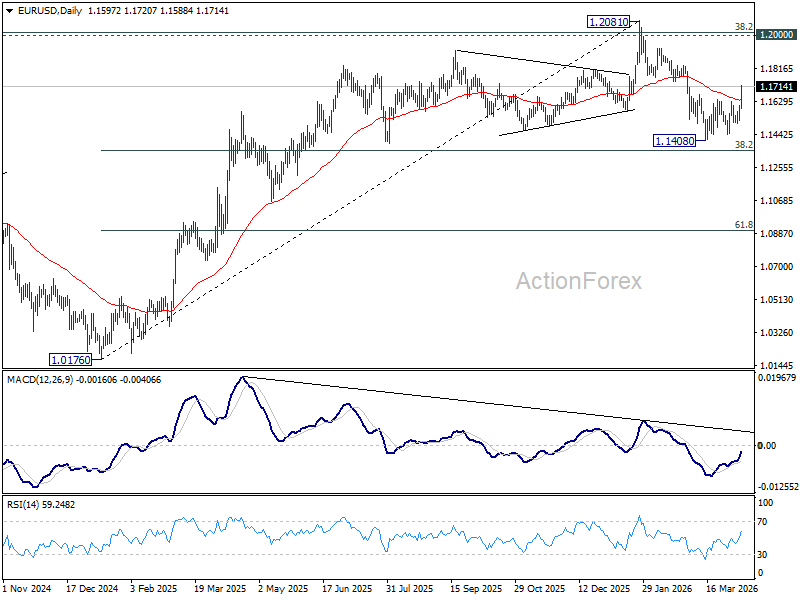
Platinum recently broke above the resistance zone between the round resistance level 2000.00 and the two down trendlines from February and January.
The breakout of this resistance zone accelerated the active short-term correction ii – which belongs to wave C of the ABC correction (2) from January.
Platinum can be expected to rise to the next resistance level 2200.00, which is the target price for the completion of the active corrective wave ii.
USDJPY Wave Analysis
USDJPY: ⬇️ Sell
- USDJPY reversed from strong resistance level 160.00
- Likely to fall to support level 157.50
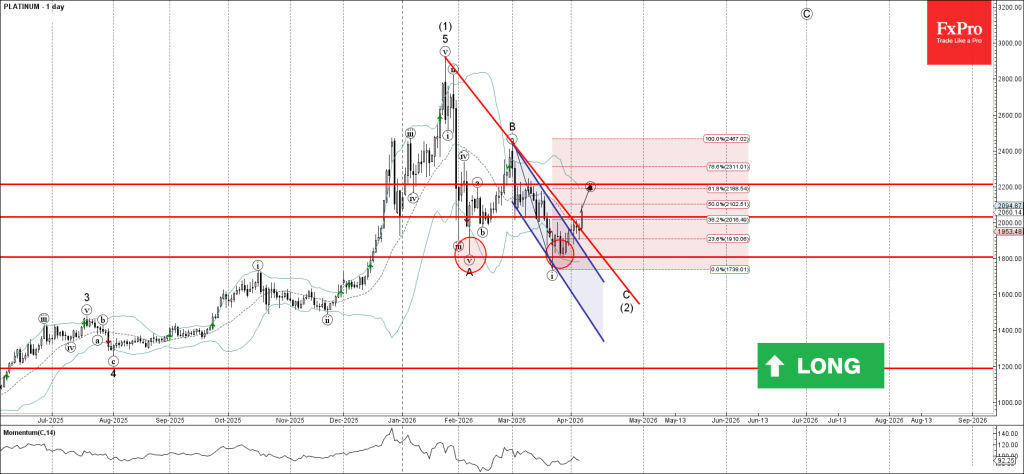
USDJPY currency pair recently reversed down from the strong resistance level 160.00 (which has been reversing the price from March) standing close to the upper daily Bollinger Band.
The downward reversal from the resistance level 160.00 started the active short-term correction v, which belongs to wave iii from January.
Given the strength of the resistance level 160.00 and the bearish divergence on the daily Stochastic indicator, USDJPY currency pair can be expected to fall to the next support level 157.50 – which stopped earlier waves I and iv.
Nasdaq-100 Wave Analysis
Nasdaq-100: ⬆️ Buy
- Nasdaq-100 broke resistance zone
- Likely to rise to resistance level 2200.00
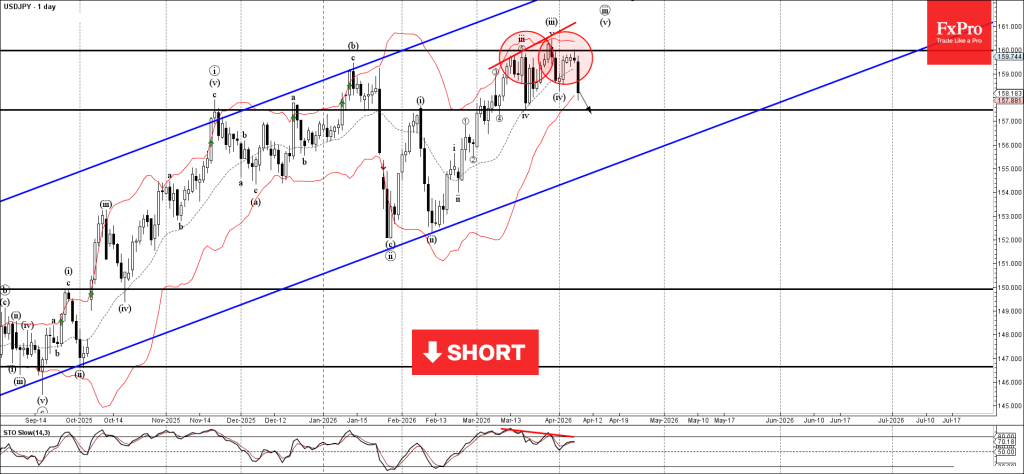
Nasdaq-100 index recently rose sharply breaking the resistance trendline of the daily down channel from the end of January (which enclosed the previous ABC correction (C)).
The breakout of this down channel accelerated the active impulse wave (1), which started earlier from the strong support level 23000.00.
Given the strong daily uptrend, Nasdaq-100 can be expected to rise to the next resistance level 25400.00, top of wave 4 from the end of February.
Eco Data 4/9/26
| GMT | Ccy | Events | Act | Cons | Prev | Rev |
|---|---|---|---|---|---|---|
| 23:01 | GBP | RICS Housing Price Balance Mar | -23% | -18% | -12% | -14% |
| 05:00 | JPY | Consumer Confidence Mar | 33.3 | 38.4 | 40 | |
| 06:00 | JPY | Machine Tool Orders Y/Y Mar F | 28.10% | 24.20% | ||
| 06:00 | EUR | Germany Industrial Production M/M Feb | -0.30% | 0.70% | -0.50% | 0.00% |
| 06:00 | EUR | Germany Trade Balance (EUR) Feb | 19.8B | 18.6B | 21.2B | 21.4B |
| 12:30 | USD | Initial Jobless Claims (Apr 3) | 219K | 210K | 202K | 203K |
| 12:30 | USD | GDP Annualized Q4 F | 0.50% | 0.70% | 0.70% | |
| 12:30 | USD | GDP Price Index Q4 F | 3.70% | 3.80% | 3.80% | |
| 12:30 | USD | Personal Income M/M Feb | -0.10% | 0.30% | 0.40% | |
| 12:30 | USD | Personal Spending M/M Feb | 0.50% | 0.50% | 0.40% | 0.30% |
| 12:30 | USD | PCE Price Index M/M Feb | 0.40% | 0.40% | 0.30% | |
| 12:30 | USD | PCE Price Index Y/Y Feb | 2.80% | 2.80% | 2.80% | |
| 12:30 | USD | PCE Core Price Index M/M Feb | 0.40% | 0.40% | 0.40% | |
| 12:30 | USD | PCE Core Price Index Y/Y Feb | 3.00% | 3.00% | 3.10% | |
| 14:00 | USD | Whole Sale Inventories Feb F | 0.80% | -0.50% | -0.50% | |
| 14:30 | USD | Natural Gas Storage (Apr 3) | 50B | 41B | 36B |
| 23:01 | GBP |
| RICS Housing Price Balance Mar | |
| Actual | -23% |
| Consensus | -18% |
| Previous | -12% |
| Revised | -14% |
| 05:00 | JPY |
| Consumer Confidence Mar | |
| Actual | 33.3 |
| Consensus | 38.4 |
| Previous | 40 |
| 06:00 | JPY |
| Machine Tool Orders Y/Y Mar F | |
| Actual | 28.10% |
| Consensus | |
| Previous | 24.20% |
| 06:00 | EUR |
| Germany Industrial Production M/M Feb | |
| Actual | -0.30% |
| Consensus | 0.70% |
| Previous | -0.50% |
| Revised | 0.00% |
| 06:00 | EUR |
| Germany Trade Balance (EUR) Feb | |
| Actual | 19.8B |
| Consensus | 18.6B |
| Previous | 21.2B |
| Revised | 21.4B |
| 12:30 | USD |
| Initial Jobless Claims (Apr 3) | |
| Actual | 219K |
| Consensus | 210K |
| Previous | 202K |
| Revised | 203K |
| 12:30 | USD |
| GDP Annualized Q4 F | |
| Actual | 0.50% |
| Consensus | 0.70% |
| Previous | 0.70% |
| 12:30 | USD |
| GDP Price Index Q4 F | |
| Actual | 3.70% |
| Consensus | 3.80% |
| Previous | 3.80% |
| 12:30 | USD |
| Personal Income M/M Feb | |
| Actual | -0.10% |
| Consensus | 0.30% |
| Previous | 0.40% |
| 12:30 | USD |
| Personal Spending M/M Feb | |
| Actual | 0.50% |
| Consensus | 0.50% |
| Previous | 0.40% |
| Revised | 0.30% |
| 12:30 | USD |
| PCE Price Index M/M Feb | |
| Actual | 0.40% |
| Consensus | 0.40% |
| Previous | 0.30% |
| 12:30 | USD |
| PCE Price Index Y/Y Feb | |
| Actual | 2.80% |
| Consensus | 2.80% |
| Previous | 2.80% |
| 12:30 | USD |
| PCE Core Price Index M/M Feb | |
| Actual | 0.40% |
| Consensus | 0.40% |
| Previous | 0.40% |
| 12:30 | USD |
| PCE Core Price Index Y/Y Feb | |
| Actual | 3.00% |
| Consensus | 3.00% |
| Previous | 3.10% |
| 14:00 | USD |
| Whole Sale Inventories Feb F | |
| Actual | 0.80% |
| Consensus | -0.50% |
| Previous | -0.50% |
| 14:30 | USD |
| Natural Gas Storage (Apr 3) | |
| Actual | 50B |
| Consensus | 41B |
| Previous | 36B |
WTI Price Slumps in Immediate Reaction to Middle East Ceasefire Announcement
WTI oil price fell sharply on Wednesday, losing around $18 in early Asian trading, in reaction to decision of a two-week ceasefire between US/Israel and Iran and re-opening of (not entirely closed) Straight of Hormuz that provided relief.
The deal marks the first step toward the long-lasting peace in the region and temporarily neutralized fears of further escalation that would make oil prices skyrocketing and cause a domino-effect on global economy (rising inflation, higher interest rates, slowdown in economic growth would lead into recession).
Although the ceasefire is still fragile, oil prices were significantly lower in immediate reaction that boosted optimism.
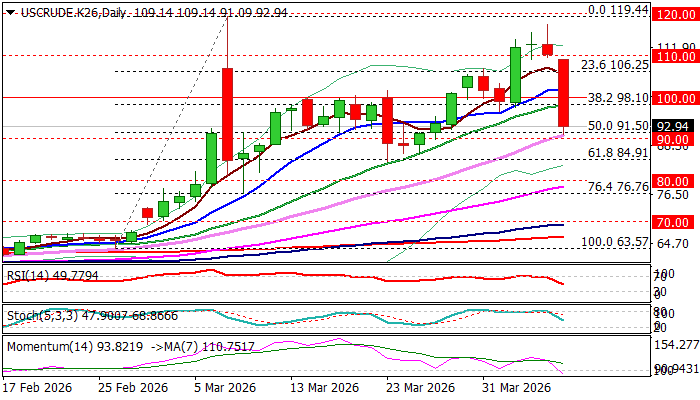
Technical picture on daily chart has weakened following the latest sharp drop that formed large bearish daily candle (the biggest daily loss since March 9), with 14-d momentum breaking into negative territory and RSI / Stochastic heading south, contributing to bearish signal developed on break through $100 (psychological) and $98.00 zone (Fibo 38.2% of $63.57/$119.44 / 20DMA).
Bears found temporary footstep at $91.00 zone (after cracking 50% retracement at $91.50) where the action is taking a breather after a massive loss earlier today.
Consolidation is likely to precede fresh push lower (if situation on the ground continues to fuel optimism), with violation of $90 zone to validate negative signal and expose next breakpoint at $84.50 (March 23 higher low), loss of which to complete a double-top pattern on daily chart and further weaken near-term structure.
Daily close below broken $98.10 support would be minimum requirement to keep fresh bears intact and offer better levels to re-enter bearish market, while return and close above $100 would question bears.
Res: 96.50; 98.10; 100.00; 101.93
Sup: 91.09; 90.00; 86.45; 84.50
Wall Street in Ecstasy! It’s Almost Like Nothing Happened
- Mid-Week review where we dive into the major developments for North American and global Markets
- Yesterday evening, a two-week ceasefire was reached and Markets have exploded, easing their war premiums and discounts
- Crude Oil has now broken $100 and allowing Stocks and other assets to rally, at the cost of the Petrodollar
Log in to our mid-week North American Markets overview, where we examine current themes in North America and provide an overview of index and currency performance.
Markets have taken a huge turn after what could have been a disastrous escalation in the Middle East.
The Market had been preparing for the possibility of a less intense conflict in the region following the commencement of US-Iran talks on March 23rd. Communications in wartime is a foggy terrain, as enemies attempt to deceive each other and reassure their citizens, but the reality is often far less clear.
As the legendary portfolio manager Michael Burry said yesterday (post deleted), by issuing threats of "the end of a civilization" and other big words, the US President was preparing the terrain for a massive TACO.
When markets rally into the close as the situation gradually clears, it signals that someone likely knows something (as yesterday's explosion showed).
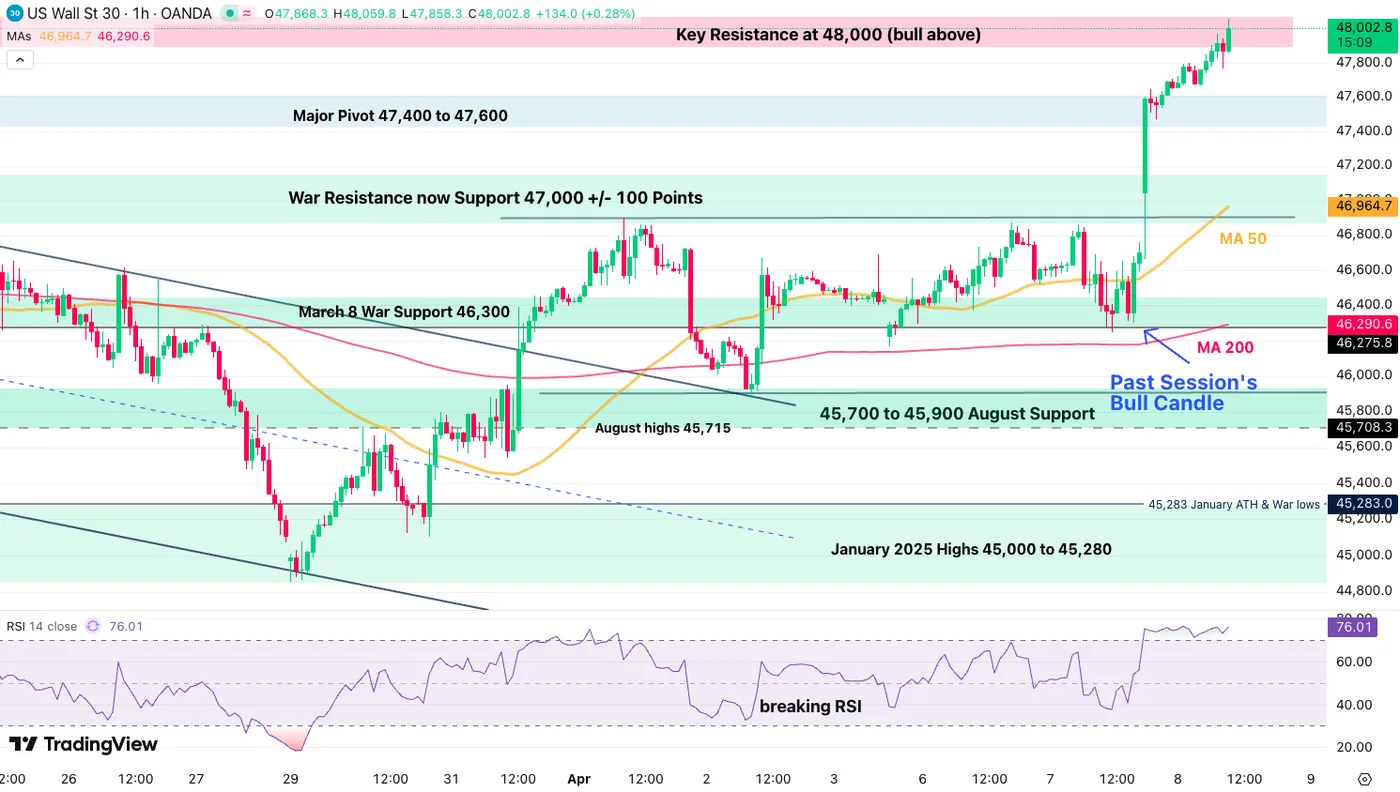
Dow Jones 1H Chart. April 8, 2026 – Source: TradingView
(An in-depth Stock Market outlook is coming up around the mid-session)
Luckily, it is a very positive factor for the World, which is positively affecting Markets; the conflict is officially stopping for at least two weeks and could lead to a longer-term peace prospect if both sides respect their commitments.
As always in ceasefire deals, some points will remain contentious, and the situation remains a bit unclear. If we were to listen to President Trump, most of the points from the 15-point draft have been accepted.
I invite you to pay close attention to the details to know more about whether the ceasefire is to be breached.
In any case, the asset that was the first and the most affected by the news is Crude Oil, naturally, with a gigantic 20% tumble that came right after the news and keeps extending.
The commodity is now trading below $95 a barrel and looks to continue correcting (at least hopefully). After 6 weeks of severely restricted passage through the Strait of Hormuz, many Asian and European countries faced oil shortages and droughts.
So this couldn't have come at a better time.
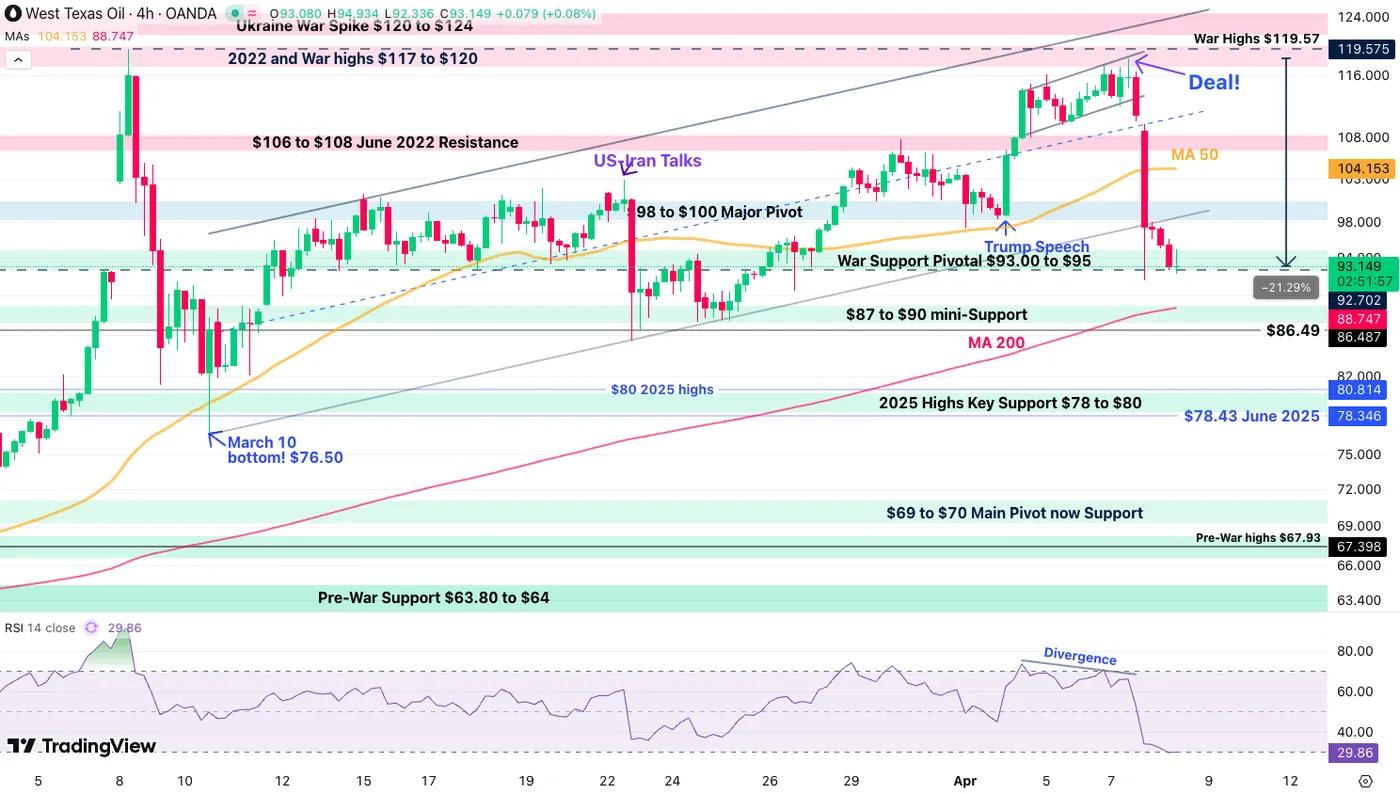
Oil 4H Chart. April 8, 2026 – Source: TradingView
North American Markets have just opened and to say that Wall Street is in ecstasy is nothing short of an understatement.
Nasdaq is leading US Indexes with a +3% extension from its Tuesday close and its peers are not shy if similar performances.
With the US Dollar getting battered by the lower Crude prices and easier Market sentiment, Let's dive right into our Mid-Week North American Markets recap.
North-American Indices Performance
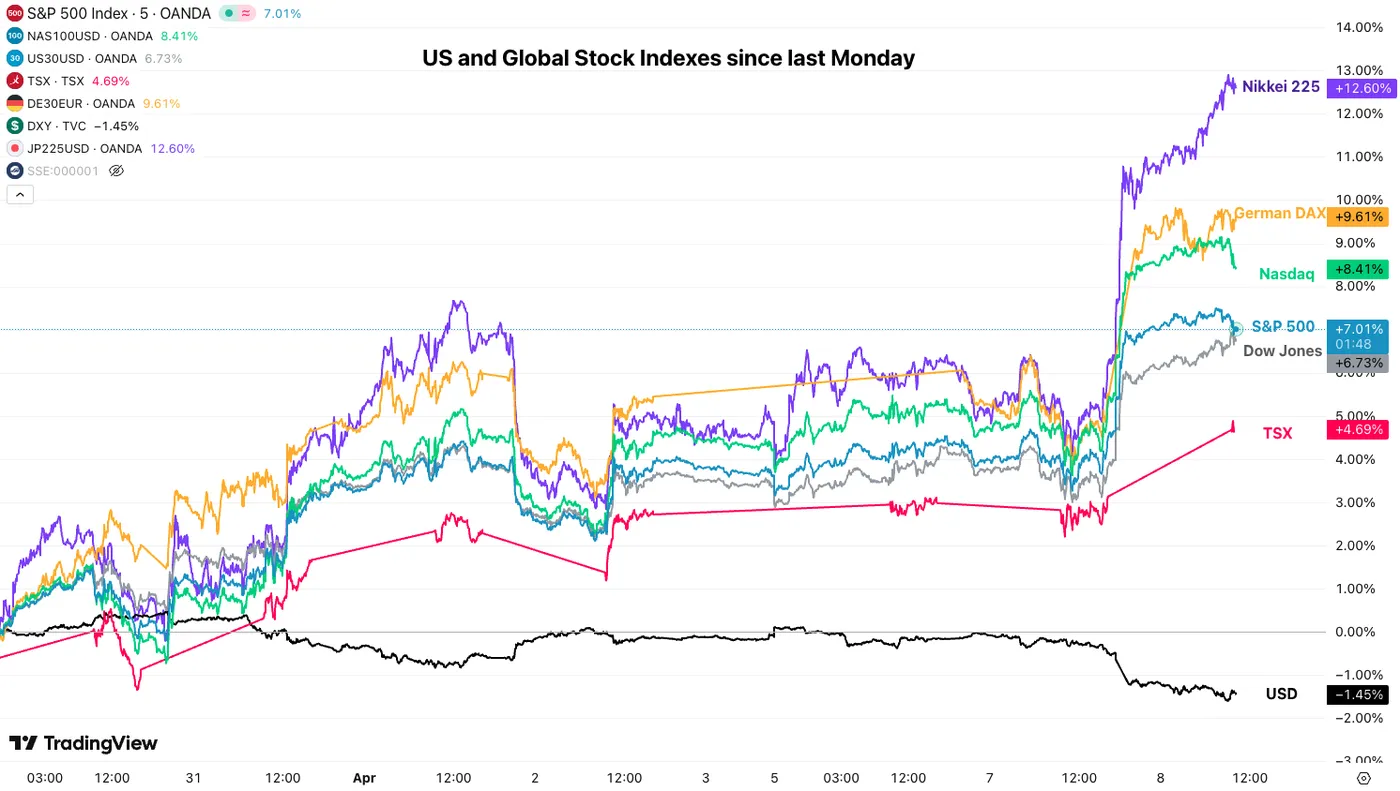
North American Top Indices performance since last Monday – April 8, 2026 – Source: TradingView
Global Equities have just erased 28 days of corrections in only one day, leading to what could be annual gains in this morning's recovery session.
This is quite a stellar turn of events – This could leave fragile expectations if the situation was to sour for any reason, but at least, for now, Bulls are back in fury.
Dollar Index 4H Chart
Dollar Index 4H Chart, April 8, 2026 – Source: TradingView
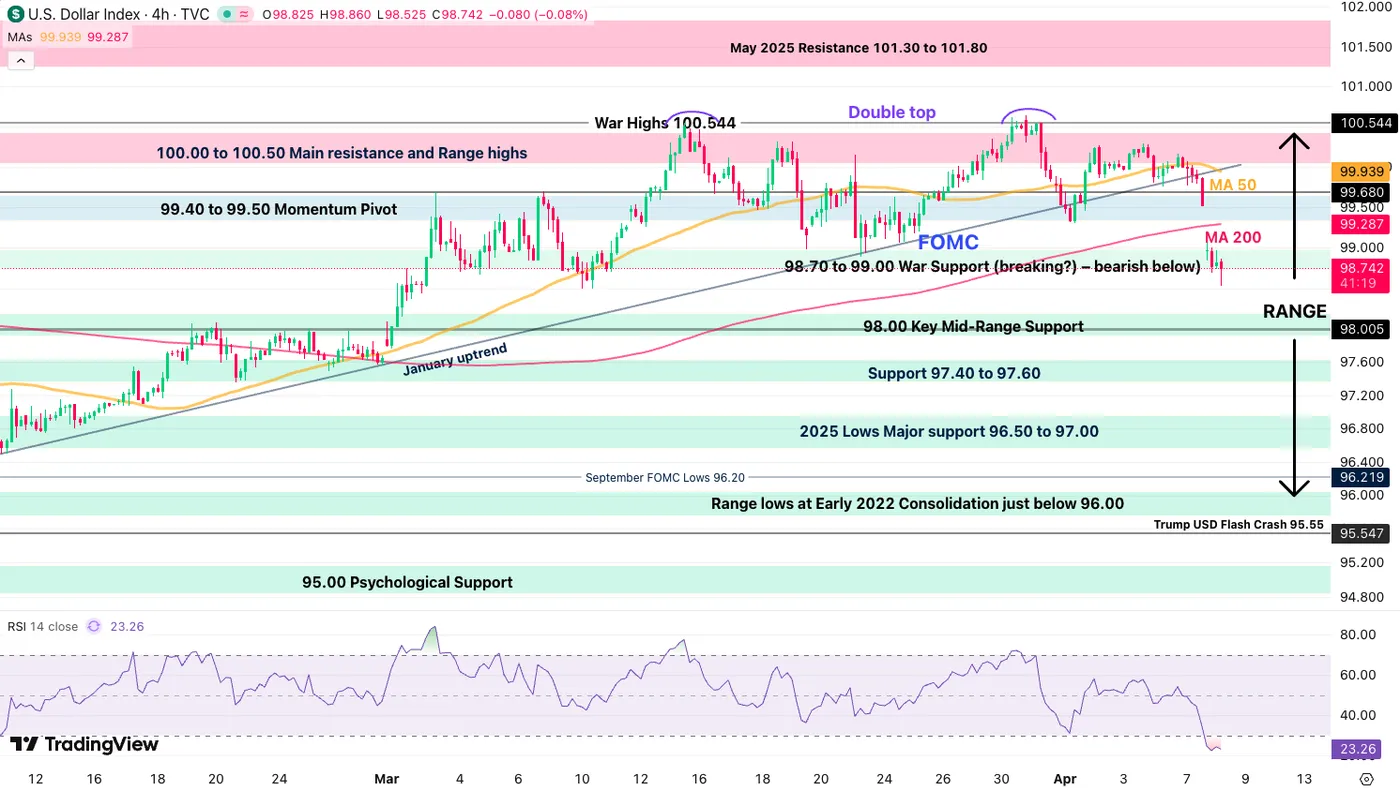
The Dollar Index double top really materialized into a gigantic drop, which will have its own effect on individual FX pairs – Keep closely track of WTI and Brent prices, as their drops should see an almost 1 to 1 effect on the USD.
To take advantage of this situation, check out individual pairs and look for trades that follow this Oil-USD correlation. An in-depth look at the Dollar will be addressed later today.
Levels to place on your DXY charts:
Resistance Levels
- 99.40 to 99.50 Momentum Pivot
- 100.00 to 100.50 Main resistance and Range highs
- War Highs 100.544 (Double Top)
- May 2025 Resistance 101.30 to 101.80
Support Levels
- 98.70 to 99.00 War Support (breaking?) – bearish below
- 98.00 Key Mid-Range Support
- Support 97.40 to 97.60
- 2025 Lows Major support 96.50 to 97.00
US Dollar Mid-Week Performance vs Majors
USD vs other Majors since last Monday, April 8, 2026 - Source: TradingView
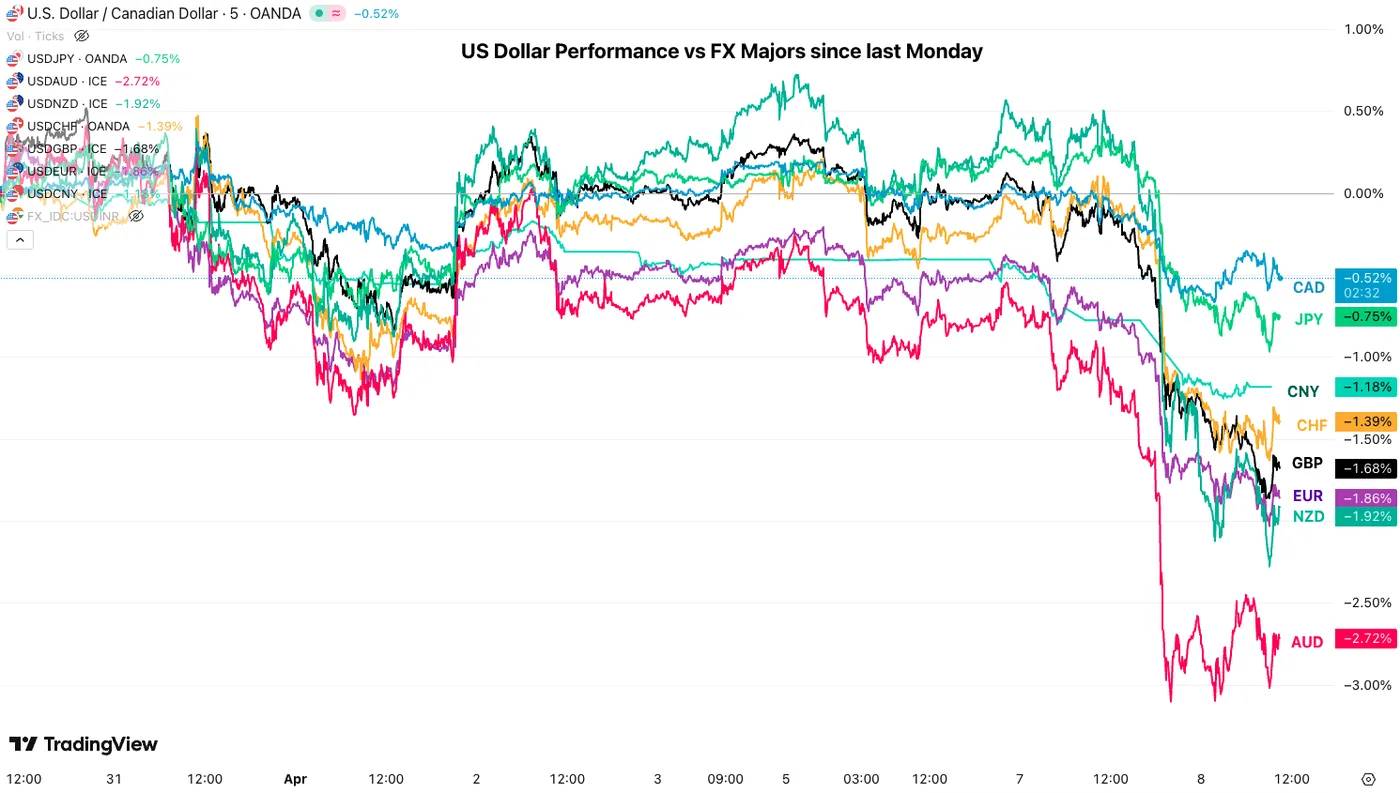
The US Dollar has given up about 50% of its gains against its FX peers since the beginning of the war (and the move has accelerated).
After the gigantic overnight drops, some mean-reversion is ongoing which could offer opportunities.

US Dollar Seasonal performance throughout the first quarter – Source: Market-Bulls.com
For those who haven't seen our past week's edition, this is a seasonal performance chart for the US Dollar. April is its weakest month of the year, so that itself could weigh even more on the Greenback.
Canadian Dollar Mid-Week Performance vs Majors
CAD vs other Majors, April 8, 2026 - Source: TradingView.
The Canadian Dollar has also given up a large part of its gains against its FX peers with WTI easing and better geopolitical prospects.
Holding slightly better against Europeans relative to the US Dollar, as long as Oil corrects, the CAD may still be under pressure in coming days.
Intraday Technical Levels for the USD/CAD
USD/CAD 4H Chart, April 8, 2026 – Source: TradingView
Despite its relative weakness against FX majors, the Loonie is at least outperforming the US Dollar in the recent Market turn.
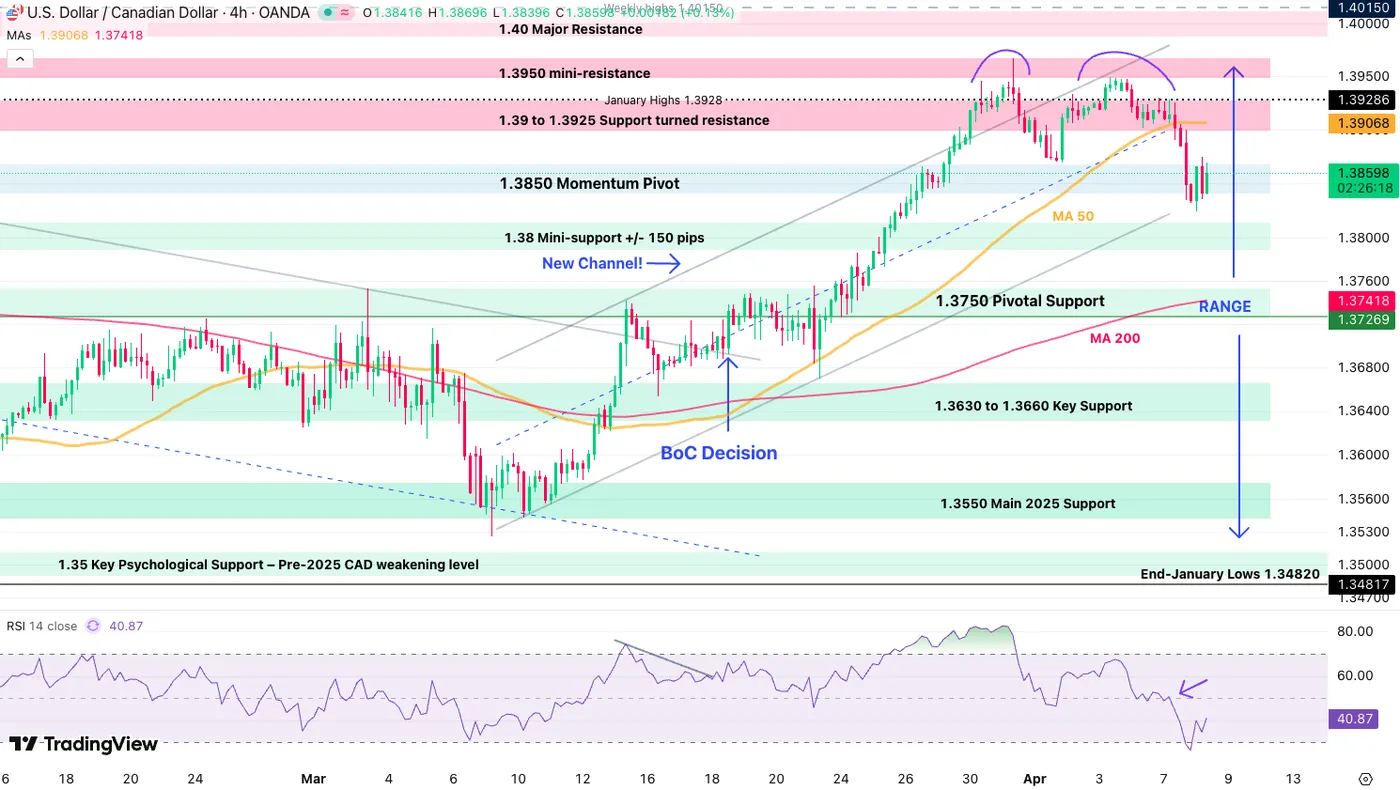
Forming a double top at the extremes of its 1.3550 - 1.3950 large range, the North-American pair has space to correct.
On the immediate outlook, a pullback from oversold levels seems to be forming – Look at the 4H 50-period MA (1.39) which would provide optimal entries if prices get there.
Levels of interest for USD/CAD:
Resistance Levels
- 4H 50-period MA (1.39)
- 1.39 to 1.3925 Support turned resistance
- 1.3950 mini-resistance (Range highs and double top)
- 1.40 Major Resistance
Support Levels
- 1.3850 Momentum Pivot (testing)
- 1.38 Mini-support +/- 150 pips
- 1.3750 Pivotal Support
- 1.3630 to 1.3660 Key Support
- 1.3550 Main 2025 Support (Range Lows)
- October 2024 Support 1.3450 to 1.35
US and Canada Economic Calendar to next Wednesday
US and Canadian Data towards next Wednesday, MarketPulse Economic Calendar
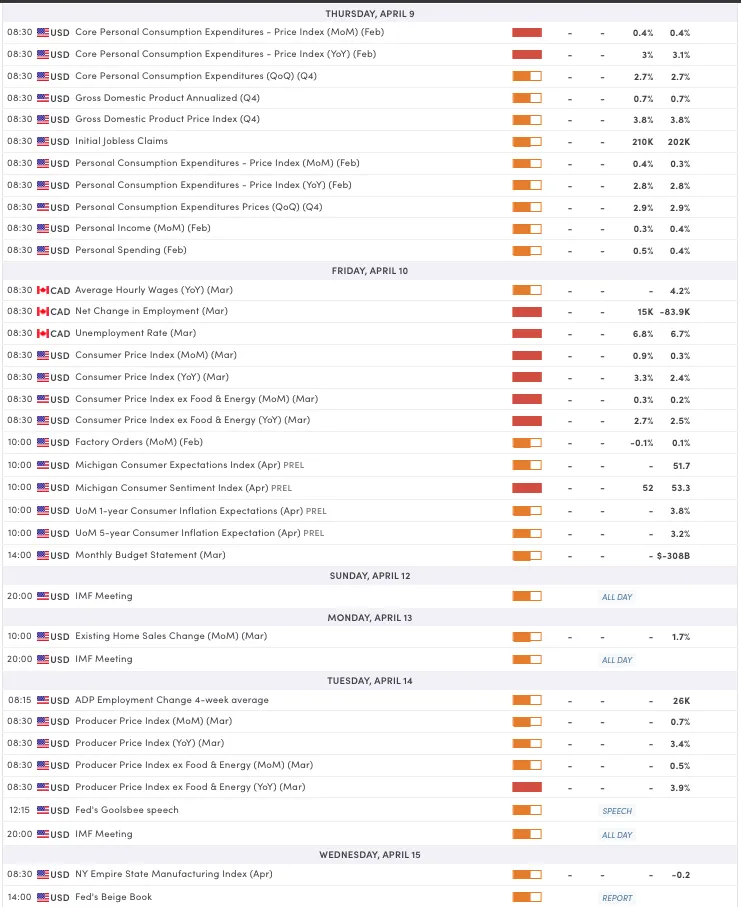
The North American calendar is absolutely packed until next Wednesday.
Friday will however gather the most attention with US CPI, University of Michigan (Inflation expectations!) and Canadian Employment.
With Middle East developments easing, keep a close eye on Ceasefire news and Oil!
Safe Trades!
Sunset Market Commentary
Markets
Not to be the killjoy here, but so many questions remain following the dramatic U-turn in the Middle East conflict. The US and Iran have agreed on a two-week ceasefire, but no one knows when it actually starts. The US said the ceasefire is contingent on the complete, immediate and safe opening of the Strait of Hormuz chokepoint. Iran’s more guarded view suggests a limited reopening on the country’s terms (e.g. a tollbooth) and in coordination with its military. This turns something as economically so critical as the Strait into a political instrument. The longer-term implications of that could/should be a reason for concern. Another open question is Israel’s compliance. It supported the ceasefire but said it doesn’t apply to Lebanon and resumed strikes today. Iran’s 10-point plan that serves as a “workable basis” (for talks that start this Friday) however contains the explicit demand to end the war against “the axis of resistance”, a clear reference to Lebanon’s Hizbollah as well and Iraqi militias and Houthis in Yemen. There’s also huge uncertainty in terms of how quickly the stalled maritime traffic can and wants to resume. A ceasefire won’t resolve anything if shippers are not convinced the threat level has actually receded. It for sure doesn’t help that reports of attacks keep filtering in. While not unusual since ceasefire orders take some time to reach all parties involved, it underscores the fragility of the truce.
It’s a big disclaimer that markets couldn’t care less about. The sigh of relief overwhelmingly dominates the lingering risks & uncertainty. Weeks of rising tensions and a dramatic build-up to what would have been a major escalation also resulted in short covering, strengthening the rip higher. The basis lies in plummeting energy prices. A barrel of Brent oil was trading around $110 yesterday and around $92 today. Dutch natural gas prices collapsed by almost 20%. Risk assets are on a tear. Stocks in Europe surge more than 5% (EuroStoxx50) with American indices adding between 2.5% and 3.5%. Core bonds rally on easing rate hike bets, inflation risks and risk premia in general. Bunds hugely outperform Treasuries. The latter already anticipated something in late US dealings yesterday and another push today lowers yields by another 1.1-4.4 bps in bull steepening fashion. German rates are falling off a cliff with net daily changes varying between 9 and 25 bps. Front-end outperformance follows market implied probability for an April hike falling sharply from 70% yesterday to +/- 25% today. A cumulative 77 bps in hikes in 2026 as of April 7 gets reduced to 50 bps. Intra-European spreads narrow sharply, led by Italy and Greece. UK gilts join the rally. Yields slide 15-24 bps. The US dollar is the main laggard in FX space. The trade-weighted index fell from just south of 100 to 98.6. EUR/USD adds more than a percent to 1.1717, the highest since the Iran war erupted at the start of March. Sterling has the upper hand against USD (GBP/USD towards the March highs around 1.347) and the euro. EUR/GBP loses the 0.87 mark.
News & Views
Hungarian inflation accelerated to 0.4% M/M in March with annual inflation picking up from 1.4% to 1.8%. Both were below consensus estimates (0.8% M/M & 2.2% Y/Y). Electricity, gas and other fuel prices stagnated on a monthly basis but that’s because of the way a temporary utility allowance (Jan 2026) is accounted for. Household energy consumption data are available with a two-month delay so January consumption only enters domestic CPI statistics in March. Food prices declined by 0.1% M/M while services prices were up by 0.2%. Compared to March 2025, prices for electricity, gas and other fuels increased by 4.3%. Food prices stagnated while consumer durable prices were up by 2.7%. Services costs increased by 4.1% Y/Y. The Hungarian central bank (MNB) added that core inflation slowed from 2.1% to 1.9% Y/Y. Core inflation excluding indirect tax effects also decreased to 1.9%. Incoming inflation data was broadly in line with the projection in the March Inflation Report. The Hungarian forint already traded rather strong in the run-up to today’s extremely bullish risk session, eying this weekend’s elections. The forint adds to those gains with EUR/HUF testing the YTD low at 375.
Belgium’s Minister of Defense, Francken, today announced the establishment of a €2bn Defense Fund, a subsidiary of SFPIM International (Belgian public investment institution), to strengthen the country’s defense and security industry. The fund will support companies in scaling up production, strengthen strategic industrial capacity, and help keep jobs and expertise anchored in Belgium.
USD/JPY Mid-Day Outlook
Daily Pivots: (S1) 159.39; (P) 159.71; (R1) 159.94; More...
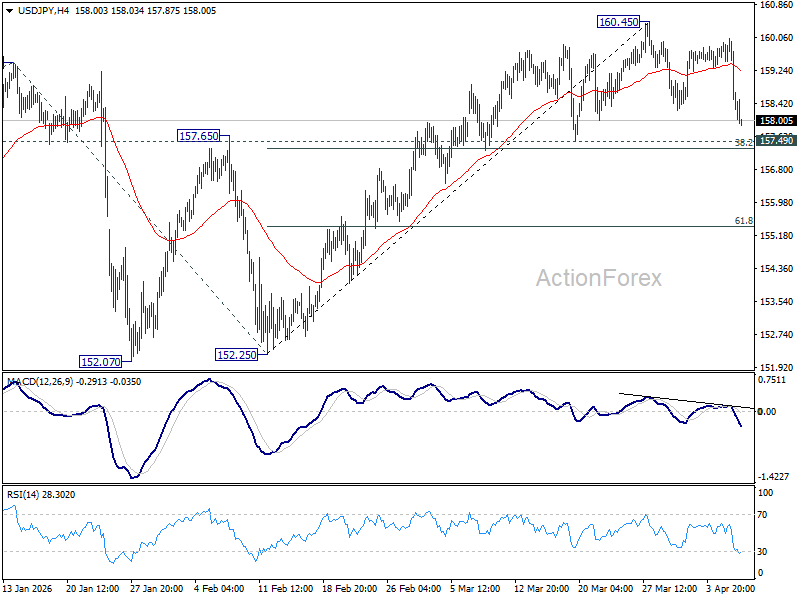
Intraday bias in USD/JPY stays neutral at this point as consolidations continue below 160.45. Further rise is expected as long as 157.49 cluster support (38.2% retracement of 152.25 to 160.45 at 157.31) holds. Firm break of 160.45 will resume the rise from 152.25 to retest 161.94 high. However, firm break of 157.31/49 will bring deeper fall back to 61.8% retracement at 155.38 next.
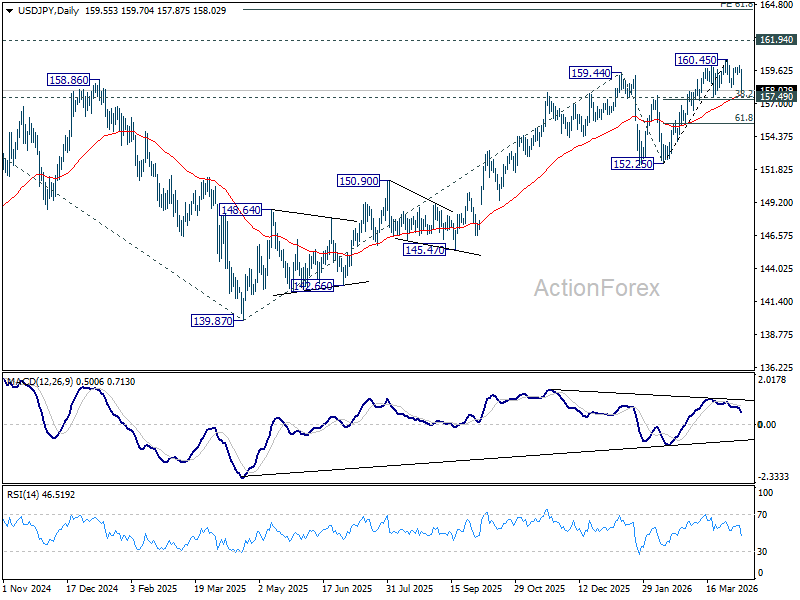
In the bigger picture, outlook is unchanged that corrective pattern from 161.94 (2024 high) should have completed with three waves at 139.87. Larger up trend from 102.58 (2021 low) could be ready to resume through 161.94. This will remain the favored case as long as 55 W EMA (now at 152.97) holds. Firm break of 161.94 will pave the way to 61.8% projection of 102.58 to 161.94 from 139.87 at 176.75.
USD/CHF Mid-Day Outlook
Daily Pivots: (S1) 0.7962; (P) 0.7987; (R1) 0.8002; More….
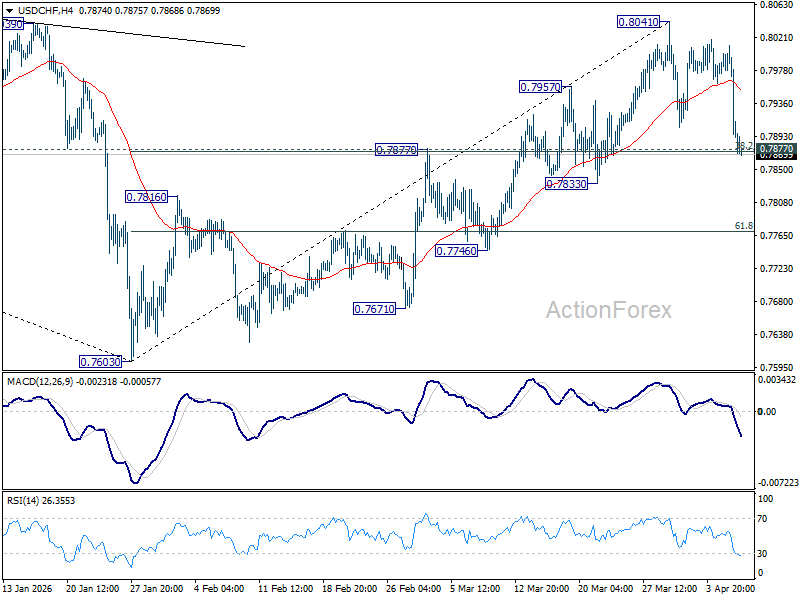
Focus remains on 0.7877 cluster support (38.2% retracement of 0.7603 to 0.8041 at 0.7874) in USD/CHF. Decisive break there will argue that whole rise from 0.7603 as completed, and bring deeper fall to 61.8% retracement at 0.77706 and below. Nevertheless, strong bounce from 0.7874/7 will retain near term bullishness for another rise through 0.8041 at a later stage.
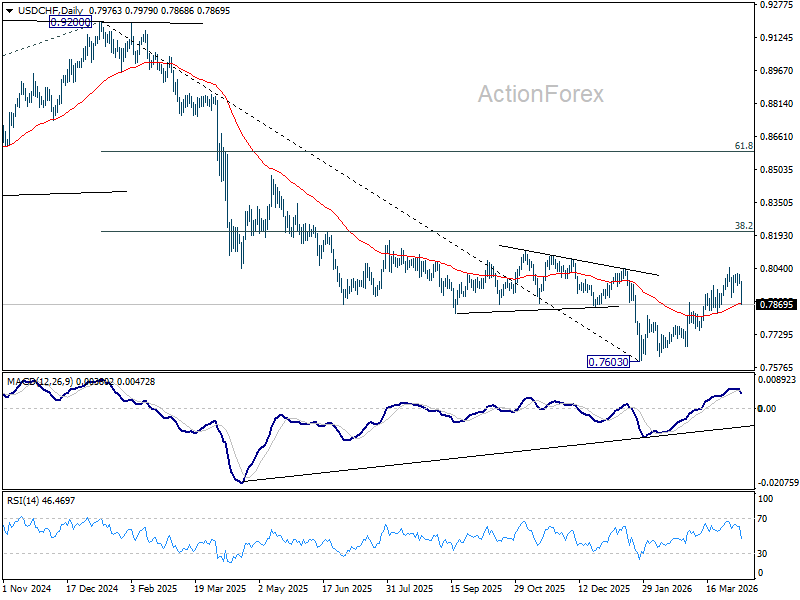
In the bigger picture, rebound from 0.7603 medium term bottom is seen as correcting the fall from 0.9200 only. rejection by 55 W EMA (now at 0.8081) will affirm this case, and setup down trend resumption to 100% projection of 1.0146 (2022 high) to 0.8332 from 0.9200 at 0.7382 at a later stage. Though, sustained break of 55 W EMA will suggest that it's probably correcting the larger scale down trend from 1.0146 (2022 high).
EUR/USD Mid-Day Outlook
Daily Pivots: (S1) 1.1546; (P) 1.1575; (R1) 1.1627; More….
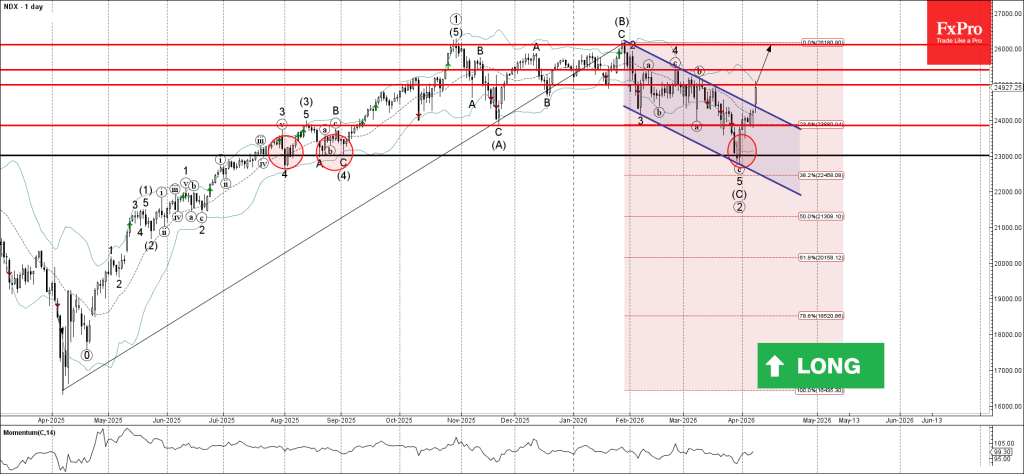
Intraday bias in EUR/USD remains on the upside for the moment. Fall from 1.2081 could have completed as a correction at 1.1408. Further rise should be seen to 61.8% retracement of 1.2081 to 1.1408 at 1.1824. Firm break there will pave the way to retest 1.2081 high. On the downside, below 1.1626 minor support will turn intraday bias neutral and bring consolidations first.
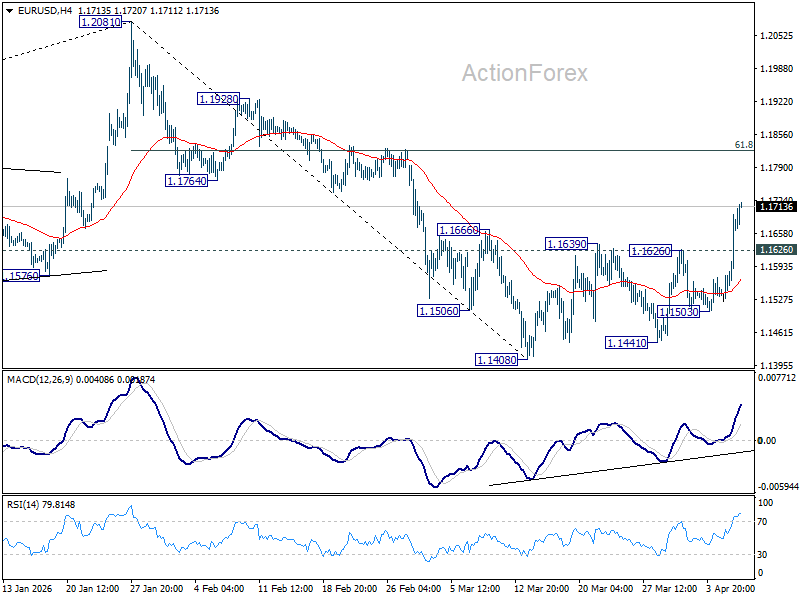
In the bigger picture, the strong support from 38.2% retracement of 1.0176 to 1.2081 at 1.1353 suggests that the pullback from 1.2081 is more likely a corrective move. Strong support was also found in 55 W EMA (now at 1.1505). Focus is back on 1.2 key cluster resistance level. Decisive break there will carry long term bullish implications. Nevertheless, break of 1.1408 support will revive the case of medium term bearish trend reversal.