

Sample Category Title
USD/JPY: Bears Consolidating for Fresh Push Through Daily Cloud Base
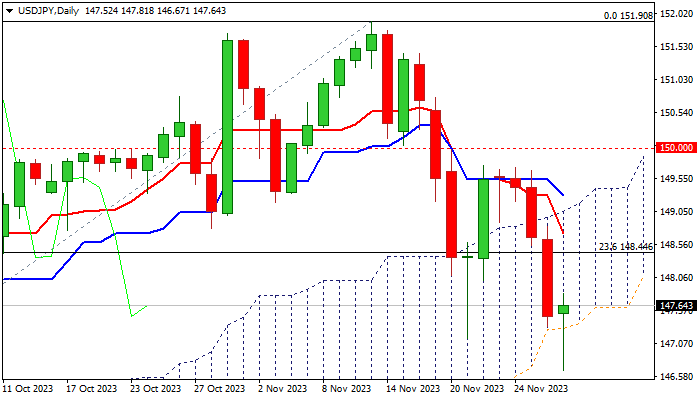
USDJPY bounces from new ten-week low on Wednesday, as bears faced headwinds on probe through the base of daily cloud (147.38) and from 100DMA (146.97).
Fresh jump was sparked by dovish comments from BoJ policymaker, who said that it is still early to talk about exiting from negative rate policy.
However, bounce is likely to be limited and short-lived as dollar remains under pressure from talks of an end of Fed tightening cycle and beginning to cut interest rates, probably in the second quarter of 2024 (growing bets for the first rate cut in May).
Broken Fibo 23.6% of 137.23/151.90 (148.44) should ideally cap upticks and keep near-term bias with bears.
Close below cloud base to reinforce negative near-term stance for extension towards 146.30 (Fibo 38.2) and possible further acceleration on break.
Only lift and close above daily cloud top (149.05) would defer.
Res: 147.81; 148.44; 148.93; 149.05.
Sup: 147.38; 146.67; 146.30; 145.90.
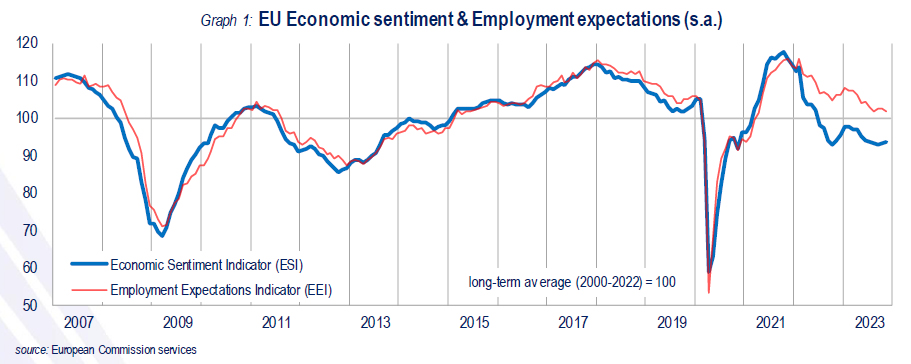
Eurozone economic sentiment rose to 93.8, EU rose to 93.7
Eurozone Economic Sentiment Indicator ticked up from 93.5 to 938 in November. Employment Expectations Indication fell from 102.8 to 102.1 Economic Uncertainty Indicator fell from 22.7 to 22.4.
Eurozone industry confidence fell from -9.2 to -9.5. Services confidence rose from 4.6 to 4.9. Consumer confidence rose from -17.8 to -16.9. Retail trade confidence rose from -7.4 to -7.0. Construction confidence rose from -5.5 to -4.8.
EU Economic Sentiment Indicator rose from 93.2 to 93.7. Employment Expectations Indicator fell from 102.3 to 101.8. Economic Uncertainty Indicator fell from 22.2 to 21.8.
Amongst the largest EU economies, the ESI improved in the Netherlands (+2.9), France (+2.0) and Poland (+1.7), while it eased in Spain (-1.5) and, to a lesser extent, in Germany (-0.5) and Italy (-0.3).
NZD Tired of Flying
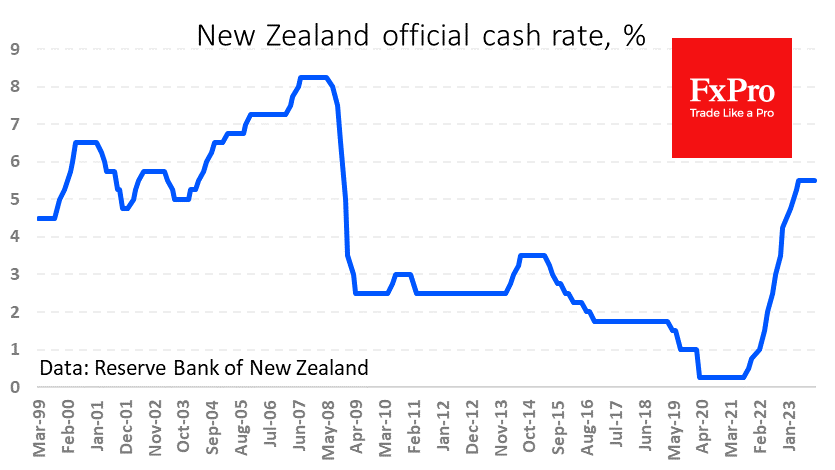
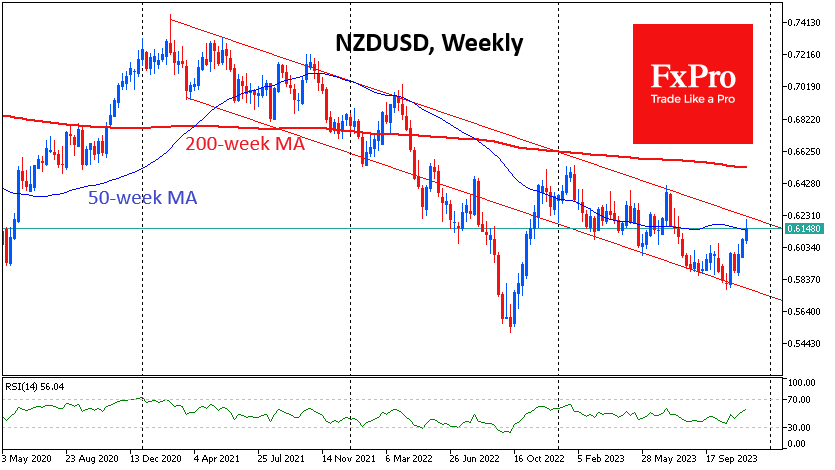
The Reserve Bank of New Zealand left its key rate unchanged at 5.5%, the highest in 15 years, but on hold for six months now. The decision was in line with market expectations. However, the NZDUSD rallied, adding over 1.2% at one point and touching 0.6200, a 4-month high. The buying impulse came from the CB’s vocal preparedness to raise rates if needed.
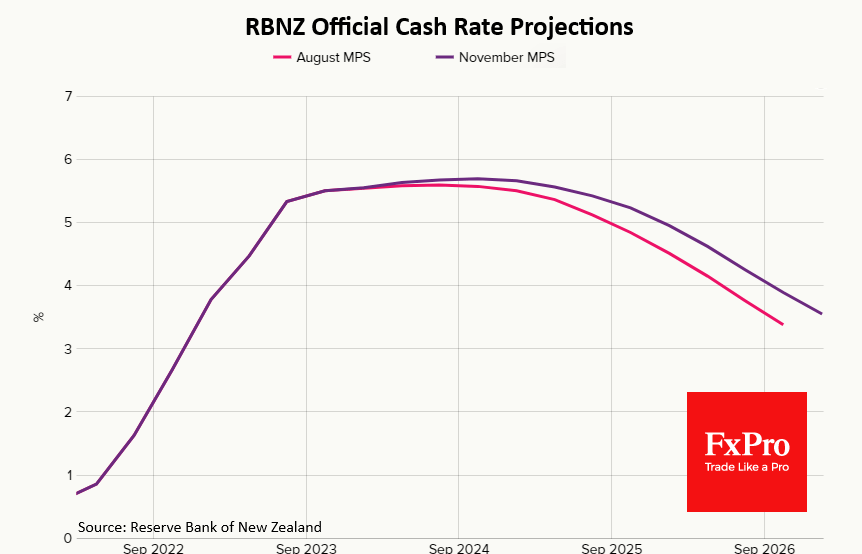
The RBNZ’s rate forecasts became more hawkish, confirming a willingness to act. The committee revised its August forecast expecting a higher rate in a year than it does now, fitting in with the latest Central Bank’s mantra “higher for longer”.
But intraday, the Kiwi’s dynamics changed dramatically. At the height of morning trading in Europe, NZDUSD erased all gains following the publication of the RBNZ decision, pulling back to 0.6150. The New Zealand dollar sell-off so far looks like profit-taking after rallying 5.8% in a fortnight following a weak US inflation report. Sellers showed up after the NZDUSD entered the overbought area on RSI on daily charts.
On the higher timeframes, NZDUSD almost touched the upper boundary of the descending corridor, which the pair has mainly followed since March 2021. This year, the pair have spent a lot of time near the lower boundary, while reversals down from the upper boundary have been swift. During the period of this channel, it took only 5-6 weeks to move from the upper boundary of the range to the lower boundary. If the pattern repeats for the sixth time, NZDUSD could reach the 0.5750 level in early January.
The alternative bullish scenario will become mainstream only if NZDUSD can stay within the short-term growth momentum and overcome the previous local top at 0.6400.
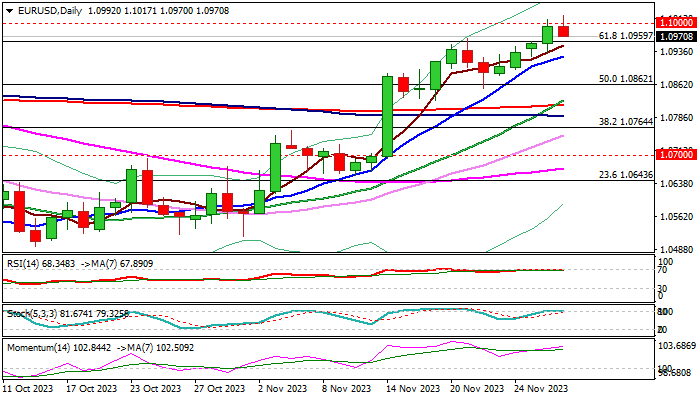
EUR/USD: Bulls Taking Breather After Cracking Psychological 1.1000 Barrier
EURUSD is consolidating under new multi-week high on Wednesday, after bulls cleared pivotal Fibo resistance at 1.0959 (61.8% of 1.1275/1.0448 downtrend) and cracked psychological 1.10 barrier.
The Euro received fresh support from expectations that the Fed is done with rate hikes and rising bets for start of cutting interest rates in the first half of 2024.
As expected, bulls faced increased headwinds at 1.10 zone, with overbought conditions on daily chart, prompting traders to collect some profits.
Technical picture on daily chart is increasingly bullish and supports the pair for further advance, as close above 1.0959 and probe through 1.10, generated fresh positive signals.
Dips should be limited and positioning for fresh push higher, with rising 10DMA (1.0926) to ideally contain and offer better levels to re-enter bullish market for acceleration through 1.10 pivot at test of next target at 1.1080 (Fibo 76.4% of 1.1275/1.0448).
Caution on break and close below 10DMA which would put larger bulls on hold for deeper correction.
German and EU inflation data, due today and Thursday, will be focused for fresh direction signals.
Res: 1.1000; 1.1017; 1.1065; 1.1080.
Sup: 1.0959; 1.0926; 1.0882; 1.0852.
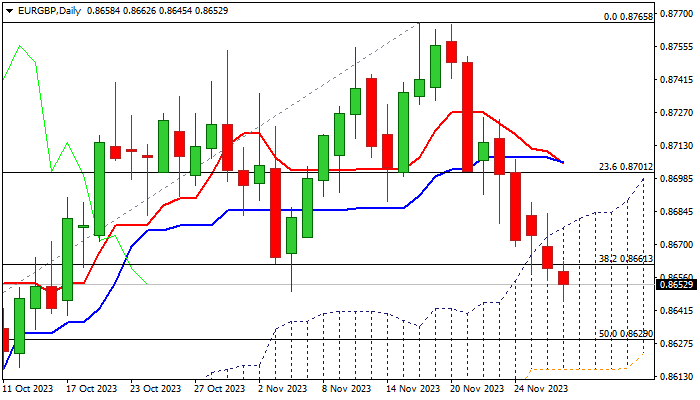
EUR/GBP: Falls to Six-Week Low
EUR/GBP remains in red for the fifth consecutive day and fell to the lowest I six weeks on Wednesday.
The pair is trending lower within thick daily cloud, as break of pivotal supports at 0.8661 (Fibo 38.2% of 0.8492/0.8765) and 0.8650 (Nov 6 former higher low) generated fresh bearish signals and added to negative stance.
Bears eye next targets at 0.8637/29 (100DMA / 50% retracement) which guard more significant daily cloud base (0.8616).
Meanwhile, bears may pause after recent fall as daily studies are oversold, with upticks to be capped by significant barriers at 0.8677 (daily cloud top / 200DMA) and offer better selling opportunities.
Only return and close above cloud top would sideline bears for stronger bounce.
Res: 0.8765; 0.8792; 0.8808; 0.8863.
Sup: 0.8735; 0.8713; 0.8705; 0.8688.
BoE’s Bailey dismisses rate cut speculations again
BoE Governor Andrew Bailey, in an interview, emphasized, "Two percent is our (inflation) target and we will do what it takes to get there."
Bailey also addressed the speculation around interest rate cuts, categorically stating, "We are not in a place now where we can discuss cutting interest rates – that is not happening."
He noted, "We need to see how the final part of the journey down to 2% inflation plays out; we have not seen enough of that journey yet to be confident."
He acknowledged the ongoing economic challenges, including some weakening in economic activity. However, he described this observation as a "realist view" rather than an "ultra-pessimist" outlook, as some critics have suggested.
EUR/USD Analysis: Price Reaches the Level of 1.1000
Before yesterday's trading session, the last time 1 euro was 1.1 USD was in the first half of August.
The growth of the rate was facilitated by the weakening of the dollar, which occurred against the background of the words of Christopher Waller, a member of the Fed Board of Governors, who is known for his hawkish policies. But he has already softened his position.
"I am increasingly confident that policy is currently well positioned to slow the economy and get inflation back to 2 percent," he said yesterday, however, adding that if the decline in inflation continues “for a few more months... three months, four months, five months... we can start reducing the discount rate just because inflation is lower.”
The expected rate cut could mark the beginning of a new period of looser monetary policy. Therefore, financial markets reacted by increasing the prices of currencies relative to the dollar — in particular, the euro reached a psychological level.
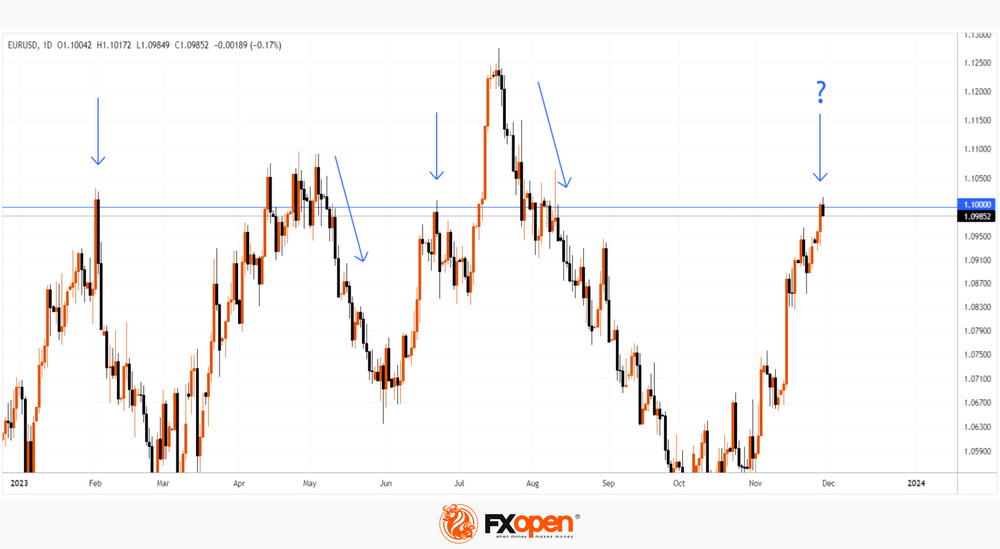
The chart shows that in 2023 the price of EUR/USD interacted with it several times, which caused, among other things, trend reversals. As the arrows show:
→ a bearish reversal took place in February;
→ in May the price entered consolidation, but exited it in a downward direction;
→ the level worked as a resistance in June.
The sharp rise in July above the 1.100 level turned into an equally rapid fall.
Taking into account the above facts, there is reason to assume a scenario in which the level of 1.100 will once again in 2023 resist the appreciation of the euro. Moreover, this is already noticeable, since on Wednesday the price exceeded Tuesday’s high and turned down (a sign of a false bullish breakout).
This article represents the opinion of the Companies operating under the FXOpen brand only. It is not to be construed as an offer, solicitation, or recommendation with respect to products and services provided by the Companies operating under the FXOpen brand, nor is it to be considered financial advice.
EUR/USD Extends Rally While USD/JPY Nosedives
EUR/USD gained bullish momentum above the 1.0930 resistance. USD/JPY is declining and showing bearish signs below the 148.20 level.
Important Takeaways for EUR/USD and USD/JPY Analysis Today
- The Euro remained in a bullish zone and climbed above the 1.0965 resistance zone.
- There is a key bullish trend line forming with support near 1.0975 on the hourly chart of EUR/USD at FXOpen.
- USD/JPY is trading in a bearish zone below the 148.20 and 147.40 levels.
- There is a major bearish trend line forming with resistance near 147.40 on the hourly chart at FXOpen.
EUR/USD Technical Analysis
On the hourly chart of EUR/USD at FXOpen, the pair started fresh above the 1.0900 zone. The Euro climbed above the 1.0930 resistance zone against the US Dollar, as mentioned in the previous analysis.
The pair even settled above the 1.0965 resistance and the 50-hour simple moving average. Finally, it tested the 1.1020 resistance. A high is formed near 1.1017 and the pair is now consolidating gains.
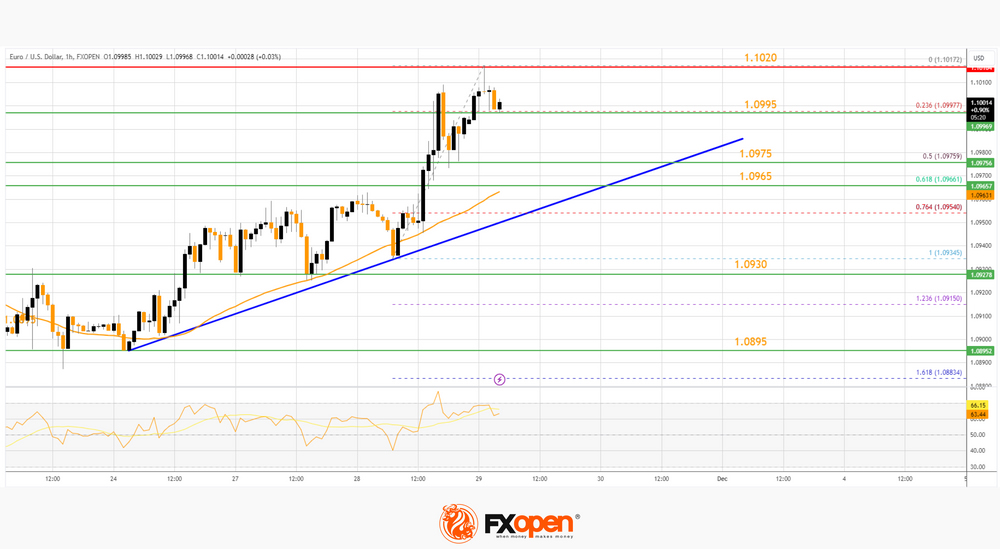
If there is a downside correction, the pair might test the 50% Fib retracement level of the upward move from the 1.0935 swing low to the 1.1017 high at 1.0975. There is also a key bullish trend line forming with support near 1.0975.
The next major support is near the 61.8% Fib retracement level of the upward move from the 1.0935 swing low to the 1.1017 high and the 50-hour simple moving average at 1.0965.
If there is a downside break below 1.0965, the pair could drop toward the 1.0930 support. The main support on the EUR/USD chart is near 1.0895, below which the pair could start a major decline.
On the upside, the pair is now facing resistance near 1.1020. The next major resistance is near the 1.1050 level. An upside break above 1.1050 could set the pace for another increase. In the stated case, the pair might rise toward 1.1140.
USD/JPY Technical Analysis
On the hourly chart of USD/JPY at FXOpen, the pair started a strong decline well above the 148.95 zone. The US Dollar gained bearish momentum below the 148.20 support against the Japanese Yen.
The pair even settled below the 147.40 level and the 50-hour simple moving average. Finally, it broke the 146.80 pivot level. A low is formed near 146.67 and the pair is now showing a lot of bearish signs. Immediate resistance on the USD/JPY chart is near 147.40.
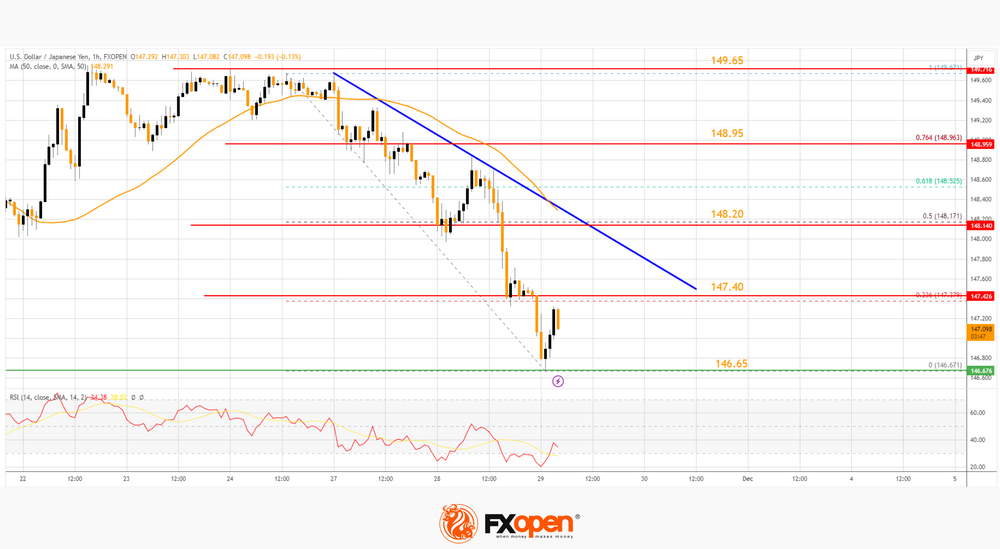
There is also a major bearish trend line forming with resistance near 147.40. The trend line is close to the 23.6% Fib retracement level of the downward move from the 149.67 swing high to the 146.67 low.
The first major resistance is near the 50% Fib retracement level of the downward move from the 149.67 swing high to the 146.67 low at 148.20 and the 50-hour simple moving average.
If there is a close above the 148.20 level and the hourly RSI moves above 50, the pair could rise toward 148.95. The next major resistance is near 149.65, above which the pair could test 150.00 in the coming days.
On the downside, the first major support is near 146.65. The next major support is near the 146.20 level. If there is a close below 146.20, the pair could decline steadily. In the stated case, the pair might drop toward the 145.00 support.
This article represents the opinion of the Companies operating under the FXOpen brand only. It is not to be construed as an offer, solicitation, or recommendation with respect to products and services provided by the Companies operating under the FXOpen brand, nor is it to be considered financial advice.
Crypto Market Back to Test Multi-month High
Market picture
The crypto market added 2.4% in 24 hours to $1.43 trillion and went back to test highs since May 2022. Bitcoin added 3% during this time, Ethereum 2.75%, and Solana was the top performer among the major coins, adding 8.4%. Toncoin was on a back foot with its 0.4% gain.
Bitcoin has been floundering inside the upward range for more than five weeks now. On Monday, the price reversed to the upside from the lower boundary at $36.7K. On Tuesday evening, Bitcoin’s price briefly exceeded $38.4K but pulled back down after failing to find solid ground to accelerate gains.
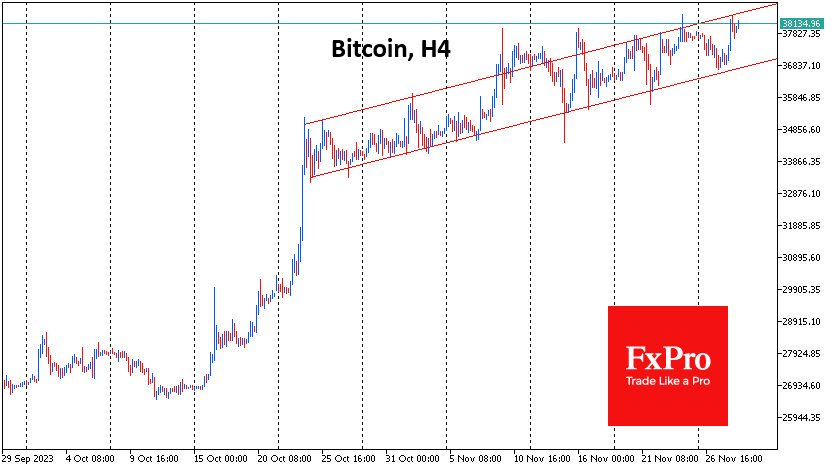
The positive sentiment extends well beyond the first cryptocurrency, as altcoins reversed to growth in a broad front on Tuesday. This could be investors’ reaction to a weakening dollar on expectations of an imminent Fed interest rate cut.
News background
The next bullish trend will come in 2025 when Bitcoin surpasses $100K. And that’s “a pretty conservative estimate,” said 10T Holdings CEO Dan Tapiero.
According to The Wall Street Journal, the SEC is searching hard for evidence that Binance executives may have or may still have a loophole to control assets stored on the Binance.US platform. Zhao has resigned from the Binance.US board of directors, the platform said.
Cardano founder Charles Hoskinson criticised the US SEC for the agency not treating Bitcoin as a security, thereby giving BTC “complete discretion” unlike other cryptocurrencies.
The collapse of cryptocurrency companies does not pose threats to the real economy, according to the Financial Stability Board at the G20.
US presidential candidate Robert Kennedy Jr. spoke out against central bank digital currencies, calling CBDC a threat to citizens’ financial freedom. He said bitcoin is “an elegant solution against CB digital currencies.”
Private cryptocurrencies have already failed fundamental tests for financial services and should eventually disappear, the Monetary Authority of Singapore said.
Gold Surges on the Back of Dovish Fed Comments
On Tuesday, gold (XAU) rose towards 2,050, reaching its highest point in almost seven months. The increase happened primarily due to a significant drop in the U.S. dollar following dovish comments from Federal Reserve (Fed) officials.
Possible effects for traders
The Federal Reserve (Fed) Governor Christopher Waller noted that the existing monetary policy is sufficiently restrictive, hinting at a potential rate cut in the upcoming months. Chicago Fed President Austan Goolsbee also acknowledged progress in tackling inflation. The market now prices in a 44.7% chance that the Fed will begin to ease monetary policy in March 2024 and a 72.8% probability of a rate cut in May. It seems that the Fed sentiment is becoming increasingly dovish. However, XAUUSD may fall sharply if U.S. inflation reports show higher-than-expected numbers. In the short term, the gold market is excessively bullish, looking overextended. Thus, gold is highly sensitive to any negative news, which might have a more disproportional bearish effect on the XAUUSD price than positive data.
XAUUSD rose sharply during the Asian trading hours but pulled back during the early European session. Today, traders should focus on the U.S. GDP Growth Rate report at 1:30 p.m. UTC. Lower-than-expected figures will probably push XAUUSD towards 2,052. However, the bullish trend might pause if the numbers exceed expectations. 'Spot gold may extend gains into a range of $2,059–$2,069 per ounce, driven by a powerful wave 3,' said Reuters analyst Wang Tao.